Biomedical Journal of Scientific & Technical Research (BJSTR) is a multidisciplinary, scholarly Open Access publisher focused on Genetic, Biomedical and Remedial missions in relation with Technical Knowledge as well.
Author: biomedicalopenaccessjournals
The only motto of Biomedical Journal of Scientific & Technical Research (BJSTR) Publishers is accelerating the scientific and technical research papers, considering the importance of technology and the human health in the advanced levels and several emergency medical and clinical issues associated with it, the key attention is given towards biomedical research. Thus, asserting the requirement of a common evoked and enriched information sharing platform for the craving readers.
BJSTR is such a unique platform to accumulate and publicize scientific knowledge on science and related discipline. This multidisciplinary open access publisher is rendering a global podium for the professors, academicians, researchers and students of the relevant disciplines to share their scientific excellence in the form of an original research article, review article, case reports, short communication, e-books, video articles, etc.
PAI mutation 4G/5G- Coagulopathy Risk Factor for Stroke or Multiple Sclerosis
Introduction
Thrombophilia is defined as a predisposition to abnormal clot formation. It is a polygenic disorder with variable expressivity. A predisposition to thrombosis may result from genetic factors, acquired changes in the clotting mechanism, or more commonly, an interaction between them. Homozygous carrier or the combination of two or more heterozygous abnormal factors for thrombophilia can lead to thrombotic disorders in youngers. Homozygous carring of the PAI mutation, 4G/4G is clinical significance for thrombotic events. Increased plasma activity of PAI-1 leads to reduced fibrinolytic activity and increased risk of arterial and venous thrombosis. Plasminogen activator inhibitor-1 (PAI-1) is the primary tissue-type plasminogen activator (tPA). Decreased fibrinolytic capacity due to increased plasma levels of PAI-1 plays an important role in the pathogenesis of thrombotic events [1]. Individuals who are homozygous for the 4G allele have increased plasma PAI-1 concentrations compared to those with the 5G allele [2]. This polymorphism has been studied extensively. In some studies, the prevalence of the 4G allele has been found to be higher in coronary artery disease, meningococcal septic shock, osteonecrosis, severe preeclampsia, pulmonary thromboembolism (PTE) [1,3,4]. The SERPINE1 gene is responsible for the production of PAI-1. PAI-1 is involved in hemostasis by inhibiting the action of plasminogen activators. These proteins, including urokinase plasminogen activator (u-PA) and tissue-type plasminogen activator (t-PA), convert plasminogen to its active form, plasmin. Plasmin is involved in fibrinolysis. By inhibiting the conversion of plasminogen to plasmin, PAI-1 prevents fibrinolysis. The 4G allele is associated with higher plasma PAI-1 activity.
Elevation of plasma PAI-1 activity leads to decreased fibrinolytic activity and increased risk for arterial and venous thrombosis [5]. In different populations, plasma levels of the PAI-1 antigen are associated with the 4/5 guanosine (4G/5G) polymorphism in the promoter region of the PAI-1 gene [6]. Homozygous carriers of the 4G allele have the highest levels of PAI-1 [7,8]. In multiple sclerosis (MS), malfunction of the plasminogen activation system (PAS) and blood brain barrier (BBB) disruption are pathological processes that might lead to an abnormal fibrin(ogen) extravasation into the parenchyma. Fibrin(ogen) deposits, usually degraded by the PAS, lead an autoimmune response and following demyelination. However, the PAS disruption is not well understood in this disorder [9,10]. Multiple sclerosis (MS) is a demyelinating disease of the central nervous system (CNS) because of genetic and environmental factors.
Recently, evidence for role of fibrinolysis in the pathogenesis of MS were found. Proteolysis could be a possible mechanism which affect the breakdown of the blood-brain barrier. Extracellular proteolytic enzymes could be considered as important factors in multiple sclerosis [11]. Plasminogen activators/plasmin (PA) system is involved in fibrinolysis and extracellular proteolyses. Tissue-type plasminogen activator (t-PA) and its inhibitor (PAI-1) is a part of PA system. Fibrinolytic potential in demyelinating MS lesions is reduced because of formation- t-PA and PAI complexes [12]. The reduced level of t-PA because of formation of the t-PA/PAI-1 complexes reduce the ability of t-PA receptors to produce plasmin, which reduces the fibrinolytic capacity in MS lesions, which result in increased axonal fibrin involvement and neurodegeneration [13,14].
Materials and Methods
Materials
Healthy control group, group of patients with ischemic stroke, group of patients with MS.
Method 1
(I) MRI
(II) Laboratory tests for thrombophilia,
(III) Neurological exams.
Statistical Analysis
Statistical methods: chi square, standard deviation, statistical significance p<0.05.
Results
Result A
We present a prospective clinical trial of 54 patient with multiple sclerosis, 69 healthy controls and 101 patients with ischemic stroke. A total of number of 101 patients with ischemic stroke under 50 years were screened, 67 were examined for PAI mutation. From all patients 32 were females, 69 were males (Table 1). The average age was 42.27 years (min 18, maximum 50 years, SD ± 6.632). The healthy control group consists of 44 women and 25 men, with a mean age of 40.45 years (SD±8.23) (Table 2). In 40.3% (27) of experienced stroke patients were heterozygous carriers of the PAI 4G/4G mutation 40.3% (13). Homozygotes for the 4G/4G mutant allele were 32,84 % (22) of patients, and homozygotes for the normal allele were 26.9% (18) (Table 3). Regarding thrombophilia factors, homozygous carrier of the PAI mutation 4G/4G variant was found to increase the chance of stroke 3.00 times [OR=3.00; CI: (0.70-12.93)]. In central nervous system, PAI-1 is produced predominantly by astrocytes and its main function is to suppress t-PA [15]. We conducted a study in patients with a proven diagnosis of multiple sclerosis and healthy controls regarding a genetic polymorphism in the Pai-1 gene.
Table 1: Patients with Ischemic Stroke.
Note: n- Sample size.
Table 2: Healthy control group.
Note: DF- Degrees of freedom, t- t test, n- sample size.
Table 3: Experienced Stroke Patients with Examined PAI mutation.
Note: n- sample size.
Result B
Тhe examined patients with multiple sclerosis were 54, with the majority of female – 39, and male – 15. The average age was 32.8 years (min 18, maximum 50 years) with a standard deviation of 10.5, as it is presented in (Table 4). It is noteworthy that the frequency of homozygotes for the mutant allele of the PAI-1 gene in patients with multiple sclerosis is significantly higher than in healthy controls. We detected PAI 4G/4G in 24/54 MS patients, compared to only 3/69 in healthy controls. The results are statistically significant as chi-square is 28.4268 and p-value is < 0.00001 as presented in (Table 5) and Graphic 1. When chi-square statistic is performed with Yates correction, the value is 26.1346 and the p-value is still < 0.00001. We compared the groups of patients with stroke and multiple sclerosis to evaluate prevalence of PAI-1 mutation in both cohorts. We found that no matter of slightly higher count of PAI-1 homozygous carriers in patients with multiple sclerosis, the chi-square is 1.71 and the p-value is 0.190985, which is not significant. The chi-square statistic with Yates correction showed similar result- 1.2528 and the p-value is 0.263011, which is not significant (Table 6).
Table 4: Comparison of Age Between Controls and Patient Group.
Table 5: Comparison and Analysis of PAI 4G/ 4G Between Controls and Patient Group with MS.
Figure 1
Table 6:
Discussion
Although ischemic stroke is a vascular disorder and multiple sclerosis is autoimmune inflammation disease, disfunction of the plasminogen activation system and blood brain barrier disruption are common pathological processes that might lead to an abnormal fibrinogen extravasation. These deposits lead to an autoimmune response and following demyelination or atherosclerosis. A couple of previous trials showed the importance of PAI-1, resulted with overexpression of reactive astrocytes leading to dys fibrinolysis in MS and thrombogenesis in patients with ischemic stroke [11]. According to our study, PAI-1 mutation could be a risk factor for the development of multiple sclerosis (p-value < 0.00001) and ischemic stroke at a young age (p<0.05), and the difference between the two groups and healthy controls is statistically significant. However, between the ischemic stroke and multiple sclerosis patient groups, the difference in PAI-1 mutation rates was not statistically significant(p-value-0.190985). All the conventional risk factors reported to be associated with MS such as reduced physical activity, smoking, endothelial dysfunction, platelet activation, thrombophilia, and hyper-homocysteine are proved pro-thrombotic conditions [12]. A lot of evidence supports a significant existence of local and systemic thrombotic events in MS for both its inflammatory and coagulant components. An assessment of risk factors is necessary for patients with ischemic stroke. At a young age genetic factors play a leading role in most cases of thrombotic event. The correct determination of risk factors for cerebrovascular accidents, including the presence of thrombophilia, plays a role in the effective prevention.
Conclusion
PAI mutation could play a role as a risk factor for development of demyelinating disease like MS. Further studies should be performed to evaluate the role of PAI mutation in MS. In the future examination of patients with MS for PAI mutation could play role for the choice of treatment and prevention of invalidation of these patients.
Omicron (B.1.1.529): Variant of Concern –A Mini Review
Introduction
Different variants of severe acute respiratory syndrome coronavirus 2 (SARS‐CoV‐2) have been identified since the first coronavirus disease 2019 (COVID‐19) infection appeared in December 2019. Until November 2021, the Delta variant was designated as variant of concern (VOC) because of different characteristics [1]. According to the Centers for Disease Control and Prevention (CDC), the variant responsible for increased transmissibility, severe disease course, reduced effectiveness of treatments, and many other alarming factors is designated as the VOC [2]. On 26 November 2021 the World Health Organization (WHO) Technical Advisory Group on SARS-CoV-2 Virus Evolution named the B.1.1.529 COVID-19 variant, first detected in Botswana and South Africa, as the Omicron variant of concern [3]. This variant carries an unusually high number of mutations, 32, on the spike (S) protein, the main antigenic target of antibodies generated by either infections or vaccination. The B.1.1.529 COVID-19 classification was based on a rapid increase in cases in South Africa, coinciding with an increase in detections of Omicron, a number of concerning mutations and early evidence suggesting an increased risk of reinfections.
The overall threat posed by Omicron largely depends on four key questions:
i. How transmissible the variant is;
ii. How well vaccines and prior infection protect against infection, transmission, clinical disease and death;
iii. How virulent the variant is compared to other variants; and
iv. How populations understand these dynamics, perceive risk and follow control measures, including public health and social measures (PHSM) [4].
Based on the currently available evidence, the overall risk related to Omicron remains very high. Omicron has a significant growth advantage over Delta, leading to rapid spread in the community with higher levels of incidence than previously seen in this pandemic. Despite a lower risk of severe disease and death following infection than previous SARS-CoV-2 variants, the very high levels of transmission nevertheless have resulted in significant increases in hospitalization, continue to pose overwhelming demands on health care systems in most countries, and may lead to significant morbidity, particularly in vulnerable populations [4]. The identification of Omicron as a variant of concern (VOC) by the World Health Organization (WHO) has triggered countries around the world to put in place travel restrictions and precautionary measures. Therefore this work aims to review Omicron variant impacts, transmissibility, viral infectivity, genomics and efficacy of existing vaccines.
Genomics of Omicron Variant
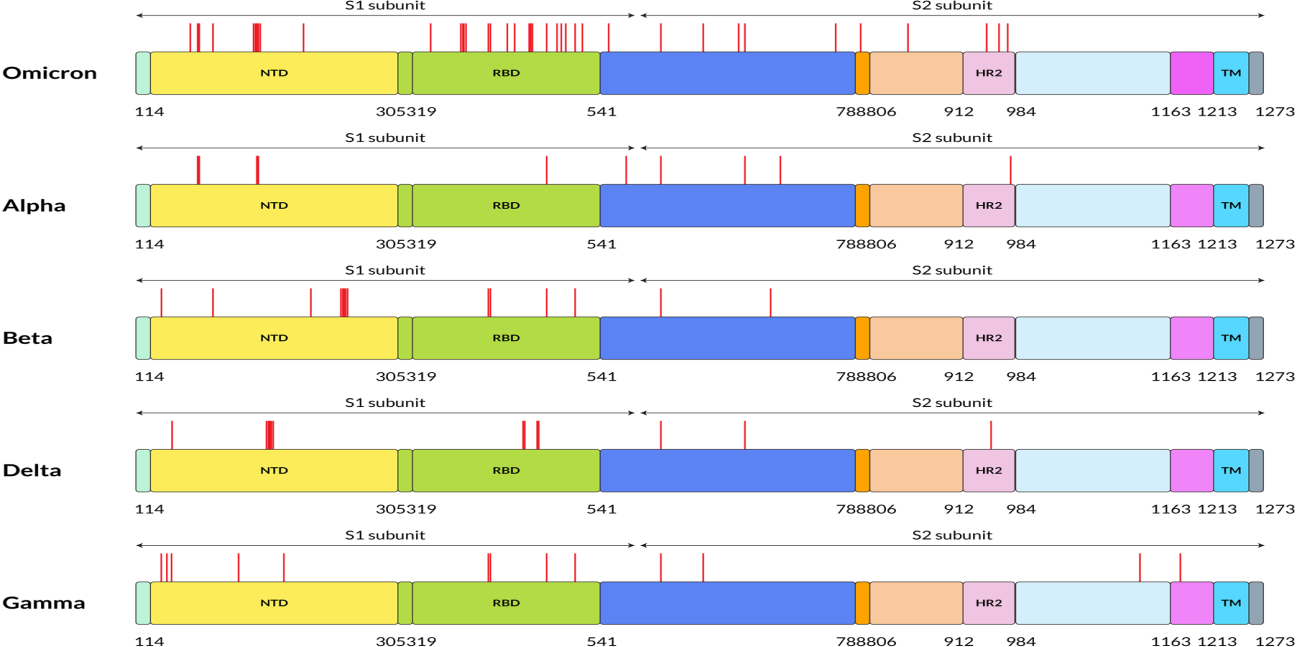
The unique genome features of the Omicron variant make it the most special SARS-CoV-2 variant to date. The genome constitutes 18261 mutations from which more than 97% mutations are present in the coding region, and the remaining 558 are detected in the extragenic region [5]. Mutations in the coding region are 2965 indels and non-synonymous, and synonymous singlenucleotide polymorphisms (SNPs) mutations are 11 995 and 2743, respectively [5]. Thirty mutations have been found within the spike proteins mostly located at the receptor‐binding domain (RBD) of the spike protein of the Omicron variant [6]. The excess number of nonsynonymous mutations in the Spike gene implies that the Omicron variant might evolve under selection pressure, which may come from antibodies or adaptation to new hosts. Reports show that there are three other deletions and one insertion mutation outside the spike protein (Figure 1). Preliminary data analyzed from the Global Initiative on Sharing All Influenza 101 Data (GISAID) showed that NTD contains 11 mutations, including six deletions and one insertion, with mutations N211 and ins214EPE being unique [7]. Interestingly, some of the mutations were already found in the previous VOC that helps in neutralizing antibodies [8,9]. Five different variants of SARS‐CoV‐2 have been considered VOC at different times [10]. Investigations performed by epidemiologists in South Africa identified the mutational data that manifests some of the concerning mutations (N501Y, D614G, K417N, and T478K) along with new mutations present in the Omicron variant, which increased the overall risk of reinfection, partial resistance to existing vaccines [10].
Figure 1: Five SARS-CoV-2 variants have different amino acid mutation locations on their S proteins. On this figure, red lines indicate the mutation locations on the S protein of SARS-CoV-2 at the specified positions. FP stands for fusion peptide, and pink color specifies HR2: heptapeptide repeat sequence 2, TM: transmembrane domain, which showed in sky shade, NTD: N-terminal domain shown in yellow and green color denotes RBD: receptor-binding domain.
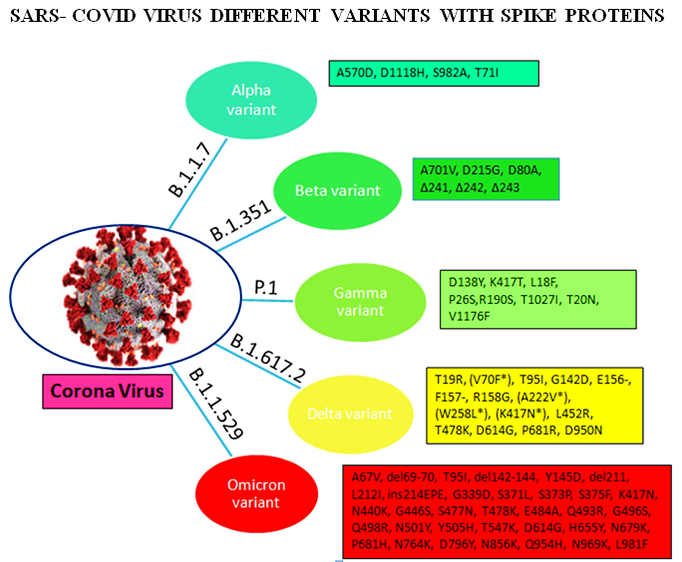
Omicron variant is known to boost affinity for ACE2 receptors found on the surface of various human cells, including the lungs [11]. Even though Wuhan‐Hu‐1 has 1273 amino acids, the Delta variation has 1271, and the Omicron variant has 1270, both contain fewer residues than the wild‐type due to sequence loss [12]. Genome analysis by Kandeel et al. reported that the Omicron variant of SARS‐CoV‐2 forms a new monophyletic clade [13]. On the other hand, Wang et al. showed that the Omicron variant of SARSCoV‐ 2 evolved from the 20B clade and formed two sub-clades [14]. On the other hand, many of the variants were observed with the different protein sequences of the genome. The alpha (B.1.1.7), beta (B.1.351), gamma (P.1), delta (B.1.617.2), and omicron (B.1.1.529) variants are among the variants. These variants have different protein sequences as shown in Figure 2.
Figure 2: Different variants with their spike proteins
Transmissibility and Infectivity of Omicron variant
There is still a scarcity of sufficient essential data regarding the infection rate to analyze the transmissibility of the new heavily mutated Omicron variant. However, analysis from the early data of South Africa manifested that the Omicron variant can spread way more easily from person to person, though experts could not draw any conclusion within this short period [15]. The concern of Omicron variant transmissibility increases as it spreads worldwide within a few days, and cases have been increasing dramatically [16]. According to the report of CDC, a 2.5% increasing capacity of Omicron variant has been observed in the US within 2 weeks. However, in New York/New Jersey area, the infection rate is around 13%. On the other hand, in Britain, Omicron variant cases doubled every 2–3 days [15]. The infection rate of the Omicron variant in South Africa is increasing faster than any other country’s three previous waves. On November 30, the number of cases was 10.3%, shifting to 16.5% within two days. Surprisingly, on December 2 and 3, cases were 22.4% and 24.3%, respectively [17]. When the linear regressions of each pseudo virus were compared to the wild type over the entire range, it was discovered that while the Gamma variant had similar infection rates to the wild type, the Beta variant had less infection, and Delta was nearly twofold more efficient at infecting target cells. Infection rates were four times higher in the Omicron variant than in the wild type and twice as high in the Delta variant. These findings indicate that spike sequence influences infectivity, with the Omicron variant displaying more effective ACE2‐mediated infection than the wild type or other variant strains [18].
The infectivity of SARS-CoV-2 is mainly determined by the binding affinity of the ACE2 and RBD complex, although the furin cleavage site plays a crucial role as well [11]. Omicron has three mutations at the furin cleavage site and 15 mutations on the RBD, suggesting a significant change in its infectivity. Due to natural selection, the virus enhances its evolutionary advantages at the RBD either by mutations to strengthen the ACE2-RBD binding affinity or by mutations to escape antibody protection [12]. Since the virus has optimized its infectivity in human cells, one should not expect a dramatic increase in the viral infectivity by any single mutation. An effective infection pathway is for the virus to have multiple RBD mutations to accumulatively enhance its infectivity, which appears to be the case for Omicron. Furthermore, the new variant Omicron gives a false negative result in polymerase chain reaction tests because of the “S gene target failure,” which paves the way of spreading the infection at a higher speed worldwide [19]. Numerous factors can influence the high transmissibility of the Omicron variant. Genome sequenced data of the Omicron variant demonstrated more than 30 mutations in the spike protein by which the SARS‐CoV‐2 protein recognizes host cells [20]. Analysis of these mutations data indicates the chance of increased transmission by evading the immune response [21]. The N501Y mutation increases the binding affinity with the ACE2 receptor, which is a major influencer of increased transmission, and in combination with Q498R, the binding affinity gets stronger, and the Omicron variant gets easy access into the host [21]. Moreover, the risk of reinfection of previously COVID‐19 infected patients with the Omicron variant is very evident, indicating higher transmissibility [8]. Omicron variant mutations H655Y and N679K are present near the furin cleavage site (FCS) and can increase spike cleavage, making the virus more contagious [22,23]. On the other hand, P681H can multiply transmissibility by increasing the spike protein cleavage [24].
Disease Severity
Globally, there has been a 4% increase in the number of new deaths from in week 2 (10 – 16 January 2022) compared to the previous week, with highest increases in the South-East Asia Region (12%) and the Region of the Americas (a 7% increase). Data on case severity (including hospitalization, need for oxygen, mechanical ventilation, or deaths) are increasingly becoming available, improving our understanding of the impact of Omicron on severe cases, hospitalization and deaths. Surveillance trends from most countries show a decoupling between incident cases and hospitalizations in many countries, with proportionally lower incidence of hospitalization, given the level of community transmission, than what was observed with other variants. This decoupling appears to be driven partially by a lower intrinsic severity of Omicron compared to Delta, as well as by more preserved vaccine effectiveness against severe disease than against infection. Several studies have looked at the risk of hospitalization and severe disease with Omicron compared to Delta. The most recent analysis from the United Kingdom Health Security Agency with the Medical Research Council (MRC) Biostatistics Unit, University of Cambridge showed a 47% reduction in the risk of presentation to emergency care or hospital admission with Omicron compared to Delta and 66% reduction in the risk of admission from emergency departments [25]. A report by Imperial College London on 22 December 2021 [26] calculated a 41% reduced risk of a hospitalization resulting in a stay of one or more nights. Similarly, using a record linkage approach [27], a study in South Africa found that laboratoryconfirmed SARS-CoV-2 infected individuals with SGTF, as a proxy for Omicron, had lower odds of severe disease.
COVID-19 Vaccine Efficacy on Omicron Variant
The Omicron variant of SARS‐CoV‐2 was identified from the COVID‐19 vaccinated patients, suggesting the new variant’s immune invasion and demanded updated vaccines [28]. Saxena et al. analyzed the mutations reported in the RBD of the spike of Omicron variant of SARS‐CoV‐2 and hypothesized that currently, available entry inhibitors might not be effective for emerging variants [29]. The heavy mutation in the spike protein of the Omicron variant is related to increased infectivity and antibody evasion [30]. In SARSCoV‐ 2 convalescent or vaccinated people, the amount of neutralizing epitopes targeted by polyclonal antibodies is a significant predictor of the genetic barrier to viral escape. Single monoclonal antibodies are susceptible to escape mutations, but combinations targeting non-overlapping epitopes are more resistant [31]. Surprisingly, Omicron variant neutralization was undetectable in the majority of vaccines [7]. The computational approach also demonstrated that antigenic properties of the Omicron variant are ominous and correlated with its mutations [32]. Although various investigations have been performed to create effective vaccines, the emergence of new VOCs has raised concern over the efficacy of neutralizing antibodies induced by COVID‐19 vaccines as the Omicron variant has already infected vaccinated individuals in South Africa, Hong Kong, and many other countries [30,33,34].
The potential impact of the COVID‐19 vaccine is still being analyzed against this new variant. Two BNT vaccinations, which can provide more than 90% protection against serious disease when infected with the Delta variant, maybe significantly less effective against the Omicron type of SARS‐CoV‐2 [7]. However, the effect of COVID‐19 vaccines against the previous VOC, such as Delta, manifested the vaccine’s potential in reducing severe disease and death [35]. Moreover, multiple Delta transmissions from and between completely vaccinated persons were confirmed using genomic and epidemiological data [36]. As vaccine‐induced immunity is targeted through the spike proteins of the virus, heavily mutated Omicron variant spike protein is capable of reducing the neutralization activity of sera of vaccinated individuals that indicated less protection from Omicron variant [21].
Various Impacts of Omicron Variant
The current evidence on the potential impact of the Omicron variant reported by World Health Organization is explained briefly [4].
Impact on Epidemiology: As of 20 January 2022, the Omicron variant had been identified in 171 countries across all six WHO Regions. Omicron has a substantial growth advantage over Delta, and it is rapidly replacing Delta globally. There is now significant evidence that immune evasion contributes to the rapid spread of Omicron. Data on clinical severity of patients infected with Omicron are increasingly available. Epidemiological trends continue to show a decoupling between incident cases, hospital admissions and deaths, compared to epidemic waves due to previous variants. This is likely due to a combination of the lower intrinsic severity of Omicron, as suggested by a number of studies from different settings, and that vaccine effectiveness is more preserved against severe disease than against infection. However, high levels of hospital and ICU admission are nevertheless being reported in most countries, given that levels of transmission are higher than ever seen before during the pandemic. This is particularly important given that current evidence about severity and hospitalization has largely been shared from countries with high levels of population immunity, and there remains uncertainty about the severity of Omicron in populations with both lower vaccination coverage and lower prior exposure to other variants.
Impact on Diagnostics and Testing: The diagnostic accuracy of routinely used PCR and the WHO emergency use listing (EUL) approved antigen-detection rapid diagnostic tests (Ag-RDT) assays does not appear to be significantly impacted by Omicron. Most Omicron variant sequences reported include a deletion in the S gene, which can cause an S gene target failure (SGTF) in some PCR assays. As a growing minority of publicly shared sequences (including all BA.2 sub-lineage sequences) lack this deletion, using SGTF as proxy marker to screen for Omicron will miss Omicron lineages lacking this deletion.
Impact on Immunity: Current evidence consistently shows a reduction in neutralizing titres against Omicron in individuals who have received a primary vaccination series or in those who have had prior SARS-CoV-2 infection. In addition, increased risk of reinfection has been reported by South Africa, the United Kingdom, Denmark, and Israel. There is a growing body of evidence on vaccine effectiveness (VE) for Omicron, with data available from 15 observational studies from five countries (the United Kingdom, Denmark, Canada, South Africa, and the United States of America), evaluating four vaccines (mRNA vaccines, Ad26.COV2.S, and AstraZeneca-Vaxzevria). Available preliminary data should be interpreted with caution because the designs may be subject to selection bias and the results are based on relatively small numbers. Early data suggest that the effectiveness of studied vaccines is significantly lower against Omicron infection and symptomatic disease compared to Delta, with homologous and heterologous booster doses increasing vaccine effectiveness. Despite this, follow-up time after booster doses for most studies is short, and there is evidence of waning of VE in months following booster doses. VE estimates against severe outcomes, usually defined as hospitalization, are lower for Omicron than Delta, but mostly remain greater than 50% after the primary series and improve with a booster dose to above 80%. There are no effectiveness data for several vaccines, particularly the inactivated vaccines.
Impact on Host Tropism, Virus Fitness and Pathogenicity: Preliminary evidence suggests a potential shift in tropism of the Omicron variant towards the upper respiratory tract, as compared to Delta and the wild type (WT) virus that have a tropism for the lower respiratory tract. There is also evidence of less severe pathogenicity in the Syrian hamster (M. auratus) model, but this needs to be confirmed by peer-reviewed evidence and larger studies.
Impact on Therapeutics and Treatments: Therapeutic interventions for the management of patients with severe or critical Omicron-associated COVID-19 that target host responses (such as corticosteroids, and interleukin-6 receptor blockers) are expected to remain effective. However, preliminary data from nonpeer reviewed publications suggest that some of the monoclonal antibodies developed against SARS-CoV-2 may have impaired neutralization against Omicron. Monoclonal antibodies will need to be tested individually for their antigen binding and virus neutralization, and these studies should be prioritized. Preliminary in vitro data suggests that antivirals retain activity against Omicron.
Conclusion
Omicron (B.1.1.529) which has been designated as variant of concern (VOC) by World Health Organization (WHO) is distinct from the previous variants of SARS-CoV-2 (Alpha, Beta, Gamma, and Delta). Hence, the scientific community is searching for the impact of this new variant on the SARS-CoV-2, such as transmissibility, disease severity, diagnostic method, efficiency of existing vaccines and other COVID-19 protocols. This mini review has provided the latest data on the genomics, transmissibility and infectivity, diseases severity, vaccine efficacy and the current evidences on the variant impacts on epidemiology, diagnostics and testing, immunity, host tropism, virus fitness and pathogenicity and therapeutics and treatment. Meanwhile, the previous recommendations to tackle the COVID‐19 pandemic need to be maintained worldwide along with the newly improvised directions, such as genome sequencing of all the samples, maintaining social distance, continuing vaccination for everyone, and isolating the Omicron variant positive patients in a different place. WHO recommended countries strengthen surveillance and adopt necessary actions since the Omicron variant has been designated as a VOC.
The Challenge Management of a Child with Cervical Spinal Cord Injury with Ultrasound Assessment of Respiratory Muscle: A Pediatric Case Report
Introduction
Traumatic spinal cord injury (SCI) is commonly encountered and managed in the emergency department and the intensive care unit (ICU). More than 80% of traumas are caused by falls from height and road traffic accidents [1,2], and approximately 50% of the SCI are sustained at the cervical level that leads to severe high-level quadriplegia. Many of these patients develop respiratory compromise and respiratory failure, which require prolonged mechanical ventilatory support. Compromise in respiratory function remains the most common cause of mortality following a SCI [3]. The abdominal muscles comprise of transversus abdominis (TrA), internal oblique (IO), external oblique (EO), and rectus abdominis (RA). Together with the diaphragm, these muscles play a key role in regulating intra-abdominal pressure and assisting in activities including defecation, vomiting, coughing, sneezing, and childbirth [4,5]. Therefore, the evaluation of the function of the diaphragm and abdominal muscles is paramount in the management of SCI.
Studies have reported that the diaphragmatic and abdominal muscular functions can be assessed indirectly by ultrasound scan, which has the advantages of being a non-invasive, radiation-free, easily implementable, and reproducible assessment tool [6,7]. Here, we described a patient with SCI at the cervical level resulting in high-level quadriplegia and respiratory failure, which was complicated by pulmonary infection. We demonstrated the use of the point-of-care ultrasound (POCUS) in the management of this patient at the department of critical care medicine (CCM), which was beneficial in the monitoring of diaphragmatic and abdominal muscular functions and predicting the ultimate clinical outcome.
Case Presentation
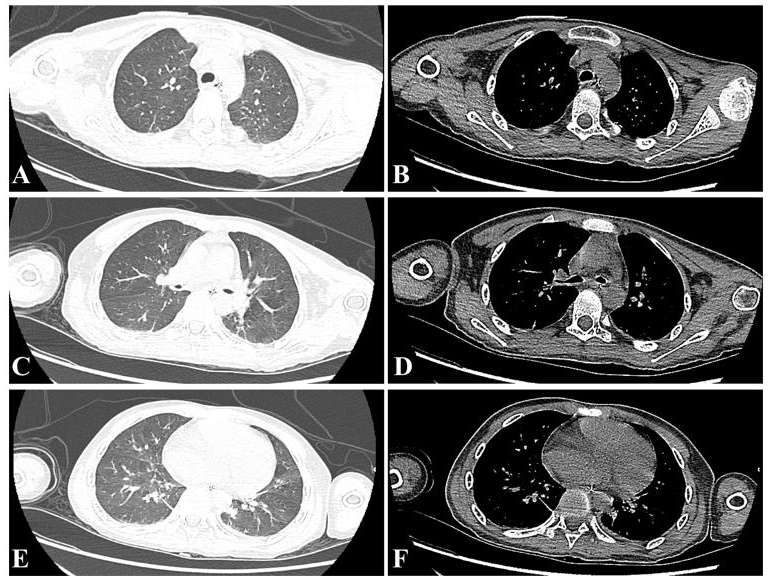
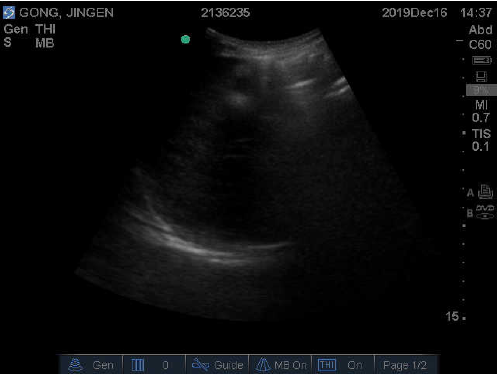
A 12-year-old Chinese male sustained a cervical SCI (odontoid fracture associated with atlantoaxial dislocation) following a fall. Consequently, he developed high-level quadriplegia and was dependent on invasive mechanical ventilatory support. The physical examination revealed muscle strength grade 0 in the extremities, partially sensory but not motor function is preserved below the neck [ASIA (American Spinal Cord Injury Association) B classification]. He underwent an emergency open reduction and internal fixation for the odontoid fracture of C2. He was then transferred to the department of CCM for continuing respiratory support [synchronized intermittent mandatory ventilation with pressure support (SIMV+PS), respiratory rate (RR) 16/ min, pressure control (PC) 10cmH2O, PS 10cmH2O, positive endexpiratory pressure (PEEP) 5cmH2O, FiO2 30%] and further management. The arterial blood gas analysis revealed pH 7.378, PaO2 121.2mmHg, PaCO2 41.2mmHg, HCO3- 23.7mmol/L, and lactate 0.8mmol/L. The thoracic CT (computed tomography) scan showed a few infectious lesions and infiltrating shadows of both lungs (Figure 1).
Figure 1: CT images of the patient demonstrating a few infectious lesions and infiltrating shadows of both lungs.
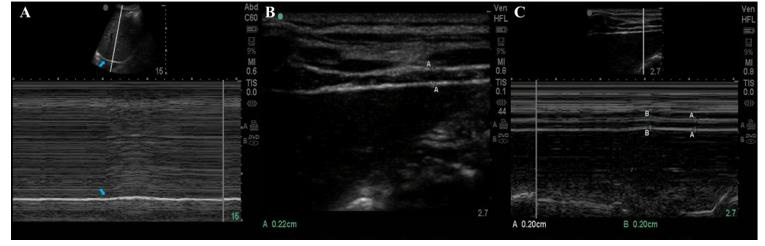
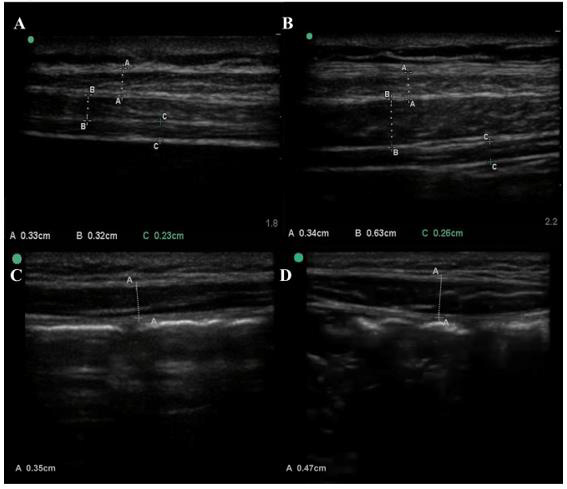
Considering the requirement for prolonged mechanical ventilator support, a tracheotomy was performed on day-4 following the admission to the department of CCM. On day-5, an ultrasound scan was performed to measure the diaphragmatic motion (convex-array transducer [3-5 MHz] in M-mode) at the level of the midclavicular line of the subcostal region, and the diaphragmatic thickness (linear-array probe (>10 MHz) in B-mode) and thickening rate (linear-array probe (>10 MHz) in M-mode) at the mid-axillary line of the thoracic cage [5,8]. As demonstrated in Figure 2A, the diaphragm showed little movement and was depicted as a straight line in M-mode. The motion was almost zero. The diaphragm thickness measured approximately 0.22 cm during expiration (Figure 2B), which remained constant with respiratory movement, with both the thicknesses at the inspiratory phase and respiratory phase measuring at 0.2cm in M-mode (Figure 2C). The muscle thicknesses of TrA (0.23cm), IO (0.32cm), EO (0.33cm), and RA (0.35cm) were clearly observed and measured in B-mode (Figures 3A & 3C) at the midpoint between the inferior angle of the rib cage and the iliac crest and 2cm above the umbilicus at the level of the midclavicular line [5,9].
Figure 2: Ultrasound imaging of the patients’ diaphragm. A, Diaphragmatic motion during breathing at rest in M-mode. The echogenic line (blue arrow) indicated the diaphragm. B, Diaphragmatic thickness (the distance between A-A) during expiration in B-mode. C, Diaphragmatic thickening rate in B-mode. The A-A points indicated the diaphragm thickening during inspiration, and the B-B points indicated the diaphragm thickening during expiration.
Figure 3: Ultrasound imaging of the thickness of the abdominal muscles measured in B-mode at rest at day-5 (A, C) and day- 15 (B, D) following admission to the department of CCM. A, The external oblique (EO, A-A points), internal oblique (IO, B-B points), transversus abdominis (TrA, C-C points), and C, the rectus abdominis (RA, A-A points). B, the external oblique (EO, A-A points), internal oblique (IO, B-B points), transversus abdominis (TrA, C-C points), and D, the rectus abdominis (RA, A-A points).
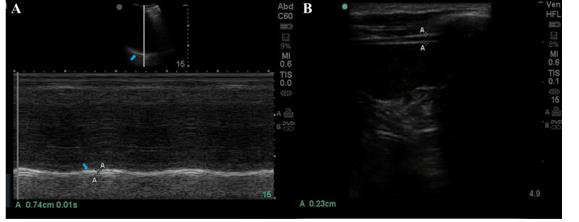
Upon weighing the potential risks and benefits, with the supports of an external fixator, the patient was assisted to improve expectoration by changing the body position, patting the back, application of vibration row phlegm, and other measures, in addition to daily external electrical phrenic nerve stimulation, guided breathing exercises, and optimization of nutritional support to enhance the strength of the patient’s diaphragmatic and abdominal muscular function to the maximum. On day-15 following the admission to the department of CCM, a repeat scan was performed to re-assess the diaphragmatic and abdominal muscular function during breathing at rest. The muscle thicknesses of the diaphragm, TrA, IO, EO, and RA were 0.26cm, 0.63cm, 0.34cm, and 0.47cm, respectively (Figures 3B & 3D), while the diaphragmatic motion was measured at 0.74 cm (Figure 4A). The dynamic graph of the patient’s diaphragmatic motion was shown in video 1. During expiration, the diaphragmatic thickness was approximately 0.23 cm (Figure 4B).
Figure 4: Ultrasound imaging of the patients’ diaphragm at day-15 following the admission to the critical care unit. A, Diaphragmatic motion during breathing at rest in M-mode. The echogenic line (blue arrow) indicated the diaphragm. The distance between A-A indicated the diaphragm excursion. B, diaphragmatic thickness (the distance between A-A) during expiration in B-mode.
video 1.
When comparing with the initial measurements, the muscle thicknesses of IO and RA had markedly increased, together with a significantly higher diaphragmatic motion during breathing at rest. At the same time, arterial blood gas analysis was reviewed and the results were normal. Further clinical evaluation revealed that the patient could be weaned off the ventilator [ventilator mode: continuous positive airway pressure (CPAP), PS 8cmH2O, PEEP 5cmH2O, FiO2 21%]. Following the repeat scan, the patient was successfully weaned off the ventilator and was discharged from the department of CCM, after a total of 17 days of stay.
Discussion
Many patients with respiratory failure following a cervical SCI are dependent on chronic mechanical ventilation despite intensive respiratory rehabilitation. Our case highlighted the value of POCUS during the period of postoperative rehabilitation, enabling dynamic evaluation of the function of the diaphragm and abdominal muscles. The information generated from the POCUS provided objective recovery status of the patient’s respiratory function, which guided the clinician in decision making in weaning the patient off the ventilator. Respiration is a complex process mediated by the concerted action of the thorax and the abdomen. Normal breathing requires an open airway, intact and well-expanded thorax, lung tissue with good compliance and matching pulmonary artery blood flow, sensitive respiratory nerve center and neurotransmission system, and sound respiratory muscles. The respiratory muscles including the inspiratory muscles (the diaphragm and external intercostal muscles), the expiratory muscles (internal intercostal muscles and abdominal muscles), and the accessory respiratory muscles are essentials in the mechanistic of breathing through mediating intrathoracic pressure thereby altering the lung volume [10,11].
The respiratory compromise in SCI is secondary to the loss of movement of the respiratory muscles below the level of the injury [3]. The diaphragm and abdominal muscles are often overlooked in the ventilatory management and rehabilitation following SCI. The weakness in the action of the diaphragm and abdominal muscles leads to dyspnea and activity intolerance. In addition to generating forces that maintain the stabilization and support the movement of the spinal column, the abdominal muscles collectively pressurize the abdominal cavity. This not only is essential in active exhalation but also partakes in the cough mechanism for the removal of respiratory secretions. Furthermore, the diaphragm represents the main respiratory muscle, which when contracts, the thoracic cavity expands to enable active inspiration. On the contrary, when the diaphragm relaxes, the volume of the thoracic cavity decreases to facilitate exhalation. Synchronized contraction of both the diaphragm and abdominal muscles increases the intra-abdominal pressure, which assists in defecation, cough, removal of respiratory secretions, and other activities [5].
The deficiency in these functions is usually difficult to be ascertained and often delayed in the diagnosis, given that most screening tools for dyspnea do not encompass the assessment of the functions of the diaphragm and abdominal muscles. Consequently, this is not addressed early and represents a common cause for the failure of patients to be weaned off the ventilator and mortality from severe respiratory complications [12]. In recent years, the use of POCUS has become increasingly popular to assess the diaphragm and abdominal muscles in critically ill patients. Studies have shown that POCUS could accurately assess the thickness of the abdominal muscles and the diaphragm in addition to its thickening rate and motion. Moreover, it is a readily available tool in the critical care unit for performing bedside assessment, which is non-invasive and easily applicable. In our case, POCUS has been utilized to dynamically evaluate the daily functions of the diaphragm and abdominal muscles, guiding the clinicians in making decisions on respiratory rehabilitation and accurately weaning the patient off the ventilator and eventually almost complete recovery.
Conclusion
The optimal function of the diaphragm and abdominal muscles is paramount for effective lung ventilation that is often overlooked in the management of SCI. The routine and repetitive application of POCUS allows the clinician to objectively and dynamically evaluate and monitor the global function of the respiratory muscle pump, which predicts the risk for difficult weaning, weaning failure, and ultimate clinical outcome.
Evaluation and Implementation of Health Quality Indicators in Anesthesia at Accredited SUS Hospital
Introduction
Quality and safety in anesthesia are generally monitored by analyzing perioperative mortality-morbidity and incidents [1]. However, these methods limited both sensitivity and specificity for quality and safety issues. Perioperative mortality and morbidity of patients are not always related to anesthesia. Incidents largely depend on employees’ willingness to report them. Consequently, several additional measures are increasingly promoted, mainly clinical indicator tools, and evidence suggests that the quality of care in hospitals can be improved [2]. Methods to evaluate performance from industrial engineering can be broadly applied to efforts to improve the quality of healthcare [2]. When reviewing the history of measurement of anesthesia-related outcomes, 72 anesthesiologists were asked, 56 (78%) completed the questionnaire asking for the opinion of anesthesiology experts on the results attributed to the anesthesia care that patients value [3]. The main results perceived by patients suggest significant variability among patients in what they believe is most important to avoid. Aiming to improve these results, the prospective collection and analysis of scientific data conducted by physicians and through and feedback is likely to improve patient care.
In recent times, numerous innovative efforts have been made globally by anesthesia experts to improve the methodology of measuring and reporting the quality of care provided to patients. One of the important methods involves feedback from patients and surgeons to improve the quality of anesthesia [4]. Continuous surveillance over quality measurement is essential, which can be carried out through effective monitoring and, therefore, can contribute to the maintenance and improvement of standards of care [5]. The study aims to create an easily accessible tool to assess indicators, monitor and assess the incidence of perioperative events related or not to anesthesia, monitor and assess the incidence of events in the posanesthetic care unit (PACU), verify the adherence of the tool in a hospital of the SUS accredited, and identify points to improve patient outcome. The secondary objective is the possibility of implementing such a computer program for smartphones after the initial study.
Methods
This is an observational, prospective, descriptive study, based on the application of a form to assess quality and health indicators in the anesthesia service at Hospital Municipal Clinical de São Bernardo do Campo, São Paulo, which has all the specialties, being recently accredited by the Canadian company Qmentum. The study protocol was developed with two types of forms on the Google platform: one for intraoperative assessment, and another for assessment at the PACU, to be filled out by the entire Anesthesia service team in order to assess and quantify adverse events, in order to prevent them or create ways to improve the quality of care. The population for the research will be formed from the completion of the form by health professionals involved in the Anesthesia service at the hospital. Due to the implementation of a service quality questionnaire during anesthesia and in the PACU, there was no need to fill out the free and informed consent form.
Results
The evaluation of the results was carried out monthly from July to December of the year 2019. In the hospital, 9,675 surgeries were performed, of which 1,693 (17.5%) were reported. Regarding the anesthetic technique used, 702 (41.4%) general anesthesia, 152 (8.9%) sedation, 155 (9.1%) spinal anesthesia and 684 (40.4%) combined technique. There were 96 records of complications, 40 (41.6%) referring to the respiratory system, 18 (18.7%) to the cardiovascular system, 8 (8.30%), to the neurological system, 7 (7.2%) to material and equipment and 10 (10.4%) to hospital systems and protocols. Only one report of death was observed. Twenty-nine facts do not present in the form were also reported, such as 2 (6.8%) records of 5 punctures to perform spinal anesthesia and 1 (3.4%) spinal needle with punctured cannon. Regarding PACU, there were only 525 properly filled out forms. The following were reported: 67 (12.8%) acute pain, 11 (2.1%) nausea or vomiting and 2 (0.2%) hypothermia. The time spent at the PACU averaged 1:33 hours.
Discussion
The quality and safety of anesthesia is usually analyzed based on the incidence and mortality related to the perioperative period through the reports of the involved anesthesiologists. Therefore, it depends on the doctors’ willingness to report the facts that occurred, which ends up affecting the way in which the data are analyzed. In this study, an easily accessible tool was created in the form of a form and requested by all anesthesiologists in the service to complete it, but there was little adherence to the method. Aiming to improve the quality of health, whether individual, community, regional or national, the increasing development of information has increased and communication technologies in virtually every area of health [6]. Technologies are used in research and education, knowledge transfer, social support, and various health services. Mobile technology is increasingly used in telemedicine, wireless monitoring of health outcomes in disease management and delivery of health interventions. Cell phones have been shown to be an important method of encouraging better patient-to-patient communication [6]. The use of smartphones is growing exponentially across the world. Their use by healthcare professionals and patients is increasing dramatically [7]. These facts led to the creation of this evaluation system during anesthesia and in the PACU, with a much greater adherence during anesthesia compared to PACU. In recent research, variation in the quality of apps and lack of user and physician involvement in their development were found across all pain apps in this one [8]. The usability test identified a range of user preferences. The six-month usage test at our hospital clearly showed that physicians (staffs and residents) have little affinity with these programs to improve the quality of their services.
Despite the low adherence, the form created for use during anesthesia and in the PACU collected important data. Regarding the anesthetic technique, a preference for general anesthesia over other techniques was observed. Otherwise, it will be possible to use this data to calculate the cost between the different techniques. However, this was not the object of implementation. The system implemented was able to assess the quality of the service, as a small failure rate was observed in the blocks, both in the peripheral nerve and for spinal anesthesia, in a significant number of such techniques. A greater number of complications related to the respiratory system was observed, which may be related to the fact that general anesthesia is the team’s main choice, however, further studies are needed to make this statement precisely. Regarding the cardiovascular system, there were four cardiac arrests in the period, and only one death. Material reports can help hospital management to purchase or exchange materials used to improve service delivery. Regarding the PACU there was a much lower adherence of the participants with only 31%, but it allowed to collect important information. Only 12.8% patients reported acute pain, 2.1% nausea or vomiting and 0.2% hypothermia. The average length of stay at the PACU was 1:33 hours. Such data allow us to observe the anesthetic quality of the team, since the vast majority of patients do not have complaints during recovery, which, in addition to providing wellbeing, can generate greater turnover in the operating room.
Conclusion
Quality and safety indicators are a useful tool to diagnose and prevent problems related to the perioperative period. The form used in this study is simple, free of cost and easy to perform, however, there was low adherence among the team. Even so, the information collected can help to prevent complications and, in addition, it can be used to demonstrate the quality that the anesthesiology service provides for the hospital and patients.
Screening mammography is a vital element of breast cancer detection that has helped to reduce disease mortality [1-4]. With the current screening strategy, yearly cancer detection rate in the US is approximately five per 1000 screens and fewer than 2% of screens prove suspicious and require biopsy [5-7]. In an effort to improve specificity, decrease cost, and reduce harm the American College of Radiology (ACR) established the Breast Imaging Reporting and Data System (BI-RADS) category 3 – probably benign designation to be used for short-term surveillance instead of immediate biopsy [8-10]. The morphological criteria for BI-RADS 3 include a solitary circumscribed mass with a solid ultrasound (US) correlate, focal asymmetry without an US correlate, and grouped, round calcifications [8,9,11]. Typically the designation of BI-RADS 3 is made after an initial diagnostic work-up and should not be assigned on a screening mammogram. The assignment of BI-RADS 3 activates a short-term (6-, 12-, and 24-months) follow-up protocol which has been demonstrated to reduce false-positive findings at biopsy, while also retaining a high sensitivity for earlystage breast cancer [9].
The designation of BI-RADS 3 is meant to indicate that a finding has a 2% or less risk of malignancy [8] and a recent retrospective report of 45,202 BI-RADS 3 cases from the National Mammography Database suggests that this expectation is concordant with reality [12]. However, institution-level evidence still suggest that in practice 0.9 – 7.9% of BI-RADS 3 lesions are upgraded to BI-RADS 4 and sent for biopsy [9,13-15]. Additionally, as the BI-RADS 3 designation is afforded some flexibility there is an appreciable amount of interobserver variability within each modality [16- 18]. As a result, monitoring adherence to imaging criteria can be challenging and there are relatively few established benchmarks for auditing BI-RADS 3 assignment. Herein, we share BI-RADS 3 audit results from our own institution over a four-year period and propose discrete auditing criteria that may help to establish performance benchmarks. We introduce the following metrics while on surveillance and which may serve as useful benchmarks:
(i) Percentage of initial BI-RADS 3 to total screens (ii) Percentage of initial BI-RADS 3 to screen-recalled cases (BIRADS 0) (iii) BI-RADS 3 upgrade rates within 24 months (iv) Positive predictive value (PPV3) of lesions biopsied within 24 months (v) Distribution of imaging morphology assigned a BI-RADS 3 category (vi) Cancer yield.
Materials and Methods
Our institute is a large tertiary academic medical center (a NAPBC accredited and a breast imaging center of excellence by the ACR) in the northeast United States with an effective catchment area of nearly 1 million individuals. This retrospective study was approved by the Institutional Review Board (IRB) and is compliant with the Health Insurance Portability and Accountability Act. Information regarding the annual number of screening mammograms and the specific number of BI-RADS 0, and BI-RADS 3 cases were obtained from the Radiology Information System (RIS). All relevant BIRADS 3 Medical Record Numbers (MRNs) were identified with the assistance of the institute’s translational science core. All cases were reviewed in the electronic medical records at our institution. All data was extracted and compiled in Red Cap [19] by study personnel. Efforts were taken to standardize the data extraction process and to minimize inter-observer variability. A sample of ten records was collaboratively reviewed by all study personnel to standardize the data extraction and compiling of records from radiologist’s interpretation. Subsequently, the data were extracted from the remaining charts independently by four study personnel.
Subjects
The study included all women over 40 years of age recalled (BI-RADS 0) from screening and assigned BI-RADS 3 at a followup diagnostic evaluation from January 2014 through December 2017 at our institution. Our inclusion criteria were women who were assigned BI-RADS 0 on initial screening exam, and, assigned BI-RADS 3 from a diagnostic follow-up exam performed within 90 days of the screening exam, and, had at least one follow-up visit in the subsequent 24-month period. Exclusion criteria were women under 40 years of age at the date of their initial screening exam, or, BI-RADS 3 assessment following diagnostic assessment in a symptomatic patient, or, the follow-up diagnostic evaluation from a screening mammogram exceeded the 90-day time limit, or, did not have one or more evaluations in the 2-year follow-up period. The study was limited to mammographic and ultrasound evaluations only. All of the digital mammograms were performed at our multiple clinical sites on Hologic (Bedford, MA) Selenia® or Selenia® Dimensions™ units. Both full-field digital mammograms (2D) and Digital Breast Tomosynthesis (DBT) techniques [20] are employed at the time of the screening examinations. There are no clearly defined criteria with regards to who is offered a 2D mammogram and who is offered a DBT study.
All breast ultrasounds were performed on a Phillips (Bothell, WA) iU-22 unit by a dedicated breast sonographer, and when necessary, the radiologist will also personally scan the patient. At our institute BI-RADS 3 cases are evaluated at 6 months (ipsilateral breast), 12 months (bilateral) and 24 months (bilateral). At each time point, supplemental ultrasound as indicated was also performed. The data abstracted from the chart included the patient age at time of BI-RADS 3 designation as well as if the preceding BIRADS 0 mammogram was their baseline. We also recorded whether the BI-RADS 3 designation was made via diagnostic mammogram, or ultrasound, or both. The radiologist who assigned the BI-RADS 3 designation, the breast density category (A-D), the quadrantbased location, and the morphology of the BI-RADS 3 finding from mammography and ultrasound were recorded. The presence of follow-up imaging at 6, 12, 24 months was recorded and was used to calculate the follow-up rate. If a patient was deemed to be lossto- follow up at 24 months, the last known finding was recorded. If a biopsy was completed, the duration (months) after BI-RADS 3 assignment, modality used image guidance, and the histopathologic findings from the biopsied specimen were all captured.
Statistical Methods
The quantitative measures in this study are all reported as proportions/percentages. The Clopper-Pearson exact 95% confidence interval was computed. One sample tests of proportions were used to determine if the quantitative metrics differed from values reported in literature. All tests were two-tailed. Effects associated with p<0.05 were considered statistically significant. All analyses were conducted using statistical software (SAS version 9.4, SAS Institute, Inc., Cary, NC).
Results
Demographics
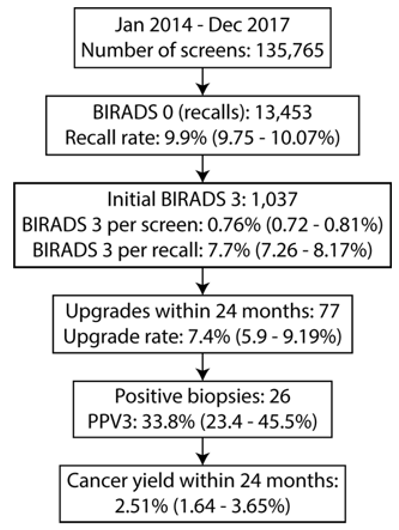
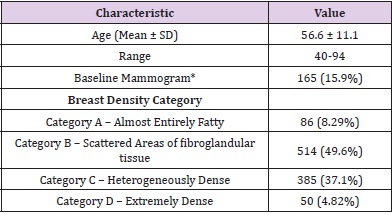
A total of 135,765 screening exams were performed during the four-year period from which 13,453 were recalled (Figure 1). A total of 1,360 women were assigned BI-RADS 3 of which 1,037 women met the study eligibility criteria during the four-year period. There were 24 unique radiologists who assigned BI-RADS 3 category during the study period. Eight out of the 24 radiologists were fellowship-trained in breast imaging and each of these eight radiologists assigned 50 or more BI-RADS 3 studies and accounted for 93% (n=969) of all included BI-RADS 3 cases. The mean age at time of initial BI-RADS 3 assignment was 56.6 ± 11.1 years with range of 40–94 years (Table 1). For 165 (15.9%) women, the BIRADS 0 mammogram that preceded their BI-RADS 3 assignment was the patient’s first mammogram. In terms of breast density, nearly half (49.6%, n=514) of all of the breasts studied were category B, followed by 37.1% (n=385) in category C, 8.29% (n=86) in category A, and 4.82% (n=50) in category D.
Figure 1: Flowchart describing the assignment and follow-up of probably benign findings and the associated quantitative metrics for clinical practice management.
Table 1: Patient demographics, prior mammograms, and breast density of BIRADS 3 patients (n =1,037).
BI-RADS 3 Features: Morphology, Laterality and Location
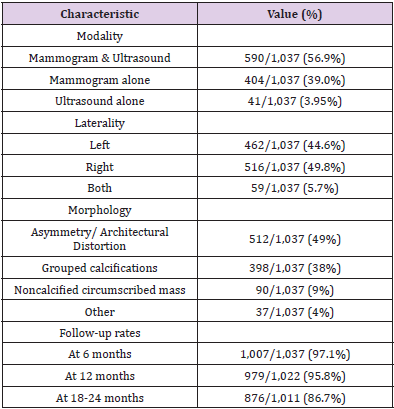
Nearly all (95.9%, n=994) of the BI-RADS 3 cases were assigned BI-RADS 3 on either mammogram/DBT alone, or mammogram/ DBT with ultrasound. The remainder (3.95%, n=41) of cases were assigned BI-RADS 3 on ultrasound (Table 2). The imaging morphology breakdown of the 1037 cases were asymmetry/ architectural distortion (n=512, 49%), grouped calcifications (n=398, 38%), and non-calcified circumscribed mass (n=90, 9%). The remaining 37 BI-RADS 3 cases (4%) were called at the discretion of the radiologist and the electronic records did not document the classic descriptors for a BI-RADS 3 assessment. The assignment of BI-RADS 3 lesions was relatively even with 49.8% (n=516) in the left breast, 44.6% (n=462) in the right breast, and 5.70% (n=59) of cases bilaterally. The upper outer quadrant had the greatest number of lesions in both the right (n=232, 38.0%) and the left (n=195, 35.3%) breasts, followed by the subareolar/central region in the right (n=140, 22.9%) and left (n=115, 20.8%) breasts.
Table 2: Imaging characteristics including modality that resulted in BIRADS 3, lesion location and lesion morphology, and followup.
Follow-up of BI-RADS 3 Lesions
The follow-up rate at 6 months was 97.1% (1,007/1,037) and decreased progressively to 95.8% (979/1,022) at 12 months and 86.6% (876/1,011) at 24 months (Table 2). The denominator is adjusted for lesion downgrade due to benign pathology from biopsy at prior follow-up. Among the 1,037 BI-RADS 3 patients, 7.4% (n=77) of all the cases underwent biopsy, of which n=23, n=40 and n=14 cases were biopsied at 6 months, 12 months and 18-24 months, respectively. A majority of the biopsies (n=47, 61%) of the biopsies were performed under ultrasound guidance and the remainder (n=30, 39%) using stereotactic mammography. The distribution of biopsies at different follow-up periods was as follows: 23/77 (30%) at 6 months, 40/77 (52%) at 12 months, and 14/77 (18%) were performed between 18-24 months.
Table 3: Quantitative benchmarks for clinical practice management.
Quantitative Benchmarks
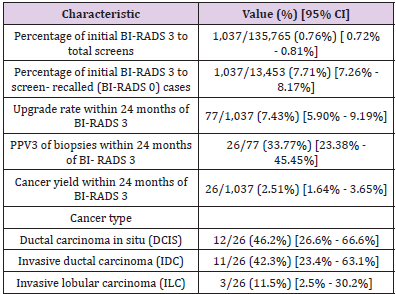
The quantitative benchmarks suggested for routine clinical practice management are summarized in Table 3. The percentage of initial BI-RADS 3 to total screens was 0.76% (1,037/135,765) and the percentage of initial BI-RADS 3 to screen-recalled cases (BIRADS 0) was 7.7% (1,037/13,453). Within the 24-month follow-up period, the BI-RADS 3 upgrade rate was 7.4% (77/1,037). Among the 77 lesions biopsied within 24 months following BI-RADS 3 assignment, there were 26 malignancies, resulting in positive predictive value (PPV3) of 33.8% (26/77). Among the 26 cancers, 62% (n=16) were biopsied under ultrasound guidance, while 38% (n=10) were biopsied under stereotactic mammography. The cancer yield within the 24-month follow-up period was 2.51% (26/1,037). Among these 26 cancers, 30.8% (8/26) were detected at 6 months, 57.7% (15/26) at 12 months and 11.5% (3/26) at 18-24 months. The most frequently identified cancer type was ductal carcinoma in situ (DCIS) with 46% (12/26) of the cases. This was followed by invasive ductal carcinoma (IDC) at 42% (n=11) and invasive lobular carcinoma (ILC) at 12% (n=3).
Discussion
The purpose of introducing the BI-RADS 3 categorization in the BI-RADS atlas [8] was to reduce the harms of screening by decreasing the number of false positives biopsies, reducing the cost of health care and yet maintaining sensitivity for early detection of breast cancers. Although the BI-RADS atlas specifies the probability of cancer in this subset as 2% or less, there has been no established routine audit in recent times for various clinical practice settings [17,21]. We therefore conducted a retrospective review of our own data as a quality assurance project to better guide clinical practice management. In our study over a 4-year period of 1,037 BI-RADS 3 cases following an inconclusive (BI-RADS 0) screening mammogram, the cancer yield was 2.5% (n=26) during the 2-year surveillance period. The observed cancer yield was not statistically different (p=0.243) from the 2% probability of malignancy as described in the BI-RADS atlas. Our cancer yield did not significantly differ with the 1.86% cancer yield reported by Berg, et al. [12] (p=0.123) but was significantly higher than the 1.47% reported by Micheals, et al. [21] (p=0.006), the 1.02% reported by Lehman, et al. [22] (p<0.001), and the 0.8% reported by Baum, et al. [23] (p<0.001).
Among the 26 cancers detected within the 2-year follow-up period, 8/26 (30.8%) were detected within the first 6 months and supports the value of the short-term (6 months) follow-up. The ratio in our series was different from Berg, et al. [12], where 58% cancers were identified at 6 months (p=0.005). During the first 12 months of follow-up, 23/26 (89%) cancers were detected and is comparable to the 73% reported by Chung, et al. [24] (p=0.076). In keeping with multiple prior studies [11,12,21] most of our cancers were DCIS 12/26 (46%). There were 11/26 (42%) invasive ductal carcinomas and 3/26 (12%) invasive lobular carcinomas in our series. The invasive cancers were early-stage cancers. In our study, during the 2-year surveillance, 77/1,037 (7.4%) cases were upgraded to BIRADS 4/5 and were biopsied. This rate was higher than the 5.9% reported by Michaels, et al. [21] (p=0.037) and 0.88% reported by Vizcaino, et al. [15] (p<0.001). The positive predictive value (PPV3) in our series was 26/77 (34%), which is larger than the 16.6% in Berg, et al. [12] (p<0.001) and comparable to the 25% in Michaels, et al. [21] (p=0.076). In our study, the proportion of BI-RADS 3 to the number of recalls (BI-RADS 0) was 10.1% (1,360/13,453) among all women and 7.7% (1,037/13,453) among study eligible women. In our literature search on PubMed, we could not identify any publication that reported on the use of this metric. We suggest including this metric as part of routine audits for clinical practice management.
To establish a benchmark across different practice settings, there is need for sharing recent data from varied clinical settings (academic and private, dedicated and non-dedicated breast imaging practices). The above referred indices could serve as a useful benchmark of a practice’s quality assurance. Age, ethnicity, lack of transport, education, and cost of care all result in disparities and barriers that contribute to a poor follow-up. Poor compliance to follow-up would directly impact the cancer yield in BIRADS-3 cases. While the literature [12,21,23,24] describes loss to followup as a major concern, in our series the follow-up rates were good with 97% at 6 months, 94% at 12 months and 84% at 24 months. In Michaels, et al. [21] the compliance for follow-up progressively declined from 83% at 6 months to 54% at 24 months. In Baum, et al. [23], the studied cohort only had a 71% compliance with follow-up. The current edition of BI-RADS atlas clearly discourages assignment of BI-RADS 3 from a screening examination without a complete diagnostic workup. However, prior literature did not make that clear distinction [12]. The BI-RADS atlas clearly outlines the morphology criteria for assignment of BI-RADS 3 under mammogram, ultrasound and MRI; however, it also mentions that the radiologist’s experience and discretion could determine the assignment.
The distribution of the different morphologies contributing to a BIRADS-3 assignment in our study was asymmetry/focal asymmetry/architectural distortion was 49% (512/1,037), microcalcifications 38% (398/1,037), non-calcified circumscribed mass on mammogram or ultrasound or both was 9% (90/1,037) and 4% (37/1,037) of the assignments were at the discretion of the interpreting radiologist without one of the above descriptors in the report. In most studies [13,14,15,21] calcifications accounted for greater than 50% of the BI-RADS 3 assignments, except in Varas, et al. [14], where calcifications accounted only for 19% of the BI-RADS 3 assignment. Institutional policies, reader variability and access to care may be contributing to these differences. Also, radiologist’s experience and fellowship-training may influence interpretation [18]. Dedicated fellowship-trained breast imagers and general radiologists performing breast imaging are known to differ in their evaluation and assessment of breast lesions [17,18]. Literature also mentions of varying cancer yields depending on whether dedicated breast imagers or general radiologists interpret breast exams [2,18,21]. The majority of our BIRADS 3 cases at our facility were reviewed by dedicated fellowship-trained breast imagers. Another factor contributing to variability that has been recently reported is the patient’s age with cancer yield exceeding 2% for women older than 60 years of age [25].
Also, after the introduction of DBT, there is literature indicating better visualization of architectural distortion, some of which lack an ultrasound correlate [26]. During the early stages of DBT adoption in clinical practice, there was lack of a DBT-guided biopsy device and hence consensus among the radiologists on the management of these lesions. Further, there is also variability among radiologists [16] in terms of lesion descriptors that could contribute to variability in assigning BI-RADS 3 category. Ambinder et al [18], refers to the decreasing incidence of BI-RADS 3 post-DBT implementation. All of these factors contribute to inter-reader and inter-facility variability and have resulted in wide variability across practices in the assignment of BIRADS 3 as a percentage of the total screens. We feel that larger data set from across the country may help us define some benchmarks necessitating practices to review their policies should there be large variances from established benchmarks.
Limitations
Our study had limitations. The study was retrospective in nature. Only mammographic and ultrasound features were considered. Prior to mid-2016 when we acquired the capability to perform tomosynthesis guided biopsies, architectural distortion without an ultrasound correlate were assigned BIRADS 3 at our institute. On review of our records, architectural distortion and asymmetry, though distinct morphologies, were sometimes used interchangeably in the report. Hence, we merged the two categories for analysis rather than attempt to distinguish them. We did not specifically account for downgrades to BIRADS 1 and 2 during follow-up, which is likely a very small proportion, since a majority of our breast imagers continue to follow up cases assigned a BIRADS-3 for the entire 24-month surveillance.
Conclusion
Audit of BIRADS 3 metrics has the potential to provide additional insights for clinical practice management. Many of the criteria referred to in this paper (cancer yield, BI-RADS 3 as a percentage of screens, as a percentage of BI-RADS 0, distribution of the morphology of BI-RADS3 assignments, upgrade rates, positive biopsy rates) may serve a useful role in monitoring clinical practice and for establishing the optimal range for the appropriate use of the BI-RADS 3 category. Larger data sets from varied clinical settings, with inputs from an expert committee could help establish benchmarks for these metrics.
Due to the increasing lifespan around the globe, musculoskeletal disorders like Osteoarthritis (OA) tend to have a higher prevalence comparing to the past decades. As of 2017, more than 300 million people had been diagnosed with osteoarthritis. Therefore, early diagnosis and treatment becomes a serious matter considering the impact in the quality of life for these patients [1]. Osteoarthritis is a musculoskeletal disorder characterized largely by pain, join disfunction, synovial effusion and swelling due to the degenerative destruction of the articular cartilage. Articular cartilage lacks the capacity of self-healing, due to the lack of vascularization [2]. During the degenerative process occurs an imbalance between anabolic factors and catabolic factors in the favor of the latter.
Several matrix-degrading enzymes alter the structure of the extracellular matrix (matrix metalloproteinases, disintegrin, etc.), targeting especially type-II collagen or aggrecans [3-5]. Among the risk factors we can mention aging, metabolic disorders, cartilage injury, obesity and mechanical stress exerted upon the cartilage [6]. These factors that trigger the disorder bring several small-scale alterations like genomic instability, epigenetic alterations, altered intercellular communication, telomere attrition, mitochondrial dysfunction, cellular senescence, stem cell exhaustion, etc. [7].
MicroRNA
The discovery of the first microRNA (miRNA), lin-4, in 1993 opened a new door for studying molecular biology [8]. Nowadays, MiRNA is considered a target for both diagnosis and treatment of OA by regulating the endogenous miRNA [4]. MiRNA are tiny, singlestranded, noncoding RNA molecules that regulate gene expression, having an average length of 22 nucleotides [9,10]. In most cases, miRNAs interact with the 3′ UTR (UnTranslated Region) of target mRNAs, suppressing the expression of the genes. In other cases, miRNAs interact with other regions, such as the 5′ UTR, coding sequence, and gene promoters. Also, miRNAs are involved in activation of gene expression under certain conditions, regulating cell cycle, apoptosis or differentiation [8,11,12]. There are several types of endogenous RNA molecules, like transfer RNA (tRNA), ribosomal RNA (rRNA), small nucleolar RNA (snoRNA), small interfering RNA (siRNA) and microRNA (miRNA) [9]. MicroRNAs can be identified in several subcellular structures: mitochondria, endoplasmic reticulum, P-bodies, nucleus, and nucleolus. Also, miRNAs can be found outside the cells via exosomes and detected in plasma and other bodily fluids [13]. Several miRNAs were identified in OA pathology, having an abnormal expression. The most common miRNAs are miR-9, miR-27, miR-34a, miR-101, miR-107, miR-140, miR-146a, miR-558, and miR-602 [14].
Mirna Detection Methods
The first miRNA isolation and detection methods used phenol-chloroform associated with RNA precipitation [15]. Nowadays, as the technology improved, many techniques were developed. Some authors divide these techniques in 2 categories: traditional techniques and modern techniques [16]. The most common techniques used are qRT-PCR, in-situ hybridisation, RNAsequencing, microarray, northern blot. qRT-PCR. It allows the instant detection and the quantification of genetic products generated during the repetitive PCR cycles [17]. RT-qPCR is a combination of three steps: RNA to cDNA conversion using reversetranscriptase (RT); PCR-based amplification of the cDNA; real-time detection and quantification of cDNA [18]. In-situ hybridisation. It can localize genetic material in a sample by hybridizing and labeling a complementary strand of RNA or DNA. Using the labeled strand, a certain sequence of nucleic acid can be identified. The detection can be performed using isotopic or nonisotopic methods [19,20]. RNAsequencing. It can reveal the entire structure of a transcriptome using high-throughput sequencing methods.
It can also provide analysis for other aspects like gene expression, translatome, alternatively spliced genes, etc [21,22]. Microarray. It can analyze simultaneously the expression of thousands of genetic sequences in a single experiment. The sequences are arranged in a row-column array on a glass slide known as “chip”, facilitating their identification [23,24]. Northern blot. No special equipment is necessary. It uses the following steps: an agarose gel electrophoresis is performed in order to separate RNA sample (separation is performed according to the size of the sequence); it is transferred to a nylon membrane (preserving the separation in the gel and keeping the same arrangement), fixed and labeled by marking it with an isotope. A wash is performed, removing the unnecessary marked probes. The analyze can be performed using autoradiography or other techniques [16,25]. Despite the differences between these techniques, the results depend firstly on the quality of the sample. Secondly, not all detection methods cand isolate the miRNAs equally. Different extraction techniques isolate different RNAs, depending on the length of the molecules, their concentration in the sample and the sequence differences between miRNAs [11,26]. As a downside, most of the detection methods require long processing time, laborious techniques, and provide many false-positive results. Thereby, at the moment there is no universal detection method for miRNAs [16].
Epigenetics and MiRNA
Epigenetics affects OA in two major ways. First, the development of joints and bones is regulated via epigenetic mechanisms. Any change in these processes modify the risk of developing OA at some point in life by changing the joint shape, the extracellular matrix composition and/or the responsiveness of joint cells to cytokines and growth factors. Second, epigenetics processes can be triggered by external factors, such as articular traumatic injuries or metabolic disorders [27] Inflammation. The inflammatory process induces early alterations in cartilage structures way before the appearance of radiographic signs in OA. Micro fissures in articular cartilage and ECM catabolic products have been discovered in the synovial fluid in the early stages of OA [28]. MiRNA expression is determined by proinflammatory cytokines that lead to activation of the target genes that induce OA progression. Also, miRNAs are linked to modulation of proinflammatory cytokine expression, such as TNF-ɑ, IL-1β, IL-6 [2,12]. Also, there are high CRP serum levels that correlate with the histological alterations in the synovial inflammatory site.
Due to high activity of IL-1β and TNF-α, there is an overexpression of other critical inflammatory and chrondrolytic mediators, including MMP-1, MMP-9, MMP-13, NO, PGE2, and IL-6. IL-6 acts as B-cell and T-cell activator, but also as a regulator for the recruitments of other inflammatory cells. IL-8 has a synergic effect along IL-6, recruiting and activating neutrophils [28-30]. Proliferation. In normal synovial membrane, the thickness is about 1-3 cell layers and a low level of inflammatory cells in the synovial fluid. In OA, however, the synovial reaction consists in hyperplasia associated with a high degree of inflammatory cells, mainly macrophages, B and T cells. During the early stages of OA, due to the increased cellular activity at the site of the articular cartilage, chondrocytes tend to form clusters consisting of 50 or more cells. On the other hand, simultaneously with the chondrocyte proliferation, ECM tends to decrease, having a reduced level of glycosaminoglycans in its composition compared with a normal ECM, resulting in degradation of intraarticular homeostasis and opening a door for further destruction mechanisms.
During the late stages of OA, the cartilage structure consists of hypocellularity due to a high level of chondrocyte apoptosis and lacunar emptying [28,31]. IL-6 and IL-8 are the main proliferationinductors involved in OA. Recent experiments revealed that miR-373 acts as a downregulatory for expression of IL-6 and IL-8 by inhibiting a specific receptor called P2X7R. In OA, the plasmatic level of miR-373 is lower when compared with the non- OA plasmatic level samples [32]. Also, the expression of MiR-27b and MMP-13 activity is inversely proportional, miR-27b acting as a negative regulator. Mir-488 inhibits MMP-13 via Zinc-transporter 8 (ZIP-8), thus enhancing both chondrocyte differentiation and cartilage development. In OA, its expression is strongly diminished [10,33]. ECM degradation. ECM of the cartilage is composed of proteoglycans such as aggrecan (the main component), decorin, lumican, and biglycan; adhesive glycoproteins (fibronectin); collagens, mainly type II and in smaller proportions type VI, IX and XI collagens. These glycosaminoglycans (GAGs) have an absorptive function, increasing water concentration into cartilage ECM, thus enhancing compression resistance.
Type II collagen provides cartilage mechanical resistance to tension due to the fibrillar structure. Proteinases released in the articular cartilage in OA play a crucial role in degradation of ECM by targeting mainly the aggrecans and the collagen, damaging the two main components of the ECM. The destruction of these structures is mediated mostly by collagenases (MMP-1, MMP-8, MMP-13) and aggrecanases (ADAMTs) mainly via IL-1β, TNFα [34-36]. There are several other factors that contribute ECM breakdown such as Gc-globulin, α1-microglobulin, and α2-macroglobulin, but also VEGF. Also, IL-1β acts as a downregulatory in production of type II and type IX collagen, thus inhibiting ECM production [28]. Several miRNAs play a role in cartilage protection by modulating ADAMTS-5 expression, resulting in preservation of extracellular matrix. One of the first “protective” miRNA discovered is miR-140 that contribute to articular cartilage and normal enchondral bone development. In OA, miR-140 is downregulated compared with normal cartilage [2,37,38]. Apoptosis. Inflammatory cells migrate to the site of the injury in order to initiate tissue repair. After the reparation process is finished and the cells completed their task, they are eliminated via programmed cell death or apoptosis in order to prevent excessive inflammation [31].
Predominant factors that regulate apoptosis include enzymes, genes and proteins such as p53, Fas receptor, BCl-2 and Bax, cytochrome C, caspases, protein kinases regulated via extracellular signaling. The first stage in the apoptotic process is represented by the genetic control that decides, according to a stimulus, if the apoptosis should be initiated. It is regulated by two genes, BCl-2 and p53. The second stage is represented by the morphological alterations of apoptosis regulated by caspases [39]. Chondrocyte apoptosis may be linked directly to the destruction of the ECM. Most cells attach to the neighboring cells or ECM, creating junctions and ensuring the necessary nutrient intake in order to sustain their activity. Disruption of ECM may affect chondrocyte survival, inducing premature apoptosis.
In vitro experiments using enzymatic treatment via high purity collagenase in order to cleave type II collagen proved that the degradation of collagen induced chondrocyte apoptosis [31]. IL-1β modifies the expression of collagen gene Col2a1, having a downregulation effect and also having an upregulation effect over inducible nitric oxide synthase (iNOS). This enzyme has a chondrolytic effect over the cartilage, promoting apoptosis in chondrocytes. Along IL-1β, miR-101 is also an important factor that promotes chondrocyte ECM degradation. MiR-34a can decrease the IL-1β-induced effects [10,40]. Cartilage injury initiated by mechanical pressure leads to a high expression of miR-146a, having an apoptotic effect in human chondrocytes by inhibiting of Smad4. Its expression decreases with the OA progression [31,41]. Autophagy. In order to maintain homeostasis, living organisms tend to trigger mechanisms involved in cellular turnover. Autophagy represents the process regulated by several autophagyrelated genes like Beclin-1 and Light Chain 3 (LC3) that dismantle damaged or unnecessary cells and their components prior to their removal [42].
The expression of these genes is directly proportional to the metabolic activity of the involved tissue [43]. Depending on the region of the cartilage, the expression of the autophagy-related proteins differs. Thus, in the superficial layer, cells display a higher expression of proteins like BECN1, ATG5, and MAP1LC3. The cells located in the deep layer have a lower expression of MAP1LC3. Also, their expression decreases with aging. Once the autophagic process is disrupted due to the reduction of these proteins, apoptotic activity increases [44]. In OA, miR-107 acts as an autophagyinductor, having a protective effect on chondrocytes and reducing ECM degradation [33,45].
Potential Therapeutic Targets
Current management of OA involves pain-ameliorating medication and joint replacement surgery. None of these treatments adress to the underlying cause of OA. Due to this fact, there is a need for a Disease-Modifying-OsteoArthritis-Drug (DMOAD), a treatment that not only reduces the symptoms, but also interfere with the pathophysiology of OA, stopping the progression and at least prevent further joint degradation [46,47]. Currently, miRNAs represent a therapeutic target in the management of OA. So far, the clinical success of miRNA-based treatment is not satisfying. Due to the very unstable nature of miRNA, it has a short half-life, it is unstable in vivo and interferes with the disruption and saturation of endogenous RNA. Also, because of the lack of vascularization, miRNA hardly reaches chondrocytes in order to exert the expected effect. Therefore, various techniques must be developed to acquire a better miRNA stability and also a proper drug-delivery technique [48]. There are early studies involving miR-140 treatment in rats where the miRNA was administered intraarticular via exosome. It was observed that the chondrocyte numbers and cartilage thickness were greater after the miR-140 treatment and a reduction in MMP- 13 and ADAMTS-5 expression, thus reducing the ECM degradation and reducing OA progression [49,50].
Conclusion
MicroRNAs have a diversity of biological functions, being involved in a wide range of pathological processes. Also, they regulate gene expressions, activating or inhibiting gene expression. In the pathological mechanism of osteoarthritis, miRNAs have a regulatory role, so they are considered to be potential targets for diagnosis and treatment of OA. Present research directions are effectively promoting miRNA study, due to the increased potential of becoming diagnosis and treatment biomarkers of OA.
Time to Exceed the Physical World to Reach the Quantum Dimension
Introduction
Dark Space and Universe Energy
Dark dominates the universe. The source of light is also darkness. Accordingly, “dark light” is the central concept of the universe. Because of darkness, galaxies are held together, and that’s how gravity is provided. Darkness is found throughout the universe. There is also space in every dimension of the universe. This gap allows communication between objects. Thus, in the dark space, there’s an electrical current, which is a magnetic attraction area. This magnetic field moves mass. The magnetic field created by the dark space is the magnetic field in which the movement and flow of objects in the nucleus of the mass in the universe occurs. Thus, galaxies, planets, and objects in the universe don’t all rotate in the same direction. Some stars have very little or little light because of the magnetic field they have. But not all parts of the universe have the same levels of a magnetic field. The same is true for the human body. Just like the Earth, planets have the magnetic field of space. Where there is magnetic field, there is life. This is because the magnetic field, the planet, has an atmosphere in its own right and in accordance with its conditions. The magnetic field in space is not the same everywhere. Thus, the effect of this magnetic field is different. Scott Kelly was on the International Space Station for about a year. When he returned to Earth in 2016, he was noted to have grown five centimeters. Kelly says it’s easier to get used to living in space than to living in the world. Accordingly, human body cells can adjust to any environment.
The fact that even telomers have this feature demonstrates that all cells and organs in the human body have a quantum size. Thus, the human body is three-dimensional with all of its cells and organs. The formation of the universe and the human magnetic field takes place in the space environment. The magnetic field generates energy. The energy in the universe is fed by this dark space. Accordingly, this “Dark cosmic light” is the main energy that feeds the universe and humans. Every creature in the universe has another magnetic field, except for its own magnetic field, which is made by a dark space. Just as an atom has a magnetic field, the Earth and the galaxies have their own magnetic fields. A magnetic field is one of the forces that play a role in the transformation of energy in the universe from one form to another. Because everything in the universe has its own magnetic field, we perceive the universe as material and see it as the universe. We can only see part of the universe. We cannot see the rest of the universe. The reason for this is that the dark energy causes the universe to accelerate into expansion. The gravitational effect of dark energy drives this. It alienates objects and accelerates the expansion of the universe. Where a magnetic field is generated, there is magnetization. In the universe, energy is drawn into space. Thus, the energy is in the voids. The dark energy that occurs in space accelerates the expansion of the universe. Likewise, human gaps maintain energy and promote human development in the human body.
As a matter of fact, a fetus is in the abdomen of the womb and continues to grow and develop in the space. The organs in the human body have their own voids, which produce magnetic fields. The lobes in the brain, some organs of the human body such as the lungs, kidneys, eyes, and ears are dual to produce magnetic fields in the voids. In this case, these organs form magnetization because there are molecules in voids that collect light. These light-containing molecules change shape with light. Then they recharge in the dark. If we take the human eye out of the socket and replace it with a new artificial eye, the light coming into the eyelid will stimulate the cells inside, send a signal, and start to see again. On the other hand, if we cut the nerve away from the brain’s sensory field, the brain will continue to function. Neil Harbisson was naturally colorblind and could “hear” the colors with an aerial attached to his head. Likewise, people without both hemispheres gain the functions of the brain. Humans have specialized tissues where chemicals in the air (in space) that can interact with neurons. Neurons in the human body have multiple processes. For example, in parts of the brain (occipital) that are associated with vision, the lobe also carries hearing and touch information. Also, areas outside the visual cortex allow us to see some neurons. Therefore, if neurons in the brain enable vision, neurons in the heart and other organs perform the vision. The act of seeing is not just about the eye.
The human genome has genes that enable us to see. There are two types of vision genes. One is a gene that’s formed in cavities, and the other is a gene that’s specialized in the air to enable the chemical to interact with the neurons to see. The phenomenon of human vision occurs when light enters into an eye space rather than when it is transmitted through the eyes. Accordingly, the light, which is conscious through the development of magnetic field, undergoes energy transformation. When conscious light interacts with an intensive magnetic field, changes occur within nerves and spaces. Every neuron in the human brain has a different photon. Light is therefore conscious and has the same effect on physical, chemical objects and gases in the human body, but some chemicals and gases create intensive magnetic fields. Cells use the magnetic field that forms in space.
Dark Space and Time
Mobility occurring in the universe is related to the direction of movement of the objects. The quantum-sized notion of time creates time based on the magnetic environment. Thus, the time of planets is different. The quantum mechanism walks with time. But the quantum dimensional time is different from the time in the universe. Therefore, as the size of the universe jumps, time changes according to these dimensions. Time is associated with motion in the universe. There are proteins that are produced by movement in the human body. Like the universe, the human body has a space in which time passes backwards.
Dark Cosmic Light
It’s light or optical light that we see for things. But there are forms of light that are not visible around us like ultraviolet light. According to physicists, light is the name of a physical being. There are many light types such as etheric, infra, ultraviolet, electra, gamma, and nucleon lights. Light is mainly used for 12-20 unit TV series, but is also longer series such as black light. But even though it’s said that the eye can’t detect such light, the eye can actually detect them. It is just that the enzymes and proteins to ensure this perception do not become activated and the eye cannot perceive these lights because perceiving light is dimensional work. The array-length difference in the light also makes its energy different. If it weren’t for this range difference, the messages from the universe and other things would only tell you their fractals, but not their properties. Therefore, the messages the eye will send to living creatures should not be based on certain light waves, like an optic spectral analyser that sees the detection center, but on the energy difference. The transfer of consciousness starts in the space that forms the universe and in the Dark Cosmic Light Alemdar [1]. Dark cosmic light is linked to all dimensions in the universe. If man transfers energy from cosmic light in the universe, it raises its own consciousness.
Space connections in the human body are essential in order for the body to function properly due to their role in electrical connection. Anatomic gaps exist in the human body. Consciousness transfer is also performed during sleep by discovering body cavities. This space is where the main source of energy is generated that triggers everything in man and the universe, which is a great source of energy where everything moves. Thus, what we call the void, which exists in the universe and in man, is full of energy. There are transitions in the dark space. There are magnetic pathways that happen in those spaces in the universe and in humans. Consciousness arises in the cavities of the human body. Spaces in the human body are the most suitable places for observing dark energy. Both dark energy and physical matter are found in voids. Therefore, dark energy can be detected.
Consciousness
There are ninety-nine types of consciousness. Within these ninety-nine consciousness, there are special consciousness. There are 360 aspects of consciousness. One in every way helps with information from the magnetic fields that form in the human body, which is to say, the way the mind activates. That is, every person has a different level of consciousness. In this direction, every person has a frequency level. Although this level of awareness can be raised, not every person can attain the same level of awareness. Ninetynine conscious species have different frequencies. Humans are only aware of the consciousness of visible light. However, a human lives in different frequency sizes. With different frequencies, there are ninety-nine dimensions formed by ninety-nine consciousness in the universe. The cells in the human body also have a special consciousness. These cells have special time zones where the consciousness of these cells activate. Therefore, each nerve in the human body is sensitive to photons of different colors.
Sleep as a Type of Consciousness
Sleep is connected to universal energy. Therefore, consciousness transfer takes place during sleep. Awareness is raised in the body cavities, and then energy is transferred between the universe and this vacuum. Human memory is accumulated in body cavities. Different parts of the brain have different tasks. These zones are responsible for language, memory, consciousness and intelligence. Emotions such as memory, thinking and feeling are created in spaces Reddy, et al. [2]. While the responsibility for these tasks initially burden the brain, in fact all organs of the body assume these functions. The major consideration here is that brain organs tend to think, act, and receive signals, which are actually developed in gaps in the human body. As such, what do these parts of the brain actually do when you consider people without brains or other living things? In fact, the entire body is in motion and all body cells are constantly renewed, developed, and divided. Neurons do not only belong to the brain, but also exist in other organs of the body such as the heart. All parts of the brain are like a distribution site. Since everything happens in space, these parts of the brain are dissipating energy. There are pathways in the space and light is emitted from these pathways to the whole body in different ways Alemdar [1]. Accordingly, emotion, thought, and automatic movements of people are caused by the spread of consciousness that is formed in different sizes than the pathways of the human body.
The magnetic field in the brain transforms light into a form other than the initial form Kletetschka [3]. The sensing and talking points in the brain are distribution centers. There are proteins inside the brain that produce magnetic waves. The effect of the magnetic field allows the neurons to produce signals. During the fourth week of fetal formation, the fastest developing cells are the nerve cells, the neurons. This is the longest-lasting group of cells. These cells survive without rejuvenation. At the end of the fourth week, neurons leave the spine. Neurons know what to do and where to go on this journey and they never miss the way. How do neurons find their direction without any mistakes? The answer is cells that have a magnetic field in the human body and the magnetism that occurs in that area. This creates a special consciousness in cells. A certain amount of sleep is necessary to maintain consciousness. In fact, humans move to the consciousness phase when they sleep and become open to the magnetic fields of the universe. Thus, a quantum-sized human can initiate the transfer of consciousness during sleep. The person is dismissed from the outside world while asleep. When asleep, neurons gradually calm down. Electrical wave activity begins with the magnetic field in space and light consciousness occurs within the human body. When a person has little sleep, an insufficient amount of magnetic fields and energy is created in the brain or body cavity during energy transfer.
In this case, the human body begins to produce slow waves. This can affect human consciousness and, linked to memory, causes the development of harmful proteins. Sleep must be at night. Because at night, the pressure in the brain goes down. The human being is linked to another dimension in the REM stage Rué-Queralt, et al. [4]. In the moment of sleep, awareness is transferred through the tunnel connections I call “human wormholes,” which transfer consciousness outside of time and space. According to this, a dream is not a realm of fantasy. Man is connected to two lives and has a two-way body. These are the state of sleep with alertness. One feature of paradoxical sleep, called REM, are the signals that are propagated by the brain during this sleep phase. Consciousness transfer is shaped by the individual’s level of consciousness. When consciousness transfer begins during REM sleep, the brain’s emotional and memory aspects are activated first Rasch [5]. This is related to the transfer of consciousness into the brain cavity in REM sleep, and the arrival of inspiration that has led to many inventions during that time Hobson, et al. [6]. Paul McCartney, the Beatles’ star in the world’s most famous band, acquired some of his songs during this phase. Dmitri Mendeleyev, the inventor of the periodic table, also dreamed about it. Examples of this are numerous.
People who sleep less are more likely to develop sleep disorders such as sleep apnea, elevated blood pressure, heart attack or stroke. Non-sleeping people have a toxic sticky protein called beta-amyloid in their brains. Insomnia causes more beta-amyloid accumulation in the brain. There are a number of systems still unexplored in the human brain. These systems serve as energy distribution centers in the brain. Beta-amyloid is not only present in the brain, but also in other organs of the body. For example, beta-amyloid is located around liver and biliary ducts Babu [7]. Adequate sleep helps remove all the dangerous toxins accumulated in the brain, including betaamyloid. However, REM also appears to increase blood circulation and beta amyloid accumulation in the brain fluid. It turns out that this particular protein, when it accumulates in the brain regions, attacks and damages these areas. Lack of REM sleep reduces the capacity to clean out beta-amyloid. The information obtained by the brain is linked to each other during the transfer of consciousness through sleep to the brain cavity. People who do not sleep or do not draw enough energy during transfer from dark light at night damage their body organs and start to produce harmful proteins. At night, consciousness transfer occurs. DNA repair occurs overnight as well Zada, et al. [8]. Many things are being rebuilt during the night. We use another energy at night, and another energy during the day.
The universe, too, is fed by darkness. During the conscious transfer in the visible and invisible spectrum, there is a cycle of alertness and sleepiness. Magnetic bacteria, which may be the main source of magnetic sensors in humans, are synthesized in the intestine and concentrated in certain parts of the brain. Accordingly, the bacteria that produces magnetite in the human body allows the creation of dreams in the brain. Toxic gases also produce negative magnetic fields. Magnetic fields come into contact with each other through sleep-vigilance and interaction made as a result of day and night. During the transfer of dark energy from space at night, during REM sleep, acetylcholine and similar molecules are doubled, creating new bonds between it and the neurons. The magnetic fields that occur during REM, i.e., transfer of consciousness, are communicated with the neurons Pace-Schott [9]. This magnetic field in space, and the neurons, just like a magnet, pull one another. Since the transfer of consciousness takes place at night, this situation necessitates sleep. A heavenly body that rises to the earth from the dark at night has light and energy, and the process of transferring the body from the celestial body to the human being begins with the light/energy that comes at night. Humans are part of the energy that occurs within the dark space. The whole body nervous system consists of neuron cells, which carry electric and chemical impellers.
If you want to measure impellers of the nervous system, some are going at 200 miles an hour, some are going at 2 miles an hour. How is it that the brain and other parts of the body can coordinate the nervous system and our sensitive movements when these impellers travel at different speeds as predicted? Now this is a problem that needs to be solved. Here, this system needs a gap that explains how to coordinate. A review of nervous system activity reveals that it starts to fire simultaneous vibrations and pulses across different parts of the brain. When consciousness functions, these pulses start firing mainly coherently. Scientists, too, look at how all different parts of the brain in the same focus can quickly co-ordinate, and that compliance in firing is faster than the physical capabilities of cells communicating from one area to another. Therefore, essentially, these results clearly show that the brain communicates at a higher level than the physical transmission of nerves. And because you’re tuned to the energy in this body cavity, you’re constantly in contact with this information band. And the memory that is communicating in this information band is in the body cavities, including the brain. Because every cell has its own memory. Memory does not just belong to the brain. Subatomic particles extract energy in voids. The energy between the subatomic particles is formed in space. There is a large amount of energy in this gap. The energy in this space continues the invisible energy around us. This vacuum contains energy, or “consciousness information.”
This consciousness in the gap is always accessible, which allows a person to constantly draw information. Backster’s research on the subject is striking Backster [10]. He took DNA samples from subjects, put them in an isolated lab about 300 kilometers away, and urged them to change the minds of the subjects they belong to, and to think of bad events, to fear. The DNA in the lab completely changed and affected the subject’s DNA, 300 kilometers away. In my opinion, the occurrence of this effect is due to the aforementioned gap. There is no loss of information and time in the space where information is transferred. The brain makes up approximately two percent of the total body weight. A considerable amount of energy is used to support brain activity. Today’s research attempts to combine the human brain with artificial intelligence. Their work combines artificial intelligence and the human brain, and works on implant devices that connect a computer directly to the brain. These chips/implants should be placed in the cavities inside the human brain. This is the only way to succeed.
Synapses are the areas in the space where neurons transmit neurons to each other. Cells are often separated in an incredibly subtle space called the synaptic space. The brain communicates with its surroundings through sensory organs that react to various stimuli such as light, sound waves and pressure. Sleep-wake cycles are controlled by neuro transmitters that act on different areas of the brain to initiate and wake sleep. If a person does not get enough sleep, the ability to think and remember clearly and rapidly decreases.
The person’s frequency is high during sleep Whitmore [11]. This is because the consciousness during sleep is in communication with the universal consciousness. It thus dominates the nervous system and, through it, the organism. People are usually on the move during the day. At night, the opposite is partially inactive. Centers that appear inactive and passive to the environment during sleep achieve important tasks inside. The effects to the brain increase the movement of the molecules that make up the centers of the brain. The human body is made up of enzymes and cells that work day workday and night in a day and night cycle. Some cells work in the dark: some need to work during the day. That’s why one sleeps and is awake. Sleep is a state of awareness. Studies on sleep deficiency have shown that people who regularly get little sleep have less concentration and make more mistakes. Weakening of the immune system, changing hormone levels, obesity, depression, anxiety, diabetes and heart disease are the main causes of low sleep. If you do not comply with your needs and draw energy from others, your body may experience inconsistent behavior. This causes some organs to become destabilizing in various cases and may result in harmful proteins. This leads to a number of diseases and toxic gases. Gases are also affected by magnetic fields. When vibration deteriorates in the human body’s organs, it begins to break down and scatter, which means that the consciousness that dominates these cells has lost interest in the body.
Dark Matter
It’s not dark matter that’s effective in the universe, but dark energy. There are various forms of light coming around us from the dark space, such as rays of photons. Humans, too, have special proteins and cells specialized in detecting this light. The energy or photon transferred in space communicates with the photoreceptors as a result of the magnetic field. It’s recognizing the signals that the photoreceptors send into the spaces as human images. Each of these receptors is set to different types of consciousness, light. Some of these cells work during the day, and some work during the night. The cells, which work during the day and night, are sensitive to different sizes and types of light. For this reason, the night, rather than the day, shifts to quantum size with human organs and cells. The eyelids and eyelids are arranged according to night and day. The orbicularis oculi muscle in the human eye, like the eyelids and Saturn rings, defines the direction of the magnetic stripes in the eye. The visible light breaks the photon through the rings around this muscle and adjusts the intensity of the photons reaching the eyes by protecting it. This muscle is for the blink of an eye. What is seen during the day, and what happens in the night is different. Indeed, one of the nerves in the eye is optical vision. The other one is for quantum vision. Even when the eye muscle is closed, it produces an incredible magnetic force.
A person has two distinct dimensions of two human status. The physical human condition is more about day. The second dimension of the human being is about night. The physical size of the human being slows down with sleep at night, decreasing the material side and strengthening the quantum dimension. The size, which must be fed by dark energy, is fully active during the night. All the cells of a person work at full capacity during the day. At night, the material size of human metabolism and many of its physical activities are suppressed. According to this, the energy between day and night is different. Energy flows into the human body at night, and during the day it is adjusted by the auxiliary organs and muscles. The survival of consciousness in man requires movement, change and revelation. That’s why so far the puzzle of matter and consciousness has not been solved. So, the stuff that’s called matter is created by the motion and the magnetic fields in the universe. Global consciousness cooperates with dark energy. Universal consciousness reaches the human body through wormholes in humans. This state of consciousness in people manifests as vibration and energy. That is, human consciousness depends on the action of consciousness because of the energy that it gets from magnetic fields. So everything seems to be a vibrating matter to man.
The body is made up of cells. Each cell has its own unique frequency Jafari [12]. The higher the frequency of a cell, the greater the ability to use that cell at a quantum size. The cells with the highest frequencies in the human body are brain cells. The parts of the brain that have the highest molecular frequency are magnetic fields. The increasing frequency here increases the activity in the human brain and other organs. The expansion of consciousness depends on frequency increase. The increase in frequency depends on the energy from dark energy. The brain has about 90 to 100 centers. Energy is stored in the brain and other gaps. The physical and spiritual development of man means that cells are constantly in motion and evolve. The energy from dark space is stored in body cavities, where the magnetic field evolves into an electrical signal, and a chemical signal. There are magnetic fields in the universe, solar system and planets. There are magnetic fields in the human body. The universal consciousness that dominates the entire universe arises in these magnetic fields of the human body. Unconsciousness on these magnetic fields, which originate in voids, continues to exist. The consciousness undergoes various changes as dark energy is linked to consciousness and a magnetic field is developed. A magnetic field is not energy. The magnetic fields of light, which we call consciousness, are transformed in the brain and body cavities.
If an intensive magnetic field is formed in the body, the conscious light is changed. Gases, chemicals and certain nutrients have a magnetic function in our bodies. Some chemicals are capable of creating an intense magnetic field. The reason why humans cannot perceive this magnetism is that the anti-oxidant oxidant molecules and the enzymes neutralized by the body due to the toxic gases in our bodies are activated, and the excessive antioxidant activities prevent reactions that create the perception of magnetism in our bodies. That’s why we can’t detect magnetism. Quantum processes occur primarily in the body cavities and then in all body organs. The energy that happens in voids is just how much cells interact with electric and magnetic fields. The light coming into the void causes the electron spin to be entangled, and because this entanglement is sensitive to the magnetic field of the world, it affects a human, and very strong mass gravitational waves are emitted in the voids. Gravity affects the human body and causes the fluids formed due to the magnetic field to increase by pulling them towards the cells. The magnetic field also adjusts the circadian rhythm of the person. People accumulate energy until death to adapt to the next life dimension. Sleep is the energy collection area. Therefore, the holy texts say, “sleep is the brother of death,”, because death is, it is a creation, a formation, a new life dimension, and it’s the beginning of a new formation, not an absence.
Single Oral Dose Toxicity Test of Acorus Gramineus and Stachys Sieboldii Water Extracts and their Mixture in ICR Mice
Introduction
In recent times, with the increasing interest in health and well-being, public attention and demand for functional foods is growing. Herbal medicines and crude drugs are not only used as medicinal resources but also as major food resources, and the range and frequency of their use are gradually increasing [1,2]. This is resulting in a rise in the reckless use of functional foods and natural medicines made from various herbal and crude medicines, with a wide range of products and uses being available without appropriate regulations [3-5]. Due to the belief that natural material-based crude/herbal medicines would be safe because they have been used since a long time and for traditional oriental medicine and home remedies, scientific evidence on their toxicity and adverse effects has not been well established. Therefore, it is essential to lay the scientific foundation and verify the properties of these medicines [6,7]. In addition, in recent years, safety issues pertaining to the human bodies have been more important than ever before, and the value of functional materials with excellent efficacy cannot be well appreciated unless their safety has been confirmed [8,9]. Therefore, the safety of natural material-based crude drugs and herbal medicines should be consistently and systematically established. Accordingly, it is becoming critical to accurately evaluate the toxicity and adverse effects of active ingredients of extracted and purified natural materials using the latest standardized evaluation methods.
Stachys sieboldii Miq. is a herbaceous plant with tuberous stem belonging to the Stachy Linne genus in the Labiatae family [10]. The medicinal part of the root is a tuber-like part that appears like a bulb, which is typically 1–3 cm long and has a conch-like shape. It is described as a spiral shell-like silkworm in China and conch shell in Japan. Stachys sieboldii Miq. originated from China and came into cultivation in the 13th century. It is believed that it arrived in Korea through Japan and began to be cultivated [11,12]. Its root is used as an ingredient for general foods and health functional foods and its main constituents include chlorine; phenylethanoid derivatives such as martynoside and stachyose; and irioid derivatives such as meltoside, satchysoside A, harpagide, 8-acetylharpagide, starchyose, and acetoside, which have excellent antioxidative and anti-inflammatory properties [13]. In contrast, the pharmacological action and efficacy of Acorus gramineus Soland., a plant belonging to the Araceae family, have been reported in old books, such as Bonchogangmok and Donguibogam (Principles and Practice of Eastern Medicine), since ancient times. Acorus gramineus Soland. contains aromatic oils such as asaron, calameone, and eugenol, in addition to starch, acotin, tannin, vitamin C, and alkanoid; it has been known to be effective in improving memory [14], protecting brain cells [15], treating stroke [16], and improving blood lipid levels [17], among others.
According to a recent study, the combination of extracts of Gojiberry, Coix lacryma-jobi L., Alisma canaliculatum, and Astragalus propinquus has an impact on body weight, lipid metabolism, inflammation, and immune function [18], and it was reported that the combined administration of red ginseng and Gastrodia elata increased inhibitory effects on hyperlipidemia and vascular inflammatory diseases compared to their single administration [19]. As such, it has been confirmed that complex extracts increase or improve the effect of single extracts. Further, the use of various complex extracts has also been increasing. In particular, the physiological activities and potential uses of Stachys sieboldii Miq. and Acorus gramineus Soland. extracts have been investigated, but information on the safety and toxicity of their single and combined extracts is limited. In this study, to obtain data on the recently raised toxicity and safety issues caused by the abuse of herbal medicines and crude drugs, we performed a single-dose toxicity study on hot water extracts of Acorus gramineus Soland. (AGS) and Stachys sieboldii Miq. (SSM) and their combination, i.e., complex extract (MIX), using ICR mice to ensure their safety as functional natural materials.
Materials and Methods
Test Animals
SPF ICR mice at the age of 5 weeks obtained from OrientBio Inc. (Seongnam, Korea) were acclimated for 1 week at the animal breeding facility at Binary Inc. Among them, 6-week-old healthy male mice with 27.00 ± 0.96 g of body weight were selected and used in the study. The animals were maintained in a polycarbonate cage with ≤ 5 animals/cage, with the breeding environmental conditions of 23°C ± 3°C temperature, 30% ± 10% relative humidity, 12-hour light (08:00~20:00), and 150~300 lux illumination. The diet for experimental animals consisted of solid feed (OrientBio Inc.), and the water provided was prefiltered tap water. Food and water were provided ad libitum. This animal study was approved by the Institutional Animal Care and Use Committee (IACUC-2018-09) and performed following the approved procedures.
Preparation of Test Materials and Extracts
The dried Acorus gramineus Soland. and Stachys sieboldii Miq. were provided by Kwangdong Pharmaceuticals Inc. (Seoul, Korea). The dried AGS and SSM were extracted with hot water by 90 g each, filtered, and the solvent was removed using a rotary evaporator. After freeze-drying, 14.4% and 33.3% powders respectively were obtained based on dry weight. Individual AGS and SSM hot water extracts were prepared by suspending their powders in sterilized water. The combined/complex extract (MIX) was prepared by mixing them in a 1:1 ratio. Following this, single oral dose toxicity tests for each extract were performed.
Chromatographic Analysis
The two samples (AGS and SSM) was dissolved in 10 mg/mL 50% methanol; its phytochemical composition was analyzed using high-performance liquid chromatography (HPLC) with an Agilent 1260 series HPLC instrument (Agilent Technologies, San Jose, CA, USA) and an Agilent Extend-C18 column (250 × 4.6 mm). The column was operated in gradient mode with a mixture of 0.1% formic acid in water and acetonitrile as solvents (eluent B: 5–95% in 55 min), a flow rate of 1 mL/min, and an injection volume of 10 μL. The chromatograms were recorded at 254 nm and 320 nm, each peak was in the UV/visible spectrum (200–400 nm).
Dose Determination and Administration Method
Experimental group separation was performed on the last day of the acclimation period for all animals, and 60 selected animals were randomized into 8 animals per group to distribute for equal average body weight. As a pretest, two ICR mice were administered with 2,000 mg/10 ml/kg of each AGS, SSM, and MIX at a 2,000 mg/kg dose, which is the standard dose for nontoxic materials established by the US environmental protection agency (US EPA). No mortalities were observed. Hence, 2,000 mg/kg was set as the maximum dose, and a total of six groups, including 1,000 mg/ kg dose and control groups, were selected for the experiments. Since the expected intake route for clinical application of the test substances was oral, the oral administration method was used, and individual dose volumes were calculated based on body weight after fasting on the day of administration according to 10 ml/kg. All test animals were fasted for 12 hours before administration, and extracts were administered intragastrically using an oral gavage needle for oral administration. The control group was administered with the same amount of physiological saline as AGS, SSM, and MIX groups. Feed was restricted for 2 hours after administration, but drinking water was continuously supplied without restriction.
Clinical Signs and Body Weight Monitoring
Clinical signs were observed daily during the acclimation period of 7 days, every hour for 6 hours after administration on the day of AGS, SSM, and MIX administration, and at least once a day from days 1 to 14 after administration. Changes in general conditions, such as skin, hair, eyes, and mucous membranes, the onset of poisoning symptoms, mortality, and possible symptoms after administration were monitored. Also, body weight was measured just before administration and every other day from day 1 to 14 after administration.
Necropsy of Sacrificed Test Animals
The test animals were fasted for 12 hours the night before sacrifice and anesthetized using inhalational anesthesia. Blood collection was performed by laparotomy. The lesions of major internal organs that appear after blood collection and bleeding were visually observed, and histopathological examination was not performed because no gross abnormalities were observed during necropsy. Tissues including liver, heart, kidney, lung, spleen, testes, thymus, and brain were collected, washed ≥3 times with physiological saline, drained, and weighed. For bilateral organs, weights of both sides were measured.
Hematological Analysis
Hematological analysis included complete blood count using hematology analyzer (Coulter counter, Coulter Co., Miami, FL., USA), white blood cell count (WBC), red blood cell count (RBC), hemoglobin levels (HGB), mean corpuscular volume (MCV), mean corpuscular hemoglobin levels (MCH), mean corpuscular hemoglobin concentration (MCHC), platelet count (PLT), etc.
Blood Chemistry Analysis
For blood chemistry analysis, the collected blood was allowed to coagulate for least 30 minutes and then centrifuged at 3,000 rpm for 10 minutes to separate the serum, followed by measurement of aspartate aminotransferase (AST), alanine aminotransferase (ALT), blood urea nitrogen (BUN), creatinine (CREA), and lactate dehydrogenase (LDH) using an automated blood chemistry analyzer (Prestige 24i, Tokyo Boeki Medical System Ltd., Tokyo, Japan).
Statistical Analysis
All results were represented in mean ± standard deviation, calculated using SPSS ver. 22.0 (SPSS Inc., Chicago, IL, USA). To verify the statistical significance for each analysis item of each experimental group, analysis of variance was performed. The Student’s t-test and Duncan’s multiple range test were used to verify the significance of p < 0.05.
Results
Chemical Characterization of AGS and SSM
We used HPLC and LC-MS/MS with ESI to characterize the AGS and SSM extracts. Each major peaks were identified in the HPLC profile of the AGS and SSM extracts. The identification of the chemical compounds was also carried out by comparing the molecular ion peaks along with the MS fragmentation pattern with those of the literature [20]. As shown in (Figure 1A), AGS extract Peaks 1, 2, 3, and 4 were tentatively identified as Verbascoside, Stachysoside B, Isoacteoside, and Stachysoside C, respectively. In addition, SSM extract major peak was tentatively identified as Asarone (Figure 1B).
Figure 1: Fingerprint analysis of AGS and SSM extracts. HPLC and LC-MS/MS analysis of the major compounds from
(A) AGS and
(B) SSM extracts, respectively.
Mortality Rate and LC50 Value
The results of toxicity signs and mortalities caused by SSM, AGS, and MIX in ICR mice are presented in (Table 1). From the result of the 14-day observation period of the treatment group receiving a single oral administration of 1,000 and 2,000 mg/kg doses of AGS, SSM, and MIX and the control group receiving a single oral administration of sterile physiological saline, no mortalities were noted in all groups, including the highest dose group. Therefore, the minimum lethal dose of AGS, SSM, and MIX exceeds 2,000 mg/kg in ICR mice. In addition, lethal concentration 50 (LC50) of AGS, SSM, and MIX is estimated to be over 2,000 mg/kg.
Table 1: Mortality of ICR mice orally administered with AGS, SSM, and MIX.
Note: CON; Control group, AGS1; AGS 2,000 mg/kg (day) medication group, AGS2; AGS 1,000 mg/kg (day) medication group, SSM1; SSM 2,000 mg/kg (day) medication group, SSM2; SSM 1,000 mg/kg medication group, MIX; MIX 2,000 mg/kg (day) medication group. *Values are expressed as Number of dead animals/ Number of animals examined.
Drinking, Feed Intake and Clinical Signs
After comparing the changes in drinking yield and feed intake by single oral administration of AGS, SSM, and MIX in the treatment groups with the control group receiving a single oral administration of sterile physiological saline, administration of the test substances did not result in any significant differences in the changes in drinking yield and feed intake (data not shown). Further, no abnormal findings in clinical symptoms related to single oral administration of sterile physiological saline, AGS, SSM, and MIX were observed, including hair loss, activity decline, gait disorder, behavior disorder, squat, diarrhea, swelling, dyspnea, grooming, jumping, tearing, lethargy, polyuria, vomiting, nasal discharge, numbness, suppleness, etc. (data not shown).
Changes in Bodyweight
The results of changes in bodyweight of the treatment and control groups are presented in (Table 2). After oral administration, normal weight gain over time was observed in the AGS, SSM, and MIX administration groups and the control group compared to the weight before administration. No significant weight change was noted after administration, compared to that before administration, in the treatment (AGS, SSM, and MIX administration) and control groups, indicating no toxicity.
Table 2: Body weights changes of ICR mice orally administered with AGS, SSM, and MIXb.
Note: CON; Control group, AGS1; AGS 2,000 mg/kg (day) medication group, AGS2; AGS 1,000 mg/kg (day) medication group, SSM1; SSM 2,000 mg/kg (day) medication group, SSM2; SSM 1,000 mg/kg medication group, MIX; MIX 2,000 mg/kg (day) medication group. The data are presented as mean ± standard deviation. *Day after AGS, SSM, and MIX administration.
Necropsy Results and Change in Organ Weight
The results of gross findings on major organs by necropsy of all ICR mice after the 14-day observation period are presented in (Table 3). There were no gross abnormalities or abnormal lesions on major internal organs suspected of causing abnormalities by the administration of test substances in all animals in the control and treatment groups. In addition, no significant changes in the weights of the thymus, lungs, heart, spleen, liver, kidney, testes, and brain were observed in the treatment groups compared with that in the control group.
Table 3: Organ weights of ICR mice orally administered with AGS, SSM, and MIX.
Note: CON; Control group, AGS1; AGS 2,000 mg/kg (day) medication group, AGS2; AGS 1,000 mg/kg (day) medication group, SSM1; SSM 2,000 mg/kg (day) medication group, SSM2; SSM 1,000 mg/kg medication group, MIX; MIX 2,000 mg/kg (day) medication group. The data are presented as mean ± standard deviation.
Hematological Analysis
The evaluation of WBC, RBC, HGB, HCT, MCV, MCH, MCHC, and PLT using a hematological analyzer was used to investigate hematological changes 14 days after oral administration of either sterile physiological saline, AGS, SSM, or MIX. The results of this evaluation are shown in (Table 4). From the results of hematological analysis on collected whole blood from the treatment and control groups, PLT in the groups treated with AGS, SSM, and MIX showed slight reduction compared to the control group, albeit not significantly. The other categories showed no significant changes between the control group and the treatment groups.
Table 4: Hematological analysis of ICR mice orally administered with AGS, SSM, and MIX.
Note: CON; Control group, AGS1; AGS 2,000 mg/kg (day) medication group, AGS2; AGS 1,000 mg/kg (day) medication group, SSM1; SSM 2,000 mg/kg (day) medication group, SSM2; SSM 1,000 mg/kg medication group, MIX; MIX 2,000 mg/kg (day) medication group. The data are presented as mean ± standard deviation.
Blood Chemistry Analysis
The results of serum ALT, AST, BUN, CREA, and LDH values measured using an automated blood chemistry analyzer for investigating blood biochemical changes after 14 days in the treatment and control groups are shown in (Table 5). It was found that a single oral administration of AGS, SSM, and MIX induced a slight change in the test parameters, but in general, no significant changes were observed in all indicators between the control group and the treatment groups.
Table 5: Blood chemistry analysis of ICR mice orally administered with AGS, SSM, and MIX.
Note: CON; Control group, AGS1; AGS 2,000 mg/kg (day) medication group, AGS2; AGS 1,000 mg/kg (day) medication group, SSM1; SSM 2,000 mg/kg (day) medication group, SSM2; SSM 1,000 mg/kg medication group, MIX; MIX 2,000 mg/kg (day) medication group. The data are presented as mean ± standard deviation.
Discussion
Recently, various types of medicines are being used, but problems such as adverse effects due to toxicity also appear. Not only is the interest in functional foods and natural medicines using herbal medicines and crude drugs is increasing worldwide but also their effect and efficacy are being verified, owing to an increasing demand for various forms of natural-product derived pharmaceuticals [21,22]. However, in the general practice of natural medicine, which prescribes a combination of various crude drugs, exact ingredients and specifications are not well established and data on their safety and toxicity are often insufficient, thereby necessitating specific and accurate information on them [6,7,23]. Therefore, in this study, to obtain an objective basis for the safety of AGS, SSM, and MIX and experimentally evaluate their acute toxicity, the observation of clinical symptoms, necropsy findings, mortality, and weight change, and hematological analysis were conducted after administering the test substance to ICR mice. First, an acute toxicity test was performed to confirm the safety of AGS, SSM, and MIX, following which all subjects in the treatment groups treated with AGS, SSM, and MIX as well the control group treated with sterile physiological saline showed no mortality and no significant change in body weight.
Therefore, based on the US EPA standards that classify a substance safe if its LD50 value by oral administration is >2,000 mg/ kg, AGS, SSM, and MIX are considered to be very safe in terms of acute toxicity. Next, from the result of gross examination and organ weight measurement by necropsy to confirm the effects of AGS, SSM, and MIX on the major internal organs, no gross abnormalities or abnormal lesions were observed and no significant changes in the weights of major organs, such as the thymus, lungs, heart, spleen, liver, kidney, testes, and brain, were observed. In general, in a single-dose toxicity study, if gross abnormalities in organs or tissues are observed, histopathological examination should be performed. However, in this study, histopathological examination was not performed as no gross abnormalities were observed in all experimental animals. Also, hematological and blood chemistry analyses using whole blood and serum, respectively, collected at the end of the observation period revealed slight changes in some test parameters, but in general, no significant changes were noted in terms of AGS, SSM, and MIX treatment in all test parameters. In summary, as AGS, SSM, and MIX did not show any acute toxicity on the test animals, they could be considered relatively safe for oral administration. In addition, they can be expected to be used as natural materials without acute toxicity through further investigation of their physiological effects.
However, there are some limitations of determining the toxicity of natural herbal medicines through only a single oral administration acute toxicity study. Hence, it is necessary to conduct repeated oral administration toxicity studies for additional 2 or 4 weeks and 13 weeks (long term) and genotoxicity studies subsequently. In addition, further research on human safety evaluation is essential, based on which more precise and scientifically accurate safety data can be obtained by establishing systematic toxicity information on AGS, SSM, and MIX.
A Current Glance Regarding the Experience of Cuban Vaccination Advance Against COVID-19
Introduction
When COVID-19 arrived in Cuba, the government immediately mobilized its public health system and biotech industry. By 2020 in this country, the total number of infected cases and deaths corresponded to one of the lowest rates in the Western Hemisphere; however, the reopening of airports in November of that year caused a new increase. Despite this, the case fatality rate among infected people in mid-March 2021 was only 0.59% compared to a global average of 2.2% [1]. Cuba’s biotechnology industry seeks to meet the needs of the public health sector. Dozens of academic, research and development institutions collaborate extensively and continuously on it, sharing their resources and knowledge, all of which have been essential in the development of vaccines against COVID-19.
The Cuban vaccines Abdala, Soberana 02 and Soberana Plus against COVID-19 are self-produced and it is planned to supply them at a reduced cost to other countries [2]. They are protein subunit vaccines; this means that they are composed of a synthetic fraction of the S protein of SARS-CoV-2 (called RBD, receptor binding domain) that binds to human cells, which generates neutralizing antibodies that block the bonding process [3]. This design was chosen precisely because of the experience accumulated in Cuba with subunit vaccine production platforms [3]. The first works date back to August 1st, 2020. An efficacy of more than 90% of these vaccines against COVID-19 is recognized nowadays.
Although Cuban vaccines are not the only ones that use this strategy, Soberana 02 is unique because it combines the antigen receptor-binding domain with an inactivated form of tetanus to enhance the immune response (conjugate vaccine). The Soberana 02 and Soberana Plus vaccines are produced by the Finlay Institute in partnership with the Center of Molecular Immunology and the National Center for Biopreparations. The mechanism of action of these consists of inserting genetic information into cells of higher mammals. Soberana Plus has been intended for convalescent patients initially. Abdala is based on the insertion of viral genetic information in the Pichia pastoris yeast and is produced at the Center of Genetic Engineering and Biotechnology [1].
Since the vaccines are stable at temperatures of 2 to 8ºC, there is no need of an additional investment in specialized refrigeration equipment. In addition, several countries expressed interest in participating in clinical trials of these vaccines during 2021, including: Iran, Venezuela, Mexico, Jamaica, Vietnam, Pakistan, India and the African Union (on behalf of the 55 nations) [1]. It was specifically in May 2021, that it was decided to start mass vaccination in Cuba [3]. The data obtained to date regarding the duration of the immune response with Cuban vaccines show antibody titers up to eight months. Currently, with more than 95% of its population fully vaccinated against COVID-19 and with the number of daily infections and deaths from the virus in drastic decline, Cuba is making progress in controlling the epidemic after months of confinement. The effort seems to be paying off, because the health authorities reported in November 2021 a recovery rate of 99.1% of those who have become ill [4]. According to what was reported in Our World in Data [5], 34 million doses had been administered on January 26th, 2022. This same source offers evidence of the vertiginous increase in the percentage of the population completely immunized in May, August and December 2021, with numbers of 0.6%, 42.0% and 90.2% respectively.
The vaccination of the child population between 2 and 18 years old is also progressing at a good pace. It was on March 1st, 2020 that the first pediatric patient was diagnosed in the country. In September of that year, Cuba began the first National Children’s Campaign against COVID-19 worldwide, which made it possible to achieve high vaccination coverage and a significant impact in reducing the transmission of SARS-CoV-2 based on Soberana 02 [6]. The main reasons that led to vaccination in this age range were:
1. The increase in the number of infections in these groups due to the appearance of more contagious variants of the virus and its greater displacement from the already vaccinated adult population to infants and
2. Despite the fact that the asymptomatic form is the most common in these cases, it has been proven that diverse sequels persist even after mild and moderate forms.
In parallel, the vaccination campaign on the island is already in the stage of applying booster doses, to face the threat posed by the new Ómicron variant. By December 2021 in Cuba, the detection of six people infected with Ómicron had been reported, four of them Cubans and two tourists from South Africa, Kenya and Mozambique. Those over 18 years old will receive a booster dose with Abdala or Soberana Plus six months after completion of the primary vaccination schedule. This vaccination campaign began in November 2021 and should end in the first half of 2022 [7]. Stratification will be made by risk groups: priority
1. Researchers and health workers, tourism personnel, customs, carriers, teachers and military personnel; priority
2. Population over sixty years of age, pregnant women and patients with comorbidities; priority
3. Rest of the adult population. The data shows the favorable evolution of the process during December 20th and 31st in 2021, with values of 7.9% and 14.4%. A significant increase in the population vaccinated with the booster dose was evidenced until January 26th, 2022, with 44.6% of Cubans with this dose [5].
Final Considerations
In general, the Cuban population shows a high level of acceptance of the applied COVID-19 vaccines, which constitutes a threshold element in the achievement of increasingly encouraging results. Regarding the new Ómicron strain, it is considered that although the Cuban territory has a significant degree of immunity, the health alert must be maintained and surveillance measures must be reinforced, especially at the borders. A call is made to the world population about not to trust and the need to learn how to live with the disease in a responsible way.