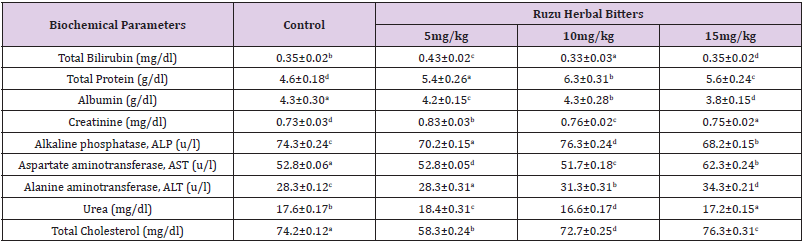
Biomedical Journal of Scientific & Technical Research (BJSTR) is a multidisciplinary, scholarly Open Access publisher focused on Genetic, Biomedical and Remedial missions in relation with Technical Knowledge as well.
In Vivo Simultaneous Neurochemical, Electrophysiological and Behavioural Analysis of the Putative Antidepressant and Motor Stimulating Properties of Nociceptin/Orphanin FQ (N/ OFQ) Receptor Antagonists: A Research Proposal
Introduction
Nociceptin/Orphanin FQ (N/OFQ) is a 17 amino acid endogenous opioid-like neuropeptide [1] that activates a G-protein coupled nociceptin opioid peptide receptor [2,3], named NOP [4].The N/OFQ-NOP receptor system is widely represented throughout the rodent [5,6], primate [7] and human [8] CNS. Established neurobehavioral techniques as well as radio-imaging technologies have been applied to investigate this system in animals and humans, in particular on the role of N/OFQ in the control of feeding, body weight homeostasis, stress, depression, anxiety, and in drug and alcohol dependence [9] and for reviews [10,11]. In rodents the N/OFQ receptor system is widely expressed in cortical and subcortical motor areas [5] and is involved in the modulation of a number of biological actions [12] for a review [13]. Previous works demonstrated that Intra-Cerebroventricular (I.C.V.) administration of N/OFQ has been consistently shown to inhibit spontaneous locomotion [14,15] as well as motor activity stimulated by pharmacological agents [16,17].
Alternatively other experiments showed that Nociceptin administered Intra-Cerebroventricularly (I.C.V.) at doses of 2, 5 and 10 nmol/rat changed neither DA nor metabolites release in the shell of the nucleus accumbens or in the nucleus caudate but was able to reduce morphine-induced DA and metabolites release in the shell of the nucleus accumbens, therefore possibly acting mainly as modulator of neurochemical and behavioral influence of drugs of abuse [18,19]. Endogenous N/OFQ also inhibits motor behaviour since pharmacological or genetic blockade of N/OFQ transmission increases locomotor performance on the rotarod [20]. Early pharmacological evidence also supports a role for the N/OFQ-NOP receptor system in the modulation of mood related behaviours in rodents, i.e. two chemically unrelated NOP receptor antagonists, the peptide [Nphe’]N/OFQ(l-13)NH2 and the non-peptide J-l 13397, reduced the immobility time of mice in the forced swimming test (FST); [21] test that has been proved to be of utility to predict the clinical efficacy of antidepressants in rodents [22].
Later, these results were obtained also with the NOP receptor peptide antagonist UFP-101, i.e. in rodents administered i.c.v. it was followed by reduction of the immobility time and by increase of the climbing behaviour in rats submitted to the forced swimming test. These data were further supported with genetic observations, i.e. by challenging knockout mice [23] in the forced swimming and tail suspension tests [24]. Additionally, chronic treatment with UFP-101 produced antidepressant-like effects in rats subjected to a validated animal model of depression: the Chronic Mild Stress (CMS) [25]. The neurochemical substrate involved in the motor depressant action of endogenous N/OFQ and ii) the antidepressant-like action of NOP receptor antagonists is still matter of investigation. The motor depressant action of endogenous N/OFQ has been related to N/OFQ ability to inhibit dopaminergic transmission along the nigrostriatal pathway, since NOP receptor antagonists evoked striatal Dopamine (DA) release in the rat [20]. However, the influence of N/OFQ upon DA system is controversial as other works have shown that: a. Nociceptin administered Intra-Cerebroventricularly (I.C.V.) at doses of 2, 5 and 10 nmol/rat changed neither DA nor metabolites release in the shell of the nucleus accumbens or in the nucleus caudate [18].
b. Orphanin FQ when applied to the ventral tegmental area of anesthetized rats by reverse dialysis at a probe concentration of 1 mM (but not at 0.1 mM) significantly reduced dopamine levels sampled with a second dialysis probe in the nucleusaccumbens. In contrast, the receptor-inactive analogue, des-Phe1 Orphanin FQ (1 mM), produced a small but significant increase in nucleus accumbens dialysate dopamine levels [26].
c. In vivo microdialysis studies have shown a large increase ofdopamine release (in the order of 350-390% of control values)in striatum when treating conscious rats with nociceptin at themicro molar concentration [27].
Finally, in his review [28] reported about both facilitatory and inhibitory motor actions of N/OFQ and that both these effects were abolished in animals in which tyrosine hydroxylase (TH) activity was inhibited, indicating that endogenous DA is critical for both events [14]. In particular, [29] previously noted that the facilitatory effects of low doses of N/OFQ were abolished by haloperidol treatment, proposing a role for D2 receptors. Again, in more recent work, we have observed either increase or decrease of DA levels monitored with differential pulse voltammetry (DPV) in the Substancia Nigra (SN) of anaesthetized rats, depending on the amount of N/OFQ injected locally into the SN [30]. On the other hand, what appears more consistent as an effect of N/OFQ is the [negative] influence upon serotoninergic activities. Indeed, in earlier studies performed with DPV we have shown that microinjection of N/OFQ in the Substantia Nigra Reticulata (SNr) inhibits local serotonin (5-HT) release in anaesthetized rats [31,30].
Facilitation of serotonergic transmission in the SNr enhances locomotion in rodents [32,33] and both dopaminergic and serotonergic transmission is increased in the SNr and striatum during continuous motor execution [34,35]. Moreover, some authors have suggested that the antidepressant action of NOP receptor antagonists is due to blockade of N/OFQ inhibition of central serotonergic transmission at two different levels: at the dorsal raphe nucleus (RDN) neurons, where N/OFQ causes hyperpolarization by increasing a K+ conductance [36,28], and at cortical serotonergic nerve terminals, where N/OFQ inhibits 5-HT release [37,38]. It has been observed that local injection of N/OFQ into the hippocampus markedly decreased exploratory locomotor activity including vertical movements (rearing) in rats [39]. Furthermore it has been shown that it elicits hypo locomotion in rats submitted to elevated plus maze and in the conditioned defensive burying test [40].
Thus, our hypothesis is that continuous motor activity may cause release of endogenous N/OFQ which therefore may act upon DA and subsequently upon 5-HT release in the basal ganglia, as previously observed in the SN, resulting in impaired locomotion. To prove this hypothesis, a specific study will be undertaken in awake rats prepared for voltammetry – electrophysiology recordings as already described [41,42]. In addition , these rodents will be freely moving and therefore subjected to behavioral tests (i.e. the rotarod or the forced swimming test) by employing a telemetric system that allows to correlate on line and with high-time resolution both neurochemical and behavioural parameters [43,44]. Furthermore, concomitant voltammetric and electrophysiological changes of the dopaminergic and serotonergic systems will be performed at two different levels: cell bodies (i.e. SNr, RDN) and relevant nerve terminals i.e. amygdale, hippocampus, cortex, as previously described [40,45,46].
Project Strategy
Animals: The difference between strains of rats has to be taken into consideration as it appears that combined behaviouralvoltammetric investigations suggest that “behavioural despair” is the process interesting Wistar rats when submitted to FST while “learning to be immobile” is the process involving Sprague-Dawley CD rats [47].
Voltammetric Analysis and Behavior: Voltammetric analysis of 5-HT and DA release [48,44,31] will be performed in the SNr and dorsolateral striatum (DLS) of awake rats at rest and during performance on the rotarod. Then, the effect of selective NOP receptor agonists and antagonists (either injected into the SNr or given systemically) on nigral and striatal 5-HT and DA release will be investigated. Among agonists, N/OFQ will be tested while among antagonists, the peptide compound UFP-101 [49] and the non-peptide compound J-l 13397 [48] will be used. This will allow correlation between changes of 5-HT and DA release and motor effects of NOP receptor ligands. A telemetric system will be implemented to transmit data from the electrodes to the recording system [40,43].
Concomitant Electrophysiological Analysis performed in the cell bodiesand relevant terminal brain areas of anaesthetised rats [7] will give information on the effect of N/OFQ or NOP receptor blockade on cell firing. The feasibility of telemetric electrophysiological monitoring in conscious rats would be also assessed in order to correlate these outcomes with the biochemical data gathered in rotarod-behaving animals. In the attempt to verify the putative antidepressant action of NOP receptor antagonists the correlation between cortical 5-HT levels and the behavioural effects induced by the NOP antagonist UFP-101 will be analysed in rats subjected to the forced swimming test (FST) as previously described [50]. Briefly, in conscious rats previously prepared for voltammetric analysis in the cerebral cortex, an i.c.v. administration of UFP-101 at 1 and 10 nmol/rat will be performed 5 min before the FST. Three behavioral parameters, previously shown to be reliable and validated for the detection of antidepressant drug effects in the rat FST, will be scored:
a. Immobility time
b. Swimming time
c. Climbing time
Real time in vivo voltammetric measurement of 5-HT levels in the cerebral cortex will be assessed in rats before, during and after the FST, in order to correlate the behavioural effects induced by central administration of UFP-101 with 5-HT levels in the cerebral cortex.
Conclusion
It is known that the generation of specific agonists, antagonists and receptor deficient mice and rats has enabled progress in elucidating the biological functions of N/OFQ receptor system. Furthermore it has been shown that UFP-101 exhibits pronounced antidepressant-like effects in different species and animal models, possibly by preventing the inhibitory effects of endogenous N/OFQ on brain monoaminergic (in particular serotonergic) neurotransmission. The present experiments will possibly further support the involvement of the N/OFQ-NOP receptor system in mood modulation so that it can be proposed as another potential targets for antidepressant drug development.
Use of App-Based and Voice-Guided Techniques to Increase a Concentration of Children with Autism Spectrum Disorder
Introduction
Autism spectrum disorder (ASD) affects children’s lives and their development while ninterfering with their ability to communicate and interact with other children and adults [1]. This not only influences their home life but also can be particularly challenging when it comes to their success in school, especially in noisy environments such as classrooms [1-5]. Children with ASD can become passive and struggle to keep a focus on auditory stimuli like the voice of the teacher [6]. Limited abilities in selfregulating emotional and behavioural feedback may also affect their educational advance [7,8]. Children with tactile sensitivity are more likely to be inattentive and distractible in the classroom. Interventions that reduce unpredictable tactile input need further exploration and new tools [9]. One of such sensory deprivation tools might be a frequency modulation (FM) system. The first study with using of wireless listening technology in children with autism was proposed by Rance et al. [4]. The results showed that the children heard and communicated better using wireless technology.
The research indicates that FM systems are the most common assistive listening devices used in classrooms by students with hearing loss. The benefits provided by these devices have resulted in an expansion of their application to extend beyond individuals with severe-to-profound hearing loss to individuals with minimal, conductive, and fluctuating hearing loss, as well as individuals with normal hearing who have additional learning problems. All these advantages were studied and scientifically justified [10-15]. A technological approach of FM that scientific studies have proven can help children with ASD to concentrate better on the speaker’s words. The use of an FM system is not a form of therapy; it is merely a technology that makes it easier for a child to focus on what is being said. Phonak Field Study News announced that their testing showed that children who wore frequency modulation (FM) system had improved their speech understanding by an average of 53% compared to children who did not wear the technology [16].
Furthermore, several studies have reported that FM systems help achieve improving speech perception and speech recognition by 17% [4]; augment children’s attentiveness, awareness and demeanour [4]; and boost listening and concentration abilities [17]. Latter abilities have been identified as the most significant factors affecting academic performance [9]. Only handful of studies of the advantages of non-traditional use of FM systems for children with ASD have been published and reported promising results after using the FM system in decreasing withdrawal and improved behaviour in the children [4,6,9,18,19]. In 2013, the study published by Schafer et al. [18] on the use of FM system for children with ASD and children with attention-deficit/hyperactivity disorder (ADHD) showed that the application of the FM system highly improved speech recognition. Sustained use of FM listening devices can enhance speech perception in a noisy environment, aid social interaction, and improve educational outcomes in children with ASD [4].
One of the most acceptable sensory deprivation measures for children with communication and social impairment, specifically ASD, are often used educational and recreational applications (apps) within the context of their home and school settings. An advantage of app-based learning by extending the learning environment was seen in many studies [4,20-27]. The present study uses both abovementioned tools: FM system and an app. It is focused on improving concentration outcomes for children with ASD via app-based performance and social behaviour using the voice-guided system. The main objectives were to investigate the potential benefit of an FM system for attentively and concentration of children with ASD. The following research questions were addressed: the use of an FM system increases the concentration of the child and facilitate focus on specific tasks; eye contact is more frequent, and it is easier for the child to be interested and involved in activities.
Materials and Methods
Participants
The experiment was a part of the educational process at primary special schools. All procedures performed in studies involving human participants were in accordance with ethical standards and with the 1964 Helsinki Declaration as revised in 2000 (Ethical agreement R-I-002/350/2018). Teachers and parents were instructed and agreed to incorporate the technical tools we offer into their daily activities and subsequently evaluate the results. The consents of all participants were obtained. The first group of participants were 16 children (13 boys and 3 girls), diagnosed with ASD, aged from 9 to 12 years (mean age 10 ± 1.2 years) Inclusion criteria were: children should be 9 to 12 years of age, confirmed autism diagnosis; a hearing should be within normal limits. Children with ASD were excluded if they had an additional intellectual, hearing, visual, or physical impairment or were currently receiving occupational therapy to address sensoryprocessing issues. Children with cochlear implants, hearing aids, or other types of corrective hearing devices were not considered.
The second group were the parents of the children. Parents took the FM systems home and helped the child to get used to it as well as observed their child and evaluated his learning/concentration/ communication outcomes. The third group consisted of 5 teachers who taught them on a daily basis. Teachers observed the children during the tasks with and without the FM system. They presented their observations and assessments in the survey responses. Both parents and teachers were trained to use the voice-guided system according to standardized conditions as well as how to instruct the child during the task performance with it and without.
Voice-Guided System
In our study, four Phonak (Sonova, Switzerland) personal FM systems consisting of behind-the-ear Roger Focus receiver together with Roger Pen microphone were used. It offers typically developing hearing children the ability to clearly hear and focus on all relevant speech information required for his or her development and learning. A recommended real-ear measure for fitting Hearing Assistance Technology (HAT) on children with normal hearing was used. The FM system allows transmitting the teacher’s/parent’s voice directly into the child’s ear at controllable volume. However, due to the increased tactile sensitivity, some children with ASD may not accept FM receivers. And we were ready for that. We got the kids used to the headphones slowly. During the study, the parameters of the FM receivers were set to the default values set by the manufacturer: audio signal output (out of the box) 68 dBA free-field equivalent (transmitter in compression, fmod = 1 kHz, surrounding noise level <58 dB SPL (SPL – sound pressure level); volume range -8 dB to +8 dB; frequency range 100 Hz – 7.2 kHz. The examiners or parents through listening checks verified operation of the FM system before each trial.
Tablet and Drawing Application
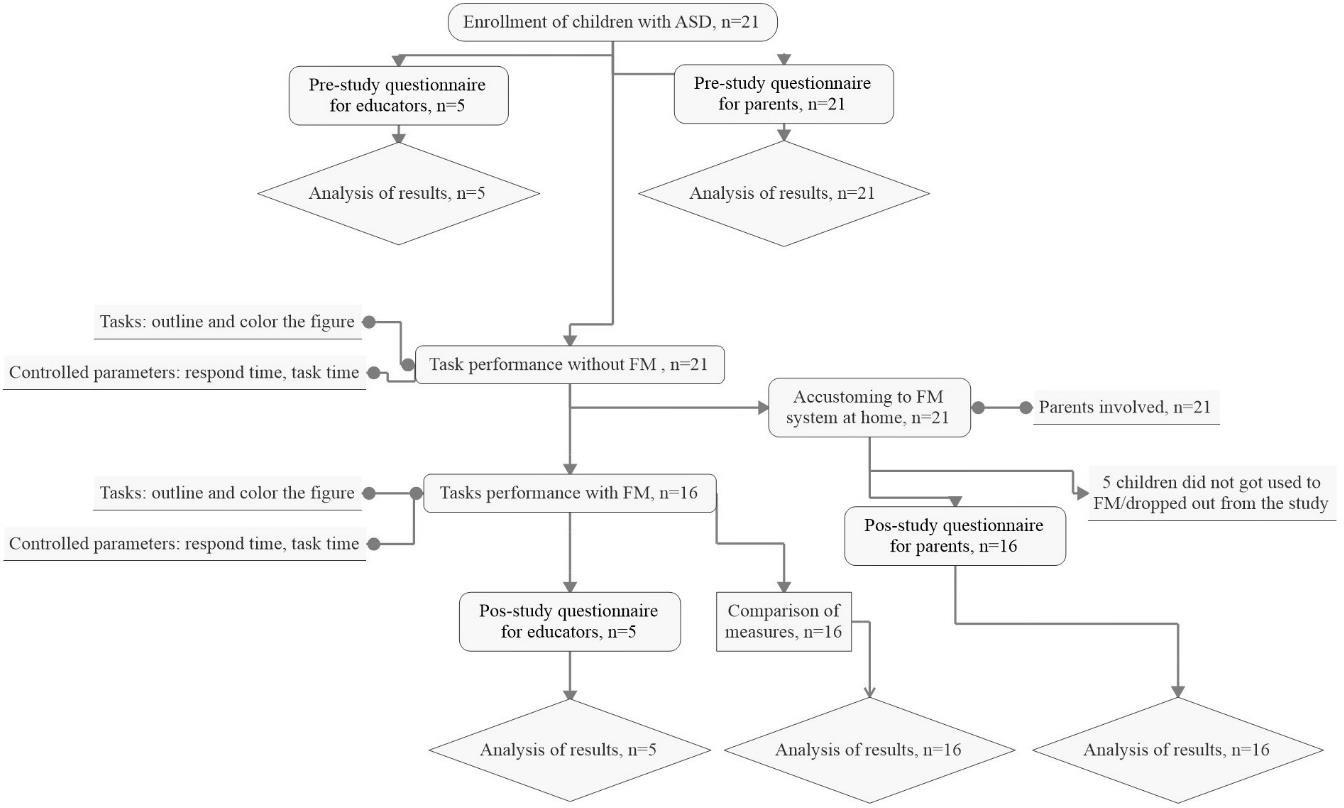
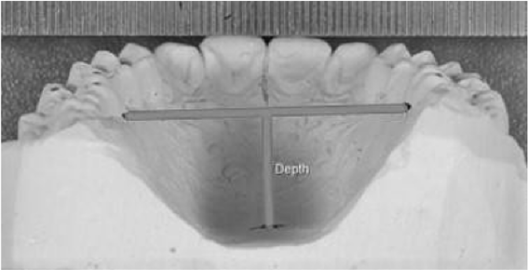
Figure 1: Shape and colour options in the Drawing App.
Tablets and apps are willingly used by ASD children; therefore, it was involved in the study to design the unified and inclusive educational process. To ensure the same conditions for all participants in the study, the use of existing tablet applications was discarded. A custom new drawing app that could help formulate simple, well-understood tasks for children was created. In the app, one can choose the shape and colour; in fact, colour and shape are two very noticeable attributes of the world around us. Understanding colour and shape is recognized as a tool for learning many skills in life. Four shapes: circle, oval, triangle and square are available (Figure 1). Two simple tasks were designed: to outline the selected shape and to colour it. The response time (how fast the child reacted to the task he was given) and the task time (how fast a child performs a task) were captured automatically since the task was accomplished. Refusals to perform the task were also recorded.
Experimental Design and Procedure
The “before-after” experiment was designed (Figure 2). After children enrolment to the study, parents were introduced to appbased and voice-guided platform and asked to use FM system for 10 days at home and school as much and as long as it possible and in all activities of daily living. Parents helped kids to get used to the proposed tool, and completed a report to indicate how long the child used the app and FM system at home during the 10 days. Study tasks were included in children day-to-day learning environment as well. The children who participated in the study worked in their normal routine. And once they get used to the voice guided system the teacher worked with each of them individually. The children needed to perform two basic tasks on the tablet by listening to the teacher’s instructions aloud and using the voiceguided system: outline selected geometric figure, and after colour it. During FM system usage in the class, children not only perform tasks but also communicate with teachers. To obtain the most accurate results of the study, it was conducted by the following conditions: the tasks were identical; tasks without the FM system (no FM) and with the FM system were performed at the same time of day during lessons while the children are still accustomed to working; the task was performed by children in their classroom, at their school desk; teachers were prepared to instruct kids during the tasks’ performance in both conditions (no FM and FM) and encourage continuing and improving.
Figure 2: Experiment flow chart.
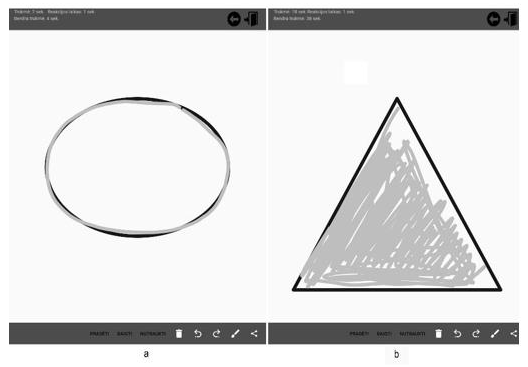
An app operation: first, the child must enter his name. If the child fails to do so, the teacher enters. Then the child can choose the colour. The teacher gives instructions: which figure he must choose, specifies to outline it as accurate and as quick as possible (Figure 3a). In the same order, the child is required to outline all 4 shapes – circle, ellipse, triangle and square. Upon completing this task, moving to the next – the colouring of the figures while leaving as little as possible white space (Figure 3b). The colouring area was captured. All the tasks performed under the teacher supervision and all the time instructing and encouraging. The response and task completing times were recorded automatically. The response time is the time measured from the moment when a child chooses a geometric shape to when it starts outlining or colouring it (depending on the task), from the first touch of the screen with his finger. Meanwhile, the task completing time begins from the first touch to the end of the task. Teachers were asked to complete the questionnaire composed according to the literature [18] about children concentration and communication. The first part of the questionnaire (pre-study) consisting of 8 questions was given to educators before they completed the study to find out the abilities and behaviour of children at school. The second part (4 questions) – post-study – after measures were completed. Parents were asked to complete the questionnaire of 9 main questions about the kid concentration and communication during FM system usage.
Figure 3: Tasks in the Drawing app:
a) To outline the shape;
b) To colour the shape.
Statistical Analysis
Collected data were analysed using Statistica 13.1 (StatSoft, USA)). The Lilliefors normality test (p < 0.05) was used to test data normality. The Cohen’s value d was calculated to evaluate effect size of FM system: d = 0.01 – very small effect size, d = 0.20 – small effect size, d = 0.50 – medium effect, size, d = 0.80 – large effect size, d = 1.20 – very large effect size, d = 2.00 – huge effect size [27]. Normally distributed data were compared utilizing the parametric statistical method, i.e., one-way analysis of variance ANOVA (with significance level α=0.05); data that were not normally distributed (α=0.05) were compared by employing a non-parametric statistical method, i.e., Kruskal–Wallis test (p<0.05). With regard to the relationship between quantitative variables the normally distributed data are represented as mean ± SD, while the non-normally distributed data are represented by median.
Results
No specific characteristics were observed among the boys and girls involved in the study, so gender will not be considered when evaluating the results. The potential differences in the amount of the intervention that participants received were not statistically significant (p>0.05). Since the parents had agreed to perform the test anonymously, children’ results were not marked by names and numbers.
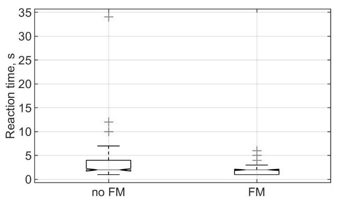
Response time
The analysis of total measured response time (Figure 4) revealed a significant main effect of listening conditions (in the way of use FM systems and favouring the FM use) with p = 0.000002. The gain from the FM system yielded an effect size of d = 0.372. This effect is considered medium according to Cohen [29]. Analysis of on-task behaviour results presented in Table 1.
Figure 4: Total response time in different listening conditions no FM and FM.
Table 1: Response time, n = 16.
Note: Values presented as means ±SD, *indicates significant differences (p<0.05).
Task time
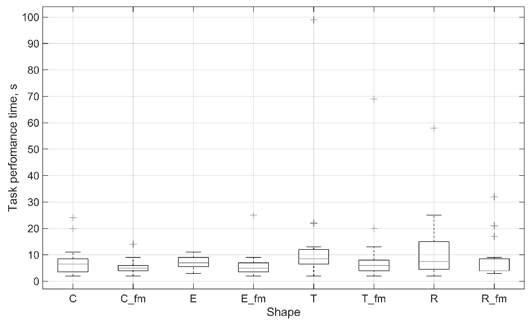
Outlining and colouring of the shape are different tasks and were differently accepted by children with ASD. Each individual case might be analysed separately since they are seen as very different tasks. Thus, the variability of the results is very high. Trying to summarise results it was determined, that outlining task is shorter exercise compared to colouring and total performance time yielded meaningful benefit from using the FM system with p = 0.0075 (Figure 5). The magnitude of the benefit of the FM system yielded effect size d = 0.43, which was considered medium according to Cohen [27]. Colouring task required children to maintain attention longer. The results did not show a significant difference between performing no FM and FM exercise, it has been observed that, by inviting children to perform the task through the FM system, they focused on the task longer and covered the larger area. One participant refused to colour the figures when tasks were performed without the FM system. However, he performed the task using the FM system. Since there was no measured colouring time at no FM condition, it was not possible to compare results. Therefore, the Figure 6 represents only results of 15 participants’ at colouring task.
Figure 5: The time of outlining under different listening conditions, where C – circle, E – ellipse, T – triangle, R – rectangle.
Figure 6: The time of colouring under different listening conditions, where C – circle, E – ellipse, T – triangle, R – rectangle.
Questionnaire
The first questionnaire was given to educators before the study to find out the abilities and behaviour of children at school. Pre-study questionnaire’s results are displayed in Table 2. After the study was completed the questionnaire for educators had 4 main questions and results are presented in Table 3. The results show, that 87.5 % of teachers estimated that children using the FM system have increased eye contact in daily activities. They noted that it was easier to communicate with the child, who immediately drew attention to what the teacher was saying. When the child heard the teacher’s words straight into the ear, he directed his attention to him, what allowed the teacher to communicate using emotions. It was much easier to get the child interested in doing a new task or leaving his comfort zone, for example, dare to go out to another class or yard. The nine questions questionnaire was given to the parents. Before the study, they answered three of the same questions as educators did (Table 2, No 1, 3 and 4). After investigation, they completed the same questionnaire plus two additional questions. All results are presented in Table 4.
Table 2: Pre-study questionnaire for educators, n=5.
Note: *The values are given in sample percentage
Table 3: Post-study questionnaire for educators, n=5.
Note: *The values are given in sample percentage
Table 4: Questionnaire for parents, n=16.
Note: *The values are given in sample percentage
For example, parents noticed that after using the FM system, the child became more open to communication. 56.25 % of parents noticed that children feel better in unknown environments; for example, in a grocery store the child was calmer, less stressful than ever when they used headphones and heard the voice of their parents. Total 68.75 % of parents were more satisfied that while using the voice-guided system it was much easier to communicate with the child. It seems that the child always listens and responds more often to the question or suggestion of doing household/ educational work.
Discussion
Before starting to discuss the results of the study, it is needed to go back and to make a note that five potential participants of this investigation have not accustomed to the FM receivers and dropped out. It turned out that the reasons for this were sensory disturbances. The FM receiver, which is worn on the ear, was accepted as a strong external stimulus; therefore, they simply pushed the receiver from the ear, even without having to turn it on. Previous studies also declare that children had tactile sensitivities to the receivers [4,18]. If it is desired to include sensitive children in programs or classes that deal with FM systems, first recommendations should be given to a company on possible modifications to the receiver design in response to children with ASD reactions and acceptance. Longer trials with FM system might diminish sensory disturbances of users. By compiling our research methodology and looking at the results of the investigations already done [9], we realized that the FM system alone will not be enough to increase the efficiency of the educational process and social skills of children with ASD. It is evident that a complex and balanced ,package of measures is required.
Teachers, parents, and the relevance of the tools used play an important role here [17]. We observed that it is very important the way of giving instructions during the task’s ant the frequency of it. Children with ASD may be able to avoid complex visual input by averting the eyes or narrowing the focus of visual attention and to actively avoid sources of unpredictable tactile input. Environmental auditory input, however, is more difficult to escape. It is known that children with ASD willingly used various gadgets and learned some skills [24–26,28]. We also knew that there were many different software applications available [26], so we looked for the task environment and themes to be unseen and new to them. Our measured parameters partially confirmed our expectations. The response time in different listening conditions (no FM and FM) showed a meaningful benefit of FM systems use (p<0.05) with medium effect size. We found out this reaction time was the most objective in the study. Subsequently, performing tasks children showed different patterns of behaviour with the FM system and without it.
For example, a child was asked to outline a shape without an FM system, in usual way and he thought for a long time knowing where to start a task, then he took a long time without hurrying, although he was all the time instructed to perform the task as accurately as possible and as quickly as possible. With the FM system, the task was performed faster because it was continuously and closely stimulated through the receiver to perform it. Therefore, it is not possible to judge the duration of a task as a consensus or concentration on a task. In addition, the results of task performance were not as expected. Summarized outlining time from all 16 participants showed FM system might be beneficial (p<0.05) with medium effect size d = 0.43. However, colouring time was difficult to analyse because of a large variation in the results and consequently, it did not show any significant difference in FM usage efficiency during performing a task. The different behaviour of children with ASD during a task was noted before [18]. Besides, we agree with the reflection that individual case should be considered during the educational process.
Therefore, the children did not really like this task and they needed to be instructed to do so all the time. Due to differences in methodology, it is hard to compare our measured parameters with the work of other researchers; however, we are reaching similar conclusions. Summing up, our study results suggest that the FM systems were helpful and might be beneficial for children with ASD like in previous works given results are suggesting [4,11,13,18]. However, it must be made very clear that the FM system itself is not the main child support. Parents and teachers must constantly motivate the children and help them to get involved. The results showed sensitive aspects of the study design and gave motivation for future works. The limitations of this work are relatively small sample size, nonhomogeneous experimental group. Further research needs to differentiate with what autistic spectrum disorder the FM system is most effective. One more group of participants would help to manage the results and interpret as well as to control the learning of repeated tasks and the influence of extraneous factors. The voice-guided systems should be additionally involved in the usual educational process and daily activities and compared with the preliminary results. Individual case analysis would help to find new patterns of behaviour during performing tasks.
Conclusion
After analysing the results and considering the opinion of teachers and parents, we conclude that the application of voiceguided system can serve as an effective tool for addressing children’s attention and learning concentration problems. The FM system might be recommended for children with ASD: inability to use or very rarely keep eye contact; listening to the speaker only in a quiet environment; those with hyperactivity symptoms; children who rarely answer questions for incomprehensible reasons; having involuntary, recurring movements; not interested in concentrating on the work process. Summing up, our study results suggested that the app-based and the voice-guided platform was helpful and beneficial for most children; however, an individualized approach is necessary to determine the benefit of the voice-guided system for a particular participant.
Estimating Health Impacts of Pesticides Use: New Evidence from Vegetable Farmers in Sri Lanka
Introduction
Agriculture is the most important sector of the economy in the world as it provides food and livelihood securities [1,2]. After Second World War with the industrialization of agriculture has favored the use of plenty of agrochemicals including fertilizer, pesticide, micronutrients and plant growth regulators [3]. Pesticides are an integral part of modern agriculture, employed in various agricultural practices to control pests, weeds and diseases in plants. It includes a wide range of herbicides, insecticides, fungicides, rodenticides, etc. From the economic point of view, the use of pesticides is based on three-legged supports of efficiency namely the increase in production of crops, the increase in quality of production and the reduction in agricultural labour and energy expenses [4]. In the world approximately 5.7 billion pounds of pesticides are utilized annually for agricultural purposes. Over the past 20 years’ global pesticide use has grown to 3.5 billion-kilogram active ingredients per year, amounting to a global market worth $45 billion [4]. Globally herbicides accounts for 42%, insecticides 27%, fungicides 22%, and disinfectants and other agrochemicals 9% of global pesticides sale [5]. Some studies in this field [6-8] found that the health risk was reported to be the most important factor for consumer choice, but consumers are uncertain about their magnitude because they have limited information about pesticide concentrations, the cumulative toxicity of repeated exposure to trace quantities and the extent to which pesticides may be remove by washing, cooking and other treatment. There is visible parallel correlation between higher productivity and higher chemical input use which has resulted in number of environmental issues and health effects [3].
Pesticides have been used for agricultural practices in Sri Lanka since the 1950s. Due to the positive trends observed via the scope and use of pesticides their import has grown over the years. Despite many advantages, there are some potential hazards and risks associated with pesticide use. In many developing countries like ours, very often small farmers are not competent enough to use highly toxic pesticides safely while protecting their health and quality of the environment. Some studies show that pesticides residues are found in food, drinking water, surface water, breast milk and urine [8,9]. Non-optimal and non-judicious use of pesticides may lead to the development of resistance in pests to pesticides in the long run and certain externalities like environmental pollution and health hazards.
In Sri Lanka vegetable growers commonly depend on pesticides, typically used in heavy doses. However, its heavy use in agriculture is likely to contaminate soils, ground and surface water and mainly increase health risk of farmers and consumers because of exposure to the pesticides used in agriculture. In Sri Lanka, studies using the cost-of-illness approach [3-10] have estimated that a farmer on average incurs a cost of around US $ 97.58 annually in handling and spraying of pesticides. There are reports of health problems such a liver disorder, cancers often attributed to long-term exposing to pesticides as well as lung disorders and skin disorders associated with short term exposure, immune suppression, hormone disruption, diminished intelligence, reproductive abnormalities recorded by local health clinics [11]. Pesticide application in agriculture has obvious short-term economic benefits. They may reduce the cost of production or reduce crop loss due to pest or disease infection. However, it also cost to society in terms of health or environmental cost indirectly. Accordingly, the economic evaluation of health cost of pesticides is required to design effective rural health policies to reduce pesticide poisoning cases among the farming population. There are only few studies that have analyzed farmers’ willingness to pay for reducing the health effects of pesticides in developing countries. In this context, this paper presents health impacts of pesticide use on vegetable farmers in Sri Lanka, while estimating the cost of illness. The objective is to assess farmers’ willingness to pay to avoid pesticides related health impacts. The results of this study will assist in the design of programs or policies to effectively reduce the negative effects of pesticides usage in Sri Lanka.
Research Method and Data
There is growing evidence to show that pesticide has negative effects on human health in crop production [3-7] In this context, some authors attempted valuing the risk of pesticides to human health and identified its short-run and long run effects. Meanwhile, other scholars [12-14] included the environmental component into cost analysis and found substantially higher environmental costs of pesticide risk than health costs. Exposure to pesticides can occur in many ways. Farmers and farm workers can be exposed to pesticides in agriculture through the treatment of crops, plants and grain stores. According to model available in the literature [15] an individual’s well-being increases with aggregate consumption (C) and leisure (L) but is negatively affected by sick days (S).
Where the utility is increasing in C and L while it is decreasing in S. X is a vector of individual characteristics capturing preferences for income, leisure and health [12]. The relationship between pesticides induced damage (D) and health outcomes (S) can be summarized into a dose-response function [8]. Assume that health outcomes is a function of pollution level (P) and averting expenditure (A).
It is expected that the number of sick days is negatively related with averting expenditure (A) while it is positively related with pesticides related damage level (D). Assume that the individual allocates his total time (T) between work and leisure (L) and spend income on aggregate consumption, medical care and averting activities. Individuals choose the level of C, L and A to maximize utility subject to the following budget constraint [7].
Where Pm, Pa are price of medical care (M) and averting activities (A) respectively while w denotes wage rate [15] The price of a unit of the aggregate consumption good is normalized to one. This budget constraint assumes that individual allocate his time between work and leisure. According to the equation three, time allocation to work as well as medical care expenditure is expressed as a function of the number of sick days [12]. Using this simple utility maximization problem it is possible to identify the willingness to pay for a small change in pollution as follows:
According to Equation 4, WTP can be expressed as the product of the dose response function (dS/dD) times the marginal value of illness. The term in brackets is the marginal value of illness, broken down into its four main components [3]. Accordingly, marginal value of illness includes the values of marginal lost earnings (dW/ dS) which represents the opportunity cost of labour, marginal cost of medical expenditures (dM/dS) and of the marginal cost of the averting activities (dA/dS). In addition, WTP includes the disutility of illness (US/λ), converted into money value through dividing by the marginal utility of income [12]. This study uses this basic theoretical model to assess the willingness to pay to avoid pesticides induced illness in the study area.
The study also estimates the WTP compensation and compare it with the costs of illness estimates for the study group. Furthermore, it is also important to identify factors influencing WTP compensation. For this purpose, we use OLS and Tobit methods. A vector of explanatory variables is used in the regression analysis. This study includes variables such as medical expenditure, lost of earning, averting expenditure, income, education, age, family size and main occupation.
General specifications of the OLS and Tobit models are as follows:
The dependent variable Y indicating WTP compensation are a censored variable as some have said that there was no any harmful effects of pesticides uses to them. For example, the dependent variable is zero for household who have incurred zero costs. Xi denotes a vector of explanatory variables discussed above. Data used in the study are primary data collected directly from farmers using structural questionnaires during the May and June in 2018. A total of 300 vegetable farmers in Girandurukotte in Badulla district were randomly selected for the survey. The survey covers information on input use, management practices, output level and other socio-economic information. The survey was carried out at household level including individual responses for health status, health expenditure, cultivation practices and education on pesticides induced illnesses in the area. In addition to that various socio-economic information and other details such as medical expenditure, averting activities… etc. were gathered at the same time. Village officers were discussed for the sake of validation of data acquired at household and individual level. Data were collected through face-to-face interview of the head of the house along with any helping hands.
However, around 15 questionnaires had to be dropped out from the analysis as erroneous answers and some outliers were found. The questionnaire used in the survey was validated in a pilot survey and through focus group discussions. The final questionnaire was adjusted following the pilot survey and focus group discussions. The gathering of data was conducted by a trained group of researchers under the close supervision of the research team. The interviews took place in the interviewee’s home. The participants were informed about the purpose of the study and provided verbal consent to take part in the study. A field supervisor reviewed the quality of the data gathered and entered it into a database for analysis.
Results and Discussion
Main characteristics of individuals responding to survey are explained below. As the survey was carried out only on weekends, the response rate to every question was very high. Average age of the respondents is 45 years with a minimum of 24 and a maximum of 63 years. Majority of our sample was male respondents that accounts 83 per cent. The vegetable cultivation related employment is the main income source of the sample and 94 per cent is employed either their own vegetable farming or wage laborers in agriculture. Approximately 6 per cent of the respondents are engaged in various businesses or government sector jobs in the area. The mean monthly income of the respondents is Rs.29,300. No significant difference of income is found between vegetable farmers and other categories. This survey data reveals that 98 per cent of respondents cultivate vegetable for commercial purposes. However, of those approximately 92 per cent spray pesticides in their own farms while 8 per cent hires wage laborers for that purpose. It is evident that most respondents have obtained elementary and secondary education (27 per cent and 73 per cent respectively).
When considering the possible environmental issues of using pesticides for agricultural activities in these areas, approximately 53 per cent of respondents mentioned that the pesticides usage has severely caused to pollute the water in the area. Further, majority of respondents (76 per cent) agree that the usage of pesticides has resulted to disappear most of the environmentally friendly insects in the area. Most of the farmers (72 per cent) suggest that the Government must intervene to solve this problem through regulation while 20 per cent believe that people should get together and get it solved without third party intervention. However, around 8 per cent have mentioned that they do not have any idea about the solution. Further 84 per cent and 67 per cent of respondents are aware that the pesticides cause long term illness and even death respectively.
Table 1 shows the summary statistics of the data used for the analysis. According to Table 1 average medical expenditure was USD 2.58 (month) per person and the average lost earning was USD 2.73 per person per month. Number of pesticides varieties used by the farmers varies from 3 to 9 while number of frequencies varies from 3 to 15 per month during a cultivation season. The general information about other variables such as averting expenditure, household income, family size, number of sick days and mitigating expenditure can be significant determinants of WTP to avoid health risk. Therefore, descriptive statistics of all those variables are given in Table 1.
Table 1: Descriptive statistics of the survey data.
Note: Farm income includes only direct income received by selling products and it does not include the value of home consumption. Average daily wage is USD 10 male and it is 7.5 for female worker.
Effects of exposure to pesticides generally fall into three main categories namely allergic, acute and delayed effects. Asthma, skin irritation and eye and nose irritation are called allergic that some workers develop a reaction after being exposed to a certain pesticide [8]. Acute effects may appear immediately after the exposure. Oral, inhalation, dermal and eye exposures are some of the acute effects are they can be cured if immediate attention is given [11-16]. Delayed effects also include developmental, reproductive and systemic effects for the human body. These are illnesses or injuries that persist over long periods and may not appear until several years after exposure to a pesticide. These includes production of tumors, cancer, kidney failure and changes in the genes or chromosomes [17].
Furthermore, the impacts of long-term exposure may affect to the reproductive system in men as well as women which results birth defects, miscarriage, infertility or sterility in men or women and impotence in men [18]. During the survey researchers explained about those three main categories and asked respondents to explain their experience about selected several illnesses such as asthma, skin irritation, eye and nose irritation, nausea or vomiting, diarrhoea, headache, loss of consciousness, and sore throat and/ or cough if they believe as a result of pesticides exposure. Figure 1 summarises those results.
The delayed effects may also result in making blood disorders such as anemia or an inability to coagulate, nerve or brain disorders such as paralysis, tremor, behavioral changes and brain damage, skin disorders such as rash, lung and respiratory disorders such as emphysema and asthma, and liver and kidney disorders such as jaundice and kidney failure [17-19]. Some of the long-term pesticide exposure that is linked to the development of depression and anxiety, hyperactivity disorder and cancer are possible. However, reliable data on those are not available in the country (Table 2).
Figure 1: Different experience about the illness.
Table 2: Costs of illness estimates under different scenario (Rs/per month).
Note: Monthly (during a season) total costs for farmers who have different experiences are reported in this table. Zero costs mean the residents who did not have any experience of the above cases over the last 3 months.
As the first step of the analysis, we considered the variation of cost to farmers who have different experiences of illnesses due to direct exposure to pesticides. The average cost was calculated for farmers classified as serious (A- hospitalisation), moderate (B – a doctor is consulted, but no hospitalisation is required) and mild cases (C – no visits to the doctor, yet medication is taken). Only the private costs due to illnesses arising from pesticides induced illness were sought in this study. The results show that approximately 3 per cent of respondents have mentioned that they have been suffering from pesticides induced ill health and have been hospitalized over the last cultivation season. Another 9 per cent has mentioned that they have taken medicine from doctors due to pesticides related ill health. Approximately 29 per cent of respondents have taken some kind of treatment for pesticides induced health issues. However, as the issues are not serious, they have not meet doctors.
A vegetable farmer may have experienced one, any two or all three of the above. As can be seen, there is considerable variation in the costs incurred for different categories. Table 2 shows that on a typical spraying day approximately 2 per cent of the vegetable farmers interviewed mentioned that they have undergone all three experiences related to pesticides induced illnesses. Further approximately 10 percent had the experience of at least two scenarios mentioned above. These figures are consistent with some of the previous studies in this field [3-12]. Further approximately 28 per cent of the interviewed farmers said that they have suffered from some form of acute illness and incurred costs during the day of using pesticides over the last three years. However, 52 per cent of the interviewed vegetable farmers said that they have not suffered any form of illness and did not incur any form of expenditure due to exposure to pesticides during the previous cultivation season.
In addition to the medical expenditure, loss in earnings from being unable to work is a large cost to the farmers [3]. In this context, the lost earnings of the farmers with different experiences of the illness is estimated. The estimated lost earnings and mitigating expenditure for different experiences is shown in Table 3. It is clear that the high medical costs as well as lost earnings are a direct result of low levels of expenditure on averting activities. However, most of the farmers are not aware of the value of the labour costs since the market for labour does not function well in Sri Lanka. This is a problem encountered in markets that are not fully functioned (Table 4).
Table 3: Loss in earnings and mitigating expenditure (USD /per month).
Note:
i. Daily wage varies between USD 7.5 and Rs. 12 in different areas (it varies between male and female as well). However, USD 8.75 was used as the average daily wage rate. Accordingly, average hourly wage rate is USD 1.09.
ii. mitigating expenditure mainly includes costs incurred on wwearing protective clothing, wearing marks, wearing gloves and wearing shoes.
Table 4: Comparison between WTP and cost of illness (USD/per month).
Note: Cost of illness estimates and WTP are calculated only farmers who have experience in any form of costs related to pesticides use. Last column gives the ratio between WTP and cost of illness.
The monthly labour cost of the farmers who have experiences of all three incidents are approximately 7.5 hours for farmers during the previous cultivation season. However, average monthly costs for the farmers due to loss of labour hours are USD 2.73 which is almost equal to the value of one day labour supply. Average labour lost for the entire sample is 3.5 hours and its cost equals Rs. 2.82. This means that during a typical cultivation season, every month farmers are losing approximately one third value of labour due to exposure to pesticides. In the sample area, spraying takes place every 2 to 7 days. However, it is evident that the extent of the precautions taken is low for all the farmers in the study area. One of the interesting observations of the data here is that the average monthly averting expenditure of the farmers who said that they had no cost or loss due to exposure to pesticides is more than double (USD 1 .96) the average of farmers who reported any form of expenditure. This show the value of using protective measures when spraying pesticides in their farms.
One of the main purposes of this study is to estimate the WTP compensation with costs of illness estimates. Therefore, total cost of the pesticides related illness which include medical cost, lost earning and averting expenditure is estimated. Then estimated WTP under different scenarios is compared with the total costs. Estimated average WTP values to avoid pesticides induced illnesses are given in Table 4. It is interesting to see that hospitalized group, the average willingness to pay is approximately USD 4.43 per month in a typical cultivation season. The average willingness to pay of farmers who have at least one or more experiences with pesticide induced illness, but no hospitalization experience is approximately USD 1.75. Also, the results show that the WTP values are underestimating the true cost of pesticides induced illnesses. For the entire group average WTP is USD 3.28 while cost of illness is USD 5.7. This finding clearly shows that the farmers’ valuation of their own illnesses is very low which may be a common characteristic among poor farmers with low opportunity costs of their working time.
As the final step of the analysis, we attempted to identify the factors affecting WTP compensation. Estimation results of the Tobit and OLS regression model are shown in Table 5. Each slope coefficient in the OLS model is a partial slope coefficient and measures the changes in the estimated unit change in the value of the given regressor holding other regressor constant. The coefficients in the OLS model are interpreted as the marginal impact of the right-hand side variable on the dependent variable. Accordingly, this result reveals that all variables except age and family size in the WTP function have turned out to be significance. The coefficients of all the variables have expected signs in this equation. Among all variable’s medical expenditure, loss of earning, number of sick days and income have positively related with WTP while averting expenditure, usage of recommended quantity and experience related variables have negative signs. Although it is not rational to compare the Tobit and OLS results, the signs on the coefficients and their significance levels can be comparable. In addition, the relative magnitudes of the coefficients across variables in the Tobit model are comparable to the relative magnitudes of the OLS model. It is evident that almost all variables in two models have taken the similar signs while showing the similarities in terms of their significance coefficients (Table 5).
Table 5: Results of OLD and Tobit models.
Note: i. Standard errors are shown in brackets. * and ** Denotes the significant variables under 5% and 10% level of significance respectively.
ii. A- OLS estimators are with robust standard errors.
iii. Marginal effects on the latent dependent variable are reported for the Tobit model.
Among the significant variables under different significant level, medical expenditure and loss in earning have positive effects on the WTP while averting expenditure has negative effects on it. The negative sign of the averting expenditure variable confirms that the households who spend more on protective measures are less likely to pay as their probability of getting sick is less. Insignificant age suggests that willingness to accept for bearing existing health risks was independent from peoples’ age. When analyzing the qualitative data on peoples’ expectation about the future possible environmental risk that may be arisen from excessive usage of pesticides, it is found that majority of farmers (76%) are aware of them. Most farmers mentioned (67%) that environmental damage like water pollution and damage to environmentally friendly insects are possible due to extensive use of pesticides by farmers in the study area [20-22].
Conclusion and Policy Implication
This study calculates the amount of money which vegetable farmers are willing to pay for avoiding the prevailing level of health risk and compare the mean WTP with costs of illness estimates. Data were collected covering a sample of 285 vegetable farmers who are cultivating vegetable for mainly commercial purposes in Giradurukotte in Badulla district in Sri Lanka. In addition to estimate the WTP and costs of illness estimates, OLS and Tobit regression model estimates determinants of household willingness to pay for avoiding pesticides induced health risk. Results showed that the average monthly cost of illness which includes medical expenditure, loss earning and averting activities was USD 5.7 per person. However, we find that the monthly mean willingness to pay for avoiding existing health risk as USD 3.28 per person. It clearly shows that the, willingness to pay value underestimate the reality confirming the previous studies. However, peoples’ understanding about the exogenous factors including future expectation as well as loss earning of them can have significant impact of making divergence between those two. As a result, policy-oriented research covering some of the excluded variables in our model in this field is needed to a better understanding of the problem. We also found that medical expenditure, lost earning, averting expenditure and income are some of the significant determinants of willingness to pay. This general result about the underestimation of WTP drawn from our study follows that of the results of many other contingent valuation studies reported in the literature.
It is evident that no previous study has done this type of analysis comparing the results of WTP and costs of illness for vegetable farmers in Sri Lanka. This study provides strong evidence that pesticide use in Sri Lanka results in a very high cumulative incidence rate of acute pesticide poisonings resulting in a huge social welfare loss every year. Unlike previous studies on acute pesticide poisoning incidence, this study dealt with a number of economics issues for the farming community. The findings by descriptive analysis of the data show that the reasons for the resulting adverse health effects are weak regulation, the low hazard awareness of users, inadequate use of personal protective equipment, lack of proper care during application and the use of highly toxic pesticides.
In the healthcare setting, randomized controlled trials (RCTs) usually represent the main approach to create new knowledge [1]. Nowadays the use of real-world data (RWD) is becoming more and more relevant, even from a strategic point of view, to optimize and determine the best patients’ pathway. Using RWD gives the opportunity to generate new knowledge assets, mixing points of view from different actors (i.e. hospitals or patients) together with outcome and efficiency data, [2,3] thus supporting the delivery of healthcare services improvement and the outcomes’ optimization [4]. In this growing scenario, where RWD assume more and more importance all around the world, there is the opportunity to gather different dimensions and information, to create larger and integrated databases. Subsequently, they can be elaborated and merged at different levels, and could become available for both scholars, and policy makers research, thus achieving improvements in the quality, safety, and value of healthcare services delivery.
RWD could thus represent a useful support tool to assess the consequences of disease management interventions, to design an integrated clinical pathway based on knowledge derived from real world data and facts, implementing, and improving, the healthcare services that are satisfactory, in terms of effectiveness and efficiency [5]. The use of RWD could also provide a robust support for making customized decisions, concerning the treatment of patients, and for developing strategies for the delivery of care that respect the principles of fairness and coverage, without overshadowing the dimensions of quality and services efficiency/productivity. One of the most important knowledge assets that should leverage on RWD, are the costs related to specific rehabilitative programs or integrated clinical and rehabilitation pathways, [6] that could rely on real-life and specific country-oriented evidence, always following international and national guidelines suggestions and indications, and for which poor evidence is still available.
According to the above, integrated clinical and rehabilitative pathway could be the perfect example to define the significance to observe real-world healthcare data, beyond clinical trial evidence, thus providing stakeholders with valuable information about the safety and effectiveness of rehabilitative programs in a large and heterogeneous populations. Rehabilitation is an essential part of universal health coverage along with promotion of good health, prevention of disease, treatment, and palliative care, thus being defined as “disability in individuals with health conditions in interaction with their environment” [7]. The above consideration is strengthened because literature evidence focused their attention, on the inpatient’s integrated clinical pathway, without considering the outpatients’ activities and programs, after discharge. Moving on from these premises, the present paper aims at investigating the knowledge assets that might influence the creation and the design of a proper patient integrated rehabilitative pathway, after the Anterior Cruciate Ligament (ACL) rupture, assuming the hospital’s perspective. Coherently to the above, the study addressed the following two research questions.
1. Which are the main factors influencing the efficiency of the integrated rehabilitative pathway, in terms of costs’ optimization? 2. What configurations of such factors are sufficient to generate the emergence of a certain level of efficiency, in the absorption of resources?
Theoretical Backgrounds
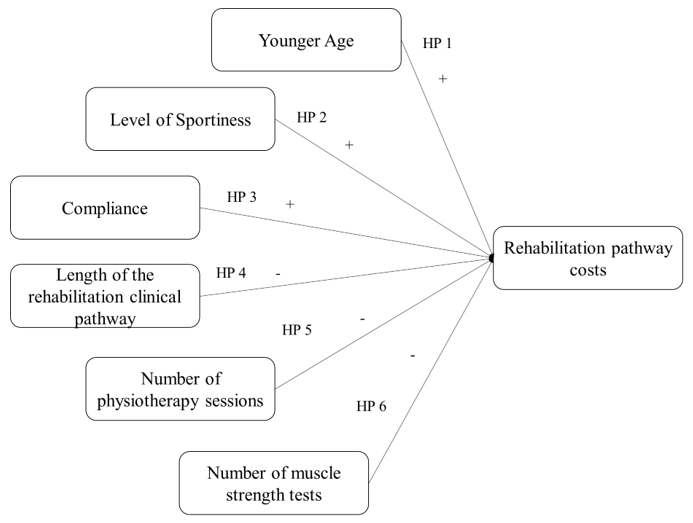
The deep investigation about the above research questions requires the analysis of different independent variables, and their relations with the optimization of the entire integrated clinical and rehabilitative pathway. Based on an extensive literature review, a set of original hypotheses was developed, to produce a specific framework, declaring the main characteristics of a rehabilitative pathway that affect the absorption of economic resources: patient’s age, patient’s compliance, duration of the rehabilitation pathway, level of sportiness, number of physiotherapy sessions performed, number of muscle strength and threshold tests performed were the factors investigated [8-12].
Age
De Valk stated that age is a key factor for the success of the integrated rehabilitative pathway: younger patients are more likely to achieve a better clinical outcome, with a positive impact on satisfaction [8]. Since, in other contexts, younger patients are usually associated with a lower absorption of economic resources, [13] it is possible to assume that also in this case age could be a factor able to reduce the overall costs of the clinical rehabilitation pathway. Based on the above considerations, the following hypothesis was displayed. • HP 1: Younger age has a positive impact on rehabilitative pathway management costs.
Level of Sportiness
As reported in the study of De Valk et al., a high level of sportiness enables a fast and successful integrated rehabilitative pathway [8]. Patients who are used to practice sports at high levels (e.g. professional athletes), are more likely to fully recover knee functions, achieving levels of mobility and resistance to pre-injury efforts The level of sportiness, therefore, has a strong impact on the outcome of rehabilitation, and consequently also on the resources’ absorption as well as on the rehabilitation pathway efficiency. The following hypothesis was formulated. • HP 2: High level of sportiness, positively impacts on rehabilitative pathway management costs.
Compliance
Patient compliance is a fundamental component of rehabilitation activity of which the main goal is improved recovery outcome. Without compliance to the treatment regimen, the expected outcomes cannot be achieved. According to this consideration, one of the most frequent obstacles to the healthcare professionals work, is low level of compliance and adherence in all integrated clinical pathways, but particularly in physical rehabilitation.
In fact, many patients do not follow the instructions of the clinicians and physiotherapists, who plan the timing and exercises of rehabilitation sessions, and often do not respect them or do them partially. Literature estimated that sport injury rehabilitation adherence rates could be as low as 40%. [14-16]. On the contrary, being adherent to the integrated rehabilitative pathway plays a key-role in the achievement of the expected results, with a positive impact in the overall economic resources absorption [17]. Thus, the following hypothesis was proposed. • HP 3: Compliance has a positive impact on rehabilitative pathway management costs.
Length of the Rehabilitative Clinical Pathway
The duration of the rehabilitative pathway presents a direct impact on the overall clinical results, and it is closely related to adherence [12]. In general terms, the presence of adequate clinical pathway would enhance the overall patients’ journey optimization. [18] Moving on from the above consideration, the more the patients are satisfied and adhere to the proper appointments, fewer follow-up activities would be required, with a positive impact on the possibility to free up economic resources [19]. The following hypothesis was defined. • HP 4: The length of rehabilitation negatively impacts on rehabilitative pathway management costs.
Number of Physiotherapy Sessions Performed and Number of Muscle Strength Tests
Two other variables related to the overall duration of the integrated rehabilitative pathway, impacting on the rehabilitation management costs, are the number of sessions and the number of muscle strength tests performed. Risberg and colleagues (2004) revealed a correlation between prolonged rehabilitation and improvement in patient’s physical conditions, leading to increased costs to support intensive rehabilitation programs [20]. According to this, the following hypotheses were displayed. • HP 5: The number of physiotherapy sessions negatively impact on rehabilitative pathway management costs. • HP 6: The number of muscle strength tests negatively impact on rehabilitative pathway management costs. A synthesis of the research frameworks developed, is proposed in Figure 1.
Figure 1: Conceptual framework for rehabilitative pathway costs.
Methods
An observational study, designed in accordance with the STROBE guidelines, [21] was conducted in two private rehabilitation hospitals in Italy, involving a total of 118 patients, to retrieve RWD, in relation to the integrated rehabilitative pathway. The informed consent forms were signed during the taken in charge of the patients, and they were informed concerning the use of data with an anonymous and aggregated methodological approach. In particular, the study involved economic data referring to all the adult patients (age ≥ 18 years old) requiring an integrated rehabilitative pathway after ACL rupture, in the year 2018, after having signed the informed consent form for dissemination activities.
Definitions of the Measures
As previously mentioned, the study was structured considering just one dependent variable, the rehabilitative pathway costs, and six independent variables, described below.
Dependent Variable
Costs: For the estimation of the integrated rehabilitative pathway average costs, the following variables were considered: the number of physiotherapy sessions and the number of procedures / tests performed during the entire programme. Economic data were evaluated, in accordance with outpatient visits and tests Regional Reimbursement Tariffs, valid for the years 2021/2022.
Independent Variables
Age: The patient’s age when rehabilitation program begins.
Level of Sportiness: It is the declared level of sportiness when the integrated rehabilitative pathway begins, defined by clinician and physiotherapist taken in charge the patient, in terms of number of training sessions performed within a week. In particular, the level of sportiness was classified as: 1. None (no training sessions performed). 2. Practitioner (at least 1 or 2 training sessions a week). 3. Amateur (at least 3 or 4 training sessions a week). 4. Athlete (at least 4 or 5 training sessions a week, with participation at sports competitions).
Compliance: The adherence/compliance to the integrated rehabilitative pathway was esteemed by attendance and participation in scheduled sessions. Patients were classified as compliant patients and not-compliant patients, depending on these two cases: 1. Patients completed the pathway prescribed at the beginning, even considering any modifications in the integrated rehabilitative pathway, and 2. Patients abandoned the rehabilitative pathway earlier.
Length of the Rehabilitation Clinical Pathway: This variable indicates the duration of the pathway, expressed as number of days occurred between the beginning and the end of the integrated program.
Number of Physiotherapy Sessions Performed and Number of Muscle Strength: This variable indicates the number of tests and sessions performed by each patient, during the whole rehabilitation pathway.
Statistical Analyses
The above variables were first analysed considering descriptive statistics, frequencies, and distributions. To ensure the relevance of the assumptions of normality, linearity and homoscedasticity, preliminary analyses were carried out. Three methodological approaches were used to answer the research questions underlying the study. 1. An analysis was carried out on the relationships among variables, verifying the existence of correlations among them. In particular, the correlation coefficient “person-product-moment” was evaluated, to verify the existence of small (from 0.10 to 0.29), medium (from 0.3 to 0.49), or large (from 0.5 to 1) correlations [22]. The exact value of -1 or +1 indicated a perfect correlation among variables. 2. In order to test the proposed hypotheses, a hierarchical sequential linear regression model was implemented (with enter methodology), that defines the predictors of the dependent variable (level of economic resources’ absorption). This approach was used to identify the impacts of the independent variables. One parameter of attention was the Adjusted R2, useful to control the explanatory power of each model. Thanks to this approach it is possible to test the hypotheses, through incremental models, to establish the specific impact of each input variable on the dependent variable. The “exclude case pairwise” option has been implemented, as it represents the preferred methodology to be applied for a small sample size, avoiding data exclusion. All the statistical analyses, referring to the coefficients test, and the development of the hierarchical sequential linear regression model were performed using the Statistical Package for Social Science (IBM SPSS Statistics Viewer – Version 22). 3. A qualitative-configurative analysis – QCA – was carried out to integrate the statistical approaches previously described [23,24]. The QCA is a comparative case-oriented methodology, useful to find, through an in-depth comparison of real-world cases, consistent configurations of causal conditions (the independent variables in our study), sufficient to determine the emergence of a specific outcome [25]. In the QCA, a symmetric relationship is disarticulated into two asymmetric analyses formalized by set and sub-set relationships [21]: one, related to the necessity of the conditions, with respect to the dependent variable, and the other on the sufficiency. This approach allows researchers to deal with the complexity of real phenomena. The QCA assumes the nonlinearity of phenomena under investigation and is based on the principle of causal complexity. This means that, in most cases, it does not make sense to isolate the effect (positive or negative), of a single independent variable on the outcome, but configurations of variables are identified, being related to the dependent variable. Moreover, several different configurations can be recognized as “causal recipes” of the same dependent variable [23]. In accordance with Vis, [26] which discussed the advantages of using the QCA technique to complement regression analyses for moderately large samples (between 50 and 100), the 118 empirical cases collected in this research were studied through the QCA to better understand the relationships between combinations of independent variables (the effects of complex interactions between causal conditions) and dependent variables, i.e. the results presented above. In QCA approach, the variables can be considered crisp or fuzzy. The crisp set variant (csQCA) is the version in which the variables of the study are dichotomous, and the empirical analysed cases are classified as alternatively “fully in” or “fully out” in the sets representing causal conditions and the outcomes. The fuzzy-set variant (fsQCA) is characterized by the fact that the empirical cases are classified in terms of membership degrees in the fuzzy sets of causal conditions, and of the outcome. In this analysis, we adopted the crisp set QCA.
Results
The Sample Under Assessment
The sample was composed of 118 patients, requiring a specific integrated rehabilitative pathway after ACL rupture. It should be noted here that all patients required an outpatient integrated rehabilitative pathway, starting the activities program immediately after surgery. The sample consisted mainly of males (66%) and is 34 years old on average. As far as the level of sportiness is concerned, only 3% of the patients in the sample had previously practiced sport at competitive level, while 64% of the patients belonged to the “practitioner” category. In general, the average absorption of economic resources associated with the rehabilitation of the patients in the sample was equal to € 3,334.07 ± 269.28. Compliant patients are associated with a higher absorption of financial resources than non-compliant patients (€ 3,634.47 vs € 2,157.50 p-value=0.026).
Hypotheses Testing
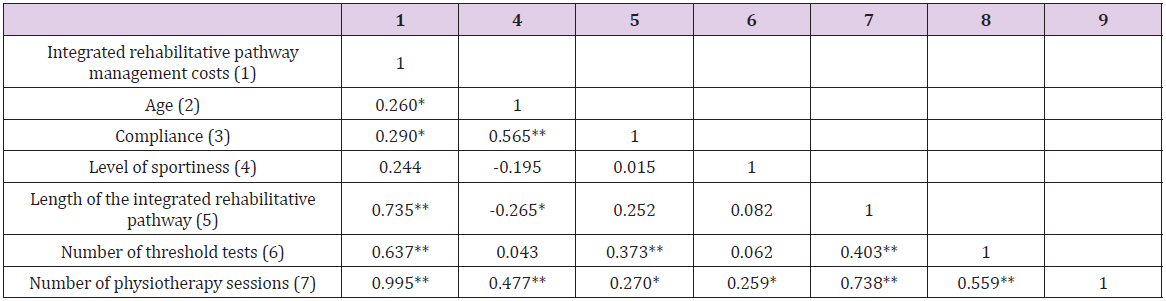
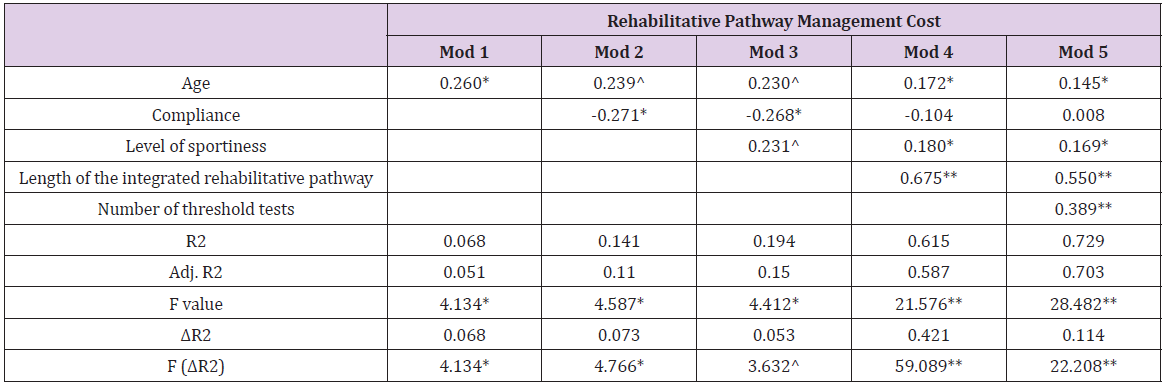
Table 1 shows that age (p-value = 0.047), compliance (p-value = 0.026), length of the rehabilitative pathway (p-value = 0.000) and number of threshold tests (p-value = 0.000) significantly influenced the integrated rehabilitative pathway costs. The great relationship between total costs and the number of physiotherapy sessions (β = 0.995, p-value = 0.000) depicts that between the two variables there is the collinearity phenomenon, thus being two aspects explaining the same concept. This is the reason why the variable “number of physiotherapy sessions” was not included in the regression model. The independent variables (age, compliance, and the length of the rehabilitative pathway) have a significant p-value < 0.05. Moreover, the same relationships emerged among the length of the integrated rehabilitative pathway, the number of threshold tests and the number of physiotherapy sessions (p-value = 0.000). After testing the correlation among all variables, a regression analysis was conducted to test hypotheses (Table 2). Older age (β=0.145, p=0.049), higher sportiness level (β=0.169, p=0.022), as well as the length of the rehabilitative pathway (β=0.550, p-value=0.000), and threshold tests (β=0.389, p-value =0.000) are antecedents of higher rehabilitative pathway management costs (Adjusted R²=0.703 and F=24.482).
Table 1: Relationships between variables.
Table 2: Regression model for integrated rehabilitative pathway management costs.
Configuration of Factors Through QCA
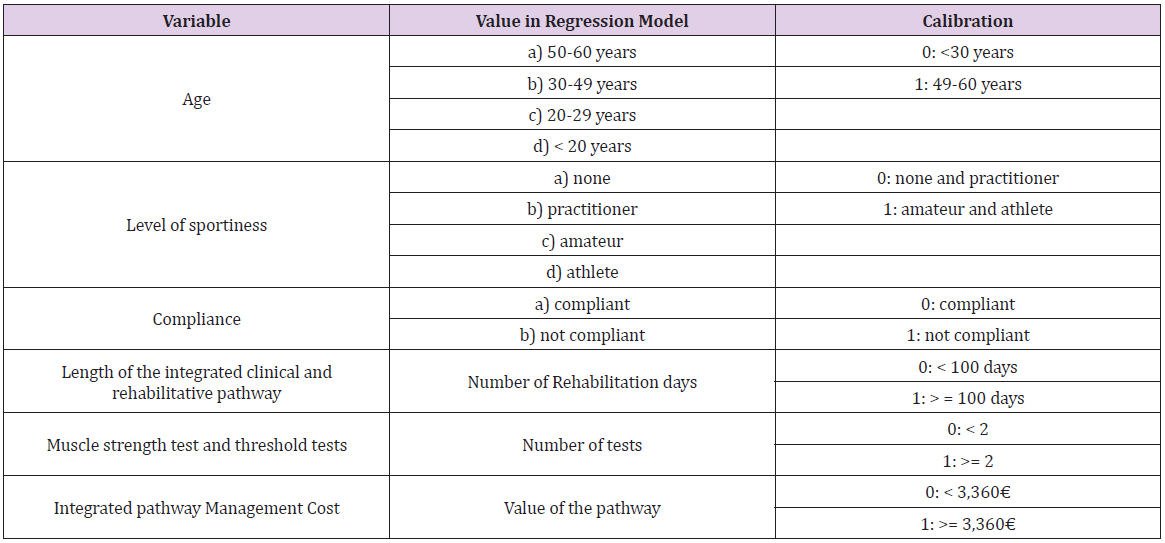
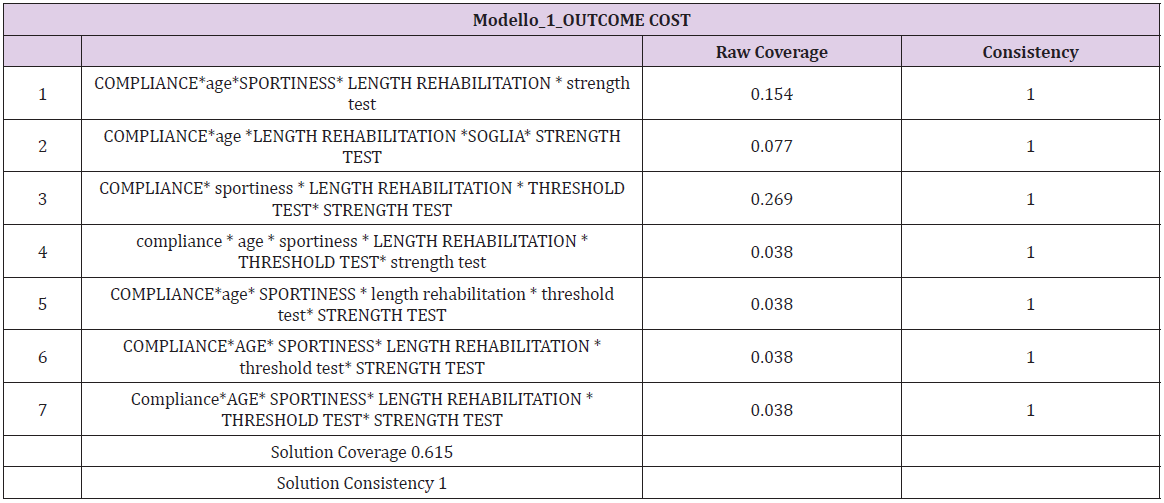
The QCA analysis requires a preliminary step for calibration of variables transforming them in crisp ones (Table 3). After performing the calibration process, consistency, and coverage of a set of configuration variables were evaluated. Consistency is the extent to which the results are in line with statements of need or sufficiency. Coverage provides information about the empirical importance of necessary and sufficient conditions. Each configuration has a raw coverage value that “measures the relative importance of several combinations of causally relevant conditions” [23]: the proportion that a configuration covers the outcome. It is assessed by the sum of consistent scores of the configuration divided by the sum of outcome scores [27]. In the QCA analysis, the crisp value 1 is reported in uppercase whereas the crisp value 0 is reported in lowercase. According to the regression analysis, the variables that most influence the management costs are the compliance and the length of the integrated rehabilitative pathway (Table 4). In particular, the most representative recipes show that level of sportiness associated with young age affects the management, as well as the length of rehabilitation, also for the patients with a lower level of sportiness.
Table 3: Calibration of the variables.
Table 4: QCA analysis for rehabilitative pathway management cost.
Discussion and Conclusion
In the current era, where the availability of large amounts of clinical data gathered during care delivery is rapidly increasing, as well as the ability to access, process, link, and analyze these data in efficient ways, alternative sources to supplement evidence from RCTs look promising. Among all the information that could derive from RWD, one of the most important topics to analyze consist of the management costs related to a specific integrated clinical or rehabilitative pathway. The knowledge of the economic resources’ absorption could contribute to fully understand the pathways as well as the choices and behaviors involved in those pathways. Economic information provides the tools for developing effective and efficient policy strategies and addressing potential tradeoffs between the goals of increasing social welfare and improving the distribution of healthcare delivery across individuals and population groups.
Within the setting of ACL integrated rehabilitative pathway, results reported that strong compliance and a high level of sportiness could be considered among the main factors that cause an increase in the total cost of managing the rehabilitation pathway for a patient with ACL rupture, confirming the information found in literature [14-16]. In fact, orthopedic surgery often requires many months of rehabilitation to achieve a successful outcome, regardless of subspecialty, with an important impact on the overall resources’ absorption [28]. For patients practicing sports by profession, the rehabilitation pathway could be more intense and costly, as it is their priority, to recover their normal motor and sports conditions as soon as possible [8]. Thanks to the QCA it is possible to integrate these results, identifying all combinations of factors that are determining the emergence of a certain results. For example, more consistent QCA analysis solutions show that compliance has an important influence on the absorption of economic resources by patients, but also higher levels of sportiness related to young age of patients, determining higher pathway costs. The results obtained and the findings of this study could give a contribute useful to enlarge the existing research, regarding the use of RWD in the healthcare sector, with particular focus on the rehabilitation programs, thus considering a larger sample and producing results that could be replicable. Although the relevance of this topic, healthcare stakeholders often do not have enough information on outcomes to take decisions, being well-informed. In this context, knowing which are the factors that have a positive or negative influence on the integrated patients’ rehabilitative pathway, could be useful to optimize economic resources, as well as for the achievement of an adequate effectiveness, thus becoming more efficient and effective [6]. This, in the Italian setting, is becoming more and more important, due to the recent re-consideration of the integrated clinical and rehabilitative pathways, after the COVID-19 pandemic, for the re-organization of the healthcare delivery of services.
Study on the Prevalence of Goiter and Associated Factors Among Hospitalized Patients of District Timergara, Dir Lower Pakistan
Introduction
The thyroid gland is responsible for producing thyroid hormone, which has an important role in metabolic processes. It is essential for these hormones to have adequate amounts of iodine [1,2]. Goiter can be detected clinically by palpation and physical examination when there are insufficient amounts of iodine [3,4]. In several areas of the world, goiter is considered a significant problem for public health, especially in developing countries, and is an indicator of chronic iodine deficiency [5]. Iodine deficiency disorders (IDDs) affect 30% of the population globally. There are more than 150 million IDD patients worldwide [6]. Thyroid nodules and goiters are the most common thyroid conditions due to a combination of genetic, environmental, and endogenous factors [7]. Around 15.8% of the general population develop goiter, and iodine is a significant environmental factor that influences goiter prevalence [7]. A thyroid nodule can be detected by ultrasound in 19% to 67% of cases, but only 4–7% is palpable [8]. Most thyroid nodules and goiters do not present any symptoms; however, they can be associated with other disorders, including endocrine dysfunction, impaired body composition, autoimmune thyroid disease and various metabolic disorders [9]. Coordinating basal metabolic rate and thermogenesis is a key role for thyroid hormones [10].
Researchers have linked low thyroid hormone levels with poor metabolic health in several studies, even when they are within normal limits. There are many metabolic processes regulated by thyroid hormone, including growth and development, reproduction, and enhancing metabolism [11]. The thyroid produces and releases thyroxine (T4) and triiodothyronine (T3) into the circulation system. Thyroid stimulating hormone (TSH) is released by the anterior pituitary gland and helps to regulate thyroid hormone levels, which are controlled by thyrotropin releasing hormone (TRH) from the hypothalamus. A negative feedback loop is present between TRH and TSH in the circulation system, and the regulation is carried out by T4 and T3 [12,13]. An iodine deficiency causes goiter, the enlarged thyroid glands that are greater than the terminal phalanx of the thumb, which indicates chronic iodine deficiency [14].
Goiters provide an indication of the iodine status in a region and can be used as a long-term indicator of the success of an iodine programmer. A measurement of the prevalence of goiter caused by iodine deficiency is based on indicators like urinary iodine concentrations (UIC) and total goiter prevalence (TGP) as well as the proportion of salt in households that is adequately iodized (>15 ppm) [15]. Throughout the world, iodine deficiency is the leading cause of goiter [16-18]. Iodine deficiency was reported in Pakistan by the World Health Organization in 1990 as affecting an estimated 50 million people; goiter was reported as prevalent as 80-90% in mountainous areas [19]. Cretinism is estimated to have a prevalence of about 3% in the general population [20]. Lower Dir District is situated in Malakand Division of Khyber Pakhtunkhwa province in Pakistan. There are 1.05 million people living in Timergara City, the district capital and largest city with 1,582 square kilometers. Our main objective in this study was to find out the prevalence and factors of goiter in hospitalized patients residing in District Timergara, Dir Lower Pakistan.
Methods
Study Setting, Design, and Participants
A descriptive cross-sectional retrospective study of hospitalized patients was conducted from July 2020 to June 2021 in District Timergara, Dir Lower Pakistan. There were 405 participants in the study (247 women and 158 men). The study comprised all patients admitted to the endocrinology department at the (DHQ) Timergara hospital regardless of the reason for admission. Throughout the examination, every patient’s clinical history was examined, as well as the previous case record. We collected the information using a questionnaire designed to inquire about patients’ general socio-demographic data, including goiter physical appearance, age, occupation, ethnicity, gender, residential area, economic status, educational, and clinical manifestations, among other considerations, are considered. A trained endocrine specialist, who has already examined the patients, written informed consent was obtained from all participants. In the study, patients with serious physical and mental illnesses were excluded as it was difficult to obtain data and measurements from them. The study was approved by the Ethical Committee of the Department of Surgical, Institute of Paramedical Sciences Khyber Medical University Pakistan, which followed the recommendations of the Declaration of Government District Headquarter Hospital (DHQ) of Timergara, Dir Lower.
Examination for Goiter
Using palpation techniques, a trained and experienced public health officer assessed the presence of goiters based on WHO/ UNICEF/ICCIDD criteria [21]. Therefore, Grade 0: stand for not visible, not palpable; Grade: I stand for palpable, not visible; and Grade: II stands for visible and palpable.
Statistical Analysis
In order to examine the data, the patient’s records were manually checked, sorted, categorized, and coded. Then, SPSS version 23.0 was used to analyze the results. We measured the prevalence of goiter based on the relative frequencies and ratios for all patients with goiter.
Results
In total, 405 patients were recruited to participate in this study. Here are the sociodemographics characteristics of the participants (Table 1). Out of the 405 respondents, 247 were women (61.0%) and 158 were men (39.0%), and goiter was much more prevalent in women than in men. All of the patients were of the same ethnicity, patients with no formal education had the highest prevalence of goiter, 267 (65.9%), and 138 (34.1%) patients were literate. As educated levels increased, goiter prevalence declined, reaching the lowest levels in comparison to illiterate patients. The results revealed that 278 (68.6%) were married and 127 (31.4%) were unmarried, while 129 (31.9%) were government employees, and that most of the patients were farmers with no proper job 267 (68.1%). Participants were sorted by age into 10-year age groups based on the results the prevalence of goiter was lowest among those between the ages of 14-24 (10.4%), while among 35–44-yearolds, the rate reaches its highest level (37.5%). Goiter prevalence was greater in hilly than plain areas, at 283 (69.9%) in hilly and 122 (30.1%) in plain. In hilly areas, goiter was significantly more prevalent than in plain areas. On the basis of thyroid examination, there were 176 (43.5%) patients with palpable and visible goiter (grade II), and goiter prevalence was higher in individuals aged 35- 44 years old (37.5%) (Figure 1).
Figure 1: Age and gender-wise prevalence of goiter among hospitalized patients.
Table 1: Sociodemographics characteristics of goiter hospitalized patients.
Discussion
Goiter is a common endocrine problem that affects around 300 million people globally, with more than half of those affected being unaware of their condition. The most common thyroid disorders are hyperthyroidism and hypothyroidism, which affect 1.6 billion people in more than 100 countries around the world [22-27]. Our findings revealed that females were more prone to goiter than males, as demonstrated by their ratio of (61.0%) to (39.0%), although overall goiter prevalence did not significantly differ between genders. During this study, goiter cases were classified according to age, with older patients 35-44 (37.5 %) having a higher prevalence than younger patients. There is a documented association between the prevalence of goiters and gender. Interestingly, Knudsen et al. observed that men were more likely to have goiters than women; however, women were two to ten times more likely than men to have goiters [28,29]. Studies have shown that sex hormones may play a role in thyroid volume only after puberty, suggesting that changes in thyroid volume are influenced by gender differences [30]. In addition, women are more likely than men to develop thyroid problems during their lifetime [31,32]. There was a study that found older women had a higher risk of goiter than younger women. A higher prevalence of goiter was observed with age in areas with severe or moderate to mild iodine deficiency. Other studies report an enlargement of the thyroid gland with age in areas with severe or moderate iodine deficiency [33].
According to this study, goiter was most prevalent in illiterate patients compared to literate patients because illiterate individuals were unaware of goiter. The findings of our study are in agreement with previous research findings, which found that the prevalence of goiter increased in hilly areas in comparison to plain areas. Goiter is more prevalent in Baltistan, Northeast Pakistan, where the prevalence was found to be 16.6% among the general population. In the North, it is 20.4% of males, 28.1% of females, and the South 13.9% of males, 21.2% of females [34]. In previous studies, it was discovered that northern Pakistan has become one of the first known areas to have an iodine deficiency. Goiters have been reported in only a few studies across various regions of Pakistan, ranging from the Northern region in the upper Himalaya to the lower Himalaya and even on the Punjab plains. It was estimated in 1990 that 70% of the population was at the risk of iodine deficiency related disorder, with the prevalence of goiters ranging from 55% in plains to 80-90% in the northern mountainous region [35]. According to the WHO classification of goiter based on size and visibility, 7 percent of the global population possesses visible form goiter [36], our results showed that the prevalence of goiter on the basis of thyroid examination with palpable and visible (grade II) was high frequency 176 (43.5 %), the goiter rate was higher in the 35-44 years of age group (37.5%). The prevalence of goiter was reported to be 3.4 % in women and 6.9 % in men among French citizens [37], 23.9 and 35.6 % in German citizens, 58.1 % in Italian citizens [38] and 35.7 % in Romanian citizens [38]. According to Hatemi et al., the prevalence of goiters using neck palpation was 30.5% in Turkey [39]. However, the prevalence was higher than the 16 % and 27 % reported by a report about global iodine deficiency in world and African populations [40]. Similarly, the prevalence of goiter in Ethiopia was higher than various studies which showed a prevalence ranging from 26.3% to 62.1% among children [41-44]. The main cause of goiter is iodine deficiency, and it is imperative to concentrate prevention efforts at the society level on eliminating iodine deficiencies.
Conclusion
The study conclusions suggest that goiter prevalence might depend on TSH levels specific to normal or abnormal hormonal dysfunction. The study also concluded that increased goiter risk was independently related to women’s gender and low TSH levels. The study area had an iodine deficiency problem, and goiter was linked to increased parity, older age, and illiteracy. The study area has a high prevalence of goiter. The health sector of the district should invest more efforts in spreading important messages about iodized salt and iodine-rich foods to ensure community awareness. There is a need for a systematic investigation of the epidemiological profile of patients with diffuse goiter. It is necessary to conduct further research on both the environmental and genetic interactions that lead to goiter.
Solid Organ Transplantation: A Glimpse into its History
Introduction
On the Basis of the Definition
According to the dictionary of the Royal Spanish Academy [1], transplanting consists of “transferring a living organ or tissue from a donor organism to a recipient organism”. For its part, the dictionary of medical terms of the Royal Academy of Medicine of Spain [2], includes a broader definition of the term transplant: “to transfer an organ or tissue from one place to another in the same individual, between individuals of the same species or between individuals of different species”, adding to the concept the possibilities in terms of types of donors and possible recipients. The term “transplantation” comes from Latin, as the sum of “trans” (beyond) + “plant(āre)” (i.e. to plant) and literally means “change of location of a plant”. The surgical use of this term has been documented in English since 1951 [2] and refers to the “operation of transplanting into a recipient organism an organ or tissue taken from a donor organism. A distinction is made between autologous transplantation, isotransplantation, allotransplantation and heterotransplantation according to whether the donor and recipient organisms are identical, univitelline twins, members of the same species or members of different species, respectively”.
Early Historical References
Although there are references to transplantation techniques dating back to antiquity, such as the legend of Saints Cosmas and Damian [3], which describes how these twin brothers amputate the leg of a deacon with a tumour (in some versions they say he had severe ischaemia) and then transplant the leg of a recently buried Ethiopian; the real breakthrough in solid organ transplantation is considered to have come at the beginning of the 20th century. This era was marked by several milestones, including the following: the refinement of the vascular anastomosis technique by Alexis Carrel [4] (who received the Nobel Prize in Physiology or Medicine in 1912), Charles Claude Guthrie, Mathieu Jaboulay and Julius Dorfler; the refinement of organ transplantation techniques in animals by Emerich Ullmann in 1902, with a kidney transplant between dogs, and the techniques described by Vladimir P Demikhov [5] between the 1930s and 1950s, which laid the foundations for surgical techniques used in humans; within the field of Immunology, the scientific breakthrough of the 20th century was the discovery of acquired immune tolerance by Peter Brian Medawar and Frank Macfarlane Burnet (who received the Nobel Prize in Physiology and Medicine in 1960) [6,7]; this was accompanied by the discovery of drugs with immunosuppressive properties_ especially from the 1960s [8,9] .
First Solid Organ Transplant in Humans in the World
Renal Transplantation: The first human kidney transplant in history took place in 1933 and was performed by the Ukrainian surgeon Voronoy [10]. The recipient was a young woman in a uraemic coma and the donor was a 60-year-old man; although the patient survived the surgery, the transplanted kidneys failed to function properly and on the third day the patient died. Voronoy performed five more cadaver kidney transplants in 1949, again without success. It was not until 23 December 1954 that Joseph Murray succeeded for the first time in performing a successful kidney transplant in humans at the Peter Bent Brighan Hospital in Boston. In this case, the donor and recipient were univitelline twins [11,12]. Murray received the Nobel Prize in Physiology and Medicine in 1990 for performing the first successful human organ transplantation. In the following years, kidney transplantation between twins continued to be performed, with subsequent good progress. At the same time, discoveries in the field of immunology and the development of immunosuppressive drugs made it possible to consider organ transplantation between immunologically nonidentical people.
Liver Transplantation: The first liver transplant was performed on 1 March 1963, at the Veteran’s Hospital in Denver (Colorado) by Thomas Starzl’s team. The recipient was a 3-year-old boy with biliary atresia, who died within hours of the transplant. Two months later, the same team performed another liver transplant on a 48-year-old man with liver cancer, who was implanted with the organ of a patient who had died of a brain tumour; this time, despite achieving adequate liver function, the recipient survived for 22 days, dying after suffering a pulmonary embolism. Like other types of solid organ transplantation, it was not until the 1980s that there was an improvement in the results of liver transplantation in relation to major advances in surgical techniques, coagulation management and the discovery of immunosuppressive drugs [13].
Heart Transplantation: The first human heart transplant was performed by Christiaan Neethling Barnard on 3 December 1967 in Cape Town, South Africa [14] on a 58-year-old recipient suffering from terminal heart failure, who died 18 days later, from Pseudomonas pneumonia. The results of the first interventions of this transplantation modality were disappointing. The explanation, again, lay in immunological problems that increased the risk of rejection and infection in recipients. As previously mentioned, the change came about after the introduction of new immunosuppressive drugs. In particular, in the case of heart transplantation, the advent of cyclosporine [15] led to a marked increase in post-transplant survival.
Lung transplantation: On 11 June 1963, James D. Hardy performed the first-ever lung transplant in a human in Jackson, Mississippi. The recipient was a 58-year-old man diagnosed with lung cancer who was in respiratory failure and also suffered from kidney failure. The circumstances of the recipient, John Russel, made this milestone even more unique as he was on death row for committing a murder in 1957. During his stay in prison, after being diagnosed with the oncological disease, the seriousness of the situation was explained to him and he was offered the chance to be the first human to undergo a lung transplant, promising, if he survived the transplant, to commute his prison sentence to the governor of the state for ‘contribution to the cause of humanity’. Russell agreed and the left lung was transplanted. However, after surviving for eighteen days with good function; he died as a result of worsening kidney failure [16]. Despite several subsequent attempts, it was not until the 1980s that good survival results were achieved in this type of solid organ transplantation, with the team at the University of Toronto and its lung transplant programme being the reference [17] (Figure 1).
Figure 1: Chronology: first solid organ transplants in humans.
The Particular Case of Spain and Solid Organ Transplantation
The first transplant in Spain took place in 1965 at the Hospital Clinic i Provincial de Barcelona, where a cadaveric kidney transplant was performed by the Gil-Vernet team [18]. Almost two decades would have to pass before the first transplants of the other modalities were performed. The new heyday of solid organ transplants began again in the 1980s. Thus, it was not until 23 February 1984 that the first liver transplant was performed by Carles Margarit and Eduardo Jaurrieta at the University Hospital of Bellvitge (Barcelona) on a patient diagnosed with a liver tumour [19]. The first successful heart transplant in Spain was performed on 8 May 1984 at the Hospital de la Santa Creu i Sant Pau (Barcelona) by the team led by Josep María Caralps and Josep Oriol Bonín. The latest date in Spain corresponds to the first onelung transplant, performed in 1990 by Ramón Arcas at the Hospital Gregorio Marañón (Madrid) [20].
That same year, in February 1990, the first combined cardiopulmonary transplant with long-term survival was performed [21] and it was not until 1992 that the first bipulmonary transplant was performed [22,23].
Within the history of transplantation in Spain, there are a number of notable years: In 1979, Law 30/1979 on Organ Transplantation was passed [24], which legally recognised the concept of “brain death”. Until then, in order to proceed with the extraction of an organ for transplantation (until that date it was always the kidney), the donor had to wait for asystole. After this law and its implementation by Royal Decree in 1980 [25], there was an increase in the total number of transplants carried out in Spain. Another important year was 1989, when the National Transplant Organisation (ONT), officially created in June 1980 by Resolution of the Secretary of State for Health [26], acquired a physical organisation that facilitated the achievement of its goals. The ONT was defined as a coordinating body of a technical nature, belonging to the Ministry of Health, responsible for developing the functions related to the procurement and clinical use of organs, tissues and cells. It is structured as a network, for the organisation of which three levels are established: National Coordination, Autonomous Community Coordination and Hospital Coordination. The so-called “Spanish model” [27] of transplantation and its organisational structure showed good early results, making Spain the leading country in the world in terms of the number of donations.
Conclusion
The possibility of performing solid organ transplants has meant a significant change in the lives of many people in recent decades. The great advances made in the 20th century in the field of surgery made it possible to consider this type of treatment in humans for the first time. Although initially the results in terms of survival were not favourable, the discovery of the immunological mechanisms that produced rejection, along with the knowledge of the human leukocyte antigen (HLA) system, and the subsequent appearance of immunosuppressive drugs, led to a change in the paradigm of the management of transplant recipients. Today, solid organ transplantation is a particularly relevant therapeutic option for people with diseases previously considered terminal due to severe dysfunction of one or more organs who are candidates for inclusion on the waiting list to receive a graft, since after transplantation, the recipient’s quality of life is often improved, and survival is increased.
Van Lohuizen Syndrome, A Late-Diagnosed Case in an 18 Years-Old Female
Introduction
Van Lohuizen Syndrome, or Cutis Marmorata Telangiectatica Congenita. Is a very rare birth defect involving the cutaneous blood vessels, often reported as a benign, congenital disorder of unknown etiology, epidemiology, and pathophysiology. Described as persistent cutaneous telangiectasia, and phlebectasia, these appear as reticulated streaks of the skin capillaries and venules, resulting in a marbled-looking skin (cutis marmarota) [1-3]. First described by Kato van Lohuizen, a female Dutch pediatrician, in 1922 [4]. Since then, it has been referred to under several names, including, congenital generalized phlebectasia, [5,6] naevus vascularis reticularis, [7] as well as congenital livedo reticularis [8]. Characterized by the presence of erythematous network streaks, without venectasia, which is not responding to local heating. It may occur along with port-wine stain, [9] cutaneous ulceration, and atrophy within the affected area, as well as body asymmetry, and may affect any organ, including the eyes, skeleton, kidneys, and the brain [10-12].
Case Report
We are reporting the first case of CMTC in Libya, in 18 years old girl referred to our clinic for consultation. She had persistent skin disorders in her Rt. upper limb since birth (Figure 1). She is the third of three siblings, born as a full-term baby, by uncomplicated vaginal delivery, to a non-consanguineous marriage, and there was no family history of similar lesions. A high school student, leading a normal active life, until about a year ago, when she began to feel intermittently some discomfort and numbness of the right hand and forearm, with no history of trauma. Her upper extremity skin changes were detected at birth along with contralateral DDH, which was treated conservatively. Our clinical findings revealed a network of blue-purple lines giving the skin a marbled appearance along the right upper extremity from the deltoid insertion to the metacarpophalangeal joints level dorsally, sparing the Palmer skin, otherwise, her skin temperature and texture were normal, without atrophy or ulceration (Figure 2). The lesions were fading at Direct pressure, but not affected by gravity. There were multiple irregularly shaped port-wine stain patches on the right anckle laterally, left leg posteriorly, and the right thigh anteromedially. No upper or lower limbs atrophy, cercomfrential, or length discrepancy, and her gait was normal, there was no scoliosis, or facial asymmetry. There were no sensory or motor deficits detected clinically. Here skeletal survey, abdominal and pelvic ultrasound, echocardiography, and all laboratory investigations were within normal. NCS, reported mild right CTS, Based on this medical history and clinical presentation, the diagnosis of Van Lohuizen syndrome was confirmed (Figure 3).
Figure 2: The lesion extends along the right upper limb, between the deltoid insertion proximally and the Metacarpophalangeal joints level distally, sparing the phalangeal skin dorsally and the palmar skin volarly.
Figure 3: Multiple erregularly shaped port-wine stain patches on he Anckle A, Leg B and Thigh C.
Discussion
Van Lohuizen syndrome is a rare congenital disorder, with less than 300 cases reported worldwide to date [2,12,13]. However, since not all cases are diagnosed, it is difficult to determine incidence rates. Its origin and gender prevalence are still obscure and unclear, although, it is believed by some to be prevalent among females (64%) [14,15]. In some rare cases, CMTC may run in families [11]. However, Amitai et al. observed no familial cases of CMTC in their series, and most of the cases seem to be sporadic, with no racial predilection [16]. However, skin biopsies have revealed genetic mutations in GNA11, [17-20] and some researchers have also reported genetic mutations in ARL6IP6, suggesting its inheritance as a recessive trait [20-23]. Moreover, viral infections have been postulated, and the underlying connective tissue abnormality has been supposed. Its diagnosis is clinically based. It appears as cutaneous erythematous reticulum streaks, fading upon direct local pressure but unaffected by local heating or gravity, with no venectasia, findings that Kienast, [9] considered three of which as primary signs. While the presence of skin atrophy and ulceration, and the port-wine stains outside the areas affected by CMTC, have been considered a secondary diagnostic criterion (Table 1). For diagnosis, the presence of three major signs and two of the minor criteria is indicative [2].
Table 1: The major and minor diagnostic criteria, Kienast classification [2].
In most cases (66.8%), the disorder is localized, and the leasions are unilateral in 65% of the cases, more frequently involving the limbs (69%), [16] where the upper limbs are affected in (25.9%), while the hands are involved in only (4.9%), but can be generalized in about (24.5%) of cases [24]. CMTC may involve any organ in the body, including the eyes, skeleton, brain, kidneys, and others [10]. The most frequently associated anomalies, in 18.8% of patients [16] include body asymmetry, neurological, ophthalmological, and cardiovascular defects, dysmorphic features, genitourinary, and endocrinological defects [2,16,24-29]. The CMTC should be distinguished from congenital livedo reticularis, which is caused by mosaic PIK3CA gene mutations, [30] where ulceration and phlebectasia do not occur, Sturge-Weber syndrome, which is caused by mosaic GNAQ gene mutations, [17] Neonatal lupus erythematosus, [31] and Klippel-Trenaunay syndrome.
Although, histopathology may confirm the diagnosis by showing an increased number and size of capillaries and veinules in the dermal layer, endothelial swelling, and sometimes aneurysms, it is not necessary, and nonspecific [16,32-35]. Imaging, and fluorescein angiography are indicated only for the evaluation of other congenital anomalies that may accompany the CMTC.
Up to the moment, there is no definitive treatment for skin symptoms in CMTC. However, sympathectomy, and laser therapy are postulated [14,32,34-38]. In our current case, we believe that treatment is unnecessary, apart from reassurance and may be a psychological support to ease the burden of the aesthetic appearance, for although the problem involves a wide area of about (9%) of the total body surface area (TBSA), [39] it is still localized, and it is without any other associated problem apart from the described port-wine patches. She is a tertiary school student, living a normal life with no functional or intellectual issues. However, if we consider her complaint of discomfort and numbness as part of the problem or some of its long-term sequels, [40] the clinical findings and investigation results do not suggest more than the need for follow-up. Although some authors, including Kienast, state that skin leasions typically become less and often completely disappear by adolescence, [3,4,16] this is not the case with our patient [12,41].
COVID-19: The Impact of Emerged Omicron on Vaccine Escape
Introduction
Going to the thitd year since the emerging of Covid-19 virus and its global containment effort that ends up with the ongoing scenario of failure to halt virus spread waves or eradication until now. There are many queries raised in what went wrong with repeayed emerging waves. On the other hand, the newly emerged covid Omicron and the expected future coming variant based on the significance of dry lab sequence analysis outcomes on vaccines protuctivity or virus escape indicated fir the crucial need for web lab that will indicate the how far the current vaccines still offering enough prevention or a new vaccine version is required, this review covers the key preventive action that should be taken towards the ideal Covid eradication strategy.
The Current Covid-19 Vaccines
Principally covid-19 vaccines were approved with great expectations to protect healthy individuals from exposure to infection, as well as to enhance recovery and minimize the disease severities, reduces hospitalization, fatality, terminate infected healthy carriers and new cases among the vaccinees. Since initiated covid-19 vaccination in December 2020; and out of more than one hundred vaccine trials; currently only 14 fast track coronavirus covid-19 vaccine has been designed, tested & approved. But an unexpected different scenario took place among the vaccinee as what currently noticed that some of those fully vaccinated captured the infection in addition to the raised issues on the vaccines boosting dosage, number, timing and the best efficient way to deliver the vaccine in order to induce the best types of protective immune response/s toward such respiratory pathogens. The direction and significant of Omicron Covid variant dry-lab analysis vs wet lab results: Sequences based lab analysis known as dry lab, while the real phenotypic are wet-lab; the sequences of viral isolates analyzed in dry lab based showed presence of mutation in term of many variant including Omicron as a common expected feature in RNA viruses [1]. The virus have many structural proteins and genes of which Covid spike is the unique key player that have role on its capacity of invasions to target cell and tissue tropism, bind to receptor/ co-receptor epitope, immunogenicity, passive plasma therapy for sever disease and vaccine success or failure. Covid based sequences outcome should focus on how far its significance the new viral emerged variant such as Omicron in term of the location, number and types of mutation on spike genes S1 & S2, the 3D epitope modified conformation compared to native viral spike and how far the mutations have impact on spike epitopes affinity binding to Ace2 receptor on the fusion of viral particle to target cell and the outcome of the reported mutation on the protective capacity of new variant spike based on wet lab, using the well-known in-vitro virus neutralization test in susceptible VERO-E6 cell lines, towards sera from vaccinee received full Covid vaccines dosage [2]. This wet-lab virus neutralization result outcome remain as the most important and crucial parameter to prove and will tell the reality of legendlegend binding affinity and to give answer for the assumptions raised based on dry-lab sequence analysis about whether those mutations in Omicron spike gene will affect protectivity, partial vaccine escape or fully emerged new viral variant escape totally missmatch the current ongoing Covid vaccines. At any time the wet-lab reported failure of vaccinee sera in virus neutralization, it mean new design of covid vaccine version will urgently require to include the mutant gene or epitopes of both the new Covid variant like Omicron and to maintain the effective and protectiveness of the ongoing covid vaccines.
What Should be Ideal Vaccine Delivery Route toward Covid-19 Eradication
Although covid vaccines offers protection to vaccinees and the current need for a third boosting dose towards Omicron and the challenging pressures on manufacturers to meet the increased covid vaccine market. But still there is a major gap in covid-19 vaccine that clearly appeared on neglecting vaccine delivery route to consider the crucial issue of vaccine capabilities in blocking the virus invasion and replication in its target cell & tissue tropism at entry sites. And the role of spike specific IgA in the neutralization of covid primary replication, attach of viral spike to ACe2 cell receptor that terminates presence of healthy carrier vaccinees [2]. Therefore it is top demand for vaccine capable to induce anticovid- 19 specific mucosal immunity as the key component and most crucial effective mechanisms to halt exposure to infection through blocking early virus entry at the mucosal front line, attached to target cell Aec-2 receptors and inhibits early virus replication among the fully vaccinated population [3-5]. An ideal novel smart covid-19 vaccine need to be designed and delivered to offer the vaccinees with triple immune responses as follows; enough cellular memory and specific higher humoral immunity in term of Covid-19 IgM & IgG responses induced through parenteral immunization routes. In addition to strengthened potent, covid-19 spike-specific mucosal immunity in term of higher covid-19 IgA antibody titer to neutralizes virus inoculum on mucosal lining on upper respiratory, pharyngeal, nasal sites and lung, through mucosal (nasal spray or oral) vaccine delivery as 3rd and 4th doses following initially two parenteral doses [3,6]. Therefore, a new revised covid-19 vaccine design, downstream processing, through encapsulating carrier, mucosal delivery systems post-parenteral dosage to modulate and boost covid-19 spike specific M-cells and APC that promote adherence and transport of vaccine epitopes for triggering covid-19 spike-IgA class-switching as mucosal vaccines that is expected to terminates virus spread and game changer and initialization of pandemic eradication era [7-10]. In addition introduction of such mucosal requires re-adjusting of vaccine testing and efficiency parameters including measurement of covid-19 IgA titer in vaccine and to develop in-vitro neutralization testing protocols & assay for covid-19 mucosal samples (saliva, nasal) and viral specific mucosal dendritic & M-cell flow-cytometry [11,12].
Biochemical Study on the Effects of Ruzu Herbal Bitters Formulation on Wistar Albino Rats
Introduction
The development and use of traditional herbal medicine have come a long way and it corresponds to the Stone Age. In Africa, the practice of traditional healing and magic is much older than some of the other traditional medical sciences and seems to be more prevalent than conventional medicine [1]. World Health Organization (WHO) has defined Herbal medicine as an authorized medicinal herb or herbal materials or herbal preparations and finished herbal products which contain whole plants, parts of plants, or other plant materials such as: barks, leaves, flowers, berries and roots, and/or their extracts as active ingredients intended for human therapeutic use and sometimes animals [2]. It has become a common traditional practice in some cases, that a combination of plants or their extracts is used in the treatment of certain ailments with the believe by the herbalists that the individual plants contain different therapeutic agents in which when combined together will give a better therapeutic efficacy for a particular disease or multiple diseases than that of a single plant.
Figure 1: Ruzu Herbal Bitters.
Therefore, most herbal preparations work in synergy, hence the emergence of polyherbal mixtures. Ruzu herbal bitters (Figure 1) are polyherbal mixtures, produced by Ruzu Natural Health Product and Services, Nigeria. The polyherbal mixture is made up of three different plants: 20% Uvaria chamae (bush banana), 40% Citrullus colocynthis (bitter apple) and 40% Curculigo pilosa (squirrel groundnut). Ruzu herbal bitters are commercially available and the manufacturers concluded that the product has the following medicinal functions amongst others, as indicated in the leaflet of the product: management/treatment of diabetes, typhoid and malaria, high blood pressure, waist and back pains, fibroid, infertility (male and female), gonorrhea/staphylococcus, syphilis, pile, obesity/ stomach troubles, detoxifies the kidney and tones the liver [3]. Based on the medicinal claims of the manufacturer of Ruzu herbal bitters with paucity scientific proofs, there was need to carry out scientific investigations to ascertain its effects on wistar albino rats by assessing biochemical indices.
Materials and Methods
Materials and Chemicals
Syringes and needles, hand Gloves, incubator, glucometer, Aucku check active strip micropipette, stop watch, oven, centrifuge Model 800, cotton wool, HPLC, and GCMS. The chemicals included 10% Chloroform, xylene, hemotoxylin and eosin stains.
Collection of Herbal Formulation Samples
Ruzu Herbal Bitters a Nigerian Herbal formulation was purchased from a registered pharmaceutical shop (Cynflac Pharmacy Yenagoa, Bayelsa State). The product is a combination of several medicinal plants. As an inclusion criterion, the product was ascertained to have been registered with the National Agency for Food, Drug Administration and Control (NAFDAC number: A7- 1102L). The manufactured and expiry dates of the product were inspected and all were confirmed to be within the acceptable time frame. The Manufacturer’s seal, inspected to ascertain the authenticity of the product was intact in the bottles of the syrup purchased for the analysis and was taken to the Research Laboratory, Department of Pharmacology, Faculty of Basic Medical Sciences, College of Health Sciences, Niger Delta University, Wilberforce Island, Bayelsa State and was stored under room temperature prior to the experiment.
Experimental Animals
Animal Handling: Twenty (20) adult albino rats used for this study were purchased from the animal house of the Faculty of Basic Medical Sciences, College of Health Sciences, Niger Delta University, Wilberforce Island, Bayelsa State. The animals were kept in standard plastic rat cages in the research laboratory of the Department of Pharmacology, Faculty of Basic Medical Sciences, College of Health Sciences, Niger Delta University, Wilberforce Island, Bayelsa State. The animals were allowed to acclimatize for 7 days under standard laboratory conditions with free access to commercial grower’s mash (Delta Feeds), water ad libitum and 12h/ 12h light/darkness cycle and fresh air prior to the inception of this study. The animal experiment was conducted in accordance with internationally accepted practice for laboratory animals and approved by the Animal Ethics Committee of the Faculty of Basic Medical Sciences, College of Health Sciences, Niger Delta University, Wilberforce Island, Bayelsa State.
Administration of Poly-Herbal Formulation: The herbal formulation was administered using 5ml syringe, the corresponding dose was given to each rat based at 5, 10 and 15 mg/kg body weight dose of the herbal formulation was selected.
Experimental Design
After the period of acclimatization, the animals were randomly divided into experimental and control groups. The albino rats were grouped and herbal formulation administered as follows;
• Group 1 (n = 5) Control: Albino rats received 2ml of distilled water daily within the period of the study before sacrificing.
• Group 2 (n = 5) Albino rats were treated with 5 mg/kg body weight of Ruzu Herbal Bitters
• Group 3 (n = 5) Albino rats were treated with 10 mg/kg body weight of Ruzu Herbal Bitters
• Group 4 (n = 5) Albino rats were treated with 15 mg/kg body weight of Ruzu Herbal Bitters.
Blood Sample Collection: The animals were observed in their cages for clinical symptoms daily and at the end of the 14 days treatment, the rats were sacrificed under chloroform anesthesia and blood was collected by cardiac puncture, using 5ml syringes and 23G needles into blood sample containers. The blood was allowed to stand for 2 hours to coagulate and was centrifuged for 10 minutes at 2000 rpm and the supernatant (Serum) carefully collected for biochemical analysis.
Biochemical Analysis: Serum levels of aspartate aminotransferase (AST) and alanine aminotransferase (ALT) were determined following the principle described by [4] while the alkaline phosphates (ALP) were carried out according to the method described by [5] to assess liver function. Renal function was assessed by measuring plasma creatinine (CREA) levels and blood urea nitrogen (BUN) was assayed following the method of [6,7]. In order to assess the synthetic function of the liver, total serum protein (TP), Total bilirubin and albumin (ALB) concentrations were determined according to the principles based on the Biuret reaction [8] and bromocresol green reaction [9] respectively. Total Serum cholesterol (TC) concentrations were estimated following the method described by [10].
Statistical Analysis of Data: All data were expressed as Mean ± Standard Error of Mean (SEM). Significant differences among the groups were determined by One-Way Analysis of Variance (ANOVA) using the statistical analysis program for social sciences (SPSS 17.0).
Results
Biochemical Parameters
The Body Weight of wistar albino rats administered with Ruzu herbal bitters formulation is shown in Table 1. Table 2 shows the effects of Ruzu herbal Bitters formulation on biochemical indices of wistar albino rats at 5, 10 and 15mg/kg doses. The renal, hepatic, cardiac and lipid profile indices analyzed were albumin, total protein, urea, creatinine, Alkaline Phosphatase (ALP), Alanine aminotransferase (ALT), total bilirubin, Aspartate aminotransferase (AST) and total cholesterol and were compared with the control groups. All mean values of total protein and creatinine levels analyzed were significantly higher while albumin levels were lower when compared with the control. Higher concentrations (10 and 15mg/kg) of ALT, AST, ALP and total cholesterol were significantly higher when compared with the control. Whereas lower (5mg/kg) concentration of urea and total bilirubin levels in the experimental animals were observed to be higher when compared with the controls. Statistically, there were no significant differences of the analyzed parameters at 95% confidence level (P < 0.05).
Table 1: Body weight of wistar albino rats administered with Ruzu Herbal Bitters.
Note: (Mean ± SEM, n = 5)
Table 2: Effects of Ruzu Herbal Bitters on Biochemical indices of wistar albino rats.
Note: Data are Means ± SEM; n=5. Means of the same superscript alphabets in the same column shows no significant difference at 95% confidence levels (p<0.05).
Discussion
Herbal medicines are now receiving greater attention as an alternative to clinical therapy leading to increase in their demands [11]. In the rural communities of developing countries, the exclusive use of herbal drugs to treat various diseases is still very common and is prepared most often and dispensed by herbalists without formal training. Experimental screening method is therefore important in order to establish the active components present, ascertain the efficacy and safety of the herbal products [12]. The evaluation of the safety of these poly-herbal products is presently carried out in animals. In risk assessments, there are better correlations between rats and humans, whereas it is less predictive when mice are used for experimental [13]. Therefore, the aim of this study was to assess the effects of Ruzu Herbal Bitters formulation on wistar albino rats by carrying out biochemical parameters as marker enzymes. Study of the renal profile such as total protein, urea, creatinine and albumin levels give useful information about the poly-herbal formulation-induced renal toxicities. Animals which received herbal formulation in 5, 10 and 15mg/kg body weight doses did not show any significant changes in albumin levels. Decreased serum levels of albumin occur when there is impairment in the synthesizing function of the liver [14] therefore; the significant decrease in serum levels of albumin observed in this study may be an indication of liver impairment. However, animals at 5, 10 and 15mg/kg body weight doses showed highly significant increase in creatinine and total protein levels when compared to the control group. Creatinine levels are used as marker of kidney function.
Previous studies have shown that an apparently minor increase in serum creatinine can reflect a marked decrease in glomerular filtration rate [15]. Thus, elevated serum levels of creatinine may indicate kidney injury, with resultant reduced glomerular filtration. The results are synonymous with the findings of [16]. Urea is formed in the liver, representing the principal waste product of protein catabolism and is excreted by the kidney. In this study, urea levels at 10 and 15mg/kg doses shows significant decrease. However, the minimal increase in serum levels of urea at 5mg/kg dosage observed in the poly-herbal formulation group may be due to nephrotoxic effect of the herbal formulation, leading to reduced renal function. Liver damage tempted by herbal formulations or synthetic drugs may consist of hepatocellular necrosis, cholestasis, or a mixture of biochemical and histopathological patterns [17]. The estimation of AST, ALT and ALP is suitable in the early diagnosis of viral or toxic hepatitis and thus patients exposed to hepatotoxic drugs [18]. Generally, perturbation of parenchymal cells of the liver by xenobiotics or drugs results in elevation of both transaminases (AST and ALT) in the blood [19]. AST has both mitochondrial and cytoplasmic origin and any elevation could be taken as a first sign of cell damage that leads to the appearance of these enzymes in the serum [20]. Hence animals were tested for ALP, ALT, AST and total bilirubin levels to check for hepatic and cardiac toxicity. Therefore the increases observed in AST (15mg/kg) and ALT (10 and 15mg/ kg) activities in this study suggest that the administration of Ruzu herbal bitters did interfere with the integrity of the parenchymal cell. However the increase was only significant in the high dosage groups. The findings of this study were in agreement with the works of [21].
One of the major enzymes involved in hepatobiliary evaluation is alanine amino phosphatase (ALP). ALP levels above normal are mainly associated with blocked bile duct although this enzyme is also concentrated in the kidney and bone. The liver, via bile excretes ALP, whenever liver function is compromised the excretion of bile by the hepatocytes diminishes and this results in the increased levels in the serum ALP [22]. There was no significant increase in the ALP values at 5 and 15mg/kg body weight dosages, suggesting that Ruzu herbal bitters at the above doses did not obstruct bile excretion nor caused congestion and therefore Ruzu herbal bitters has no tendency to cause cholestasis. However, a minimal increase was observed at 10mg/kg dosage for ALP and 5 mg/kg dosage for total bilirubin when compared with the control groups. The non-significant and minimal increase observed in ALP and total bilirubin levels in this study is an indication that Ruzu herbal bitters did not impair the capacity of the liver to excrete bilirubin. Liver disease is characterized by an elevation in the serum levels of alkaline phosphatase (ALP), while hyperbilirubinaemia is seen in conditions causing hepatic liver diseases that impair the excretion of bilirubin [23]. This result is in accord with the works of [24,25]. The minimal increase in 15mg/kg dose observed in serum total cholesterol in the animal group may be due to the effect of the herbal formulation. The increase in the serum levels of total cholesterol may be attributed to the toxic effect of the formulation, leading to hepatobiliary disorders and impaired cholesterol metabolism. However the increase was only significant in the high dose group. These findings were in agreement with the works of [26].
Conclusion
In conclusion, this study has provided an insight and data on the Nigerian Poly-herbal formulation (Ruzu Herbal Bitters) which may be relatively safe at lower therapeutic dosage. However, at higher therapeutic dosages and prolong administration may result in renal, hepatic, cardiac and hepatobiliary disorders. Therefore, the creation of public health awareness becomes imperative on the safety and the impending health risk associated with the administration of the poly-herbal products.
Dental Arch Dimensions in a Matched Pairs Study of Hypodontia Patients and Controls
Introduction
Hypodontia is a common variation of tooth number in the population. In the permanent dentition approximately 25% of individuals have 1 or more congenitally missing third molars and some 3.5% to 7% of the population have hypodontia of other permanent teeth [1-6]. The condition is more frequent in females and approximately 90% of affected patients have less than 4 permanent teeth, other than third molars, congenitally absent. The condition can present challenges requiring careful long term treatment planning and care involving general practice, paediatric dentistry, orthodontics and restorative dentistry. Variations in tooth size and shape are well established in patients with congenitally missing teeth and may also occur in other components of the stomatognathic system [7-9]. As part of an international collaboration investigating the aetiology and clinical implications of hypodontia, this paper explores dental arch morphology in mild or moderate hypodontia. The dental arches and the dentition are two closely related components of the stomatognathic system, which develop in anatomical proximity over an extended time period from early in utero to early adulthood. The dental arches and the dentition are both complex systems, whose development is determined by multiple interactions between genetic, epigenetic, and environmental factors [10-12]. Interactions continue as development progresses through cellular, soft tissue and mineralisation stages to the emergence of the mature phenotype [9]. Hypodontia is an outcome of these complex interactions [13]. Similarly, in addition to genetic factors, the dimensions and shape of the dental arch are influenced by the configuration of the underlying basal bone and the actions of prenatal and postnatal environmental factors [14-17]. Postnatal environmental factors that have been identified include: the intraoral and circumoral musculature [18,19], sucking habits [20], postural and breathing patterns [21] and early loss of primary teeth [22]. There have been varying results in previous studies of dental arch morphology in patients with hypodontia. Woodsworth, et al. [23] found no significant differences in hypodontia patients compared to controls, Paulino, et al. [24] found greater intercanine and intermolar distances in the permanent dentition of adolescent and young adult men than in women, while Nelson, et al. [7] and Higgins [25] report the upper arch depth and chords were significantly reduced. They found greater differences in severe hypodontia. Sex differences are present in arch dimensions [26] and the degree of change in hypodontia may vary between male and female patients. Moreover, the differences may be greater in the upper arch than the lower [27] and may be influenced by the location of the congenitally missing teeth [7]. The aim of the present study is to investigate dental arch dimensions using a well validated 2D image analysis system [7,28,29] in a sample of hypodontia patients and matched controls to determine if there are any differences and, if so, how these relate to the sex of the patient, the location of the congenitally missing teeth and the upper and lower arches.
Materials and Methods
This study was approved by the Ethics Committee of the Scientific Research of the George Emil Palade University of Medicine, Pharmacy, Science and Technology of Tirgu-Mures (Approval no. 60/07.03.2018). The participants gave their written informed consent. Sixty patients with hypodontia, 40 females and 20 males, having a mean age of 15.40±2.85 years were included. The criteria for inclusion were the congenital absence of one to five permanent teeth, excluding third molars and that the formed permanent teeth were fully erupted. Diagnosis was based on dental history, clinical examination and orthopantomograms. Exclusion criteria were the presence of any other congenital conditions, syndromes, or a history of orthodontic treatment or tooth extraction. The same number of controls with complete permanent dentitions, matched for sex, age, ethnicity and exclusion criteria were also studied. Mean age in the control group was 15.48±2.87 years. In order to examine the possible influence of location of the congenitally missing teeth anterior (26 cases) and posterior (31 cases) hypodontia subgroups were formed. Anterior hypodontia was defined as missing upper and lower incisors and/or canines. Posterior hypodontia was defined as missing upper and lower premolars and/or molars, excluding third molars. For these subgroups age- and sex- matched controls were selected from the control group (Figure 1).
Figure 1: Image of measuring the depth of the palatal vault.
Table 1: Definition of measured parameters.
Alginate impressions (Ypeen Premium, SpofaDental) were taken for each individual from the upper and the lower arch. Study models were made from dental stone (FujiRock, GC). Images of the study models were taken with a digital camera (Nikon D3100, Nikon Corporation, Japan) and macro lens (Tamron SP AF-S 90 mm f/2.8). The camera was fixed above the dental cast, on an adjustable stand (Kaiser 5360, Kaiser Fototechnik, Germany) with two fixed led bulbs providing standard lighting conditions. Images of the dental arches were transferred using View NX2 (Nikon Corporation) and processed by the Image Pro Insight 9.3 software (Media Cybernetics, USA). Each image taken included a ten-millimeter scale for calibration and the measurements were made directly on the images. The 2D measurements of the dental arches were the arch circumference, arch length, intercanine width, intermolar width and the depth of the palatal vault. The definitions used for these measurements are given in (Table 1). The measurements were all carried out by the first author. Intraoperator and interoperator reproducibility was determined using the upper and lower models of 8 individuals. Three trained operators carried out the procedures separately, including image capture, calibration and measurement of selected dimensions, on 2 occasions, 2 weeks apart. Statistical analysis was performed using MedCalc (MedCalc Software Ltd). After excluding outliers, normal distribution of the data was confirmed (Shapiro-Wilk test of normality). Intraclass Correlation Coefficients (ICC) were determined to assess reproducibility of measurements. Correlations were also calculated between the number of missing teeth and the arch parameters. Significance of the differences was assessed using one-way ANOVA test, two-way ANOVA test with Bonferroni correction and Pearson’s correlation coefficient. The significance level was set to 0.05.
Results
The intra-operator and inter-operator reproducibility was excellent, with all ICC values being higher than 0.9. (Table 2).In the overall hypodontia group there were 29 patients with one congenitally absent tooth, 23 with two, 2 with three and 6 patients with four congenitally absent teeth. Lower second premolars were the most often missing teeth, followed by the upper lateral incisors, upper second premolars, lower first incisors and lower second molars. In the subgroups, for anterior hypodontia 13 female and 13 male cases were found, with upper lateral and lower central incisors missing. For posterior hypodontia 24 female and 7 male cases were found, with upper and lower second premolars and lower second molars missing. Three cases had both anterior and posterior congenitally missing teeth and were not included in either subgroup. When all hypodontia cases were compared to matched controls, significant differences were detected both in upper and lower arch parameters. Arch circumference, arch length and intercanine width values were significantly smaller in the hypodontia group for the upper arch than in controls. The more teeth that were missing, the lower the upper arch circumference was. In the lower arch intermolar width values were significantly higher in the hypodontia group than in controls (Table 3). More significant differences were seen in male patients than in female patients in the upper arch, although the interaction between the sources of variation was not significant in every case.
Table 2: Intraclass correlation coefficients.
Table 3: Mean values of measured parameters for all hypodontia patients compared with matched controls for both upper and lower arches; SD=Standard Deviation.
Intermolar width differences were significant in women (p=0.02), while in men arch length differences (p=0.008) were significant in the lower arch (Table 4). For the anterior hypodontia subgroup in the upper arch statistically significant smaller arch circumference, arch length and intercanine widths values were found in the hypodontia patients (Table 5). In the lower arch significantly greater intermolar width values were seen in the posterior hypodontia subgroup than in matched controls (Table 6). The analysis of variance highlighted differences also between the anterior and posterior case subgroups. The upper arch circumference and the upper intercanine widths was significantly lower in the anterior subgroup than in the posterior subgroup for hypodontia cases (p<0.001).Significant negative correlations were detected between the number of missing teeth and other parameters. All statistically significant results are shown in (Table 7). When correlating the upper arch parameters for all cases with the number of missing teeth, significant negative correlations with the intermolar width were seen. The higher the number of missing teeth, the lower the upper intermolar width was. On the other hand, when looking for correlations based on sex, strong negative correlations were detected only in men and only in the upper arch (Table 7). Regarding the anterior hypodontia subgroup, both the upper and lower arches showed significant correlations between the number of congenitally missing teeth and some of the parameters (Table 7).
Table 4: Mean values of measured parameters for females and males with hypodontia compared to matched controls; *significantly lower than values from the control group, when interpreting separately.
**significantly higher than values from the control group, when interpreting separately; SD=Standard Deviation.
Table 5: Mean values of measured parameters in upper arch for anterior and posterior hypodontia subgroups and matched controls; †3 patients were excluded from this section as they had both anterior and posterior hypodontia; SD=Standard Deviation.
Table 6: Mean values of measured parameters in lower arch for anterior and posterior hypodontia subgroups and matched controls; †3 patients were excluded from this section as they had both anterior and posterior hypodontia; SD=Standard Deviation.
Table 7: Statistically significant negative correlations between the number of missing teeth and different parameters.
No significant correlations were found for the posterior hypodontia subgroup.
Discussion
The validity of the study can be examining the nature and structure of the sample, the study design, the pattern of hypodontia in the subjects, the measurement techniques, the reproducibility found and the raw data. The sample is derived from a single ethnic group and is of a Dental Age [30] where the dental arches have developed to maturity in width and length [31,32]. The sample size is satisfactory as determined by power calculations [7] and the controls are matched for age, sex, and ethnicity. The matched pairs design and the pattern of congenitally missing teeth accords with previous studies [1,6,33]. The accuracy and validity of the 2D image analysis system used here has been established over a series of studies [7,12,28,33].The hypodontia patients included in the present study had significantly smaller arch circumference, arch length and intercanine width in the upper arch than controls. This agrees with the findings of Nelson et al. [7] for their mild/moderate hypodontia group; in their severe hypodontia group the differences were greater. Bu, et al. [26] report similar results.In the present study the only significant difference in the lower arch was a larger intermolar width in the hypodontia group. This has previously been reported by Hobkirk, et al. [34], but not by Fekonja [27] and Higgins [25]. These contrasting findings could have arisen from difference in measurement techniques. A possible explanation for a larger lower intermolar width could be increased tongue pressure in the lower molar region arising from the position of the tongue in response to the narrower upper arch [34]. Moreover, if the lower second premolars are congenitally absent, the lower second primary molars may be retained, preventing the forward movement of the first permanent molars, and holding them back in a wider arch. Arch dimensions in females and males were investigated separately because differences had been suggested by Berwig, et al. [35]. The present study also showed sex differences, with greater reductions in males compared to their control group. In the upper arch the male hypodontia patients had highly significant reductions in arch circumference, arch length, and intercanine width, while females had less difference in these three parameters from their controls. The location of the congenitally missing teeth had significant impact on the dental arch parameters. In the upper arch, when maxillary lateral incisors were congenitally absent, the arch circumference, arch length and intercanine width were all significantly reduced, suggesting that the presence or absence of these teeth may have a substantial effect during upper arch development. While the growth of the maxilla is affected by the missing anterior teeth, in the posterior hypodontia group, in which the maxillary second premolars were congenitally absent, no significant differences were found. In the lower arch the only significant difference was an increase in the intermolar width in the posterior hypodontia group in which the lower second premolars were absent. These changes in the dental arches occurred in those hypodontia patients most frequently encountered in clinical practice. A recent study of the orthodontic treatment of similar patients in a Western Australia private practice reported a trend away from space opening and prosthetic replacement to space closure over the years 2000 to 2017/18 [36]. The findings of the present basic science study suggest that within any such general trend, different treatment plans may be appropriate for individual patients. In (Tables 3-5) while the mean values for the arch circumference, arch length and intercanine width in the maxillary arch are all smaller for hypodontia patients than those of controls, the standard deviations are greater. This indicates more variation in the amount of space available, which will also be affected by the extent of reduction in the size and shape of the teeth present. In conclusion, the evidence from this study in relation to the aim shows that hypodontia does influence the dimensions of the dental arches. Different parameters in hypodontia patients are affected to different degrees: the upper arch is more affected than the lower; males are more affected than females and the location of the congenitally absent teeth is influential. The changes are evidence of interactions between two complex adaptive systems, the dentition and the dental arches, that are components of the stomatognathic complex. They also interact with a third component, the tongue. The underlying factors in these interactions during development are genetic, epigenetic and environmental [13]. The question remains as to the relative influence of genes and genetic mutations that are common to both the teeth and the arches compared with the environmental effects arising from the congenital absence of teeth in specific locations, resulting in a lack of stimulus to bone growth. This study provides a basis for further investigations of this and other samples to examine this question further.