Biomedical Journal of Scientific & Technical Research (BJSTR) is a multidisciplinary, scholarly Open Access publisher focused on Genetic, Biomedical and Remedial missions in relation with Technical Knowledge as well.
Effect of Phosphorous Fertilizer on the Functioning and Functioning Component of “Brassica Napusl (B.N.) in Rain Fed Agriculture, in Different Groups Phosphorous Soil Fertility
Introduction
“Brassicsa napusl” is oil producing plant which plays important role in the human nutrition with its oil production, and it also has an important role in the food for animals and birds [1]. This plant contains more than 40% oil in its seeds and about 40% protein in its meal and that is why this plant is considered very important [2-4]. High amount of oil contamination in canola and also suitable corrected acidic fat mixture cause its dominance in the world market. Since, more than 90% of the country’s eating oil is imported from abroad, therefore it is important to value this plant [4]. Sandhu, et al. [5] reported in their research shortage of phosphor caused stop in the growth and formation of reproductive organs and grows very slowly and therefore the plant is short in branches and the number of saddles, weight in every 1000seeds. MaJumdar and Sandhu[5]reported that the phosphor fertilizer in the number of seeds in saddle, weight of 1000 seeds has been increased a little but their results did not have any effect in the increase of the functioning. Holmes, et al. [6-7] showed in their research that phosphorous seeds very rarely have high effects on the rape seed’s function and the height of this effect depend on the amount of phosphor in the soil. In Indian soil it has been reported that the phosphorous fertilizers have positive reaction on the functioning and functioning component but its 3effect is little [5,8- 10]. Sajed, et al. [1] in an analysis on the Zucchini with thin layer seeds reported that using of phosphorous fertilizer caused increase in the number of lateral shoots, functioning, number of fruit and the amount of seeds production.
Materials and Methods
The test has taken place in Behbahan in southeast of Khozistan state with the longitude 12`, 15° east and latitude of 36`, 30° north and the height of 320 meters from the sea level. Behbahan is an area with semi deserted climate which located in hot steppe climate. Average of rainfall and 10 years temperature is equal to 313.5 milli meters and 25 degrees centigrade respectively. To understand the effect of phosphorus fertilizer on the functioning and sub functioning of component of canola in the rain fed agriculture in different groups of soil phosphorous fertilizing, 16 tests have been conducted in 4 areas. In each area 4 tests in 4 groups of phosphors usable in soil (less than 3ppm, between 3-6ppm, between 6-10ppm and more than 10ppm) have been repeated in 4 treatments of phosphorous fertilizer in the form of complete random block (0, 25, 50, 75 k.g. p2 o5 in hectare) from the triple super phosphate. It means that in each group of soil fertilizing by the amount of phosphate used in the soil for test in the form of complete random block plan in 4 treatments of phosphoric fertilizer in 4 repetitions. The space between these 4 areas are about 35 to 50 kilo meters and the space from the fields to each area was between 3 to 5 kilometers therefore each test consists of 16 terraces. Each terrace with the length of 5 meters with 8 implant lines with 30 centimeters space between them and the space between the bushes on each row was 5 centimeters, the space of terraces in relation to each other in each side was 1.5 meter and the repetitions space also was 1.5 meter. The date of implanting was fixed on the date of the first rainfall in the autumn in the area. Hayolla 401 was used in the test. Method of cultivation was serial and the amount of used seeds was 8 kilograms in hectare. In all the treatments 60kg/ha pure nitrogen (1/2 base +1/2 at the time of shooting (stemming) from the urea source and 50 kilograms of K2 O in each hectare from the potassium sulfate were used as the base. Gain for removal after ripening of saddlebags from an area equal to (1.5*4 meters or 6 meters) from each terrace was done and seed’s functioning has been determined at the moisture of 10%in hectare. The numbers of bushes in unit, number of seeds in saddlebag, number of saddlebag in bush in unit and the weight of one thousand seeds were measured. In this research MSTAT software was used for statistical analysis. Comparisons of averages have been conducted according to LSD test. Variance analyses of 2 agricultural years have been conducted according to composite variance analysis.
Results and Discussion
Functioning and Functioning Components
Results of composite variance analysis of 2 agricultural year on the functioning and functioning components showed less than 3 percent ppm in the fertilizing group of phosphorous soil which shows that the effect of phosphorous fertilizer’s treatment on the seed, saddle, number of seeds in the saddle and weight of 1000 seeds isn’t meaningful but the mutual effect (area *fertilizing group) on the seed functioning is meaningful (Table 1). Results obtained from (Table 2) for comparison of fertilizer treatment with witness treatment according to “LSD” test show that there isn’t a meaningful difference through the seed functioning, number of saddle, number of seeds in saddle and thousand seeds weight between witness treatment with the fertilizing and all are located in one group. In 3-6 ppm soil phosphor of fertilizing group, effects of phosphorous fertilizer treatment on the seed functioning, number of saddles, number of seeds in a saddle and weight of 1000 seeds could be found which was not meaningful. The mutual effect (phosphorous fertilizer * fertilizing group) of this group on the seed functioning is meaningful but, on its components, it isn’t meaningful and mutual effect (areas * fertilizing group) on the seed functioning is meaningful (Table 3). According to LSD test there isn’t a meaningful difference between phosphorous fertilizer treatments with phosphorous fertilizer with witness treatment (Table 4).
Table 1: Compound variance analysis functioning and functioning component rape in fertility group soil absorption phosphorus < 3ppm.
Table 2: The mean comparison two-year, number of sheath bags, number of seeds in the sheath, weight of each 1000 seeds, seeds functioning, in phosphorus deferment treatments, in regions with fertility (<3ppm) for applied test (L.S.D).
Note: The effect treatment no significant for properties no mention amount (L.S.D).
Table 3: Compound variance analysis functioning and functioning component rape in fertility group soil absorption phosphorus between 3-6ppm.
Table 4: The mean comparison two-year, number of saddle bags, number of seeds in the saddlebags, weight of each 1000 seeds, seeds functioning, in phosphorus deferment treatments, in regions with fertility (3-6ppm) for applied test (L.S.D).
The composite variance analysis in phosphorous fertilizer treatment absorbable in the soil during two years showed ppm of between 6 to 10. The effect of phosphorous fertilizer treatment and the mutual effect in this group (phosphor fertilizer * fertilizing group) on the functioning and its components was not meaningful. But mutual effect (areas * fertilizing group) on the seed functioning was meaningful. On one hand according to LSD test there wasn’t a meaningful difference between fertilizing treatments with witness treatment in the group. (Tables 5 & 6). In phosphorous soil of fertilizing group of more than 10 ppm results of composite variance analysis for two agricultural years were shown. Phosphorous fertilizing treatment and their mutual effect (phosphor fertilizer * fertilizing group) on the seed’s functioning was meaningful. (Table 7). Results of table 8 show that there isn’t a difference between phosphorous fertilizing treatment with a witness treatment according to LSD test. Considering the results of the test, it can be said that phosphorous fertilizer very rarely have much effects on the seed functioning of Brassica napuls. on the other hand, some of the soil specifications such as organic materials, moisture and the amount of phosphor absorbable in the soil are effective. In the soil with higher amount of organic materials and more suitable moisture the functioning is difference in relation to witness treatment even though it isn’t meaningful.
Table 5: The mean comparison two-year, number of saddle bags, number of seeds in the saddlebags, weight of each 1000 seeds, seeds functioning, in phosphorus deferment treatments, in regions with fertility (3-6ppm) for applied test (L.S.D).
Table 6: The mean comparison two-year, number of saddle bags, number of seeds in the saddlebags, weight of each 1000 seeds, seeds functioning, in phosphorus deferment treatments, in regions with fertility 6-10ppm for applied test (L.S.D).
Note: The effect treatment no significant for properties no mention amount (L.S.D).
Table 7: Compound variance analysis functioning and functioning component rape in fertility group soil absorption phosphorus over >10 ppm.
Table 8: The mean comparison two-year, number of sheath bags, number of seeds in the sheath, weight of each 1000 seeds, seeds functioning, in phosphorus deferment treatments, in regions with fertility (over 10ppm) for applied test (L.S.D).
The amount of phosphor absorbable in soil in group of (3-6) and (6-10) ppm in relation to phosphor group absorbable (less or very high) has suitable effect on the seed functioning. In some of the soil phosphor fertilizing group (medium or high), the amount of fertilizing phosphor, number of saddles and weight of 100 seeds increases a little but their 3effect on the seed functioning is not enough in research on the Brassica napuls plant it has been reported that phosphorous fertilizer does not increase the seed functioning but the height of the plant, number of intial subshrubs and number of saddles will increase a little and also the phosphorous fertilizer has no effect on the number of seeds and weight in 1000 seeds. Mojumdar and Sandhu [5] reported that phosphorous fertilizer increases the number of seeds and weight of 1000seeds a little. But their results have no effects on the increment of seed function. Holmes and AInseley [7-8] mentioned that the phosphorous fertilizer very rarely causes effects on the B.N seed functioning and its effect depends on the amount of phosphor in the soil. In India regarding the effect of phosphorous fertilizer on the function and its components no positive reaction was noticed. The reason for it is due to the soil condition. Singh, et al [9-14] regarding Indian soil reported that the phosphorous fertilizers have positive effect on the functioning and its components, but it is a little. On research on the medical plant of paper seed pumpkin reported that more phosphorous fertilizer showed the number of seeds in the bush, weight of dried seed in bush and maximum weight of dried seed in each square meter. Also, the use of phosphorous fertilizer causes increase in the number of lateral shoots, functioning and the number of fruit and amount of medical pumpkin seed’s production [1,15].
Conclusion
Different treatment of phosphorous fertilizer in all groups of soil phosphorous fertilizing have no meaningful effect on the functioning and functioning component of B.N. (number of saddles, number of seeds in the saddle and weight of 1000 seeds.
The Mosquitoes (Diptera: Culicidae) and their Medical and Veterinary Importance in an Arid Zone of Central Iran
Introduction
More than 17% of infectious diseases are vector-borne diseases that cause 700,000 deaths annually [1]. About 60% of emerging and re-emerging infectious diseases are zoonoses. In the last three decades, more than 30 new human pathogens have been identified, 75% of which are of animal origin [2]. In the Eastern Mediterranean Region of WHO, zoonoses are a public health threat [3]. Mosquitoes are considered the most important arthropods in medicine and health due to the transmission of pathogens causing some important infectious diseases such as malaria, filariasis, and arboviral diseases [4-6] and are present worldwide except Antarctica [7]. Mosquitoes belong to the order Diptera, suborder Nematocera, and family Culicidae [8]. Culicidae has two subfamilies Anophelinae and Culicinae and 70 species in Iran. Mansonia uniformis was the newest genus and species that was added to the mosquito fauna in Iran [9]. Mosquito larvae are found in a variety of environments, including natural and man-made habitats, with temporary or permanent water sources, stagnant or running water, contaminated or clean water, with or without vegetation. Mosquito larvae are also found in small places where water collects, such as pots, used tires, and animal footprints [4,5]. According to the latest study conducted of mosquito fauna in Kashan, there are 3 genera and 13 species in this county including Anopheles. claviger, An. maculipennis s.l., An. superpictus s.l., An. turkhudi, Culex deserticola, Cx. hortensis, Cx. mimeticus, Cx. perexiguus, Cx. pipiens, Cx. theileri, Culiseta annulata, Cs. longiareolata, Cs. subochrea [10], also Cx. torrentium larva has been found at an ovitrap in Kashan County [11], and species of Anopheles multicolor, Culex modestus, Aedes caspius, and Ae. pulcritarsis have been reported from previous studies in this county [12,13]. Susceptibility to mosquito-borne diseases has increased due to globalization and led to the spread of emerging and re-emerging pathogens in new and old habitats. Economic and social factors, global trade, transport and tourism have caused the spread of vectors and diseases transmitted by them [7,14]. In livestock, mosquito bites may cause stress and pain, resulting in reduced livestock fitness. In addition, mosquitoes can also transmit pathogen between livestock reservoirs (episodic) and, humans (zoonotic diseases) [7]. Mosquitoes can transmit pathogens in Iran, including causes of arboviral diseases (avian pox, bovine ephemeral fever, dengue fever, Rift Valley fever, West Nile fever), bacterial diseases (Anthrax, Tularemia), helminthic diseases or helminthiases (mosquito-borne filariasis), protozoans (Avian malaria, Human malaria) [6]. Due to global climate change, more animal and human populations will be exposed to these pathogens [7]. Due to the importance of mosquitoes in human and animal health, the present study was performed to evaluate diseases transmitted by mosquitoes and the status of these diseases in Kashan County
Mosquito- Borne Diseases in Kashan County
To find diseases transmitted by mosquitoes, we searched the terms “mosquito-borne pathogens”, “mosquito-borne diseases”, “mosquito-borne infections”, “mosquito-borne viruses”. Data were extracted from all articles. An intensive search of scientific literature was reviewed using the search term in the following databases: “PubMed”, “Web of Knowledge”, “Scopus”, “Google Scholar”, “SID”, etc. Mosquito-borne disease names including ‘malaria, avian malaria, West Nile (WN) fever, Dengue (DEN) fever, Sindbis (SIN) fever, lymphatic filariasis, tularemia, tularaemia, anthrax’, lumpy skin, and mosquito-borne pathogens such as Plasmodium, Dirofilaria, Flavivirus, Alphavirus, Phlebovirus, Orthobunyavirus were reviewed. Also, cases of mosquito-borne diseases identified in Kashan, were inquired from Kashan University of Medical Sciences and Kashan Veterinary Organization.
Protozoal Diseases
Human Malaria
Malaria is a health threat. This disease is caused by a parasite that is transmitted to humans through the bite of infected Anopheles mosquitoes and can be prevented and treated. In 2019, almost half of the world’s population was at risk for malaria. Most deaths occur in sub-Saharan Africa. However, Southeast Asia, Eastern Mediterranean, Western Pacific, and Americas also have the case of diseases and deaths. In 2019, cases and the number of deaths due to malaria were 229 million and 409,000, respectively. Plasmodium falciparum and Plasmodium vivax are the most important parasite species of human malaria [15,16], which are biologically transmitted by some anopheline mosquitoes [17]. Many effective efforts have been done for malaria control in the past that caused decreased morbidity and mortality in Iran [18,19]. At the present, malaria has been eliminated in most parts of Iran [20]. A malaria pre-elimination program started in Iran in 2009, restricted the local transmission of this disease [21]. The results of a study showed that the imported cases (from the eastern neighboring countries) have increased from 2009 onward, compared to indigenous cases [20]. WHO (2020) reported the Islamic Republic of Iran had no indigenous malaria cases in 2018 and 2019[15]. Kashan County is located in the central plateau region of Iran, where have a lower risk of malaria infection compared to southern/ southeastern parts. Seven Anopheles species (An. maculipennis Meigen s.l., An. sacharovi Favre, An. culicifacies Giles s.l., An. dthali Patton, An. fluviatilis James s.l., An. stephensi Liston, An. superpictus Grassi s.l.) are malaria vectors in Iran [22]. Anopheles superpictus s.l. species is the most abundant and distributed among Anopheles in Kashan County [10,12,13], and is one of the seven species of malaria vectors in Iran [22,23], also An. maculipennis s.l. [10,12], An. claviger [10,12,13], An. multicolor [12,13], and An. turkhudi [10] have been reported from Kashan County. An. maculipennis s.l. is the main vector in the Caspian coast in northern Iran [24]. In Kashan County, from 1986 to 1997, a total of 498 malaria patients have been reported, of which 95% were Afghan immigrants and 5% were Iranian travelers or immigrants from other parts of the country [13]. There are malaria cases from 2005 to 2020 and parasite species in Table 1, all malaria cases in these years were reported from Afghan immigrants.
Table 1: Human malaria cases and parasite species from 2005 to 2020 in Kashan County.
Avian Malaria (Bird Malaria)
Culicidae mosquitoes belonging to different genera (Culex, Coquillettidia, Aedes, Mansonia, Culisetta, Anopheles, Psorophora) transmit many species of avian Plasmodium [25-29]. Bird malaria has been reported in some provinces of Iran including Fars Province [30,31], and Mazandaran Province [32,33]. Kalani et al. for the first time, reported two hematozoa, including Aegyptianella and Plasmodium in Isfahan Province [34]. But no information is available about the vectors of this disease in birds in these provinces. Culex pipiens is the main vector in some countries including Austria [35], Japan [28], Portugal [36], Spain [37], and Turkey [38]. In Austria Cx. torrentium is also main vector [35]. Culex theileri in Portugal and Spain are known as a vector [36,37]. Aedes caspius s.l., Cx. modestus and Cx. perexiguus are vectors in Spain [37]. No avian malaria has been reported from birds in Kashan County, but there are species of Aedes caspius s.l, Cx. pipiens, Cx. torrentium, Cx. theileri, Cx. modestus and Cx. perexiguus in different districts of the county [10-12].
Mosquito-Borne Viruses (Arboviral Diseases)
Bovine Ephemeral Fever
Bovine ephemeral fever is an arthropod-borne disease of cattle and water buffaloes. The disease agent is from the genus Ephemerovirus within the Rhabdoviridae family. Biting midges (Diptera: Ceratopogonidae) and mosquitoes Aedes, Anopheles and Culex are known as the main vectors [39-42]. There is no information about the vectors of the virus in Iran [6]. In Iran, bovine ephemeral fever virus has been found in cattle and water buffalo in provinces Razavi Khorasan [43], Khuzistan [44], Fars, Tehran, West Azerbaijan [45], and Qazvin [46]. The virus has not been reported in Kashan County.
West Nile Fever
West Nile Virus (WNV) distributed in Africa, Europe, the Middle East, North America, and West Asia, is a member of the family Flaviviridae, Flavivirus genus, and belongs to the Japanese encephalitis complex. Human is most often infected by infected mosquito bites. Genus Culex is the principal vector of WNV, in particular Cx. pipiens. Birds are the reservoir hosts of WNV, In Europe, Africa, Middle East, and Asia [1,47]. In nature WNV is held in a mosquito-bird-mosquito transmission cycle and Culex spp. are the main vectors [48]. In a study, Cx. pipiens infection with WNV was reported in Guilan Province, north of Iran [49]. Also, it has been reported that Aedes caspius to be infected with the virus in the northwest of Iran [50]. West Nile virus has been identified by ELISA in horses in at least 26 of the 31 Iranian provinces and is the most important and most widespread mosquito-borne arbovirus in Iran [51-53]. Culex perexiguus, and Cx. modestus have also been reported as the principal vectors of WNV in Asia and Europe [54]. These mosquitoes have been reported from Kashan County [10,12], but no information is available about them, and birds infected with WNV in this County.
Lumpy Skin Disease (LSD)
Lumpy skin disease is a vector-borne pox disease of domestic cattle and Asian water buffalo and is characterized by the appearance of skin nodules [55]. Lumpy skin disease virus (LSDV) is a member of the genus Capripoxvirus and the family Poxviridae and is one of the most warning diseases in cattle from the perspective of OIE (Organization for World Health Animal Diseases), so it is mandatory that disease-free countries report it to OIE within 24 hours of confirmation of the disease [56]. The original vector is probably different in geographical areas, including the common stable fly (Stomoxys calcitrans), mosquitoes such as Aedes aegypti, and some species of African mites Rhipicephalus and Amblyomma spp. [55]. Lumpy skin disease (LSD) outbreaks in Kenya were caused incidence of Aedes natronius and Culex mirificus mosquitoes [57]. Culex spp. mosquitoes that feed multiple times on different hosts can increase the probability of transmission [58]. Lumpy skin disease was first seen in Zambia in 1929, then spread to all parts of the Sub-Saharan Africa as well as Madagascar. This disease was first observed in 2014 in western Iran. The outbreak of the disease in Iran followed the spread of the disease in neighboring western countries, including Turkey and Iraq. This disease has been reported from 31 provinces of the country with different prevalence percentages and epidemiological data of the disease indicate that the disease has spread epidemically among cattle and calves of different breeds. High risk provinces were including the provinces of West Azerbaijan, Kurdistan, Ilam, Khuzestan, and Kermanshah. Epidemiological data of the disease in the country show that the prevalence is less than 1% (0.55%) [59]. This disease has not been observed in Kashan so far, but due to the presence of the disease in livestock of neighboring provinces, there is a risk of disease for Kashan.
Mosquito-Borne Filariases
Dirofilariasis
Dirofilaria is a long, slender parasitic worm that infects a variety of mammals. The infection is transmitted by mosquito bites. There are many species of Dirofilaria, but infection in humans is usually caused by three species: D. immitis, D. repens, and D. tenuis. Dogs and wild dogs such as foxes and wolves are the main natural hosts of these three species. Dirofilaria immitis is also known as “heart worm” [60]. Dirofilaria repens and D. immitis infection has been found in humans and dogs in 16 provinces of Iran including Guilan [61], Garmsar [62], East Azarbijan Province [63], Gilan, Mazandaran, Golestan, East, and West Azerbaijan, Ardebil, Markazi, Isfahan, Khorassan, Khuzestan and Hormozgan [64,65], Ahvaz City [66,67], Kerman [68], and Meshkin-Shahr [69]. Vector of D. immitis in Ardebil Province is Cx. theileri [61,70]. There is no information about this disease in Kashan County.
Setariasis (Setariosis)
Setaria (Nematoda: Spirurida: Onchocercidae: Setariinae) infects ruminants. Species of Setaria digitata, S. equina, S. labiatopapillosa, S. marshali, S. cervi have been reported in horses, cattle, sheep, goats, donkeys, wild sheep, and water buffalo in 10 provinces [71-82]. This nematod is transmitted by mosquito species of the genera Aedes, Anopheles, Armigeres Theobald, Culex and Mansonia [83]. Setaria equine has been found from Anopheles maculipennis females in Ardebil Province [70]. There is no information about this disease in Kashan County.
Checklist of Mosquitoes (Diptera: Culicidae) of Kashan County
A checklist of mosquitoes of Kashan County is presented as follow: Family Culicidae Meigen, 1818 Subfamily Anophelinae Grassi, 1900 Genus Anopheles Meigen, 1818 Subgenus Anopheles Meigen, 1818 1. An. (Ano.) claviger (Meigen, 1804) 2. An. (Ano.) maculipennis s. l. Meigen, 1818 Subgenus Cellia Theobald, 1902 1. An. (Cel.) superpictus s. l. Grassi, 1899 2. An. (Cel.) multicolor Combouliu, 1902 3. An. (Cel.) turkhudi Liston, 1901 Subfamily Culicinae Meigen, 1818 Tribe Aedini Neveu-Lemaire, 1902 Genus Aedes Meigen, 1818 Subgenus Ochlerotatus Lynch Arribálzaga, 1891 1. Ae. (Och.) caspius (Pallas, 1771) s.l. [Oc. caspius (Pallas) s.l.] 2. Ae. (Och.) pulcritarsis (Rondani, 1872) [Oc. pulcritarsis (Rondani)] Tribe Culicini Meigen, 1818 Genus Culex Linneaus, 1758 Subgenus Barraudius Edwards, 1921 1. Cx. (Bar.) modestus Ficalbi, 1889 Subgenus Culex Linneaus, 1758 1. Cx. (Cux.) pipiens Linnaeus, 1758 (see Note 26) 2. Cx. (Cux.) torrentium Martini, 1925 3. Cx. (Cux.) perexiguus Theobald, 1903 4. Cx. (Cux.) theileri Theobald, 1903 5. Cx. (Cux.) mimeticus Noè, 1899 Subgenus Maillotia Theoald, 1907 1. Cx. (Mai.) deserticola Kirkpatrick, 1924 2. Cx. (Mai.) hortensis Ficalbi, 1889 Tribe Culisetini Belkin, 1962 Genus Culiseta Felt, 1904 Subgenus Allotheobaldia Broelemann, 1919 1. Cs. (All.) longiareolata (Macquart, 1838) Subgenus Culiseta Felt, 1904 1. Cs. (Cus.) annulata (Schrank, 1776) 2. Cs. (Cus.) subochrea (Edwards, 1921)
Conclusion
Information about the role of mosquitoes in the transmission of pathogens in Kashan County is limited. Due to the construction of bird garden in Qamsar, and entry of birds from 17 different countries into this area, and importance of mosquito-borne diseases in the country, vector-borne disease surveillance, is necessary for the best integrated vector management. The life cycle of mosquitoes requires two types of environments: aquatic habitats (eggs, larvae, and pupae) and terrestrial ecosystems (adults) [17]. Control strategies of mosquitoes may be to controlling adults or larvae at the breeding sites. Methods of insecticide-treated bed nets (ITN) and indoors residual spraying (IRS) are used to control adult mosquitoes [84]. But these methods are not effective in controlling exophilic and exophagic mosquitoes [85]. Environmental management is one of the most effective and sustainable methods for controlling of vectors of diseases. The concept of environmental management for mosquito control is a range of methods including long-lasting physical transformation of larval habitats, temporary changes of larval habitats, which makes the environmental conditions unsuitable for vector breeding, and reduce human/vector/ pathogen contact [86]. Application of these methods depending on the type of larval habitat can reduce mosquito populations and reduce the risk of disease transmission.
Effects of Drug Addiction and Abuse on Academic Performance of Students Within the Age of 14-30 Years
Introduction
Drugs are substances that influence the physical and mental state of persons essentially and destructively any substance that can prompt compulsion, abuse and reliance is a medication [1]. The level of enslavement for drugs increments with every day of utilization. On the off chance that drugs are not accessible, the patient shows discriminating withdrawal manifestations when prompt restorative consideration is expected to forestall physical and mental decay, even demise (Psychology) [2]. World Health Organization (WHO 2002 and 2003) characterizes tranquilize as a compound substance planned for indicative, restorative or palliative utilization or for altering physiological elements of man and creature, [south_Asia_Regional_Profile_Sept_2005/08_ bangladesh.pdf]. Opium has been used for medical purposes since 3500 years ago. Morphine was discovered in 1806 and codeine in 1832. Cocaine was extracted from leaves of coca plant in 1860. Injecting morphine and heroin was expanded at the beginning of 20th century [3-5]. Addiction to drugs is one of the saddest tragedies of modern man which threatens his life. Despite this, unfortunately tendency toward these deadly substances, especially opiate substances, is daily increasing, especially among adolescents [6]. Drug consumption in Iran has started thousands of years ago. Over the last century, expanded consumption of heroin and other narcotics, especially ecstasy and cocaine during past decades has complicated the condition of drug abuse in our country [3,7-10]. Studies conducted by United Nations show that more than 180,000,000 people in the world are addicted to drugs [11-14]. On the other hand, quitting addiction is complicated and difficult and is not successful most of the times [15]. Hashish is the most prevalent drug being used in America and many other countries. In North America, south and center of America most problems occur due to consumption of cocaine [16]. Most used drugs in Europe are cannabis, heroin, amphetamine and hallucinatory, besides to ecstasy. In most Asian countries most problematic drugs are cannabis and opiate substances [17,18]. According to a United Nations Office on Drugs and Crime (UNODC) Report (2005), about 200 million people, or 5 percent of the world’s population age between 15 and 65 have used drugs at least once in the last 12 months. Likewise, according to the World Drug (2005) reported that, the use of illicit drugs in all Nations has increased in recent years. For most of Europe and Asia, opiates accounted for 62 percent of all drug treatment sought in 2003. A survey in the Czech Republic showed that 37% of new drug users were teenagers between 15 and 19 years old. In Egypt, drug use – in particular heroin use – is becoming a serious problem and nearly 6 percent of secondary and tertiary school students admit to having experimented with drugs [15]. The history of human race has also been the history of drug abuse [19]. History tells us that the Chinese used Opium as a cure of dysentery before the 18th century. European countries such as Britain and Holland were known to exchange opium growth in their colonies for tea and silk with China [20].
State of Drug Abuse and Drug Addiction Global Perspective
Drug abuse is a global problem that poses a great danger to the lives of individuals, society and political stability and security in many countries [United Nations 1995]. According to the United Nations (2005), the use of illicit drugs has increased throughout the world and the major world trend is the increasing availability of many kinds of drugs among ever widening spectrum of consumers [21-23]. A study carried out by the London School of Economics in 1980, on students learning behavior revealed a relationship between drug abuse addiction and poor academic results [Otieno et al. 1994]. The continent, over recent years has experienced an upsurge in the production, distribution and consumption of drugs with the youth and young adults being most affected [24-26]. In Ethiopia, it is reported that 82 per cent of the street children in Addis Ababa use some kind of a drug [27-29]. According to the United Nations (UN) statistics (2013), 37,000 people in Africa die annually from diseases associated with drug abuse.
State of Drug Abuse and Drug Addiction: Bangladesh Perspective
Adolescents, especially those who are socially weak, may choose drug abuse as a means to integrate themselves into a peer group, and thereby increase self-esteem and decrease anxiety [30]. They feel failure and frustrated. Parental factors exert significant influence on the overall development of the child. It is not only impairing public health, but also corrupting institutions, retarding socio-economic development, and threatening political stability and, in some cases, impacting state security [31-33]. Due to drug addiction, criminal activities are increasing with alarming rate in all over the country. Especially in urban areas like Dhaka, Chittagong, Rajshahi, Khulna, Barisal and Sylhet. According to Family Health International (FHI) about 50 lac people of Bangladesh are drug addicted [34].
Materials and Methods
The present study designed as descriptive, qualitative and cross-sectional type, conducted in various Rehabilitation centers located in Dhaka city. The study population was consist of students in Rehabilitation center aged 14 to 30 years old. Random sampling technique (Probability sampling) was applied for determining sample size and data collection. Data was collected by a self-administered questionnaire, which was pre-tested. The investigation was conducted upon 143 students in various rehab center located in the Dhaka city located in the Dhaka city. The questionnaire and findings are based on the objectives and variables. Data was processed and analyzed using Microsoft Excel and SPSS version 21.00.
Ethical Considerations
Approval letter for conducting research was taken from American International University- Bangladesh (AIUB) during MPH courses
Results and Findings
In the present study, 34.97 percent of the participants were 14-18 year olds, 38.46 percent of the participants were 19-23 year olds, 18.18 percent were 24-27 year olds and 8.39 percent were 28-30 year olds (Figure 1), 79.72 percent of the participants were males, and 20.28 percent of the participants were females. Showed that 15.38 percent of the participants were below SSC, 29.37 percent passed SSC, 34.97 percent passed HSC, 16.08 percent passed bachelors and 4.20 percent passed masters (Figure 2). In the present study, 62.94 percent participants were lived in urban area whereas, 37.06 percent were lived in rural area, 62.94 percent participants were lived in nuclear family and 37.06 percent were lived in join family. The analysis indicates that 37.76% of the respondents’ abused drugs for the first time at the age of 14-18 years old, 33.57% of the respondents abused drugs for the first time at the age of 19-23 years old, 20.28% were abused drugs for the first time at the age of 24-27 years old and 8.39% were abused drugs for the first time at the age of 28-30 years old.
Figure 1: Distribution of the participants by their age.
Figure 2: Distribution of the educational qualification of the participants.
Figure 3: Distribution of age of the participants when did they abuse drugs for the first time.
The present investigation indicates that 37.76% of the respondents abused drugs for the first time at the age of 14-18 years old, 33.57% of the respondents abused drugs for the first time at the age of 19-23 years old, 20.28% were abused drugs for the first time at the age of 24-27 years old and 8.39% were abused drugs for the first time at the age of 28-30 years old (Figure 3). (Figure 4) indicates that 16.78% of the respondents have been addict for 0-2 years, 18.89% of the respondents have been addict for 2-3 years, 38.46% of the respondents have been addict for 3-4 years and 25.87% of the respondents have been addict for more than 4 years. The analysis indicates that 44.76% of the respondents were influenced to take drugs by friends, 28.67% were by classmates, 15.38% were by relatives, 6.29% were by himself and 4.90% were influenced by others (Figure 5). According to the results, the respondents indicated that Yaba was major abused drugs in the age between 14-30 years. 31.47% of the respondent were abused Yaba, 21.68% were abused Phensedyl, 20.98% were abused Cannabis (ganja), 14.69% were abused heroin, 7.69% were abused Sleeping pills (seduxen) and 3.49% were abused other drugs (Figure 6).
Figure 4: Distribution of the length of time of participant’s taking drugs.
Figure 5: Distribution of participants those who are influenced to take drugs by.
Figure 6: Distribution of major abused drugs which causes addiction by the participants.
The analysis showed that 70.63% of the respondents abused more than one drug at the same time and 29.37% of the respondent abused only one drug at the same time. Figure 7 indicated that Yaba was major abused drugs in the age between 14-30 years. 31.47% of the respondent were abused Yaba, 21.68% were abused Phensedyl, 20.98% were abused Cannabis (ganja), 14.69% were abused heroin, 7.69% were abused Sleeping pills (seduxen) and 3.49% were abused other drugs. The findings summerized in (Figure 8) shows that, 27.27% of the respondent abuse drugs due to peer pressure, 21.68% of the respondents due to frustration, 16.78 % due to mental stress relief,10.49% due to curiosity, 12.59% due to build-up self-esteem& ability to increase performance.6.99% due to sense of euphoria, and 4.20% due to easy access or availability of drugs. The analysis showed that, 56.64% of the respondents had more than one reason of drug addiction and 43.36% of the respondent had only one reason of drug addiction.
Figure 7: Distribution of participants how did they procure money for drugs.
Figure 8: Distribution of the Major causes of drug abuse and drug addiction of the participants.
The analysis showed that 28.67 % of the respondent were procure money for drugs from illegal works, 13.29% were procure money from own earning, 46.15% were procure money from family and 11.89% were procure money from friends. The results on the effects of drug abuse experienced by the respondents indicate that headache, memory loss, gastritis, insomnia, bad tempered and instability were serious effects of drug abuse that the respondents experienced as expressed by the percentage of 5.59, 4.90, 13.29, 32.87, 20.28 and 23.07 respectively. In addition, the study also found out that red eyes, nervousness and fatigue also have been observed due to drug abuse and drug addiction. (Figure 9) shows that 74.83% of the respondent had more than one physiological consequences and 25.17% of the respondent had only one physiological consequences. Figure 9 showed that, 29.37% of the respondent were encouraged to get into the rehab center by friends, 11.19% were encouraged by teachers, 44.75% were encouraged by their families and 14.69% were encouraged by their relatives. It was evident that, 27.28 % of the respondent were engaged with any criminal activities but majority 72.72% of the respondent did not engaged with any kind of criminal activities. The analysis showed that, 70.63% of the respondents abused more than one drug at the same time and 29.37% of the respondent abused only one drug at the same tim.
Figure 9:
A. Distribution of physiological consequences due to drug addiction by the participants. B. Distribution of participants those who are influenced to take drugs by.
It was found that, 28.67 % of the respondent were procure money for drugs from illegal works, 13.29% were procure money from own earning, 46.15% were procure money from family and 11.89% were procure money from friends (Figure 7). The present results reveals on the effects of drug abuse experienced by the respondents indicate that headache, memory loss, gastritis, insomnia, bad tempered and instability were serious effects of drug abuse that the respondents experienced as expressed by the percentage of 5.59,4.90,13.29,32.87,20.28 and 23.07 respectively. In addition, the study also found out that red eyes, nervousness and fatigue also have been observed due to drug abuse and drug addiction. The result of the present study showed that 74.83% of the respondent had more than one physiological consequences and 25.17% of the respondent had only one physiological consequences. (Figure 10) showed that, 29.37% of the respondent were encouraged to get into the rehab center by friends, 11.19% were encouraged by teachers, 44.75% were encouraged by their families and 14.69% were encouraged by their relatives. The third objective sought to find from respondents the likely effects of drug addiction on academic performance. The results on the effects of drug addiction on academic performance among respondents was severe grade decades, drop out ,low concentration span, discontinuation of academic career, lack of interest in extra curriculum activities and strained relationship with other students.25.87% of the respondent had grade decades, 7.69% had drop out, 41.26% had low concentration span,9.09% had discontinuation of academic career,4.90% had lack of interest in extra curriculum activities and 11.19% of the respondent had strained relationship with other students (Figure 11). The analysis indicates that 28.67 % of the respondent received treatment from rehabilitation centers for 1 year, 19.58% of the respondent received treatment for 2 years, 7.69% of the respondent received treatment for more than 2 years and 44.06% of the respondent received treatment for 6 months (Figure 12).
Figure 10: Distribution of participants those who encouraged to get into the rehab center by.
Figure 11: Distribution of effects of drug addiction on academic performance of participants.
Figure 12: Distribution of the participants’ period of time to receive treatment from Rehab center.
Discussion
According to Family Health International about 50 lac people of Bangladesh are drug addicted. The World Health Organization [WHO, 2003] estimates that, about 50 cror people in the world are affected by the abuse of drugs. Many of the adolescent users begin their experiment with drugs though smoking cannabis (marijuana) cigarettes, use of heroin. Typically, they begin by sniffing it (snorting) and finally injecting it intravenously (shooting the mainline) [35,36]. Findings on how the subjects developed their habits indicated that 50% first took drugs through drug user friends and under pressure, 20% out of frustration and 15% out of curiosity. The study reports that the highest incidence of addiction occurred between 23-26 years old [37]. Due to drug addiction, criminal activities are increasing at an alarming rate all over the country, especially in urban areas like Dhaka, Chittagong, Rajshahi, Khulna, Barisal and Sylhet. The present study tries to explore the effects of drug addiction and drug abuse on academic performance of young students [38,39]. The purpose of this study was to determine the effects of drug abuse and drug addiction on Academic performance of students within age 14-30 years. The study includes the addict’s students who received treatment from drug treatment and rehabilitation centers. The majority of the drug users were male even though the involvement of female was also evident. In the present study 79.72% of the respondents were males and 20.28% of the respondents were females. The present, YABA is the most frequently abused drugs by the respondents. The study also shows that70.63% of the respondents were abused more than one drug at the same time. The study also found that, 56.64% of the respondents had more than one reason of drug addiction and 43.36% of the respondents had only one reason of drug addiction. About 27.27% of the respondents were engaged with any criminal acts [40]. The present study found that insomnia, headache, memory loss, gastritis, bad-tempered and instability were serious physiological effects of drug abuse and drug addiction of the respondents. The current study shows that drug abuse and drug addiction have adversely affected the academic performance of the respondents. Declining grades, drop out, low concentration span, discontinuation of academic career, strained relationship with other students and lack of interest in extra-curriculum activities are the adverse effects of drug addiction which directly related with academic career of the respondents. This is in agreement with United Nations (2005) view that cognitive and behavioral problems experienced by alcohol and drug-using youth may interfere with their academic performance and also present obstacles to learning. Again drugs abused effect the brain; this result in major decline in the functions carried out by the brain. According to Abot (2005) drugs affect the student’s concentration span, which is further drastically reduced setting in boredom sets in much faster than for non-drug and substance abusing students. The students who abuses drugs is likely to lose interest in schoolwork including extra curriculum activities. The study shows that the respondents were encouraged to get into the Rehab center by Friends, by teachers, by family members and by their relatives [41]. In the present study, 28.67% of the respondents stayed in the rehab center for 1 year to more than 2 years and majority of the respondents were stayed in the rehab center for 6 months. More than half of the respondents (83.22 %) were regret for their actions and (88.21 %) of the respondents want to go back to a healthy life.
Conclusion
Most of the respondents that involved in drug use and abuse fall between the age brackets of 14-23 years. Yaba is the most frequently abused drugs by the respondents. Phensedyl, Cannabis ganja, heroin and sleeping pills (Seduxen) are also abused in significant proportion. They are addicted to drugs because of the influence of peer groups, frustration, mental stress relief, curiosity. The study found out that insomnia, headache, memory loss, gastritis, bad-tempered and instability were serious physiological effects of drug abuse and drug addiction of the respondents. Drug abuse and addiction have adversely affected the academic performance of the respondents. More so, the effects of drug abuse and addiction have resulted into respondent declining grades, drop out, law concentration span, discontinuation of academic career, strained relationship with other students and lack of interest in extracurriculum activities. Government should prevent the cultivation/ sales of deadly herbs that encourage drug abuse. Government should strictly enforce its existing laws against drug abuse through its regulatory agencies [42]. Parents and guardians should endeavor to monitor their children, so that they do not engage in drug abuse. Counseling education should be introduced in campuses to revive those who have already been engaging in the act [43-57].
Creation of Innovated Macrocyclic Sulfazan-Formazan Compounds and Linear Sulfazan-Formazan for the first Time Globally with their Assay as Antifungal
Introduction
Sulfazan compounds were invented for the first time globally by researcher Prof. Dr. Nagham Aljamali in 2019 was named as sulfazan compounds [1-3]. The researcher also developed and devised the basics of their preparation methods, the conditions of each method, their interactions, the reaction medium, and their naming. Then she developed them into cyclic sulfazan and cyclic formazan compounds [4-7] that were also prepared for the first time in April 2021 in this current study and also developed and established methods for their preparation and reaction conditions, and the current research included the preparation of innovative types of cyclic sulfazan compounds, linear sulfazan, cyclic formazan and linear formazan.
Sulfazan Compounds
Are organic sulfur compounds that were prepared in researches [1-3] as first time by Dr. Nagham Aljamali in 2019 from several reactions that include the reaction of the coupling of basic mercapto and thiol compounds with azo compounds using one of the conditions (pyridine, piperidine, triethylamine,…) [7-9] and its chemical structure is (Ar-N=N-S-R).
Formazan Compounds
Are a class of organic compounds of importance in organic chemistry because it contains two highly effective groups (-N=N=C-N-) or (-N=N-C-N-NH-) in several fields of chemistry [8-14], especially in coordination chemistry [15,16], as a ligand because they contain free electrons and donor atoms to coordinate with ions to form complexes [17-19] and types of them as anticancer [20-22].
Cyclic Formazan and Cyclic Sulfazan
These compounds invented by the researcher Dr. Nagham Aljamali in April 2021 for the first time [4,5]. Initial foundations and methods for preparing these compounds were established, and to determine the conditions [4-8] of their interaction and the auxiliary factors used to prepare them. They were considered among the organic compounds of importance in organic chemistry because they contain two highly effective groups in several fields of chemistry, especially in coordination chemistry, as a ligands because they contain doublets. Free electrons and donor atoms to coordinate with ions to form complexes [23-28]. Formazan also enter many anti-bacterial [29-33] and anti-fungal compounds [34- 37] and types of cancer [38,39], especially breast and laryngeal cancers, as anti-bacterial and anti-fungal, and other studies [40,41].
Instruments and Experimental Part
All melting points were uncorrected and dignified on an electrothermal apparatus (Switzerland) in an open capillary tube. FT.IR spectra were detailed on Fourier transform infrared spectrometer (FT-IR) in( FT-IR- 3600) infrared spectrometer via employing KBr Pellet technique., 1H.NMR spectra were recorded in DMSO-d6 as solvent using (TMS) as internal standard and chemical shifts are expressed as (δppm)., also Mass– Spectra for some of them other studies like evaluation against types of fungi).
Procedures
Preparation of Compounds{1, 2}
Cysteine (0.01 mole) was dissolved in (30ml) absolute ethanol with semicarbazide(0.01 mole) with refluxing for (10hrs) in presence of phosphoric acid as closing agent, according to procedures [6-9], the product filtered ,dried ,recrystallized to yield Oxadiazole amine Derivative-Compound [1], which reacted (0.01 mole) in (50 ml) absolute ethanol with p-iodobenzaldehyde (0.02 mole) with refluxing for (3hrs) in presence of (3 drops of glacial acetic acid), according to procedure [6- 9], the product filtered ,dried ,recrystallized to yield Aldamine -Compound [2] (Figure 1).
Figure 1: Synthesis of Compounds{1,2}.
Creation of Inventive Macrocyclic Sulfazan-Formazan Compound{3}
Aldamine compound [2]was (0.01 mole) dissolved in basic solution from (Piprydine) then reacted with (0.02 mole) of diazo salt of o- phenyl diamine via many steps in basic solution to formation invented Macrocyclic Sulfazan-Formazan after (48hrs), the product filtered ,dried ,washed by distilled water, recrystallized to yield Invented Macrocyclic Sulfazan- Formazan [3] by following literatures [1-5].
Creation of Inventive Macrocyclic Sulfazan-Formazan Compound{4}
Macrocyclic Sulfazan-Formazan Compound{3} refluxed (0.01 mole) for (4hrs) in (40ml) absolute ethanol in presence of cupper acetate (0.92gm) in closing step of amine group in ortho- position from azo- group to formation Triazole derivative according to procedures [6,7] , the product filtered ,dried ,recrystallized to yield Invented Macrocyclic Sulfazan-formazan of Triazole derivative [4], according to procedures [6-10] (Figure 2).
Figure 2: Creation of Invented Macrocyclic Sulfazan- Formazan Compounds {3,4}.
Creation of Inventive Linear Sulfazan- Formazan Compound{5}
Aldamine Compound [2] about (0.01 mole) was reacted basic solution (Pyridine) via many steps in coupling reaction with (0.03 mole) of p-bromophenyl diazonium salt in basic medium, after (10hrs), the product filtered ,dried ,washed by distilled water, recrystallized to yield Invented Sulfazan- Formazan [5], according to procedures [1-5].
Creation of Inventive Linear Sulfazan- Formazan Compound{6}
Aldamine Compound [2] about (0.01 mole) was reacted basic solution (Pipyridine) via many steps in coupling reaction with (0.03 mole) of p-methoxyphenyl diazonium salt in basic medium, after (10hrs), the product filtered ,dried ,washed by distilled water, recrystallized to yield Invented Sulfazan- Formazan [6], according to procedures [1-5] (Figure 3).
Figure 3: Creation of Invented Sulfazan- Formazan Compounds {5,6}.
Results and Discussion
In recently study, various of Invented Macrocyclic Sulfazan- Formazan Compounds and linear Sulfazan- Formazan have been created in same procedure that followed and invented [1-5] by Dr. Nagham in year 2019 that got a patent to invention of Macrocyclic Sulfazan-Formazan compounds, then several studies were carried out to improve these innovative compounds by the using of spectral identification like : 1H.NMR spectra, FT.IR- Spectra, Mass- Spectra., other studies represented by (Melting points, evaluation against types of fungi)., all the results are revealed in Tables and figures.
Spectral Analysis
FT.IR- Spectral Evidence of Invented Macrocyclic Sulfazan- Formazan Compounds and Linear Sulfazan-Formazan Compounds : The first characterization of innovative compounds by shifting of frequencies of Aldamine group (CH=N) in starting compounds (Imine compounds) that were about at (1612) Cm-1 in starting compounds (imine compounds) were shifted to (1627) Cm-1 for (-C=N-) due to formation of Macrocyclic Formazan and band at (1310) Cm-1 due to (-S-N=N-) to Sulfazan group in Macrocyclic Sulfazan compound , also appearance of three bands due to partitions of azo group of Sulfazan and Formazan in Macrocycle (-N=N-) are (1423 ,1455, 1490) Cm-1 for (-N=N-S-)-Sulfazan and (-N=N-C-)-Formazan in compound {3}., While in compound [4] appeared band at (3298) Cm-1 due to (NH) in Triazole ring as a result of ring closure that resulted from closing of amine group in ortho- position with Azo group to formation Triazole ring, besides to appearance of bands at (1629) Cm-1 for (-C=N-) due to formation of Macrocyclic Formazan and band at (1304) Cm-1 due to (-S-N=N-) to Sulfazan group in Macrocyclic Sulfazan compound , also appearance of three bands due to partitions of azo group of Sulfazan and Formazan in Macrocycle (-N=N-) are (1432 ,1456, 1498) Cm-1 for (-N=N-S-)-Sulfazan and (-N=N-C-)-Formazan., and other compound like this., all frequencies explained according to reference [35].
1H.NMR- Spectral Evidence of Invented Macrocyclic Sulfazan-Formazan Compounds and Linear Sulfazan- Formazan Compounds
The second characterization of innovative compounds by disappearance of peak for imine group (CH=N) in starting compound (Aldamine compound) that were at δ (8.27) in Compound {2} (starting compound) due to formation of (N=C-N=N) for (Formazan and Sulfazan groups) in created compounds, also in compound [4] appeared peak at δ (5.35) due to (NH) in Triazole ring as a result of ring closure that resulted from closing of amine group in ortho- position with Azo group to formation Triazole ring, all peaks explained according to reference [35].
Mass– Spectral Evidence of Invented Macrocyclic Sulfazan-Formazan Compounds and Linear Sulfazan- Formazan Compounds
The third characterization of inventive compounds by partition of innovative cyclic compounds via appearance of fragments in spectra in Figures 4-6.
Figure 4: Mass–Spectrum of Invented Macrocyclic Sulfazan- Formazan Compound{3}.
Figure 5: Mass–Spectrum of Invented Macrocyclic Sulfazan- Formazan of Triazole Compound {4}.
Figure 6: Mass–Spectrum of Invented Linear Sulfazan- Formazan Compound{5}.
Other Characterization
All Invented Macrocyclic Sulfazan- Formazan and Linear Sulfazan-Formazan were studied to collect all The chemical and physical properties, in Table 1.
Antifungal Assay [17,18] of Invented Sulfazan-Formazan Derivatives
The assessment of Invented Macrocyclic Sulfazan-Formazan derivatives and Invented Linear Sulfazan-Formazan derivatives tested against kinds of fungi epitomized through (Aspergillus) with (Candida Albicans) for all the invented compounds at three concentrations were occupied range of three analyses that occupied for each concentration (20, 30, 50μgm) rendering to the method [17,18], Table 2. The results improved that the Invented Macrocyclic Sulfazan-Formazan compounds and Invented Linear Sulfazan- Formazan compounds have good results as inhibitor of fungi growth and the invented macrocyclic Sulfazan- Formazan compound [5] has more activity than other invented macrocyclic Sulfazan-formazan compound due to structure of compound [5] involved sufazan group (-N=N-S-) with formazan group (-N=CN= N-) more than other compounds besides to (Br) atoms , while compound [6] has less inhibition activity due to its structure ( -OCH3) methoxy group.
Table 1: Other characterization of Invented Macrocyclic Formazan Compounds.
Table 2: Antifungal Assay of Invented Sulfazan-Formazan Compounds in Concentration (30μ.gm).
All Invented Macrocyclic Sulfazan-Formazan derivatives and Invented Linear Sulfazan-Formazan compounds gave good evidences for their structures via various spectral techniques, also some of them studied against types of fungi that gave good data and good activity in inhibition of growth of Fungi.
Human Health and Sustainability Depend on Diverse Ecological Environments- Monitoring of Flora and Flowering Phenology in Huajiang Wildduck Natural Park
Introduction
With the expansion of cities, the rise of power plants, and the improvement of living standards, many people can sit in well-airconditioned and elegantly decorated restaurants and eat delicious food made with ingredients from afar, but there is another group of people in the world facing poverty, hunger and disease. Their humble homes cannot resist natural disasters, and they do not have good job opportunities. They can only cultivate barren or contaminated farmland, or overwork in dangerous mines and factories. According to the United Nations’ Sustainable Development Goals (SDGs), 15 items are terrestrial ecology, emphasizing the importance of biodiversity. Human health and sustainability depend on diverse ecological environments Huajiang Wild Goose and Duck Nature Park” is located under the Huajiang Bridge in Wanhua District in the southwestern corner of Taipei City. The total area is about 28 hectares. It belongs to the category of Dahan-Xindian Wetland. In 1991, the Taipei City Industrial Development Bureau set up interpretive facilities in this area and set up the “Goose Duck Park” to introduce conservation concepts into the park’s management [1- 4]. It was officially renamed “Huajiang Wild Goose Natural Park” in 1996. The Huajiang Wetland Conservation Alliance started its environmental monitoring activities in 2007, so that more people who love ecology and value the environment will come to participate in wetland ecological monitoring and protection activities and build knowledge of the local environment through the process of participation. Improve emotional recognition of Huajiang Wetland.
Research Location
With Huajiang Bridge as the boundary, it is divided into north and south regions, and then divided into artificial grassland, short grass region, and long grass region according to the difference of the flora of the north and south regions, for a total of 6 sample stations. Artificial grassland: There are often human activities and regular artificial weeding. The vegetation is more complex, with low herb plants such as gooseberry, water centipede, and nightshade. The Moon Pond in Huajiang Wild Goose Natural Park has been completed since December 2012. The ecological island of the pond has been deserted. The area has been investigated and monitored without human intervention.
Methods
Before 2011, the survey method of the flora group was to set a crossing line and select a survey plot of 5m x 5m on the sample line. However, this kind of survey method is very hot in the unshaded wetland. After one or two times, no volunteers are willing to come. In response to this problem, the first author modified the plant sample area survey into plant phenology monitoring. After the operation, I found that the phenological survey is still too complicated for volunteers, so I had to simplify it and only focus on the species that bloom every month. The survey method is to survey once a month, dividing the Huajiang Bridge into two areas in the north and south, and then dividing it into artificial grassland, short grass area, and long grass area according to the plant phase. The crossing line through these three areas is used as the survey scope. Beginning in May of 2005, the species and quantity of plants will be recorded until 2019.From 2011 to the end of 2019, it will be carried out once a month by crossing the line and divided into 6 sample areas to investigate the flowering species of flowering plants.
Results
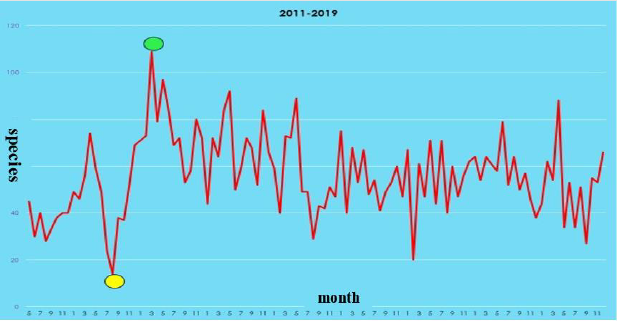
From 2011 to the end of 2019, Huajiang Wild Goose Nature Park has recorded a total of 262 species of vascular plants in 57 families, of which 44 species of Poaceae are the most, followed by 36 species of Asteraceae. Varieties of vascular plants in Huajiang Wild Goose Nature Park have changed since 2012.In the year, there were 199 species in 45 families. In the second year, it suddenly increased to 241 species in 46 families, an increase of 42 species in 1 family, and then by the end of 2019, it increased to 262 species in 57 families, and 21 species in 11 families (Table 1). The results also show that plants bloom every month. There are more plants in the southern area of Huajiang Bridge than in the northern area. The artificial grassland is the most, and the human disturbance is the largest. On the contrary, the species is taller than the short grass and long grass areas with less human disturbance (Figure 1).
Figure 1: Monthly change of flowering plants at 6 plots in Huaji ang Wild Goose Natural Park.
The rarer orchids, Spiranthes sinensis, Zeuxine strateumatica, and Eulophia graminea, are only found in artificial grasslands, and the flowering season is between March and April. The flowering species are unevenly distributed in the seasons. From 2012 to 2019, the most flowering seasons are 5 years in May, 2 years in April, and 1 year in March and June (Figure 2). The plants that bloom throughout the year are 6 species of Asteraceae, Youngia japonica, Eclipta prostrata, Bidens pilosa var. radiata, Ageratum conyzoides, Ageratum houstonianum, Wedelia triloba and Oxalis corniculata of Oxalidacaea. Around Moonpond, there are regular weeding. The most species month in 2014 was June, with 22 families and 77 species. The most frequent month in 2016 was April, with 23 families and 89 species. Among them, it was recorded in April 2020 (Figures 3-5).
Figure 2: 2011-2019 The most flowering month in Huajiang Wild Goose Natural Park ()
Figure 3: 2011-2019 Monthly changes of flowering phenology in Huajiang Wild Goose Natural Park(○Haikui typhoon)
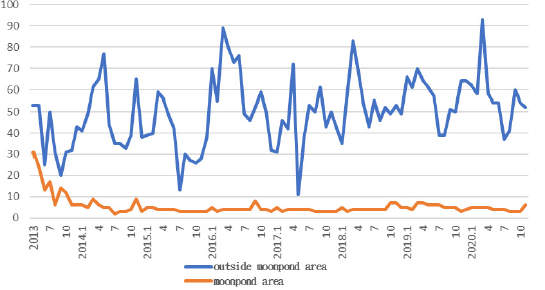
Figure 4: Monthly Variations of Flowering Plants in Moon pond of Huajiang Wild Goose Natural Park.
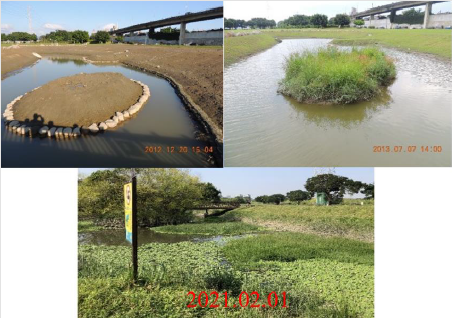
Figure 5: Environmental changes of Moonpond.
Discussion
According to the survey results, March to April and November to December are the months with the most flowering plants. And the rarer orchids, Spiranthes sinensis, Zeuxine strateumatica, and Eulophia graminea, are only found in artificial grasslands, and the flowering season is between March and April. The competent authority should consider avoiding weeding during the months when flowering plants reproduce the most, moreover to maintain the flowering and reproduction of plants and protect the rarer plants from extinction. From 2012 to 2019, the typhoon had the greatest impact on the Huajiang Wild Goose Natural Park was the moderate Haikui typhoon on August 6, 2012, which caused the Huajiang Wild Goose Natural Park to be flooded to a depth of 3m, and the flooding time lasted than one week. (Figure 3) And there is nearly 1m high silt cover, the impact on flowering plants is only when the number of species decreased significantly in the month, only 14 species, and then the species gradually increased. By March 2013, 109 species of plants bloomed and reached the highest peak, which is the most month. This phenomenon is likely to be caused by the Haikui typhoon that brought many plant seeds from upstream in August 2012. The seeds gradually germinated, grew and bloomed. They reached the highest point in March 2013 and then gradually declined. The possible reason is adaptability. However, since only the Haikui typhoon has directly affected the Huajiang Wild Goose Natural Park in the past 9 years, whether this phenomenon is the norm under the influence of typhoons remains to be verified by the next typhoon directly affected. The monitoring results of the Huajiang Wild Goose Natural Park can provide the evidence of climate change. In the future, investigations of rare plants, such as the ethnic changes of orchids, should be strengthened. Under the influence of this increasingly violent climate change, it is imperative to create a biodiversity environment. Therefore, monitoring must continue. However, in addition to the enthusiastic support and participation of volunteers, monitoring also requires government support and financial subsidies.
Acknowledgement
This research monitoring case is grateful to Professor Li Zaiming of Cultural University, Dr. Chen Qidong, National Taiwan University Life Sciences Institute, Chen Jianwen, and Mr. Zhong Mingzhe of the Forestry Laboratory for their guidance and plant identification, and also to a group of people who are not fame and fortune, not afraid of the cold, the sun and the rain. plant group partners of Wetland Huajiang Wetland Guardian Alliance: Liu Jixiong, Huang Bingrong, Huang Jinyun, Chen Yanming, Zhang Yiting, Zheng Yingzhi, Huang Xincong and others have been able to complete the data that have been painstakingly recorded.
Declarations
All manuscripts must contain the following sections under the heading ‘Declarations’: • Ethics approval and consent to participate: Not applicable • Consent for publication: Not applicable • Availability of data and materials: Not applicable • Competing interests: Not applicable • Funding: Not applicable • Authors’ contributions: Data collection, literature review, manuscript writing • Acknowledgement: Not applicable.
Hand sanitizer also called antiseptic is a liquid or Gel type substance needed to kill various different germs including bacteria and viruses present on our external body surfaces. Hand hygiene is the single most important factor needed to control the spread of many contagious diseases. Routine hand hygiene with hand sanitizers is the single most effective way to prevent infections, especially in health care settings. Despite a lot of beneficial effects in daily life, it is not completely free of shortcomings. It is known to cause antibiotic resistance, dry skin, unsafe if ingested, and potential alternatives for alcohol abusers.
Editorial
Infectious diseases can spread from one person to another with contaminated hands. Therefore, Hand hygiene is one of the most important things needed today to prevent the spread of infectious diseases such as viruses or bacteria. The most widely used methods to prevent these infections are washing hands with soap and water or using alcohol-based sanitizers. Sanitizers may vary in their composition. According to World Health Organization [1], alcoholbased sanitizers are most effective compared to other methods of hand hygiene. Two formulations have been suggested to locally produce these products. One formulation includes (ethanol 96%, hydrogen peroxide 3%, glycerol 98%, and sterile distilled or boiled cold water) and formulation includes (Isopropyl alcohol 99.8%, hydrogen peroxide 3%, glycerol 98%, and sterile distilled or boiled cold water). Due to the presence of a significant amount of alcohol, these may be used as a substitute by alcohol abusers. In accordance with the Centers for Disease Control and Prevention, alcohol-based sanitizers are only effective if they contain at least 60% alcohol [2]. A 2013 study suggested; for highrisk individuals, ethanol-based sanitizers may be a substance of abuse and their access should be limited. However ethanolbased sanitizers were not considered as primary alternatives in alcoholics [3]. A 2015 study reported 385 total cases of hand sanitizer ingestion; 61% unintentional, 18% intentional misuse, and 10% miscellaneous. Most of them were younger males (potent abusers). However serious outcomes were not reported and cases were managed favorably [4]. In 2019 a case was reported in the New England Journal of Medicine, in which a 54-year-old man undergoing alcohol withdrawal ingested hand sanitizer (which contained 63% isopropanol) had access to hand sanitizer at his bedside which is commonly provided in health care settings for hygiene purposes [5]. In 2021 another case in Cureus journal was reported in which a 30-year-old male patient with alcohol use disorder was found intoxicated who was subsequently owning several bottles of sanitizers which gave a clue of his potential intoxication and withdrawal symptoms later. Therefore possible intervention should be applied in using these alcohol-based products in health care settings and their use should be limited for potential abusers. Hand sanitizers are the preferred way of protecting ourselves from the spread of such contagious diseases but steps should be taken to minimize their use as the potential choice of abuse. Washing hands with soap and water is the best alternative available for potential abusers as well as in health care settings.
today to prevent the spread of infectious diseases such as viruses or bacteria. The most widely used methods to prevent these infections are washing hands with soap and water or using alcohol-based sanitizers. Sanitizers may vary in their composition. According to World Health Organization [1], alcoholbased sanitizers are most effective compared to other methods of hand hygiene. Two formulations have been suggested to locally produce these products. One formulation includes (ethanol 96%, hydrogen peroxide 3%, glycerol 98%, and sterile distilled or boiled cold water) and formulation includes (Isopropyl alcohol 99.8%, hydrogen peroxide 3%, glycerol 98%, and sterile distilled or boiled cold water). Due to the presence of a significant amount of alcohol, these may be used as a substitute by alcohol abusers. In accordance with the Centers for Disease Control and Prevention, alcohol-based sanitizers are only effective if they contain at least 60% alcohol [2]. A 2013 study suggested; for highrisk individuals, ethanol-based sanitizers may be a substance of abuse and their access should be limited. However ethanolbased sanitizers were not considered as primary alternatives in alcoholics [3]. A 2015 study reported 385 total cases of hand sanitizer ingestion; 61% unintentional, 18% intentional misuse, and 10% miscellaneous. Most of them were younger males (potent abusers). However serious outcomes were not reported and cases were managed favorably [4]. In 2019 a case was reported in the New England Journal of Medicine, in which a 54-year-old man undergoing alcohol withdrawal ingested hand sanitizer (which contained 63% isopropanol) had access to hand sanitizer at his bedside which is commonly provided in health care settings for hygiene purposes [5]. In 2021 another case in Cureus journal was reported in which a 30-year-old male patient with alcohol use disorder was found intoxicated who was subsequently owning several bottles of sanitizers which gave a clue of his potential intoxication and withdrawal symptoms later. Therefore possible intervention should be applied in using these alcohol-based products in health care settings and their use should be limited for potential abusers. Hand sanitizers are the preferred way of protecting ourselves from the spread of such contagious diseases but steps should be taken to minimize their use as the potential choice of abuse. Washing hands with soap and water is the best alternative available for potential abusers as well as in health care settings.
Natural Patterns and Magnetic and Mental Processes of Coronavirus Activation and Neutralization
Introduction
The outbreak of coronavirus occurred simultaneously and almost synchronously in different countries. And this corresponds to the classical ideas of virology. Three waves of coronavirus exist from year to year at intervals of three months – three months – three months. There is a natural mechanism that can control such waves. June 22 is the day of the summer solstice, December 22 is the day of the winter solstice, September 22 and March 22 are the days of the autumn and spring equinox, respectively. Increasing and decreasing morbidity in humans is always close to these astronomical points. Statistics on heart attacks and strokes, and it turned out that non-communicable diseases have the same rise in mortality on the same dates. For other bacteria, streptococci and staphylococci, in these numbers all microflora is activated, which causes the corresponding diseases. Infections are usually transmitted under three conditions: a large dose of pathogen, quite close contact or epizootia – an outbreak of infection. Population density becomes additional stimuli for the high rate of infection. Viruses do not affect separately Chinese or representatives of other nations, viruses are apolitical and have no religion. They can adapt to any changes in the environment no worse than a person. The only thing to thank them for is the evolutionary perfection of the human immune system. For centuries, when any infection appeared, the human body produced antibodies and formed cellular immunity. When there are more than 30% of people with antibodies, we can say that the epidemic will end soon. Scientists have the opportunity to observe attempts by viruses to make a cross view transition thanks to laboratory tracking methods. The outbreak of epidemics is not an accident, but a combination of circumstances. And all of them are caused by changes in the environment. This is always a unique situation that occurs as a result of a change in the state of the environment, in which a person falls into new conditions of interaction with other species of animals. And today the anthropogenic impact on the environment has reached absolutely unmatched proportions compared to previous generations, in addition, man as a species is constantly growing. Waves of infectious diseases flare up in different countries at the same time. Now we have 80% delta, and before that there was a gamma, and before that the British strain. Each of the strains gives way to a new mutation. The evolution of viruses occurs just inside the human body, its living reservoir. The natural mechanism causes viruses to activate simultaneously and everywhere. In the spring of 2020, outbreaks of coronavirus were found on several warships in different parts of the world at once, and the ships were on the flight for a long time and the teams were isolated from everyone. Asynchronous incidence rises are caused by the influence of magnetic fields of natural origin. At the beginning of the last century, the famous scientist Chizhevsky studied dark spots in the sun and revealed the amazing synchrony of solar energies and their influence on terrestrial biological processes. Viruses have receptors that are simultaneously activated during this period. The pandemic is Covid-19 a direct consequence of the shift of the Earth’s magnetic poles. And the bigger the shift, the more waves the pandemic will have. Coronaviruses have been known since the 60s, there are several dozen of them, people are infected with them. Cases of COVID-19 disease are now recorded in all corners of the world. The activation of COVID-19 in humanity occurred right now. The pandemic Covid-19 reached MOSAIC’s unique Arctic scientific expedition in the fall of 2020, while a polar research vessel is locked in Arctic ice near the North Pole. In December 2020, the coronavirus reached the Antarctic continent, which has so far been free of COVID-19. Each selfrespecting newspaper writes something about the “pole shift” and “magnetic anomalies” at least once a month, and when NOAA, that is, the National Oceanic and Atmospheric Administration, hangs up another plate with measurements – so in the press for a couple of weeks just hysteria begins. Therefore, an international expert scientific council on coronavirus is needed, where objective information, statistics, recommendations and means of neutralizing coronavirus could be obtained. In Japan, a portable device appeared, capable of destroying 99.99 percent of COVID-19 viruses in half a minute. Device represents LED emitter of deep ultraviolet pulses. Deep ultraviolet is highly localized radiation with a very short wavelength, the duration of the pulses of which is measured by femtoseconds (quadrilion fractions of a second). The device LEDs emit deep UV light with a wavelength of 260-280 nanometers (nm) and an optical power of 70 milliwatts. The author has published several articles on coronavirus [1-7]. This article examines natural patterns and magnetic and mental processes of coronavirus activation and neutralization.
Cellular Adaptive Immunity
In conditions of pole change, the significance of cellular adaptive immunity comes to the fore, which is formed by the results of contacts with viruses. It is based on the so-called T-lymphocytes, which give the body’s cells a command to produce antibodies when they meet the virus again. As a result, even if no antibodies are found in the blood of the sick, this does not mean that they have no immunity: with a new contact with the virus, T-lymphocytes launch their “production.” As a result, people either show no symptoms of the disease at all, or it passes in erased form. Today, virologists explain that 80% of those infected survive a new coronavirus infection easily, precisely the work of T-cell immunity. One of the studies conducted in the United States analyzed donor blood samples obtained from 2015 to 2018 – 50% of them showed T cells by SARS-CoV-2. A similar study in the Netherlands revealed 20% of blood samples with T cells. In Germany, reactive T cells were found in a third of seronegative SARS-CoV-2 healthy donors (23 out of 68). In Singapore, a team of researchers analyzed blood samples taken from people who had no contact or personal history with SARS or COVID-19; 12 of 26 samples taken before July 2019 showed T cells to the SARS-CoV-2, as did 7 of 11 samples taken from people who were seronegative to the virus. Similar studies with approximately the same data were conducted in the UK and Sweden. Yes, all these studies examined small groups of people, but their results are difficult to ignore. And now they remembered that something similar happened during the swine flu pandemic in 2009. Many people carried it easily, which was already explained by the presence of reactive T cells formed as a result of encountering genetically similar influenza viruses. A study conducted during the 2009 outbreak by the U.S. Center for Disease Control and Prevention (CDC) found that 33% of people over 60 had cross-reactive antibodies to the H1N1 virus. Today, scientists suggest that cross-immunity to SARS-CoV-2 can be developed not only in those who once had seasonal human coronaviruses, but even in those who met with coronaviruses of some animals. In theory, outbreaks of infectious diseases follow a certain trajectory. Among the population deprived of immunity, the number of new infections is growing rapidly. At some point in this growth, a bend should occur, and the incidence will begin to fall. In the 1970s, a theory was born that defined this inflection point as the threshold of collective immunity (HIT) and even a formula for its definition HIT = 1-1/R0 (R0 is the average number of secondary cases). According to her, experts calculated that under SARS-CoV-2, at least 50% of people need to be ill in order to achieve collective immunity. But there are other, more optimistic calculations – such should be from 10% to 20%. Scientists at the University of Oxford, for example, believe that when there are people with already existing immunity in the population, as studies of T-lymphocytes can show, the threshold of collective immunity can be reduced to 10%. Today, for example, everyone is studying the phenomenon of Sweden, where quarantine was abandoned at the beginning of the epidemic – and the number of cases and deaths was off the scale. Today, there in Stockholm, a city of 2 million people, only 50 people were hospitalized with COVID-19. Has collective immunity developed in Sweden? Swedish scientist Buggert conducted a study: studying close relatives of patients with confirmed COVID, he found T-cell responses in those who were seronegative or asymptomatic. While about 60% of family members produced antibodies, others had T cell responses. However, today, speaking of immunity, everyone focused on antibodies. And talk that antibodies to SARSCoV- 2 begin to weaken after only 2-3 months suggests repeated infections. Even doctors are increasingly talking about them. A growing number of evidence from colleagues about re-infections and, worse, that occurred against the background of high antibody titers is encouraging. With T cells, things may be different: Singaporean scientists, for example, discovered reactive T cells to SARS-CoV-1 in patients with SARS coronavirus 17 years (!) After infection. The metropolitan doctor, who worked in intensive care in 2003, said that she herself had SARS-CoV-1, which was not believed to be in Russia: Almost all my colleagues were ill – we had severe pneumonia, very similar to those that we now see. However, this time, having contracted SARSCoV- 2, I suffered it almost without symptoms, on my legs, although I am at risk. And colleagues who were ill then, now, continuing to work in intensive care, either do not get infected or get sick easily. The viruses SARS-CoV-1 and SARS-CoV-2 are genetically identical by 80%, and obviously we acquired cross immunity. It is estimated that in early 2000, many store sellers, pilots, and airport employees were the first SARS. At the beginning of the pandemic, the key direction was that we needed antibody data to understand who was infected and how many were protected, “wrote immunologists from Imperial College London. – As we have learned more about this complex infection, it is time to recognize that we also need data on T cells. So against the background of the recent statement by the representative of WHO that we have not come close to collective immunity, the results of research on cellular immunity are encouraging [8-14].
Magnetic Coronavirus Therapy
The use of magnets as a physiotherapeutic agent has a long history. Famous doctors of ancient times used the power of magnetic fields to treat various diseases. Since the middle of the 20th century, magnetotherapy has been undergoing a rise, new devices have appeared, while the debate about the effectiveness of the method does not subside. In Russia, the physiotherapeutic school has a great history, and the methods of magnetic therapy are recognized as medical. Treatment with magnetic factors as part of physiotherapy today is one of the links of non-drug and nonsurgical rehabilitation. Studying the effects of magnetic fields on the body and a wide variety of devices in our time have led to a significant expansion of indications for the use of magnetic therapy. Today it is difficult to find a disease in the treatment of which one or another type of magnetotherapy could not be used. Softness of exposure, wide possibilities for personalization and accessibility of the method made magnetotherapy a popular type of treatment and prevention [15-18]. Clinics, sanatoriums and other medical institutions are developing rehabilitation programs after the COVID-19. Mechanisms for recovery from illness are still under study. But it is already clear that magnetic therapy can be safely added to basic medical recommendations – breathing gymnastics, outdoor walks and quality sleep. All microorganisms, ranging from viruses to fungi and microbes, reach the negative magnetic field. That is, a negative magnetic field is such a great universal antibiotic. When the electric dipole has a negative charge, the magnetic field will also be negative. The use of a magnetic field to help patients after a severe coronavirus infection began in several subjects of the Russian Federation. Special devices for this previously helped in the treatment of hypertension and diseases of the musculoskeletal system. The pioneers were doctors of the Ivanovo region. They tried to prescribe magnetotherapy to people in whom COVID-19 gave complications to the lungs. The wellness effect was evident. Today, this practice has been introduced in some other regions. For example, in Crimea, magnetic therapy is included in the rehabilitation programs of sanatoriums. Clinical trials have confirmed that the magnetic field has a good effect on the course of treatment of vessels and respiratory organs, spine and joints. The complex provides a medically free effect on the human body with weak and ultra-weak negative magnetic fields: both general and specific – with an eye on a particular organ or system. Metabolism is accelerated, blood oxygen saturation is increased, immunity is improved, cell and tissue regeneration is accelerated. Several hundred sources of magnetic field are controlled from a computer. The world lives in a state of struggle with a new coronavirus, and hundreds of thousands of patients need restorative treatment. Doctors note that most of those who have undergone coronaviruses even in mild form have symptoms such as shortness of breath, headache, fatigue, depressed mood – the so-called post covid syndrome. Multimag is used to restore patients after COVID-19. The therapeutic factor of the device is the effect of various magnetic fields. The purpose of the action is to activate the adaptation capabilities of the body and restore metabolic processes. Rostec development can be used in medical institutions, sanatoriums, rehabilitation and fitness centers. “Multimag” is successfully used to strengthen immunity and prevent diseases, including viral infections, which include coronavirus. It treats Multimag with the help of dosed exposure to weak frequency-modulated magnetic fields, and it is possible to affect both the body as a whole and individual organs. At the same time, 400 magnets are involved in the device, and wide possibilities for tuning allow you to choose individual treatment. The body in the magnetic field behaves like a diamagnet. Diamagnets – have the property of magnetization in the opposite direction of the external field, that is, they have a negative value of magnetic susceptibility, independent of strength. Many organic substances, such as silicon, germanium, spring water and others, contribute to the human body to acquire the properties of a diamagnet. Diamagnet magnetization occurs in the presence of an external field. Magnetic therapy helps the body become a diamagnet and neutralize coronavirus. The use of low-frequency magnetotherapy in the medical rehabilitation of patients after suffering pneumonia associated with COVID-19 allows improving the general condition, lung function, increasing physical activity and contributing to the restoration of activity in everyday life.
Mental Protection Against Coronavirus
In an environment with positive mental energy, pathogenic organisms do not develop: bacteria and viruses, including coronavirus. Scientists have identified a mental field around the brain [19]. The mental field ensures the normal course of all neurophysiological processes. It is determined that this mental field is highly energetic on special carriers, which are epiphysis crystals. They make it possible to keep a huge energy information volume in the protein body. In the situation with coronavirus, when the problem must be solved immediately, the active generation of mental energy of enormous strength begins. And then the psychoenergetic process of exposure to coronavirus is performed. Not many can consciously manage mental energy. Psychological protection is associated with positive content of thoughts, feelings and behavior. From a spiritual point of view, coronavirus is a cleaner. The level of moral, ethical and spiritual standards is low in large cities. Humans do not keep God’s covenants. The world lives in evil. It makes spiritual sense that the widespread disease with coronavirus occurred on the eve of Lent and understanding of sins before the celebration of the nativity of Christ. We must understand that this is a punishment for sins. We must understand and understand this well, and from this we must proceed in our lives [20-21]. And always ask God for forgiveness – both for himself and for peace. The Lord will pardon and protect, if we really all realize sinfulness, we will obediently strive to live according to the covenants of God, then the pandemic will end. Megacities are an urban environment with a concentration of low spiritual energies. Coranavirus causes people to cleanse themselves mentally and increase positive mental energy. The virus does not affect those who constantly seek to reveal their essence. Coronavirus has energy, information, and several molecules. It is at the level of energy frequencies and functions on other vibrations than a spiritual person with positive mental energy.
Conclusion
Long-term studies of viral mass diseases indicate the realizing role of natural processes and the controlling role of spiritual processes in the international phenomenon of pandemics. The results of the studies set out in the article and publications. confirm this. The controlling substance reveals the spiritual level of society. In accordance with the spiritual level of society and the ecological state of the environment, it launches natural processes and mechanisms according to spiritual laws to cleanse people. Currently, another natural process in the form of coronavirus infection has been launched to cleanse humanity in order to understand the unrighteous destructive activities of peoples, to correct and improve it by observing spiritual, hygienic, sanitary and environmental norms for the benefit of humanity and nature. Now in public places of crowds it is necessary to conduct constant testing for coronavirus. People with large amounts of antibodies can neutralize coronavirus in themselves, but may themselves be the source of infection. Continuous testing in public places will significantly reduce the number of diseases, as is the case, for example, in Germany and South Korea. Continuous testing and operative isolation of those infected with coronavirus is the optimal vital sanitation in the pandemic.
Determination of Arsenic in Minor Cereals (Barley, Foxtail Millet, Proso-Millet, Finger- Millet, Pearl -Millet, Buckwheat, Oat, Quinoa and Sorghum) in Gazipur, Bangladesh
Introduction
Cereals are a staple food for many people around the world including Bangladesh; however, they are also a major dietary source of toxic arsenic (As). Most agricultural lands of Bangladesh are contaminated with arsenic (59 out of 64 districts are arsenic contaminated according to IAEA [1] which can be accumulated to high levels in the grains of cereals cultivated in these regions, posing serious health risks to consumers. Arsenic has two forms such as trivalent (ASIII) and pentavalent (AsV), thus it has larger atomic radius, more electron clouds, relative higher reaction affinity (ASIII) to thiol group/sulfhydryl group (-SH) groups than other divalent cations Most and Papenbrock [2]. As such this notorious heavy metal being efficiently absorbed in skin, lung, kidney, liver, and bladder than any other heavy metals. Though, the level of arsenic contamination and its consequence has been well studied in rice, however, a similar study has not been performed in other cereals (like wheat, maize, barley, and foxtail millet, etc.) despite their increasing trend of production and end-use. Hence, to save the nation, it is imperative to develop cereals that will contain reduced levels of arsenic. Genetic engineering strategies could be employed to develop a variety that will retain a lower amount of toxic arsenic. Therefore, the level of arsenic in the existing cereals has to be determined as a starting point towards lower arsenic variety development. Thus, the arsenic content in the minor cereals available in PBD and grown in Joydebpur soil (Barley, Foxtail millet, Proso-millet, Finger-millet, Pearl-millet, Buckwheat, Oat, Quinoa, and BARI–Sorghum 1) were determined in this experiment. The primary arsenic status of these cereals may have given clues for designing the appropriate breeding program in the future.
Materials and Methods
The leaves of available nine kinds minor of cereal (Barley, Foxtail millet, Proso-millet, Finger- millet, Pearl-millet, Buckwheat, Oat, Quinoa, and BARI–Sorghum 1) were collected from Joydebpur experimental field to their total arsenic accumulation. Before elemental analysis, the leaves samples were oven-dried at a constant temperature of 65°C for 10 days. Subsequently, dried leaves were grounded into fine powder for arsenic level determination. Simultaneously, a soil sample from the same location was collected and subjected to arsenic level determination. The elemental analysis was performed by the soil science division of BARI.
Results and Discussion
The chemical analysis of nine kinds of cereal has shown arsenic accumulation in their leaves in (Table 1). The unit value of arsenic was expressed in ppm (mg l-1 or mg kg-1). The table depicted that total arsenic accumulation of all the minor cereals was remaining an acceptable limit (1-920 μg kg-1). The acceptable limit of arsenic in the terrestrial plant was determined less than 10 mg kg-1 under normal conditions (Matschullat, 2000). Several plants contain arsenic in the following order: cabbage (0.020 – 0.050 mg kg-1) < carrots (0.040 – 0.080) < grass (0.020 – 0.160) < potatoes (0.020- 0.200) < lettuce (0.020 – 0.250) < mosses and lichens (0.26) < ferns (1.3) Matschullat [3]. Comparing the arsenic content in the abovementioned crops with the nine minor kinds of cereal of PBD, all the cereals have shown a negligible amount of arsenic. Although it has been shown that BARI Kaon-1 contains an increasing amount of arsenic comparing with others, it holds arsenic an acceptable limit; because, an average toxicity threshold of 40 mg kg-1was established for crop plants Sheppard [4]. The soil-arsenic analysis was shown 3 mg kg-1which is also negligible that indicates corresponding sites are not contaminated by arsenic. According to Adriano [5], soilarsenic concentration typically varies from below 10 mg kg-1 in noncontaminated soils to as high as 30,000 mg kg-1 in contaminated soils Vaughan [6]. So, it is pragmatic when the soil has less amount of arsenic and crop grown in that particular soil must have less amount of arsenic. In the current experimental condition, it is not possible to say that the crops have less capacity for arsenic accumulation. It could possible they can extract higher arsenic in contaminated soil.
Table 1: Total arsenic analysis of nine kinds of minor cereal and one soil sample.
Conclusion
The cereals grown in Joydeppur’s experimental field have shown non-contamination by arsenic. Therefore, it can be said that seeds produced in Joydebpur experimental field and distributed to farmers and other organizations are free of arsenic. Safe food consumption is not only significant for human but also require for other animals, therefore, ensuring safe food for all kind of lives is one of the objectives of sustainable development goal-2 (SDG- 2). The biochemical analysis needs to be extended for crops that are growing in arsenic-contaminated sites, typically Chandpur, Munshiganj, Gopalganj, Madaripur, Noakhali, Satkhira, Comilla, Meherpur, Bagerhat and Khulna region which are the high arseniccontaminated zone. In addition, similar analysis can be carried out in control conditions where crops will be subjected to varying concentrations of arsenic. The expected output could help to developing an arsenic resistance crop.
Frequency of Positive PPD Test After Inoculation of BCG Vaccine in 4-Month-Old Infants to 5-Year-Old Children
Introduction
Tuberculosis is an important cause of child mortality in developing countries. BCG vaccination of newborns has been shown to reduce the incidence and mortality of children with TB. Protection against TB by BG vaccination has been observed shortly after birth in Canadian Indians (80%) and Chicago (75%) [1]. Bacillus Calmette Guerin (BCG) is a live bacterium of Mycobacterium bovis that was first used by Calmette and Green to immunize against tuberculosis and mycobacterial infections. The wax was first used for the general population in 1921 for tuberculosis. Since then, various vaccines against tuberculosis have been developed and various models of this vaccine have been developed to enhance the effectiveness of this vaccine [2,3]. The BCG vaccine is the most commonly prescribed vaccine worldwide. The vaccine has been administered to approximately 3 billion people worldwide to date and is one of the major vaccines in immunizing newborns [4]. Virtually, such as mycobacterial infections, this vaccine provides some degree of immunity against tuberculosis and, in some cases, mycobacterial infections [2]. History of natural infection with Mycobacterium tuberculosis and previous infection with nontuberculosis mycobacteria provide immunity against tuberculosis [5,6]. Previous infection with Mycobacterium tuberculosis has been shown to increase immunity against recurrent infections in healthy individuals and in HIV-infected individuals, as well as in immunocompromised individuals who are susceptible to infection with other types of tuberculosis [7-11]. The duration of immunization of the BCG vaccine against tuberculosis is approximately 10 to 15 years. This period protects childhood against tuberculosis. Of course, this period can be different. A long-running clinical trial since 1930 of BCG vaccination among Native Americans and Alaskan Indians has shown that in some cases immunity may last up to 50 or 60 years [12]. The degree of usefulness of the BCG vaccine depends on three factors: the individual’s own immunity before vaccination, a history of mycobacteria infection prior to vaccination, and the potential of the species used in the BCG vaccine [13]. So far, no agreement has been reached on which type of BCG is best for the vaccine, and different types of BCG are used to make the vaccine. There has also been no evidence that repeated BCG vaccination is more effective than a single dose against tuberculosis [14]. The standard dose of BCG vaccine is 0.1 microgram per milliliter. Other childhood vaccines can be given at the same time as the BCG vaccine. The vaccine can be given intravenously or multiple subcutaneously using the device. WHO prefers the subcutaneous method [15]. Skin reactions at the injection site are a common complication of vaccination. Other common complications include osteitis, osteomyelitis and diffuse infection. Factors that affect the incidence of complications include the dose of the vaccine, the type of vaccine and how the vaccine is administered [16]. In preterm infants, it is recommended not to inject the vaccine because the risk of infection in this group is much higher than in term infants [17]. Among the tests currently used in clinical medicine is the PPD test, which has been developed in the last century. This long history of using this test indicates that the interpretation of this test is still controversial. However, it has been well shown that the tuberculin skin test reaction and immunity are in fact independent phenomena. The rate of tuberculin reaction is often consistent with immune conditions [1]. Tuberculin skin test is used to identify people with a history of exposure to mycobacterial antigens. The test involves an intradermal injection of tuberculin, which causes delayed hypersensitivity due to T lymphocytes and occurs within 48 to 72 hours. Tuberculin is actually purified protein derivative (PPD) (the recommended dose in North America is 5 units of tuberculin (0.1 ml)). The standard dose is 2 units of tuberculin [18]. The only way to test for tuberculin skin is the Mantoux technique, which involves injecting tuberculin intravenously into the forearm. To read the test, the diameter of the swollen area should be recorded and expressed in millimeters. This measurement should be done within 48 to 72 hours [19]. In this study, we aimed to evaluate the positive rate of tuberculin test after inoculation of BCG vaccine in infants 4 months to 5 years old children in university referral Hospital in Zahedan-Iran.
Methodology
The study was a descriptive study that included children between 4 months and 5 years old who were referred to Hospital in Zahedan who were vaccinated with BCG at birth. Inclusion criteria included having informed consent, age between 4 months to 5 years and history of BCG vaccination. Exclusion criteria also included congenital anomalies, cancer, immune disorders (acquired and congenital), history of infection during vaccination, palpable adenopathy, malnutrition, immunosuppressive drugs and concomitant viral diseases have been. At the beginning of the project, informed consent was obtained from all parents or legal guardians of the children. All children’s information is kept confidential. Sampling was performed through available and sequential samples. Then, for all these patients, a questionnaire form containing all the mentioned variables was filled out. Then PPD test was performed for all subjects and then after 48 hours to 72 hours later the bulge diameter was measured and then the data were entered into the computer and analyzed. To analyze and describe the data, descriptive statistics were used to describe the data including frequency – percentage – mean and standard deviation. Chi-square test was used to compare the frequency of qualitative variables between the two groups.
Results
In this study, 400 infants from 4 months to 5 years old children referred to university referral Hospital were evaluated. 173 (43.25%) were girls and 227 (56.27) were boys. In the age study, 128 subjects (32%) were 4 months to 1 year old. Also, 272 people (68%) were 1 to 5 years old. According to the positive and negative criteria of the test mentioned at the Introduction, 243 people (60.8%) were 0 to 5 mm. 157 patients (39.2%) were more than 5 mm in diameter, which indicates that this test is positive. In terms of protrusion diameter after inoculation, the mean protrusion diameter was 4.09 mm with a standard deviation of 2.88. The lowest was 0 mm and the highest was 17 mm. Among people aged 4 months to 5 years, 68% were 0 to 5 mm in diameter and 32% were more than 5 mm in diameter. Also, between 1 and 5 years old, 57% were 0 to 5 mm, 43 more than 5 mm in diameter. (Table 1) Chi-square test was used to evaluate the relationship between age and the possibility of a positive PPD test. After statistical analysis, P valuation was calculated to be 0.026 and there is a statistically significant relationship between age and the probability of positive PPD test. (P<0.05).
Table 1: Frequency of positive PPD test after inoculation of BCG vaccine in 4-month-old infants to 5-year-old.
Discussion
In our study, the bulge diameter was reported to be 4.09 88 2.88 after inoculation. Also, 61% of people had a negative test result and 39% had a positive PPD test result. Another goal of this study was to investigate the relationship between age and the probability of positive PPD test. In data analysis, there was a significant relationship between age and the probability of positive test (P <0.05), ie with these interpretations with increasing age of the child. The probability of a positive PPD test increase. In different studies, the percentage of PPD test positive in different communities, different results have been reported. Which, of course, is related to different conditions such as the prevalence of tuberculosis, the percentage of vaccination coverage, and so on. In a meta-analysis conducted by Dr. Rezai et al. In 2017, which analyzed the last 14 studies, among 26,281 Iranian children (CI: 95%), 8.5% reacted more than 10 mm, 29.9% reacted between 5 They had 9 mm and 60% less than 5 mm. In this study, it was shown that with increasing age, the percentage of positive test decreases. On the contrary, in our study, the test was more positive with age, which is most likely due to the wider age range selected by Dr. Rezaei. On the other hand, in our study, the rate of positive tests was 39%, but in Dr. Rezaei’s study, only 8.5% of cases above 10 mm reacted [20]. In the study of Alavi SM et al. In 2001 in Ahvaz, the percentage of positive test results was reported to be 2%, which was about 1% less than the amount obtained in our study. However, in this study, 90% of people in the first week after birth They had received the BCG vaccine [21]. In a study by Sleiman R in Saudi Arabia in 2007, the positive rate was much higher than our study and Mr. Alavi’s study in Ahwaz, which was reported to be 8%. About 62% of people were also vaccinated with BCG [22]. In 2008, Araujo Z et al reported a positive rate of 28%, which is very high. This high percentage can be due to the reasons mentioned above [23]. In a study published in Uganda, this study also reported a very high rate of positive testing. In this study, the prevalence of positive PPD test was 32%, which is due to factors such as the prevalence of tuberculosis and the percentage of vaccination coverage, etc. As a result of this study.
RP-HPLC Method Development and Validation for Estimation of Naftidrofuryl Oxalate Using Box- Behnken Design
Introduction
Naftidrofuryl, chemically it is a (RS)-2-(diethylamino) ethyl-3- (1-naphthyl)- 2-(tetrahydro furan-2-ylmethyl) propanoate and it is available in the form of oxalic acid. It is also known as nafronyl, INN, NF, NAFTI or as the oxalate salt nafronyl oxalate [1]. The chemical formula of Naftidrofuryl oxalate is (C26H35NO7) with molecular weight is 473.56 as shown in Figure 1 [2]. Naftidrofuryl oxalate shows smooth muscle relaxation, increases cerebral blood flow as well as peripheral blood flow, cerebral adenosine triphosphate concentrations and glucose utilization properties attracts its pharmacological applications in the treatment of senile brain diseases a vasodilator. Therefore, it is widely used in the treatment of peripheral and cerebral vascular disorders [3,4]. The British Pharmacopoeia (BP) describes a potentiometric non-aqueous titration and high-performance liquid chromatography (HPLC) methods for the assay of NF in bulk form and capsules, respectively [5,6]. The literature survey reveals that few analytical methods have been reported for the determination of Naftidrofuryl oxalate in biological fluids and/or pharmaceutical preparations by using high-performance liquid chromatography [7], high- performance liquid chromatography with fluorescence detection [8,9], RP-HPLC fluorimetry [10], phosphorimetry [11], phosphorescence [12,13], Phosphorimetric determination [14], ion-selective membrane electrodes method [15], spectrophotometric analysis [16], Spectrophotometric, spectrofluorimetric and voltammetric analysis [17] and Stability Indicating Methods [18] were reported till date. Naftidrofuryl oxalate molecule,is composed with the ester linkage associates naphtha- lene propionic acid and diethylaminoethyl moieties and easily hydrolysis in aqueous solutions by either acid-or basecatalyzed reaction to form 3-(1-naphthyl)-2-tetrahydro furfuryl propionic acid, (Naftidrofurylacid, NFA) and diethylaminoethanol. Figure 2 shows the degradation reaction pathway of Naftidrofuryl oxalate. NFA is the metabolite of naftidrofuryl oxalate has been found in human plasma [4,19].
Figure 1: Structure of Naftriduroyl Oxalate.
Figure 2: Hydrolysis rection of Naftidrofuryl.
It is desirable to develop a simple, precise, robust and fast procedure that could be applied in quality control laboratories for the selective determination of Naftidrofuryl oxalate in the pharmaceutical product. The developed method can be utilized for the determination of drug content in its pharmaceutical dosage form is also demonstrated. For this we select QbD based RP-HPLC method development. In a olden days, one factor at a time (OFAT) and keeping the others fixed as a traditional approach used for optimization of HPLC methods, results in achievement of narrow robust, precise and rugged behavior of the method for instrumental variables used in method development phase. This approach may cause high risk in method failure and always requires revalidation protocol after method transfer or alternative method development used to ensure the consequences; thereby it has been increasing the cost of the method, regulatory burden, recall of drugs and batch failure cost [20,21]. Nowadays, QbD is used as a systematic, scientifically based, holistic and proactive approach and powerful tool for chromatographic method development. In this approach we can understand process parameters that influence chromatographic separation by determination of critical ones, their positive or negative effect on the selected responses, and the multidimensional interaction between them. In addition, the change in variable of QbD facilitates the purposeful variables changes will gives desired response and suggests the optimal solution with variables value that best gives the maximum, minimum or target response, while at the same time it finds the spot with the minimum error transmitted to the responses. So, this should represent robust process conditions that not affected by slight variations in factor settings. It also suggests a mathematical model that relates the response and the experimental variables, thus allowing response prediction with minimum error transmitted to the response [22-26]. Application of DoE principles facilitates understanding of multiple method parameters and variables that tend to affect CMAs, while unravelling the prevalence of (any) interactions and reducing intricacies. For the successful execution of DoE study, the knowledge of response variables or CMAs, CMVs, their ranges, and best fitting of the mathematical model(s) is mandatory. DoE-based Response Surface Methodology (RSM) is helpful in systematic development of analytical methods involving significant nonlinearity between CMV-CMA relationship(s) using diverse experimental designs like Factorial design, Central Composite design, Box Behnken design, Optimal design, etc. The experimental designs help in mapping the responses on the basis of the studied objective(s), CMAs being explored, at high (coded as +1), medium (coded as 0), or low (coded as -1) levels of CMVs. It tends to unearth the mechanistic understanding of CMVs and CMAs relationship, and associated interactions among them. Various 3D and 2D-plots like response surface plots, contour plots, perturbation charts, linear correlation plots, outlier plot and Box-Cox plot are some of the key pictorial/ graphical tools of the experimental designs useful for the purpose [27,31]. The literature survey reveals that the BBD was one of the design strategies employed for selection and optimization of mobile phase during chromatographic analysis. The BBD is different from all screening designs as it contains combinations or midpoints of edges of the process space and at the center, i.e., variables at their highest or lowest levels, so that the designs will avoid all factors which affects method. These designs are useful in avoiding experiments performed under extreme conditions as these may give unsatisfactory results [32-34]. In the RSM design, Box–Behnken statistical design is an independent, rotatable or nearly rotatable, quadratic design, requires fewer experimental runs and less time and thus provides a far more effective and costeffective technique than the conventional processes of formulating and optimization of dosage forms [35]. Literature survey revealed that there is no previously reported analytical QbD based RP- HPLC method for NF. Thus, the main goal of this work was to establish a precise, accurate and sensitive QbD based RP-HPLC method for NF using RSM and Multiple responses optimization utilizing quadratic polynomial equation. Screening of the critical factors was achieved using BBD, the independent variables for the present study was Organic phase (X1), Aqueous phase(X2) and (X3) and the responses was Retention time (Y1), Resolution (Y2) and Tailing factor (Y3). The developed method was validated for linearity, system suitability, recovery (accuracy), precision, robustness, ruggedness, limits of quantitation (LOD) and detection (LOQ) as per the ICH guidelines [36,37].
Experimental
Materials
Naftidrofuryl oxalate was obtained as a gift sample from Zim Lab, Nagpur, India. All the chemicals such as Methanol and Acetonitrile (HPLC grade), Ammonium acetate, Tetra butyl ammonium hydroxide and Concentrated Nitric acid (AR grade), procured from Merk life science private limited Mumbai and Final limited Ahemdabad. Instrumentation and Chromatographic Conditions: HPLC analysis was carried out using Shimadzu HPLC series 1100. Separation was carried out on Zodiac column (C18 100mm×4.6 I.D., 3μm particle size column), Detection was achieved using SPD-10UV detector and LC 10 ADVP-pumps connected to a hp computer. The mobile phase was prepared by mixing Tetrabutyl- ammonium buffer and Acetonitrile (adjusted to pH7 with concentrated Nitric acid) in a ratio of 10:90 v/v, then filtered through 0.45μm membrane filter (Millipore, Milford, MA, USA). The injection volume was 20μL with a flow rate of 1.0mL/min and UV detection at 282nm. The wavelength of maximum absorbance was detected by UV-Visible spectrometer (double beam), Shimadzu UV-1700 model and wavelength scanning range was 200-400nm was exercised using UV probe software. For applying quality by design Design Expert® 11.0 – trial version software was used. Preparation of Standard Solutions: A stock solution of 1000 μg/mL was prepared by dissolving 10mg of Naftidrofuryl oxalate standard in 10mL of a mixture Tetrabutyl- ammonium buffer and Acetonitrile (adjusted to pH7 with Concentrated Nitric acid) in a ratio of 10:90 v/v. Standard solutions were prepared by further dilution of stock solution with the same solvent to get 30 μg/mL.
Experimental Design
Scouting Step: This step included some trials of the mobile phase that gives an acceptable well resolved chromatographic peak of analyte. At the beginning, different mobile phases containing Tetrabutyl ammonium buffer and Acetonitrile as the aqueous/ organic part of the mobile phase were tried. In addition, change in ratio of Tetrabutyl- ammonium buffer and Acetonitrile were tested. Finally, the variables that may affect the selected CQA were selected. Screening Design: In the present study, 3-factor, 3-level Box- Behnken statistical design was used to evaluate the effect of selected responses, to characterize the drug contents and to optimize the developed method. BBD is efficacious for exploration of quadratic response surfaces, mathematical screening and thus helping to optimize the process by using a small number of experimental runs. The dependent and independent variables selected are given Table 1 along with their low, medium and high levels, which were selected based on the results from preliminary experimentation. The observed responses are given in Table 2.
Table 1: Variables in Box Behnken Design.
Table 2: The observed responses in Box-Behnken Design for Naftidrofuryl Oxalate.
Note: *Variables X=Organic phase (X1), Aqueous phase(X2) and Flow rate (X3). Responses Y= Retention Time (Y1), Resolution (Y2) and Tailing factor (Y3).
BBD a also used to optimize and evaluate the main effects, interaction effects and quadratic effects of the independent factors on the dependent factors as 3-factor, 3-level Box- Behnken statistical design suitable for exploring quadratic response surfaces and constructing second order polynomial model with Design Expert® 11.0 – Trial Version software. The nonlinear computer-generated quadratic model is given as
where Yo is the dependent variable; bo is an intercept; b1–b33 are regression coefficients computed from the observed experimental values of Y; and X1–X3 are the coded levels of independent variables. The terms X1, X2 and Xi(i=1,2or3) represent the interaction and quadratic terms, respectively Optimization Data Analysis: The responses Retention Time (Y1), Resolution (Y2) and Tailing factor (Y3) of were treated by Design-Expert software design such as BBD which consist of three components include linear, quadratic and special cubic models. The best fitting mathematical model such as ANOVA method and Good fit evaluation were selected based on the comparisons of several statistical parameters including the coefficient of variation (C.V.), the multiple correlation coefficient (R2), adjusted multiple correlation coefficient (adjusted R2); and the predicted residual sum of square (PRESS), proved by Design-Expert software. Among them, PRESS indicates how well the model fits the data, and for the chosen model it should be small relative to the other models under consideration.Also various 3-D response surface graphs and counter plots were provided by the Design- Expert software. By intensive grid search performed over the whole experimental region, the optimum checkpoint mobile phase composition was selected to validate the chosen experimental domain and polynomial equations. The optimized checkpoint mobile phase composition was prepared and evaluated for various response properties. The resultant experimental values of the responses were quantitatively compared with that of the predicted values. Also, linear regression plots between actual and predicted values of the responses were produced using MS- Excel version 2019. Validation: The method was validated in accordance with the International Conference on Harmonization (ICH) requirements [37], which involved linearity, system suitability, recovery (accuracy), precision, robustness, ruggedness, limits of quantitation (LOD) and detection (LOQ). Linearity, LOD, and LOQ: The linearity of the method was assessed at five concentrations within the appropriate range. To construct the calibration curves the peak areas were plotted against concentrations. For an analyte in a sample, LOD is the lowest concentration which can be detected, not quantified. On the other hand, LOQ is the lowest concentration was calculated. System Suitability: The system suitability parameters area, retention time, tailing factor, theoretical plates and resolution were calculated by injecting standard Naftidrofuryl oxalate solution. Accuracy: The accuracy of the proposed method was indicated by % recovery of the five different concentrations of Naftidrofuryl oxalate. Robustness: In addition to identifying the design space that represents a robustness zone, the insensitivity of the proposed method to small changes in the optimized conditions such as deliberate changes in the method were done i.e., Change in flow rate (1.0 ± 0.2mL/min), change in mobile phase concentration (organic portion of 90% ± 5%), change in column and change in pH of Buffer solution (7.0± 0.2 pH) in mobile phase. Ruggedness: The studies were carried out for two different parameters i.e., Days (Intraday and Interday) and Analyst to Analyst variation. Single concentration level was selected and analyzed as described before three times within the same day (intra-day precision) by different analysts, and on successive three days (inter-day precision). The % RSD was calculated as a measure for method precision.
Results and Discussion
Scouting Step
An isocratic mobile phase consisting of Tetrabutyl- ammonium buffer 20% and acetonitrile 80% was applied at the beginning. This mobile phase gave strong tailing and no well resolved peak shape. When % of Tetrabutyl- ammonium buffer was increased and % of acetonitrile reduced, tailing increased strongly. Then we reduced % of tetrabutyl-ammonium buffer and % of acetonitrile increased in order to have better resolution. In this case, good peaks shape was obtained. In this step, three factors were chosen: the % aqueous part of the mobile phase, % of organic phase and flow rate.
Screening with BBD
The significance of model so obtained can be evaluated by two ways i.e. ANOVA method and Good fit evaluation. ANOVA is a statistical method based on F-test to estimate the significance of model. It involves subdividing total variation into variation due to Residual error, Main effects and Interactions.
ANOVA Technique
The ANOVA (one-way Analysis of Variance) is used to ensure about the significant differences between the means of three or more independent groups. The results of ANOVA of Variance for Retention time (Y1), Resolution (Y2) and Tailing factor (Y3) shown in Table 3. The Model F-value of Retention time (Y1), Resolution (Y2) and Tailing factor (Y3) was found to be 16.69, 10.72 and 7.11 respectively and it implies that the model is significant. There is only a 0.01% chance that an F-value this large could occur due to noise. P-values less than 0.0500 indicate model terms such as -A, C, AC in Retention time(Y1), – A, B, A², B², C² in Resolution (Y2) and -A², B², C² in Tailing factor (Y3) are significant model terms. Values greater than 0.1000 indicate the model terms are not significant. If there are many insignificant model terms.The Lack of Fit F-value of 66.01 and 32.46 in Retention time (Y1) and Tailing factor (Y3) respectively implies that the Lack of Fit is significant. Whereas in the Resolution (Y2), Lack of Fit F-value of 3.02 implies the Lack of Fit is not significant relative to the pure error. There is a 15.69% chance that a Lack of Fit F-value this large could occur due to noise. The average values obtained from the software are given in Table 4.
Table 3: ANOVA results of the Box Behnken design for response surface quadratic model.
Table 4: Table for average values obtained from the software.
Main Effects (Lack of Fit)
The Lack of Fit is one of the components of partition of the sum of squares in an ANOVA which can tell that that purpose model is fit or not. The results of Lack of Fit Test and Model Summary Statistics of Retention time (Y1), Resolution (Y2) and Tailing factor (Y3) showed in Table 5.
Table 5: Model Summary Statistics for Lack of Fit Test.
Interactions
The equation in terms of actual factors can be used to make predictions about the response for given levels of each factors are given in Table 6.
Table 6: Table for final Equation in Terms of Actual Factors.
Contour Plots and Response Surface Analysis
The graphical optimization was another tool used to specify the design space or sweet spot where the desired CQAs meet. The goal of graphical optimization was to maximize both responses after speci- fying their lowest acceptable limits. 3D plot showed the interaction effect of the critical factors. Two-dimensional contour plot of Retention time (Y1), Resolution (Y2) and Tailing factor (Y3) shown in Figures 3a-3c and three- dimensional response surface plot are presented in Figures 4a-4c which is very useful to study the interaction effects of the factors on the responses. These types of plots show the effects of two factors on the response at a time.
Figure 3:
a. Counter Plot for Response Retention Time. b. Counter Plot for Response Resolution. c. Counter Plot for Response Tailing factor.
Figure 4:
a. Surface Response Curve for Response Retention Time. b. Surface Response Curve for Response Resolution. c. Surface Response Curve for Response Tailing factor.
Validation
Linearity, LOD, and LOQ
Linearity study was performed on Naftidrofuryl oxalate under the optimized chromatographic conditions; a good linearity was obtained between the peak areas and the concentration ranging from 10 to 50μg/mL. The observations are shown in Table 7, from the data, a plot concentration (μg/mL) Vs Area Under Curve (AUC) was constructed for the Naftidrofuryl oxalate (Figure 5). The study of graphical plots represents correlation coefficient of Naftidrofuryl oxalate was found to be 0.997.
Table 7: Regression data and System suitability data.
Figure 5: Plot of Linearity Curve.
System Suitability
The study of chromatogram reveals that the Naftidrofuryl oxalate was well resolved hence, resolution of the same needs to be studied. The system suitability was performed by preparing the 30 μg/mL solution of standard Naftidrofuryl oxalate performed under optimized condition. From the observation of results, all the obtained results are in under the acceptance limit. Hence, according to acceptance criteria the system is suitable for analysis. The results for system suitability parameters are given in Table 7 and standard chromatogram is given in Figure 6. The correlation coefficient was found to be 0.997 for the drug.
Figure 6: Chromatogram of Std NF.
Accuracy
Accuracy of proposed method was as certain on the basis of recovery studies performed by standard addition method. Percent Recovery was performed by preparing the 30 μg/mL solution of Standard Naftidrofuryl Oxalate. The ±S. D and % RSD was calculated and the results for % Recovery is given in Table 8.
Table 8: Observation and Results of Recovery Study.
Robustness
In these study deliberate changes in the method were done i.e. Change in flow rate (1.0 ± 0.2mL/min), change in mobile phase concentration (organic portion of 90% ± 5%), Change in column (Agilent ZORBAX and ZODIAC) and change in pH of Buffer solution (7.0 ± 0.2 pH) in mobile phase. The robustness results Mean, SD and %RSD of series of measurement were found to be within limit as shown in Table 9.
Table 9: Table for summary data of Robustness results.
Ruggedness
The studies were carried out for two different parameters i.e., Days (Intraday and Interday) and Analyst to Analyst variation. In intraday and inter-day variations, results of estimation by proposed methods were found to be varying. In inter-day study% RSD and % estimation was found to be increased after one day storage suggest that the NF is unstable in solution form while in intraday study, solution was found to be stable up to 3 h. The result of estimation for Naftidrofuryl oxalate by different analysts was very much reproducible. This indicates the ruggedness of the method in the hands of different analysts. The results of Ruggedness study for the proposed method is given in Table 10.
Table 10: Results of Ruggedness study for the proposed method.
Conclusion
A validated QbD based RP-HPLC method has been developed for Naftidrofuryl oxalate utilizing “Analytical Quality by Design” (AQbD)- DOE approach. Multivariate regression analysis was successfully applied to study the main effects of three factors on the of retention time, resolution and tailing factor. BBD was employed for optimization of chromatographic conditions and used to analyse the analytical target profile by studying the interaction and quadratic effects on the factors for three selected responses. The models used for screening and optimization steps were found to be significant and confirmed method predictability. The developed method was validated for linearity, accuracy, robustness of test method, ruggedness, intermediate precision, recovery study, LOD and LOQ. The method is simple, robust, accurate and can be successfully applied to the analysis of Naftidrofuryl oxalate
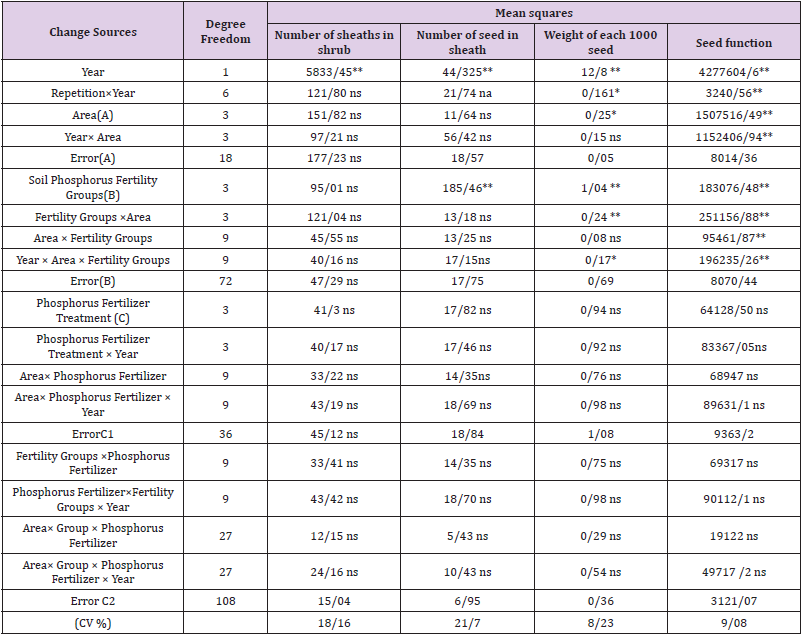
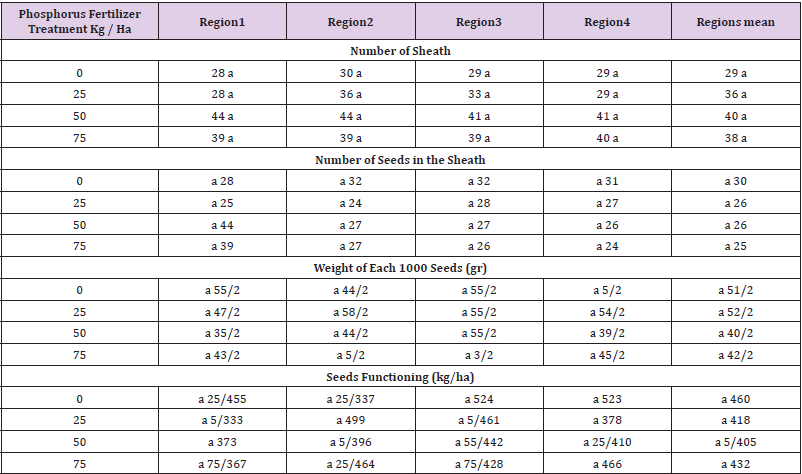
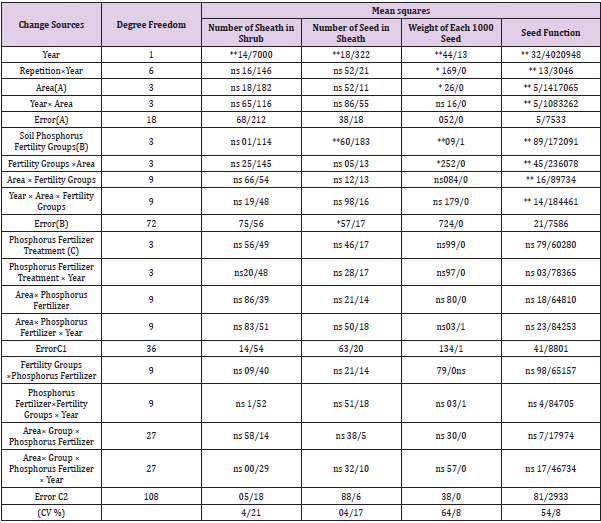
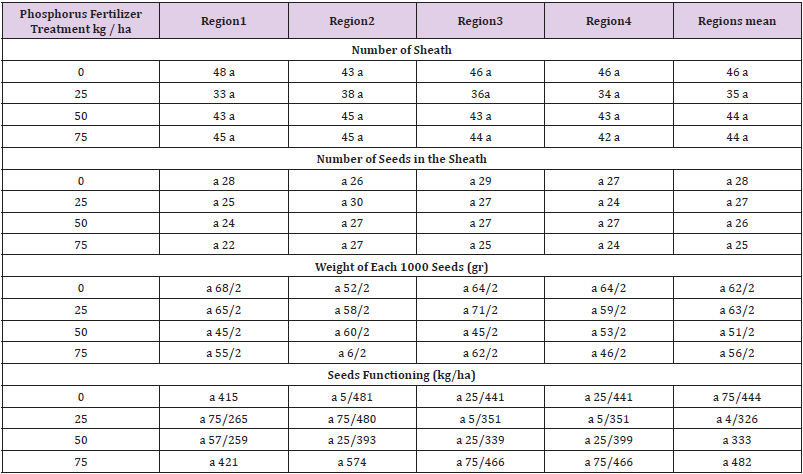
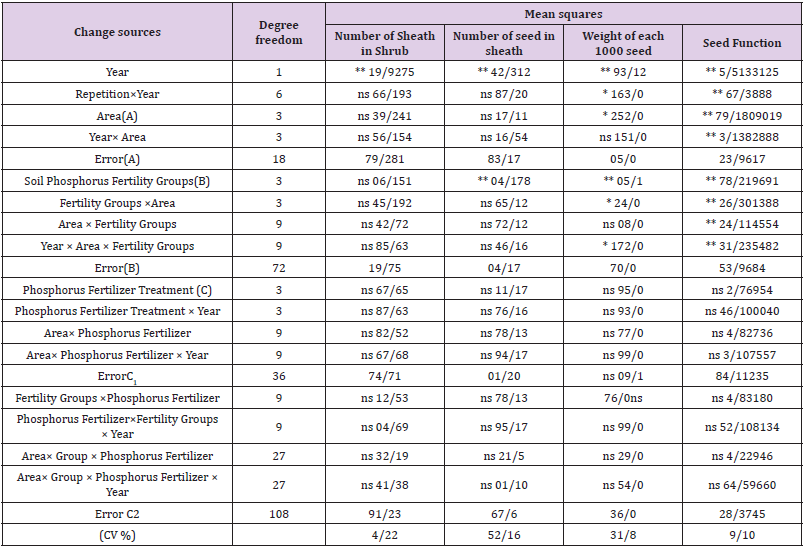
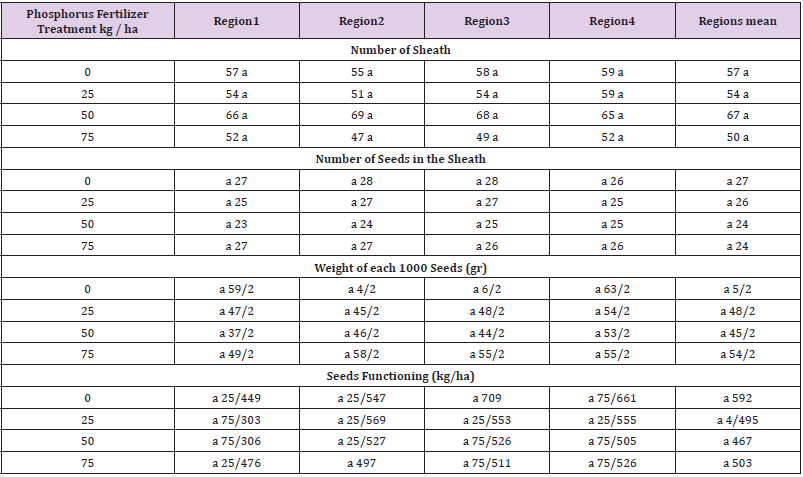
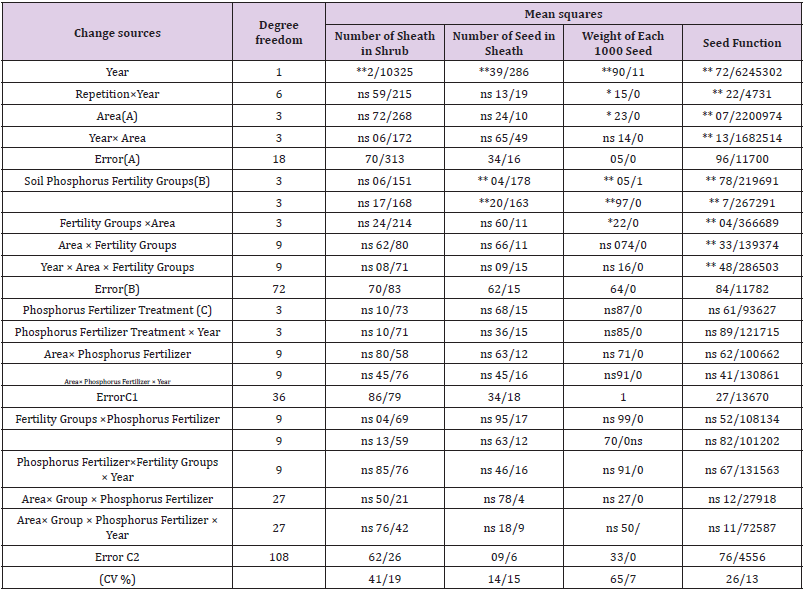
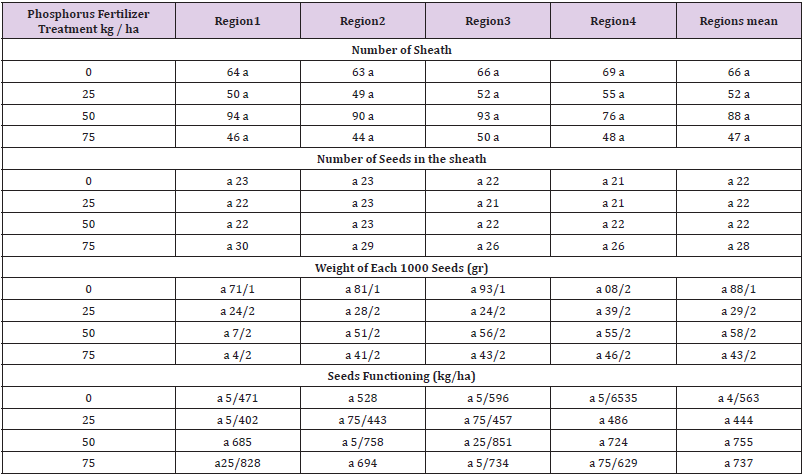
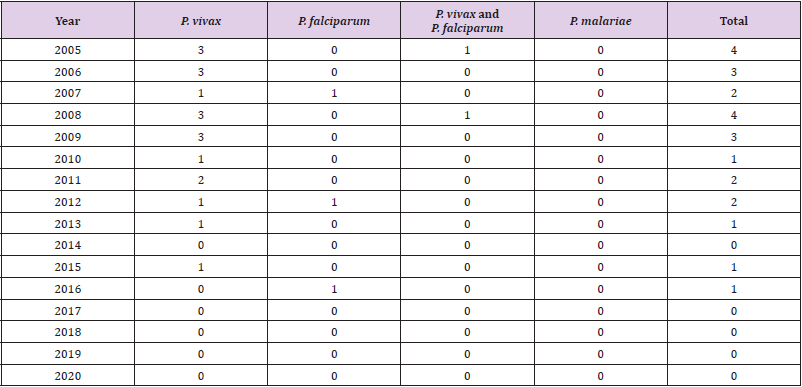
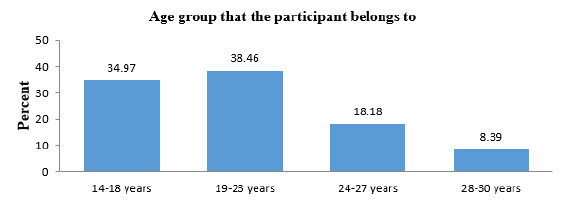
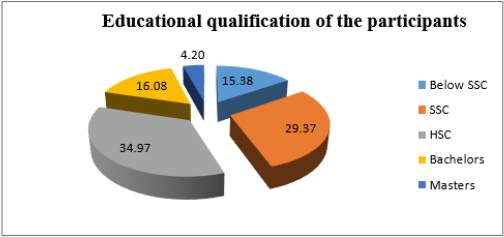
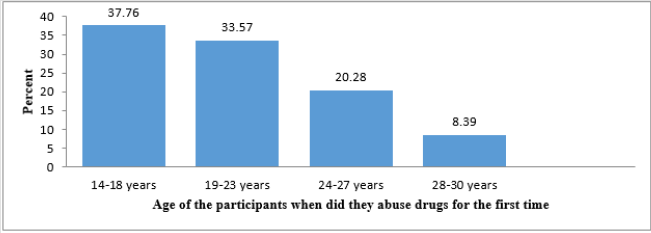
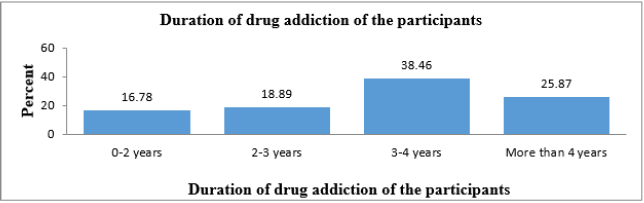
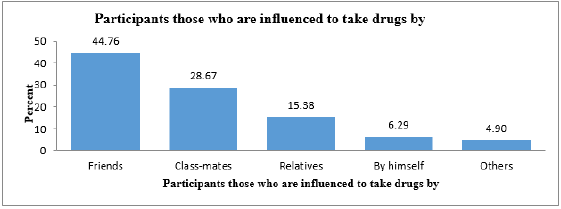
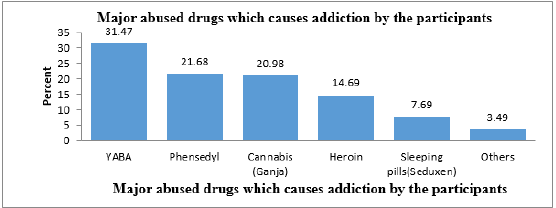
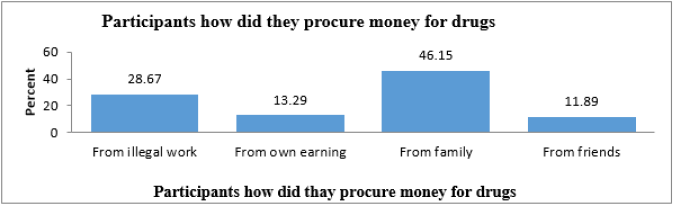
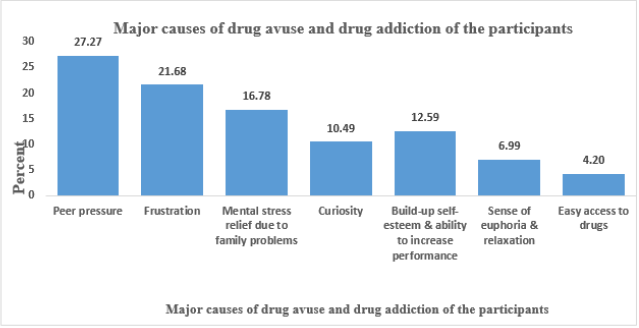
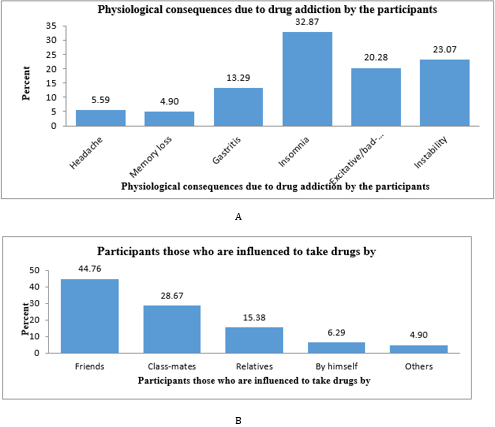
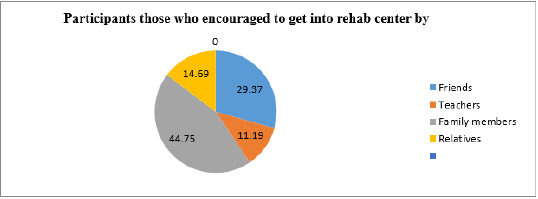
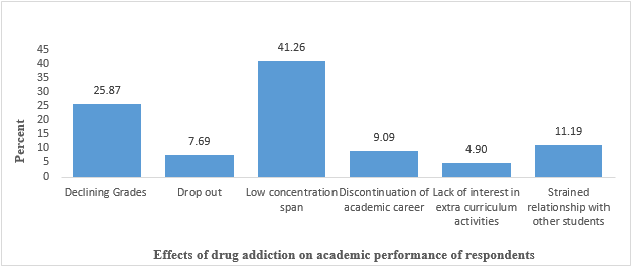
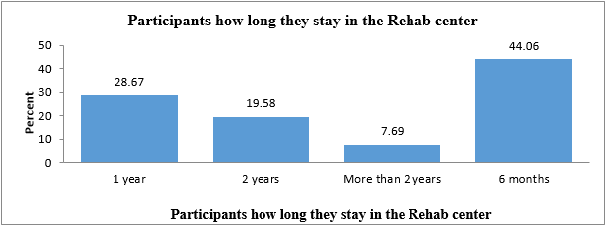
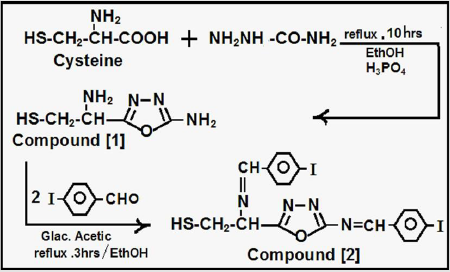
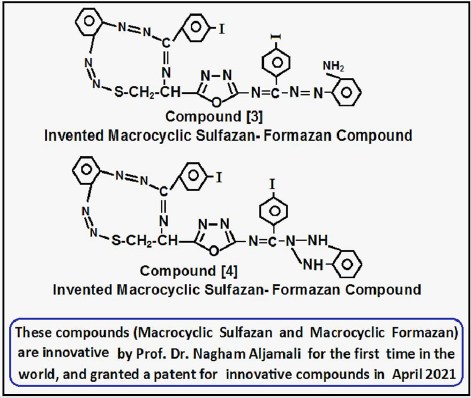
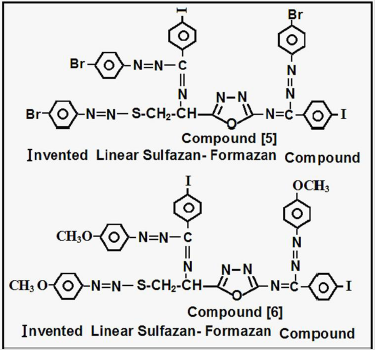
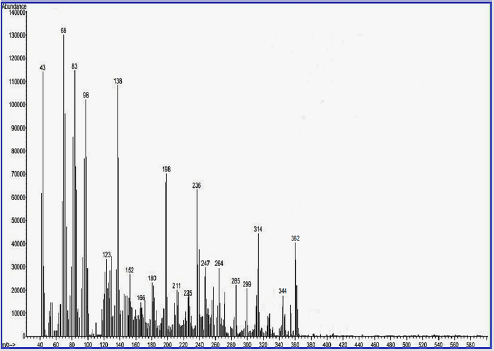
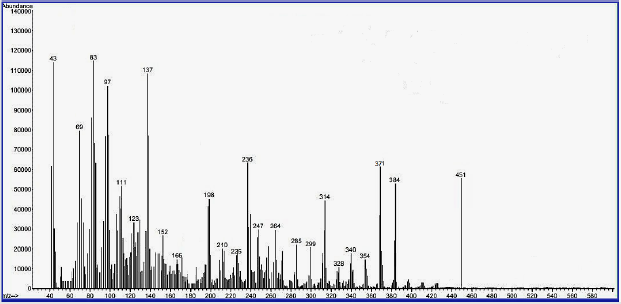

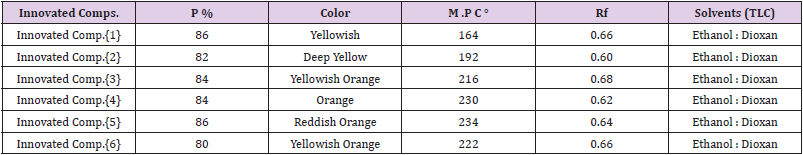
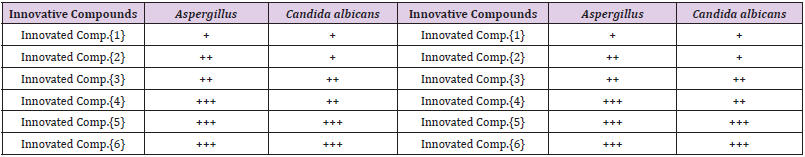

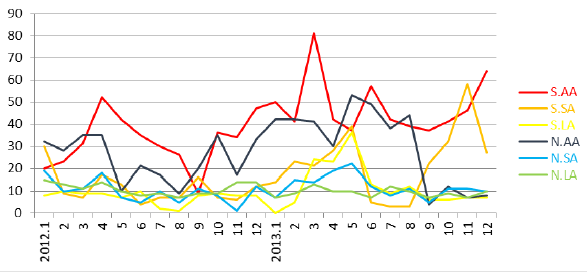
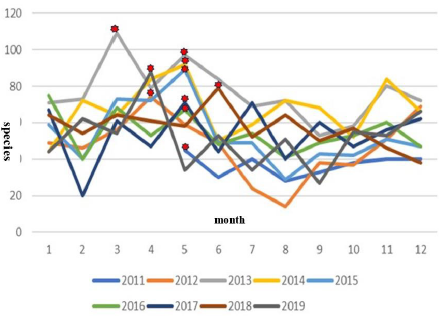
 )
)