Biomedical Journal of Scientific & Technical Research (BJSTR) is a multidisciplinary, scholarly Open Access publisher focused on Genetic, Biomedical and Remedial missions in relation with Technical Knowledge as well.
The management of the organizational climate in health institutions and the importance of studies related to this topic are very well addressed in the position article “Management of the organizational climate: an urgent need in health institutions”, [1] published this year 2023. Achieving the organizational climate in any institution is of utmost importance and its implementation is very necessary. Various investigations can be consulted on the need to maintain the organizational climate in any company, but in health institutions it is essential [2,3]. To evaluate this organizational climate it is necessary to take into account four dimensions or basic concepts: motivation, leadership, reciprocity and participation. The work environment is closely related to the behavior of workers and their superiors. Depending on how the organization that maintains their workplace is perceived by the workers, their level of satisfaction will be more or less high. The organizational climate is an important administrative tool that can contribute to the decisionmaking of managers. Depending on this organization, the behavior of productivity, the distribution of services, among others, can be projected. Always keeping in mind that this constitutes a process that will be constantly perfected [4]. Adequate information management is another factor that influences decision-making where workers have a predominant role.
An adequate organizational climate together with effective information management in health institutions translates into better benefits for patients. Every manager has to be up to date on computer advances and use them to support their daily work. In various audits of services by health managers, it has been shown that sometimes the lack of managerial information on the part of managers has led to worker dissatisfaction. The importance of taking into account the close direct relationship that exists between adequate organizational climate-worker satisfaction-better results is very well defined in the article by Olivera, et al. [1]. Added to this triad, without a doubt, is the need for efficient and necessary information management by managers [5]. This facilitates the planning of material and human resources to provide quality care to the population. Once the management of the organizational climate in a center has been analyzed, it is necessary to apply strategies aimed at improving it, which in turn contributes to achieving positive healthcare results. The implementation of an organizational climate project in the comprehensive diagnostic centers (CDI) of Venezuela encouraged changes in personal and labor relations among workers [3].
It is necessary to integrate into the work system of health managers the importance of knowing the organizational climate of their center, and provide them with the necessary tools that allow them to establish strategies for their favorable evolution. There are still many actions to be developed that can reverse errors that have sometimes ruined the adequate provision of services to the population. The management experience achieved by the authors allows us to affirm that the appropriate organizational climate and information management facilitate the actions of managers. Denying that there are inadequacies in the preparation of some of the managers at the head of health entities would not help achieve the standards of satisfaction of the population and workers that are needed. Being able to lead a group of health professionals will not be possible simply by having the knowledge to apply advances in the computer science area and the correct management preparation. It is necessary to involve all the workers who are part of the services provided by each health center to achieve the optimal organizational climate that favors raising the quality of care for the population. Each one is responsible for fulfilling the different functions assigned to achieve and maintain an optimal organizational climate.
Conflicts of Interest
The authors declare not to have any interest conflicts.
Author Contribution
1. Francisco Jorge Fernández Quintero: Conceptualization, Formal analysis, Fund acquisition, Research, Project administration, Resources, Supervision, Validation.
2. José Alejandro Concepción Pacheco: Conceptualization, Methodology, Supervision
3. Juan Carlos Mirabal Requena: Conceptualization, Data curation, Formal analysis, Research, Methodology, Validation, Visualization, Writing – original draft, Writing – review and editing.
A Case Study: Effects of Insulinoma in Psychiatric Patient
Introduction
Insulinoma is a rare and generally benign form of pancreatic neuroendocrine tumors. Pancreatic neuroendocrine tumors (PNET) are formed in the islet cells of the pancreases. Beta cells control the increase of insulin, and this production is dependent on blood sugar. However, in insulinomas the insulin production is independent of the blood sugar. These tumors may be symptomatic or present with no symptoms at all. Symptoms in insulinoma are usually neuroglycopenic including- recurrent headache, diplopia, lethargy and in severe cases seizures and coma may occur. Palpitations, sweating, hunger can be seen due to catecholamine response to hypoglycemia. Syndromes have been linked with these tumors such as multiple endocrine neoplasia, neurofibromatosis (NF1), Certain conditions including, type II diabetes and pancreatitis have been associated with pancreatic neuroendocrine tumors [1]. Different medical techniques are used to diagnose includes CT scan, MRI, neuroendocrine positron emission tomography and endoscopic ultrasound [2]. Successful treatment of neuroendocrine tumor is present in case when it has not spread to the body. Treatment options include surgery and chemotherapy depending on the stage of detection.
Case Presentation
A 61-year-old male presented to our services in an acute confusional state. He had been managed as a case of anxiety in the past as he had palpitations, tachycardia, dizziness, seizures. Initial assessment of this patient revealed blood glucose of 41mg/ dl. All other blood works were normal. Physical examination was unremarkable. The patient was commenced on dextrose infusion which he responded well to. Differential diagnosis of insulinoma and factitious hypoglycemia was made, and the patient was referred to the surgical and mental health services. Computed Tomography revealed a 1.4cm lesion at the tail of the pancreas and a 72-hour supervised fasting CT scan confirmed the diagnosis of an insulinoma. The patient was assessed by the surgical team and optimized for surgery in the same admission. A distal pancreatectomy was carried out and the immediate postoperative phase was uneventful. Biopsy sent to the pathology laboratory confirmed the diagnosis of insulinoma. He was discharged on the 8th day postoperatively and he has remained asymptomatic without psychiatric medications and antiepileptic medications during the 6 month post-operative follow up.
Discussion
The patient reported in this case had previously presented with symptoms suggestive of psychiatric illness. On subsequent presentation to the hospital in acute confusion, investigations done was more in keeping with an insulinoma which required surgical intervention. Surgical intervention is curative for most patients. In certain patients, medications such as diazoxide and octreotide is used, particularly when awaiting surgery or not candidates for surgery [3] Insulinomas are often characterized by the Whipple triadneuroglycopenic symptoms, autonomic symptoms with low serum glucose (less than 50mg/dL) resolving following administration of glucose. Laboratory and radiological investigations are used to confirm the diagnosis of insulinoma [4] Biochemical, biological, psychological, spiritual and social aspects are interlinked with each other, and this was highlighted in this case. There is indication that the neurochemical anatomy was changing, and social condition of the patient illustrates panic attacks and anxiety symptoms. Surgical intervention resulted in resolution of his symptoms and his symptoms of mental illness improved and the patient continued to do well after treatment.
Limitations
Limitation of this case study was that there was no interaction with patient family or friends due to patient wishes, which could have provided in-depth knowledge about the manifestation of panic attack symptoms and about his physical condition. The patient was managed conservatively for his symptoms without having any focussed investigations for almost 5 years before his final presentation to emergency.
Ethical Approval
This case report was carried out in an official condition of hospital settings. All investigations and treatment were provided to patients under ethical conditions.
Consent
Consent form was filled by the patient for the publication of case report.
Conflict of Interest
The authors declare that there is no potential conflict with authorship, research, publication and informed consent.
We report the case of a 46-year-old woman, known to have polycystic hepatorenal disease, who consulted for increased abdominal distension and secondary respiratory distress. On examination, her abdomen was grossly distended, with multiple cystic nodules in the supraumbilical region (Figure 1).
Figure 1
Laboratory Tests Showed Normal Renal and Hepatic Function
Abdominal CT showed an enlarged liver, riddled with simple cystic lesions, classified as type III according to the GIGOT classification. Both kidneys showed numerous small cortical serous cysts. The patient was a candidate for liver transplantation. Given the long waiting time and shortage of transplants, surgical fenestration was decided to be performed. Intraoperatively, the liver had a multicystic appearance, with liver parenchyma totally involuted on the left (Figure 2). She underwent fenestration of the cysts and a left lobectomy (Figure 3), which resulted in an accidental wound of the middle hepatic vein, controlled by suture. The patient was transfused and managed intraoperatively using vasoactive drugs. She died of diffuse intravascular coagulation immediately postoperatively.
Figure 2
Figure 3
Polycystic liver disease is a rare hereditary disorder defined by the presence of multiple diffuse cysts in the liver. It may be isolated, or accompany autosomal dominant or autosomal recessive polycystic kidney disease [1]. Autosomal dominant polycystic kidney disease (ADPKD) is the most common monogenic genetic kidney disease. Polycystic liver disease is the most frequent extrarenal manifestation of ADPKD, affecting 94% of patients [2]. The number and size of cysts and the proportion of functional liver parenchyma remaining are the determinants of GIGOT classification. It has divided polycystic liver disease into three types, of which type III has the poorest prognosis [3]. The treatment of hepatic cysts may include percutaneous aspiration, fenestration, lobectomy or hepatectomy, or even liver transplantation [3].
Hypersplenism in Patients with Liver Cirrhosis and Portal Hypertension: Predictors, and Correlations
Introduction
The criteria of hypersplenism include anaemia, leukopenia, thrombocytopenia, or a combination of them, hypercellular or normocellular bone marrow, splenomegaly, and improvement after splenectomy Hypersplenism is a common manifestation of PHT in patients with chronic liver diseases, and correlates with the severity of liver cirrhosis, The presence of hypersplenism suggests more advanced liver disease and an increased risk of complications [1,2]. Splenomegaly is often used radiologically as an indicator of cirrhosis [3]. Many studies also investigated the relationship between size of gastroesophageal varices and platelet count/spleen diameter ratio in cirrhotic patients which also suggested that it could be used as a non-invasive indicator of oesophageal varices [4]. However, a little is published on the actual frequency of hypersplenism and its correlations with liver disease. To date, no studies have fully assessed these correlations of hypersplenism in cirrhotic patients, which can be useful in diagnostic aspects, assessment, grading of severity, therapeutic interventions or may even lead to the development of a new scoring system for hypersplenism and more comprehensive scoring system for assessment of liver cirrhosis and PHT. The current study aimed to assess the prevalence and pattern of hypersplenism in patients with liver cirrhosis and portal hypertension. In addition to elucidate the relationship between hypersplenism and severity of liver disease.
Patients and Methods
Study Design & Setting
A cross sectional study was carried out on patients presented to the outpatient clinic and patients admitted at Al Rajhi Liver Hospital, Assiut University Hospitals, Faculty of Medicine, Assiut University, Assiut, Egypt.
Patients
A total of 303 patients who presented to the outpatient clinics or admitted to the ward, who fulfilled the inclusion criteria were recruited in the study during the period from February 2018 to December 2021 excluding the period from March 2020 to September 2020, as the hospital was turned into an isolation centre for COVID 19.
Selection Criteria
All patients with documented evidence of liver cirrhosis (of any aetiology other than alcoholic cirrhosis) and PHT, based on history, clinical examination, abdominal ultrasound examination, or upper gastrointestinal endoscopy were recruited. Any patient with one or more of the following criteria was excluded; splenomegaly of any cause other than liver cirrhosis, lymphoproliferative disorders, extrahepatic malignancy, associated severe cardiovascular disease, age younger than 18 years old or older than 70 years old, and/or failure to obtain consent.
Baseline Evaluation
All included patients were subjected to thorough history taking, complete physical examination, routine laboratory investigations (peripheral hemogram, renal functions, liver functions, prothrombin time, concentration, and INR) and abdominal ultrasonography. Liver cirrhosis severity was graded according to Child-Pugh and the Model of End-stage Liver Disease (MELD) scores [5-7].
Assessment of the Presence and Severity of Hypersplenism
The blood picture (hemogram) and blood film were done for all the 296 patients. Haematologically, hypersplenism was defined as leukocyte count of <4.0×10⁹/L, an erythrocyte count of <4.0×10¹²/L, and/or a platelet count of <150×109/L [8]. The prevalence and pattern of hypersplenism were assessed. Owing to the finding of only anaemia in many patients without other cytopenia, which could be a result of many factors as hematemesis, anaemia of chronic disease in hepatic patients, and as work up to exclude anaemia couldn’t be done in all these patients, so anaemia alone was not considered as a cytopenia parameter of hypersplenism unless combined with leukopenia or thrombocytopenia, exclusion of anaemia only as a single parameter of hypersplenism was stated in previous studies [2,9]. Depending mainly on the severity, cytopenia, was graded as mild, moderate, or severe, and given a total score of <2 points, 2-3 points, and >3 points, respectively. PLTs count of 50-100×109/L was scored as 1, 30-50×109/L as 2, and <30×109/L as 3; a RBCs count of 3-4×10¹²/L was scored as 0, and <3×10¹²/L as 1; a WBC count of 2-4×10⁹/L was scored as 0, and <2×10⁹/L as 1 [8]. Presence of hypersplenism in patients with cirrhosis and PHT, was assessed in comparison with those who did not develop hypersplenism, and comparison between different grades of hypersplenism was also done, as regards to Child-Pugh score, MELD score, presence of HCC, PVT, ascites, portosystemic collaterals, portal haemodynamic and other clinical data.
Bone Marrow Examination
Due to risks and other limitations to perform bone marrow examination for all the patients recruited in the study, and refusal of other patients, and still no solid guidelines to change the management plans. Only 63 patients with hypersplenism associated with cirrhosis and PHT, were subjected to bone marrow aspirate by a single experienced clinical pathology staff member, as a representative sample.
Assessment of Portal Hemodynamic
A total of 100 patients out of the enrolled patients were subjected to Duplex Doppler ultrasonography. The PV diameter was measured, and the portal flow velocity (PVV) in centimetres per second (cm/s) was measured. During the measurement of velocity, the angle between the Doppler beam and the long axis of vessel should be less than 60o for accuracy. Other measures obtained included portal vein distance, TAMV (time-averaged mean velocity), area, and hepatic arterial resistive index.
Statistical Analysis
Data were verified, coded by the researcher, and analysed using IBM-SPSS 24.0 (IBM-SPSS Inc., Chicago, IL, USA). Descriptive statistics: Means, standard deviations, medians, ranges, frequency, and percentages were calculated. Test of significances: Chi square test was used to compare the difference in distribution of frequencies among different groups. Test of normality, Shapiro-Wilk/ Kolmogorov Smirnoff was used to test the normality of continuous variables. For continuous variables independent sample t-test was calculated to test the mean differences between groups. Multivariable logistic regression analysis was calculated to investigate the independent significant predictors of hypersplenism (Odds Ratio -OR-, 95% confidence interval -95% CI-). Spearman Rank Correlation Analysis was used to test the association between variables. To compare the difference in CHILD and MELD scores in different flow grade and pattern, one-way ANOVA test was used to compare the mean difference; post-hoc test was calculated using Bonferroni corrections for pairwise comparisons. A p-value < 0.05 was considered significant.
Results
Our study included 303 patients who fulfilled the inclusion criteria. Out of those patients, seven patients were excluded as following; 2 patients had cholangiocarcinoma, 2 patients had lymphoma, 1 patient had gall bladder carcinoma, 1 patient had hypocellular bone marrow results and another patient had bone marrow biopsy result of hypoplasia suggestive of lymphoproliferative disorder. So, a total of 296 patients were included in the study results, and 182 patients were found to have hypersplenism (Figure 1).
Figure 1
Baseline Data and Clinical Evaluation Based on Development of Hypersplenism (Table 1)
Mean age of those patients with hypersplenism was significantly lower in comparison to those without hypersplenism (56.37 ±1 vs. 60.43 ± 9.4 (years); p= 0.004). Also, patients with hypersplenism had significantly lower frequency of smoking (9.9% vs. 19.3%; p= 0.021).
Table 1: Baseline characteristics and clinical data based on development of hypersplenism.
Note: Data expressed as frequency (percentage), mean (SD). P value was significant if< 0.05.
Pattern of Cytopenia (Table 2)
Mono-cytopenia was found in 56 patients, bi-cytopenia in 52 patients, while pan-cytopenia was observed in 74. Anemia was present in 174 patients but excluded alone as a single parameter for hypersplenism as explained before. Leucopenia was present in 120 patients, and thrombocytopenia in 163 patients.
Table 2: Pattern of cytopenia.
Ultrasound Findings Among the Studied Patients Based on Development of Hypersplenism (Table 3)
Patients with hypersplenism had significantly higher splenic diameter (160.25 ± 27.1 vs. 148.94 ± 18.3 (mm); p< 0.001), portal vein diameter (19.03 ± 13.2 vs. 17.89 ± 16.6 (mm); p= 0.015) and more frequent portosystemic collaterals (23.6% vs. 11.4%; p= 0.009), portal vein thrombosis (11.5% vs. 6.2%; p= 0.043) and HCC (18.6% vs. 10.6%; p= 0.030).
Table 3: Ultrasound findings in studied patients based on development of hypersplenism.
Note: *Percentage here was calculated based on those with HCC PV: portal vein; HCC: hepatocellular carcinoma; BCLC: Barcelona Clinic of Liver Cancer Data expressed as frequency (percentage), mean (SD). P value was significant if< 0.05.
Portal Hemodynamics Based on Development of Hypersplenism (Table 4)
Patients with hypersplenism had significantly lower portal vein velocity (PVV) (17.55 ± 7.8 vs. 20.38 ± 5.5 (ml/sec); p= 0.026) and time averaged mean velocity (TAMV) (6.53 ± 2.8 vs. 7.80 ± 3.1 (ml/sec); p= 0.033).
Table 4: Portal hemodynamics based on development of hypersplenism.
Note: TAMV: time averaged mean velocity; RI: resistive index Data expressed as median (range), mean (SD). P value was significant if< 0.05.
Disease Severity Based on Development of Hypersplenism (Table 5)
Patients with hypersplenism had significantly higher Child score (8.32 ± 1.8 vs. 6.91 ± 1.8; p< 0.001) and MELD score (14.29 ± 4.9 vs. 11.82 ± 4.6; p< 0.001) in comparison to those without hypersplenism. Also, patients with hypersplenism had more advanced Child class.
Table 5: Disease severity based on development of hypersplenism.
Note: MELD: model for end stage liver disease Data expressed as frequency (percentage), median (range), mean (SD). P value was significant if < 0.05.
Predictors of Hypersplenism (Table 6)
Predictors of hypersplenism among patients with liver cirrhosis and PHT were as follows; ascites, hematemesis and or melena, portal vein diameter, splenic size, portal vein velocity, and presence of portosystemic collaterals. The best variables that could predict presence of hypersplenism was ascites, with adjusted odds ratio (95% confidence interval) = 3.790 (p =0.001).
Table 6: Predictors of hypersplenism based on the current study.
Note: P value was significant if< 0.05. CI: confidence interval
Characteristics of Patients with Hypersplenism Based on its Severity (Table 7)
Patients with hypersplenism were categorized into two groups based on the severity of hypersplenism. A total of 102 patients were categorized as mild, and 80 patients with moderate and severe hypersplenism were categorized into the 2nd group. Both groups had insignificant differences as regard different characteristics (p> 0.05) with exception of significantly higher frequency of varices among those with moderate/severe hypersplenism (87.5% vs. 76.5%; p= 0.039).
Table 7: Characteristics of patients with hypersplenism based on severity.
Note: Data expressed as frequency (percentage), median (range), mean (SD). P value was significant if < 0.05.
Discussion
Secondary to drawbacks of hypersplenism and cytopenia’s and fair high prevalence of liver cirrhosis in Egypt where estimated percentage of Egyptians manifested by any liver diseases in the age group from 1 to 59 years old was 2.9% [10], in addition to paucity of studies that discussed such issue and its implications in patients with liver cirrhosis, we conducted this work to assess the prevalence and pattern of hypersplenism and grade the severity of cytopenia’s in patients with cirrhosis and portal hypertension. In this work a total of 296 patients with liver cirrhosis and PHT were included in the study analysis; out of those patients 182 (61.5%) patients had hypersplenism. This percentage of hypersplenism is relatively high and yet was comparable with many previous studies that reported frequency of hypersplenism among cirrhotic patients ranging between 2% and 80.5% [11-20]. Some of the variation is attributable to different criteria for leukopenia and thrombocytopenia, different criteria used to define hypersplenism, and different study populations. In addition, many studies included active alcoholics in whom alcohol effects on bone marrow production may have been implicated. Also, these variations may be secondary to enrolled different etiologist of liver cirrhosis. Another explanation of wide variations in frequency of hypersplenism among cirrhotic patients may be attributed to the severity of liver disease among the studied patients where Ashraf et al. considered up to 68% of their studied patients had hypersplenism secondary to late stage of liver disease in those patients [18].
In the current study, we found patients with hypersplenism had significantly lower mean age (56.37 ± 13.1 vs. 60.43 ± 9.4 (years); p= 0.004) in comparison to those without hypersplenism, which contrasted with that reported by other studies [21]. This can be explained by the high prevalence of HCV in younger age groups in our locality, and that our study did not include patients more than 70 years old, which was not a condition in other studies. Also, those patients without hypersplenism had significantly higher frequency of smoking (19.3% vs. 9.9%; p= 0.021). As regards to the clinical history, we found that patients with hypersplenism had higher frequency of haematemesis and or melena (59.8% vs. 31.6%; p< 0.001), encephalopathy (36.8% vs. 18.4%; p= 0.04), ascites (48.3% vs 23.7%; p= 0.02), and those with suspected SBP (9.9% vs. 4.4%; p= 0.021). So, based on these findings, we could assume that patients with hypersplenism are at higher risk to develop different complication of liver cirrhosis as bleeding varices, encephalopathy. ascites and SBP. This was consistent with the study of Liangpunsakul et al. that revealed that hypersplenism is an independent predictor of variceal bleeding, SBP, and death. If these findings are confirmed, severe hypersplenism may constitute an indication for instituting prophylactic measures against variceal bleeding and bacterial infections in patients with cirrhosis and PHT [9].
Also, many previous studies have shown that thrombocytopenia is an independent risk factor for developing large esophageal varices, together with the relationship we noted between hypersplenism and variceal bleeding, as clinical presentation, is possibly reflective of that association [9,22-24]. One of the important findings in the current study, that during ultrasound evaluation of enrolled patients is that patients with hypersplenism had significantly higher splenic diameter (160.25 ± 27.1 vs. 148.94 ± 18.3 (mm); p< 0.001) in comparison to those without hypersplenism. Moreover, the frequency of PVT, HCC and degree of ascites by ultrasound was significantly higher among those with hypersplenism. In agreement with these findings, Berzigotti et al. demonstrated a significant inverse correlation between the size of the spleen and the platelets count in patients with liver cirrhosis. They noted also that spleen enlarges over time in cirrhotic patients, and, they also observed that a spleen enlargement on ultrasound follow-up is associated with the appearance and growth of oesophageal varices, and with the occurrence of a first decompensation of cirrhosis in patients with compensated disease [25]. To our knowledge, the current study is considered the first study to discuss portal hemodynamic among patients with hypersplenism. Patients with hypersplenism had significantly lower portal vein velocity (17.55 ± 7.8 vs. 20.38 ± 5.5 (ml/sec); p= 0.026) and time averaged mean velocity (TAMV) (6.53 ± 2.8 vs. 7.80 ± 3.1 (ml/sec); p= 0.033) in comparison to those without hypersplenism. This point could be explained by increase in hepatic vascular resistance to portal blood flow, which underlies the development of PHT in cirrhosis.
Hepatic vascular resistance occurs partly because of architectural changes, fibrosis, vascular occlusion and capillarization of sinusoids, with affection portal vein velocity. This process increased with advancing of the liver diseases and hence, this may be correlated with hypersplenism [26,27]. Our study found that patients with hypersplenism had higher frequency of HCC. In line with the current study, Orlando et al., concluded that splenomegaly and hypersplenism seems to be an important prognostic factor in patients with liver cirrhosis, which represents a risk factor for PHT and even HCC [1]. In the current work we found significant association between liver disease severity and hypersplenism where patients with hypersplenism had significantly higher Child score (8.32 ± 1.8 vs. 6.91 ± 1.8; p< 0.001) and MELD score (14.29 ± 4.9 vs. 11.82 ± 4.6; p< 0.001) in comparison to those without hypersplenism. Also, patients with hypersplenism had more advanced Child class. Previous studies recorded the same findings [9]. Also, as pointed before, many studied showed that progressive decrease in platelet count is considered as a noninvasive indicator for the development of PHT due to severe liver fibrosis or cirrhosis. Overall, the degree of thrombocytopenia appears to be proportionally related to the severity of liver disease but is not associated with spontaneous bleeding, unless platelets count decrease to <50,000–60,000/μL [28-32]. Based on the current study, predictors of hypersplenism among patients with liver cirrhosis and PHT were in descending order of frequency as follows; ascites, hematemesis and or melena, portal vein diameter, splenic size, portal vein velocity, and presence of portosystemic collaterals. The best variables that could predict presence of hypersplenism was ascites, with highest odd’s ration that was 3.790. Although there is no previous study that searched about different predictors of hypersplenism among patients with liver cirrhosis and PHT, but a previous study revealed that decompensated liver disease [odds ratio (OR), 2.0; 95% confidence interval (CI), 1.1–3.7] and a history of alcohol consumption (OR 2.3; 95% CI, 1.4–3.8) were independent predictors of severe hypersplenism.
In our study, we categorized patients based on severity of hypersplenism into either mild and moderate/severe hypersplenism, and both groups had insignificant differences as regard different characteristics (p> 0.05) with exception of significantly higher frequency of varices among those with moderate/severe hypersplenism (87.5% vs. 76.5%; p= 0.039). Also, the grade of varices was more advanced among those with moderate/severe hypersplenism. Based on these findings, we could assume that frequency of hypersplenism, whatever its severity, increases with more advanced liver disease, and specifically more with higher portal pressure. The current study acknowledges some limitations. These included: bone marrow samples could not be taken for all patients for final confirmation of hypersplenism, due to limitations and hazards associated with bone marrow samples in advanced cirrhotic patients, and still there will be no change of management plans according to current guidelines, yet 61 patients (nearly one third of the patients with hypersplenism), had the final confirmation by bone marrow sampling. Still many studies did not count on bone marrow samples for final confirmation. We could not do long term follow up of those patients to assess effect of hypersplenism on survival analysis of those patients. Also, we didn’t offer any therapeutic trials to those patients especially those with severe hypersplenism such as selective splenectomy, microwave and/or splenic angioembolization but none of these methods are well studied. Another limitation of the current study was being conducted in single center, and yet this study had many points of strength; being the first study discussing hypersplenism in liver cirrhosis in our locality, and predictors of hypersplenism, grading hypersplenism by scoring system, and relatively high sample size.
Conclusion
Hypersplenism is common in cirrhotic patients with PHT. Ascites, hematemesis and or melena, PV diameter, splenic diameter, PVV, and portosystemic collateral may predict the development of hypersplenism. Also, doppler US may be used as a non-invasive marker for PHT and hypersplenism. Decreased PVV is associated with the development of hypersplenism and more advanced liver disease, and lower values can predict the development of varices. Further studies are needed to elucidate the relationship between hypersplenism and HCC, and the role of hypersplenism in the development of HCC.
Identifying Bioactive Components of stragalus Radix and Their Vital Protein Targets for Treatment of Allergic Rhinitis Through Network Pharmacology and Molecular Docking
Introduction
Allergic rhinitis, commonly referred to as seasonal allergies or hay fever, is a widespread immune system disorder. This condition, characterized by an overactive immune response to external particles, affects approximately 80 million individuals annually in the United States alone (Ng, et al. [1,2]). Allergic rhinitis specifically denotes nasal inflammation triggered by allergens like pollen, hay, mold spores, or dust. While bacteria are not a primary cause, they can contribute to allergic rhinitis through infections in congested nasal passages. The immune response involves dendritic cells capturing and processing allergens, activating T cells, which then prompts B cells to produce IgE antibodies attaching to the FCε receptor. The subsequent binding of allergens to IgE causes the crosslinking of IgE-FCε complexes, releasing histamines, leukotrienes, and other inflammatory mediators through degranulation (Bernstein, et al. [3,4]). The uncontrolled release of inflammatory cytokines, interleukins, interferons, and chemokines causes allergic reactions, leading to sneezing, runny nose, itching, watery eyes, and swelling (Kay [5]). Pathways like Toll-like receptor signaling, FCε-RI signaling, histamine metabolism and degradation, and arachidonic acid metabolism play crucial roles in allergic rhinitis development (Ahmad, et al. [6-9]). The current treatment options for allergic rhinitis include anti-allergic medications such as antihistamines (levocetirizine), intranasal corticosteroids (fluticasone), decongestants (pseudoephedrine), bronchodilators (ipratropium), anti-inflammatory agents or mast-cells stabilizers (cromolyn), which are used to prevent or reduce allergic reactions (Bernstein, et al. [3,10]).
In cases where the reaction worsens, artificial epinephrine shots are administered. These medications work by dilating the constricted nasal passages, actively inhibiting the production of inflammatory signaling molecules, or blocking the receptors to initiate the inflammatory cascade. However, most of these medications are synthetic and often lead to side effects, such as drowsiness, dizziness, headache, rapid heart rate, muscle weakness, etc. Long-term use of these medications may also negatively impact the immune system (Bender [11]). Consequently, plant-based supplements are gaining popularity as a safer alternative. Astragalus radix (AR), or Huang Qi, is derived from the dried roots of the Astragalus membranaceus tree and is extensively used in traditional Chinese medicine (TCM) due to its potent immunomodulatory effects, either alone or in combination with other herbs (Fu, et al. [12]). AR is a key ingredient of many TCM formulas, such as Yu Ping Feng decoction (Zuo, et al. [13]), Huangqi Sijunzi decoction (Zhang, et al. [14]), Huang Qi Jian Zhong Tang (Nöst, et al. [15]), etc., and is known for enhancing bodily resistance to allergens and boosting vitality. It is widely recognized as a valuable herbal medicine that increases energy levels and effectively balances the immune system (Z Chen, et al. [16]). The immunomodulatory and anti-inflammatory properties of AR were reported to regulate nitric oxide, cytokines, and interleukins (Choi, et al. [17,18]). Other studies also showed that AR promotes wound healing and has hepatoprotection, antioxidant, anti- hyperglycemic, and anti-viral properties (Fu et, al. [12,19]). The use of AR for weakness, anemia, fever, fatigue, and loss of appetite was also reported (Yu, et al. [19]).
Despite its wide application, the specific components of AR responsible for its therapeutic effects remain under-researched. According to the TCM database, AR contains nearly 90 components, primarily flavonoids, saponins, and polysaccharides. Some of these components exhibit pharmacological activity and therapeutic efficacy by interacting with various disease genes in biological processes and pathways (Fu, et al. [12]). Network pharmacology offers a comprehensive approach to uncovering these components by analyzing bioinformatics and cheminformatics data (Hopkins, et al. [20,21]). This method aids in identifying bioactive compounds in AR that could be potential therapeutic agents against allergic rhinitis. Additionally, molecular docking simulation, an in-silico validation method, helps understand the interactions (i.e., binding packets and energies) between these components and their protein targets (Agarwal, et al. [22,23]). The present study aims to identify the key bioactive components of AR and their pivotal protein targets for the treatment of allergic rhinitis and gain an understanding of AR’s molecular action mechanisms.
Materials and Methods
AR Component Acquisition
The components examined for AR were gathered and integrated from several databases, including Traditional Chinese Medicine Systems Pharmacology (TCMSP: https://old.tcmsp-e.com/index.php) (Ru, et al. [24]), Traditional Chinese Medicine Information database (TCM-ID: http://bidd.group/TCMID/index.html) (X Chen, et al. [25]), and The Encyclopedia of Traditional Chinese Medicine (ETCM: http://www.tcmip.cn/ETCM/) (HY Xu, et al. [26]). These databases provide comprehensive information on the physicochemical properties and drug-likeness of the herb’s components, such as molecular weight, A (log p), oral bioavailability (OB), drug-likeness (DL), H-donor, H-acceptor, and blood-brain barrier values. The selection criteria for screening the AR candidate components in this study were based on OB and DL, as the primary route of administration for AR is via oral ingestion.
Protein Target Acquisition
Protein targets for both AR components and allergic rhinitis were obtained through web servers. Specifically, protein targets for screened AR components were acquired using Similarity Ensemble Approach (SEA: https://sea.bkslab.org/) (Keiser, et al. [27,28]), Swiss Target Prediction (STP: http://www.swisstargetprediction.ch/) (Daina, et al. [29]), Super Pred (SP: https://prediction.charite.de/) (Nickel, et al. [30]), Herb Ingredients Targets platform (HIT 2.0: http://hit2.badd-cao.net/) (Yan, et al. [31]), Therapeutic Targets Database (TTD: https://db.idrblab.net/ttd/) (Zhou, et al. [32]), Drug Central Database (DCdb: https://drugcentral.org/) (Ursu, et al. [33]), Drug-Gene Interaction Database (DGIdb: https://www.dgidb.org/) (Freshour, et al. [34]), and BindingDB (https://www.bindingdb.org/) (Gilson, et al. [35]) databases. These databases were queried using component names or their canonical smiles obtained from PubChem (https://pubchem.ncbi.nlm.nih.gov/) (Kim [36]). The screening criteria used for each database were as follows: SEA – Tanimoto coefficient (TC) > 0.5, STP – top 15 protein targets, SP – all known protein targets and > 90% of predicted protein targets, HIT 2.0 – direct & indirect up/down-regulated, TTD – all evidence-based, DCdb – Activity value (-log[M]) > 4.0, DGIdb – interaction score > 0.5, and BindingDB – similarity > 0.85 protein targets. For acquiring allergic rhinitis-related protein targets, two web servers were used: GeneCards (https://www.genecards.org/) (Stelzer G, et al. [37]) and DisGeNET (https://www.disgenet.org/) (Piñero, et al. [38]).
The screening criteria of protein targets for GeneCards were protein-coding genes and a relevance score > 4.0, while for DisGeNET, it was GDA (gene-disease association) score > 0.1. The search keywords used for the allergic rhinitis-related protein target’s acquisition were “seasonal allergy,” “hay fever,” and “allergic rhinitis.” All protein targets were cross-verified using UniProt ID to confirm the correctness of Gene ID, and only human-related protein targets were used for this study. A shared target strategy was employed to establish a relationship between protein targets of AR components and allergic rhinitis. Shared targets were identified using Venny 2.1, available at https://bioinfogp.cnb.csic.es/tools/venny/ (Oliveros Juan Carlos [39]).
Protein-Protein-Interaction (PPI) Network
The shared protein targets were analyzed using the STRING plugin in Cytoscape (Shannon, et al. [40]), a bioinformatics software tool widely used for visualizing network interactions. This facilitated exploring protein target’s interaction via the PPI network using a high confidence score of > 0.7. The interconnected protein targets in the PPI network were considered putative protein targets and subjected to further analysis, while the non-connected protein targets were eliminated.
Acquisition, Enrichment, and Identification of Relevant Functions
In this study, GO (Gene Ontology) (Carbon, et al. [41]) immune system biological processes and KEGG (Kyoto Encyclopedia of Genes and Genomes) pathways were annotated as ‘Functions.’ The modulation of various functions influences the allergic rhinitis condition. The functions related to the screened putative protein targets were extracted using the ClueGO plugin in Cytoscape (Bindea, et al. [42]). The functions were enriched based on a p-value threshold of < 0.05, and only the relevant functions for allergic rhinitis were screened.
Target-Target-Interaction (TTI) Network and Module Generation
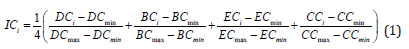
A TTI network was constructed to analyze the interconnections among protein targets through various functions. A correlation file for protein targets and their associated functions was generated using Edges 2.0 (E Thorpe, et al. [43,44]). The file was subsequently uploaded to Gephi (Bastian, et al. [45]) to construct an undirected network and identify modules using the Louvain algorithm (resolution 1.0). These modules represent clusters of protein targets linked closely through stronger interrelations (various functions). Calculation of integrated centrality (IC) score and identification of important protein targets. The importance of a protein target was calculated using the integrated centrality equation (X Li, et al. [46]) (Equation 1)
where IC is the integrated centrality score for the protein target (i), and DC, BC, EC, and CC are the degree, betweenness, eigenvector, and closeness centralities, respectively. The max and min represent each centrality’s maximum and minimum values within the module. The IC score is a numerical value obtained using the IC equation ranging from 0.00 to 1.00, where 0.00 is the least important and 1.00 is the most important protein target in the module based on the topological perspective.
Molecular Docking Simulations
In-silico validation was performed using molecular docking simulations to elucidate the candidate compound’s binding affinity (kcal/mol) towards the protein target. The protein targets with the highest IC score within each module were selected for docking simulation with their respective AR candidate components. The three-dimensional structures of the protein targets and AR candidate components were prepared for docking analysis using PyMOL (https://pymol.org/2/) (Schrödinger LLC, 2015), Open Babel GUI (https://openbabel.org/) (O’Boyle, et al. [47]), and AutoDock 4.2 (https://autodock.scripps.edu/download-autodock4/) (Morris et al. [48]). Once the protein targets and AR components were prepared, they were subjected to docking analysis using AutoDock Vina (Trott, et al. [49]). The protein targets were set as receptors, while the components were ligands. Additionally, docking simulations were performed using reported inhibitory compounds/antagonists of these protein targets to compare and evaluate the efficacy of the AR components based on the binding affinities.
Results
The Workflow
All the components of AR were initially acquired, assessed, and screened for their OB and DL properties. Subsequently, protein targets for the screened AR components and allergic rhinitis were obtained and evaluated. The shared protein targets in AR components and allergic rhinitis were used to construct a PPI network. The PPI network was pruned only to identify the connected protein targets to obtain functions (biological processes and pathways). Functions were enriched based on significance levels (p-value < 0.05) and screened for relevance to immune system diseases, specifically allergic rhinitis. The relevant functions and protein targets were used to construct a TTI network. The TTI network was analyzed to identify pivotal protein targets based on modularity analysis and integrated centrality score using the Louvain algorithm and integrated centrality equation, respectively. The pivotal protein targets and their corresponding AR candidate components were selected using molecular docking simulations to determine the binding affinities. The AR candidate components having the lowest binding affinities towards their respective pivotal protein targets were identified as key bioactive AR components.
Data Acquisition and Screening
Eighty-seven components of AR were acquired through a database search using three web databases (TCMSP, TCM-ID, and ETCM). These components were screened using a threshold of OB > 10% and DL > 0.10, resulting in 40 AR candidate components (Table 1). Using the names and canonical smiles obtained from PubChem for these candidate components, 558 non-repeating protein targets were retrieved from the databases, as mentioned previously. Additionally, a search for allergic rhinitis-related protein targets using different synonyms identified 228 non-repeating protein targets from GeneCards and DisGeNET post- screening. Using a Venn diagram, a shared protein target strategy was implemented to identify protein targets common to both AR candidate components and allergic rhinitis, resulting in 44 protein targets. Table 2 presents these shared protein targets along with their UniProt IDs.
Table 1: Forty AR candidate components obtained by screening based on OB and DL.
Table 2: Shared protein targets between AR candidate components and allergic rhinitis.
PPI Network Construction
The 44 shared protein targets’ PPI network was constructed using the STRING plugin in Cytoscape, forming a network consisting of 249 edges connecting 42 protein targets with an average clustering coefficient of 0.745. However, 2 of the 44 shared protein targets were removed due to the unavailability of their connections with the rest of the network as the set criteria for minimum interactions of a protein target was greater than or equal to 2. The connected 42 putative protein targets were chosen for functional acquisition and enrichment. Figure 1a displays the PPI network of the 42 shared protein targets, with nodes (protein targets) and their edges (interactions via functions).
Figure 1
Enrichment and Identification of Relevant Functions
Functional acquisition of the 42 putative protein targets was performed using Cytoscape, retrieving 140 functions (77 GO biological processes and 63 KEGG pathways). These functions were then enriched based on their significance score (p-value < 0.05) and relevance to allergic rhinitis, resulting in the identification of 42 functions (21 GO biological processes and 21 KEGG pathways). Figure 1b displays the functions and associated genes per term as a percentage. Once the relevant functions were identified, only the protein targets related to the 42 relevant functions were selected for further studies, referred to as candidate protein targets, 32 in this study.
TTI Network Construction and Analysis for Modularity and Important Protein Target Identification
The data set comprising 32 candidate protein targets and 42 functions was used to construct an undirected TTI network. The constructed network consisted of 32 nodes and 319 edges. Four modules were generated using the Louvain algorithm, namely, Module 1 (green color) with 8, Module 2 (purple color) with 9, Module 3 (orange color) with 8, and Module 4 (blue color) with 7 candidate protein targets, as shown in Figure 2. The present study employed IC analysis to identify important protein targets (See Section 2.6). A higher IC score indicates that a protein target has a greater number of connections with other protein targets in the same module via various functions. Candidate protein targets having the maximum IC score (high importance) in each module were selected as pivotal protein targets. ALOX5 (Lipoxygenase-5), IL2 (Interleukin-2), TNFα (Tumor necrosis factor-α), and TLR4 (Toll-like receptor 4) had the highest IC score in modules 1, 2, 3, and 4, respectively. The modules and their corresponding IC scores are listed in Table 3.
Figure 2
Table 3: Module class and Integrated centrality (IC) score of protein targets.
Molecular Docking Simulations
Molecular docking simulations were performed on the pivotal protein targets and their related AR candidate components, as shown in Figure 3. The binding affinities obtained for each protein-ligand complex are mentioned in Table 4. Based on the docking results, the AR candidate components showing the best binding affinities towards ALOX5, IL2, TNFα, and TLR4 were kaempferol (-9.3 kcal/mol), daidzein (-7.9 kcal/mol), calycosin 7-O-glucoside (-6.8 kcal/mol), and astragaloside III (-10.8 kcal/mol), respectively and were selected as the key bioactive AR components. It exhibits that these key bioactive AR components can be used to regulate the pivotal protein targets, as they showed excellent binding scores, with values less than -5.0 kcal/mol (B Li, et al. [50,51]); Additionally, the binding affinities of these key bioactive AR components were compared with the reported inhibitory compounds/antagonists for each protein target (Figure 4). It was observed that the key bioactive AR components had much lower (better) binding affinities than the reported inhibitory compounds/antagonists for TNFα, IL2, ALOX5, and TLR4. Furthermore, the binding pockets of the key bioactive AR components were the same as those reported for inhibitory compounds/antagonists, predicting the antagonist action of the key bioactive AR components.
Figure 3
Table 4: Binding affinities of the vital protein targets to the candidate components of A. radix and their reported inhibitory compounds/antagonists.
Figure 4
Discussion
This study embarked on a quest to delineate the bioactive components of AR and their significant protein targets, offering therapeutic potential against allergic rhinitis. Utilizing network pharmacology, we intricately mapped the interplay between these components and protein targets, employing the scientific findings of chemometrics and bioinformatics. A pivotal aspect of our methodology was constructing the TTI network, which revealed the intricate web of connections between proteins across various biological processes and pathways. A core challenge in network pharmacology is pinpointing the most influential protein targets within a vast network. Our study addresses this through modularity analysis and integrated centrality scoring. We identified modules – the subnetworks of interlinked protein targets – and ranked the protein targets in each module using integrated centrality scores. This dual strategy facilitated the discernment of protein targets, wielding an understanding of the molecular action mechanism of the bioactive components of AR, a task often convoluted in complex biological networks. Molecular docking emerged as a crucial tool, enabling us to scrutinize the interactions between AR components and protein targets. This approach was instrumental in revealing potential inhibitory or activating binding sites and energies, thereby guiding therapeutics’ development. Our research spotlighted four pivotal protein targets: ALOX5, IL2, TNFα, and TLR4. These proteins play a distinctive role in immune response and allergic pathophysiology.
For instance, when activated inappropriately, TNFα, is integral to immune system balance and can exacerbate allergic rhinitis via the NFκB pathway (Ahmad, et al. [6,52]). Similarly, TLR4’s role in initiating inflammatory responses (Radman, et al. [53,54]) and ALOX5’s involvement in leukotriene biosynthesis (Çobanoğlu, et al. 55,56) underscore their relevance in allergic reactions. This study uniquely considered the collective impact of these targets, a perspective often overlooked in existing literature. Beyond confirming known pathways implicated in allergic rhinitis, our research ventured into previously unexplored territories. We unearthed additional pathways and biological processes influenced by AR, such as the PI3K-AKT and MAPK signaling pathways, thereby broadening our understanding of allergic rhinitis pathogenesis. In-silico validation pinpointed four AR components – calycosin-7-O-glucoside, kaempferol, daidzein, and astragaloside III – as potential therapeutic agents. These compounds, notably flavonoids and triterpenoid saponins, exhibited promising binding scores and specific biological activities against allergic inflammation (Jia, et al. [57-62]). This raises an intriguing question about their collective versus individual efficacy in modulating allergic responses. The findings of this study underscore the therapeutic promise of AR’s key bioactive components in modulating pivotal protein targets and pathways in allergic rhinitis. However, these preliminary insights beckon further investigation to fully elucidate their clinical potential and the intricacies of AR’s multi-component synergy. Future studies should focus on validating these results and exploring their practical applications in allergy treatment.
Conclusion
This research leveraged the power of network pharmacology to unravel the molecular mechanism of Astragalus radix for the treatment of allergic rhinitis. At its core, this study identified a suite of bioactive components in AR and their specific disease protein targets, shedding light on their therapeutic potential. These findings were bolstered by in-silico validation through molecular docking simulations, corroborated by scientific literature. This research marked a noteworthy leap in connecting traditional herbal medicine knowledge with the understanding of disease genes, filling a crucial gap in mechanism-focused studies. Our method simplifies the traditionally demanding process of pinpointing and testing protein targets and active ingredients. This study provides verifiable mechanisms and paves the way for more effective clinical trials targeting AR’s active components for allergic rhinitis treatment.
Acknowledgment
The authors thank the Department of Chemistry at Cleveland State University.
Conflict of Interest
The authors declare that they have no conflict of interest.
Availability of Data and Materials
The datasets used during the current study are available from the corresponding author upon reasonable request.
Authors’ Contributions
ASP performed data acquisition, network pharmacology, data analysis, and molecular docking and drafted the manuscript. YX designed and supervised the study and made necessary revisions to finalize the manuscript. All authors have read and agreed to the published version of the manuscript.
FTIR Study of Aqueous Solutions of α -Amylase: Evidence of C-O-H Bond Formation at High Temperatures
Introduction
α-Amylase is an enzyme that hydrolyses α-linked polysaccharides, such as starch and glycogen, yielding shorter chain sugar molecules like glucose, dextrins, and maltose [1]. This protein is present in saliva and pancreatic secretions and is responsible for the digestion of starch. Because of its medical and industrial applications, researchers around the world have studied this enzyme extensively. It contains at least 1 mol of Ca2+ ion [2-5] per mole of protein. The strength of the binding of calcium ions to the protein varies significantly from one enzyme source to another. Irrespective of the source, α-amylase causes a rapid fragmentation of starch molecules into sugars [6-8] and undergoes inactivation reaction initiated by an initial dissociation of Ca2+ ions followed by denaturation by heat [9-11]. The theory of inactivation of α-amylase was developed by our group some 30 years ago and we confirmed the validity of its predictions by quite a few experiments in aqueous [9,10] as well as non-aqueous solutions [11]. The earlier UV-Vis studies primarily focused on irreversible inactivation step of the protein and examined the effects of heat, solvent type, and salt concentrations on the inactivation [9-11] reaction. In each case the two-step inactivation model is shown to be valid suggesting that this metallo-enzyme inactivates by first dissociation of the metal ion followed by denaturation of the apoenzyme (enzyme without the metal ion attached). Although the above UV-Vis studies allowed us to establish the two-step inactivation mechanism of this protein, new studies were required to understand what happens to the enzyme at the molecular level when the temperature is increased. With these questions in mind, we decided to carry out FTIR (Fourier Transform Infra-red) studies on this protein at different temperatures. Before we discuss these FTIR results, we plan to discuss the theory of inactivation that we developed earlier [9-11] followed by experimental section and the sections on results with discussions.
Theory of Inactivation of α-Amylase
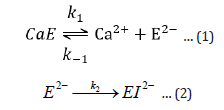
The first reversible stage (eq 1) involves a forward reaction that forms an inactive apoenzyme, E2-, from the active enzyme, CaE, with a rate constant of k1 and a reverse reactivation reaction involving the combination of E2- with calcium ions with a rate constant of k-1. The second irreversible stage (eq 2) of reaction forms a denatured form of the enzyme, EI2-, from E2- with a rate constant of k2. The reversibly inactivated form, E2-, can be quickly transformed into the active form, CaE, by adding calcium ions. On the other hand, the EI2- is the denatured form of the enzyme that cannot be reactivated by adding calcium ions.
Based on inactivation steps 1 and 2, the following equations are derived:
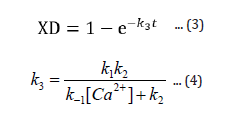
The expression XD (eqn 3) gives the fraction of enzyme inactivated at a time, t, after the inactivation process begins, and k3, given by equation 4, is a function of calcium ion concentration and temperature. From the expression 3 one can readily obtain the value of percent active enzyme as follows:
A more detailed derivation of equation 3 (and hence, eqn. 5) as well as various test results can be found in references [9,10].
Materials and Methods
Solution Preparation
The pure amylase solution of 6.540 x 10³ mg/L concentration was prepared by dissolving solid (50,000 BAU/g) in pure water at 20°C. The other solutions were prepared at 50 and 90° C. The amylase from bacillus species was purchased from Sigma Aldrich Chemical Co.
Heating Details
Heating was done on a lab hot plate. The amylase solutions at 50 and 90 °C were prepared by heating solutions to the desired temperatures followed by their cooling to 20 °C before taking the spectral readings. Interestingly, in the process of achieving the highest possible temperature we noticed that the protein solution started boiling at around 90 °C. This is significantly lower temperature than the boiling temperature of water and may be due to structural changes in protein resulting in increased water vapor pressure and hence, lowering of its boiling temperature.
FTIR Spectra of Solutions
Initially spectrum of air background was taken followed by those of pure distilled water and amylase solutions at 20, 50 and 90 °C (cooled to 20 °C) by using Thermo Scientific Nicolet iS5 FT-IR spectrometer.
Results and Discussions
Figure 1 represents spectra of α-amylase solutions at 20 (black spectrum), 50 (red) and 90 °C (green). We labeled 5 major peaks/ peak bunches with numbers 1-5. Most of the spectral features like those around 2, 3 and 5 remain unchanged when the temperature is increased from 20 to 90 °C. However, peaks around 1 (around 1033 cm-1) and 4 (around 3000 cm-1) show significant changes with temperature, especially at 90 °C (green spectrum) with a sharp rise in peak intensity at 1033 cm-1. We assign peaks around 3 (around 2350 cm-1) and peak bunches around 2 and 5 primarily to water molecules present in the protein solution. We confirm this assignment by examining the FTIR spectrum of water published at NIST site (National Institute of Science and Technology) and is presented in Figure 2. In Figure 2 the water spectrum is in transmittance units. The corresponding absorbance spectrum can be obtained by simple inversion of the transmittance spectrum. As can be seen, in the water spectrum, there are two major peak bunches from 1500-1800 cm-1 (this is also present around 2 of our Figure 1 spectrum), 3500-4000 cm-1 (also present around 5 of our spectrum), and a small peak around 2300 cm-1 (present around 3). As mentioned above, all these spectral features are present in our protein solution (Figure 1) and suggest features due to water. After subtracting the spectrum due to water, we obtain distinct peaks at 1033 cm-1 and 1636 cm-1 and present them in Figures 3 & 4 respectively. In both Figures 3 & 4 temperature effects on peak intensities are shown. In Figure 3, one can notice that there is no 1033 cm-1 peak at 20 °C (black spectrum). However, at 50 °C (red spectrum) the peak is quite visible that rises sharply in intensity at 90 °C (green spectrum) giving a peak height of around 4 times that of the 50 °C peak.
Figure 1
Figure 2
Figure 3
Figure 4
Figure 4 shows a distinct peak at 1636 cm-1 at every temperature from 20-90 °C and is due to carbonyl groups (C=O) in proteins. This assignment is consistent with those reported in references [12-14]. Indeed, helical and pleated sheet structures of protein as presented in Figure 5 show carbonyl groups that absorb at 1636 cm-1. In contrary to peak intensity at 1033 cm-1, the 1636 cm-1 peak intensity shows almost linearly increasing intensity with temperature. This gradual rise in peak intensity at 1636 cm-1 with temperature may be due to the heat effect that gradually exposes a larger number of carbonyl groups to IR radiation. We assign 1033 cm-1 peak to C-O single bonds and peak around 3000 cm-1 to O-H bonds. So, the peaks around 1033 and 3000 cm-1 suggest formation of new C-O-H bonds. A possible mechanism for the formation of C-O-H bonds in protein at a high temperature is presented in Figure 6.
Figure 5
Figure 6
Concluding Comments
α-Amylase inactivates in two stages; a reversible stage of the dissociation of metal ion followed by irreversible inactivation of apoenzyme resulting in the denaturation of the protein. The present FTIR study focusses on the denaturation stage and indicates structural changes that happen at higher temperatures. As the temperature is increased from 20 to 90 °C two new absorbance peaks at 1033 (C-O stretch) and 3000 cm-1 develop that we assign to C-O (single bond) and O-H bonds. These stretch frequencies can be explained by considering the formation of new C-O-H bonds within the protein at higher temperatures. As expected, these structural changes were irreversible as cooling to 20 °C did not change the spectral features.
Usefulness of Procalcitonin in the Suspension of Antibiotics
Introduction
Today there are different laboratory tests for the detection of infectious diseases, including PCR, but they lack the specificity to accurately diagnose bacterial versus non-bacterial infections [1,2]. Procalcitonin is a promising biomarker for the early detection of systemic bacterial infections. Procalcitonin is a 116 its diagnostic significance was not recognized until 1993 [3,4]. In 1993, Assicot, et al. demonstrated a positive correlation between high serum Procalcitonin levels and patients with positive results for bacterial infection and sepsis (e.g. positive blood cultures). It was also shown that these levels do not increase with viral infection, but decrease with antibiotic administration [5,6]. Under normal conditions of homeostasis, preprocalcitonin undergoes initial synthesis by thyroid C cells. Later, this peptide is transformed into procalcitonin through cleavage of a 25 amino acid signal sequence by endopeptidases. The final product, calcitonin, the 32 amino acid hormones responsible for the regulation of serum calcium, is formed after conversion by the enzyme prohormone convertase [7,8]. Infectious diseases remain a major cause of death, disability, and social and economic disruption for millions of people worldwide. Prevention and treatment strategies for infectious diseases are derived from a thorough understanding of the complex interactions between specific viral or bacterial pathogens and the human host [9,10].
Viruses bind to host cells as a prerequisite for intracellular entry and replication. Because cell surfaces are especially enriched with glycans, numerous viruses target glycans for attachment and entry into cells [8,11]. Children with infectious diseases, both bacterial and viral, are often treated with empirical antibiotics as the first line. Considering both the threat of microorganisms and the toxicity of antibiotics, it is imperative to develop tests at the point of primary care as well as at the in-hospital level to discriminate bacterial from viral infections and to define the indications for antibiotic treatment [7,10-12]. It is therefore appropriate to perform this work in order to identify the importance of procalcitonin as a discriminating agent of viral diseases from bacteria and thus the suspension or not of the antibiotic.
Materials and Methods
A systematic review was carried out, searching PubMed, Scielo and ScienceDirect databases, among others. The collection and selection of articles was carried out in English- language indexed journals from 2011 to 2022. As keywords, the following terms were used in the databases according to DeCS and MeSH methodology: Procalcitonin; infections; Sepsis; Bacteria; Viruses. In this review, 102 original and review publications related to the topic studied were identified, of which 32 articles met the specified inclusion requirements, such as articles that were not less than the year 2011, that were full-text articles and that reported on procalcitonin as a predictor of the interruption or not of antibiotic therapy. Exclusion criteria took into account that the articles did not have sufficient information and that they did not present the full text at the time of review.
Results
Procalcitonin as an Inflammatory Marker
Currently there are different types of inflammatory markers, among which we can highlight procalcitonin, which has become a new biomarker for the early detection of bacterial infections, especially systemic infections. Procalcitonin does not increase in viral infections, decreasing its values when appropriate antibiotic therapy is administered [13,14]. One of the markers or acute phase reactants most frequently sent to health centers is C- reactive protein, which has a disadvantage in that it lacks the specificity needed to accurately diagnose bacterial versus non-bacterial infections [15,16]. At blood level we can identify normal procalcitonin levels (values lower than 0.05 ng/mL), being elevated or influenced by endotoxins or cytokines such as interleukin 6 (IL-6), tumor necrosis factor (TNF)-alpha and IL-1b, increasing procalcitonin levels up to 100 to 1000 times their normal value amino acid residue that was first explained by Le Moullec, et al. in 1984; however, [17,18].
The main source of procalcitonin is found at the thyroid level, in thyroid C cells, but it can also be synthesized by extra-thyroid tissues [10,15,18]. In contrast, cytokines, such as interferon (INF)-gamma, which are released after viral infection, lead to a negative regulation of PCT, highlighting another advantage of PCT assays [19,20]. After an initial bacterial infection, procalcitonin levels have been shown to increase from 6 to 12 hours, and these values continue to rise steadily from 2 to 4 hours after the onset of sepsis. Twenty to 24 hours is the half-life that has been recorded so far. One of the ways to demonstrate the efficacy of antibiotics is to identify procalcitonin every so often, since if the antibiotic is effective these levels decrease by 50% every 24 hours [20,21]. It must be taken into account that not in all sepsis states it is advisable to identify the procalcitonin level if it is associated to a factor that may hinder its identification, among these factors we can identify the following: [22-24].
1. Trauma
2. Burns
3. Carcinomas (medullary C-cell, small cell lung and bronchial carcinoid)
4. Immunomodulatory therapy that increases pro-inflammatory cytokines
5. Cardiogenic shock
6. First 2 days of life of the newborn
7. During peritoneal dialysis treatment
8. In cirrhotic patients.
Procalcitonin as a Predictor of Antibiotic Initiation and Discontinuation
As previously stated, procalcitonin levels will decrease by 50% in 24 hours after the initiation of the antibiotic, thus demonstrating that, if the antibiotic is not effective in the patient, procalcitonin levels will not decrease to the value necessary to conclude that the antiboicot is effective in the patient. Therefore, this method or these values could be considered as physiological control of the systemic infection presented by the patient [14,20]. Most research has shown that PCT levels show clinical significance when they are in the range of 0.1 to 0.5 ng/mL. In addition, research has shown that PCT levels below 0.1 ng/mL have a high negative predictive value (96.3 %) for excluding bacterial infections [25]. Procalcitonin has several cut-off levels applicable in different conditions or diseases that could predict the course of the disease or the cause of the disease. Table 1 shows the main conditions that could be identified or ruled out by procalcitonin [13,20,22,26,27]. After identifying the condition, it is advisable to measure procalcitonin every 6 to 24 hours, in order to identify the need to change the antibiotic, increase the antibiotic dose, or discontinue the antibiotic implemented for the condition.
Table 1: Conditions that could be identified or ruled out by procalcitonin.
If procalcitonin levels decrease by 50% after the condition and the initiation of the antibiotic, it is considered that the antibiotic therapy is taking effect [26,27]. It has also been proposed that one of the criteria for discontinuing the antibiotic is when procalcitonin levels decrease or fall below 0.1 ng/ml or 80-90% below the initial measurement [28]. Efficient diagnosis of bacterial infections allows physicians to initiate antibiotic therapy when appropriate, thus avoiding misuse and overuse of antibiotics. As antibiotic resistance continues to increase, it has become increasingly important for physicians to determine different algorithms and laboratory tests to help maintain current antibiotic parameters [29]. Unfortunately, most first-line tests for determining infection, such as blood cultures and C- reactive protein (CRP), lack the efficiency and specificity needed to treat patients promptly. Therefore, laboratory tests are still being implemented to adjust cut-off points for procalcitonin to be used promptly and with greater efficacy in clinical practice [28-30].
Discussion
The study by Joshua et al, in which they conducted a systematic search of databases using an a priori strategy. Systematic reviews were included that reported an outcome related to antibiotic initiation and/or duration in the setting of respiratory infection. Data extraction was performed by the first author and independently verified by a second author. This paper concluded that the use of procalcitonin leads to a reduction in antibiotic initiation for respiratory illness. It also results in a decrease in antibiotic duration [31]. Another study by Anna et al, concluded that although there are several randomized clinical trials and observational trials evaluating the usefulness of procalcitonin in the early diagnosis of septic events in different clinical settings, there is still uncertainty as to its use in initiating and suspending antibiotic therapy. Since there are different factors that could stimulate the production of procalcitonin and thus obtain false-positive results, the skill of the treating physician plays an important role in this part [32].
All these trials demonstrate that procalcitonin alone would not be advisable to use, as the physician’s skill in dealing with the different types of infections and factors that contribute to increased procalcitonin levels in the blood plays an important role here. A strength of the current study is the methodology implemented, with respect to the literature search, and steps in the selection of relevant articles, quality assessment and data extraction. However, this study has several limitations, which should be taken into account before reaching a conclusion, among these are the lack of evidence from clinical analysis trials to determine with certainty the efficacy of procalcitonin with respect to the interruption or not of antibiotic therapy in different types of infections, both viral and bacterial, so more studies are needed to answer these questions.
Conclusion
Currently there are different types of inflammatory markers, among which we can highlight procalcitonin, which has become a new biomarker for the early detection of bacterial infections, especially systemic infections. Procalcitonin does not increase in viral infections, decreasing its values when appropriate antibiotic therapy is administered. The main source of procalcitonin is found at the thyroid level, in thyroid C cells, but it can also be synthesized by extra-thyroid tissues, such as the liver, pancreas, kidneys, lungs, intestine and leukocytes. After an initial bacterial infection, procalcitonin levels have been shown to increase from 6 to 12 hours, and these values continue to rise steadily from 2 to 4 hours after the onset of sepsis. Twenty to 24 hours is the half-life that has been recorded so far. One of the ways to demonstrate the efficacy of antibiotics is to identify procalcitonin every so often, since if the antibiotic is effective these levels decrease by 50% every 24 hours. After identifying the condition, it is advisable to measure procalcitonin every 6 to 24 hours, in order to identify the need to change the antibiotic, increase the dose of the antibiotic, or discontinue the antibiotic implemented for the condition. If procalcitonin levels decrease by 50% after the condition and the initiation of the antibiotic, it is considered that the antibiotic therapy is working.
Mangrove Seedling Development Under Different Salinity
The Selected Species of Mangroves
There are Different families of mangrove can be found around the world, such as: grey mangrove, white mangrove, red mangrove, black mangrove, etc. Two mangrove species Avicennia marina (grey mangrove) and Rhizophora mucronata (red mangrove) were selected to study the development of the seedlings under different salinity and growing media. The A. marina seeds were collected from the mangrove forest in Umm Al Quwain, UAE on the months of August to September, while the seeds of R. mucronata brought from Indonesia.
The Conducted Activities
1) The study were done inside the Marine Environment Research Center Laboratory (MERD) of the Ministry of Climate Change and Environment (MOCCAE) with the average room temperature of 26.59°C and average relative humidity of 43.71%.
2) The seeds were grown on soilless (water) and soil (sand) medium, with different water treatment, T1, T2, T3 and T4 (0ppt-freshwater, 15-17ppt, 25-27ppt and 38-40ppt-seawater).
3) The mucronata seeds were:
a. The saplings were washed several times with freshwater and soaked on freshwater for 24 hours.
b. After 24 hours, the saplings were directly cultivated on each tank.
c. one sapling placed in each tank.
4) The A. marina seeds were:
a. washed and rinsed with freshwater, and directly cultivated on the floating seedling tray.
b. The seedling tray were placed on each tank with 49 grey mangrove seedlings each.\
c. After 24 hours the pericarp peeled off and removed from the tray to avoid fouling, seeds then placed back to the seedling tray.
5) Experimental/study setup:
a. A 30 liter polycarbonate tank was used for the study.
b. The 4 tanks were properly connected with aerator for oxygen supply.
c. Each tank was filled initially with Freshwater.
d. After 7 days, 20 pieces of Tilapia (mixed species) with weight ranging from 2.0grams to 30grams and length varying from 2cm to 15cm were added onto the 4 tanks.
e. After transferring the fish, the salinity on Tank 2, 3 and 4 were adjusted every 2 days to reached the salinity 15-17ppt (T2), 25-27ppt (T3) and 38-40ppt (T4).
f. To avoid ammonia building-up, daily water freshening at 40% was done.
g. The Tilapia were fed 3 times daily with 80% commercial fish feeds and 20% ground dried seaweed (Ulva spp).
6) Sandy soil is commonly used in the mangrove nursery established in MERD for growing marina seedlings. Before planting, 1 kilogram of the soil were set aside and sent to the MOCCAE Central Laboratory for complete soil analysis. A plastic seedling pot was used and filled with sandy soil for the soil media application.
7) The water parameters, temperature, dissolved oxygen, salinity and pH were monitored 3 times per week and Ammonia, Nitrate, Nitrite and Phosphate were analyzed every 14 days throughout the duration of the study.
8) Data for roots length, seedling height and survival percentage were gathered.
9) The roots development for mucronata were measured in terms of length (in cm) every 7 days after first root initiation was observed and for A. marina, daily observation was done after development of root hairs and after the appearance of the first root, length was measured every 7 days in centimeters (cm).
10) For germination percentage, the seedling establishment was used as an indicator, recording the appearance of the first leaf (de Silva, W. and Amarasinghe, M. 2021) of the two species.
11) Shoots height (in cm) were measured from the epigeal cotyledon to the base of the apical leaf (Pinzon et al. 2003).
Results and Findings of the Study
1. The average value of Temperature, pH, dissolved Oxygen, Ammonia, Nitrate, Nitrite and Phosphate have no significant difference except for the salinity.
2. Seedling development, root initiation and survival were observed to study the effect of different salinity (0ppt-freshwater, 15-17ppt, 25-27ppt and 38-40ppt-seawater) on mangrove saplings cultivated on two different media (soilless and sandy soil).
3. Moreover, water parameters on each treatment (T1, T2, T3, T4), salinity, temperature, dissolved oxygen, pH, TDS and nutrients (Ammonia, Nitrate, Nitrite and Phosphate) and soil samples were submitted in Central Laboratory for soil analysis of MOCCAE.
Conclusion
Variation on water salinity shows the tolerance of the two mangrove species, R. mucronata and A. marina. The development of roots of both mangrove species grown in soilless media under 15-17ppt indicates that it is the preferable salinity level for establishing root system, and the roots length development is also better on water treatment with higher salinity (25-27ppt and 38-40ppt-natural seawater of the UAE). The low levels of the Ammonia, Nitrate and Phosphates indicates that the healthy root system of the saplings grown on 15ppt soilless water treatment has good nutrients absorption, and saplings on this treatment were the first to initiate leaves.
Which indicates that the cultivating mangrove seedlings at different salinity, ranging from 15-17ppt to 38-40ppt for soilless media or aquaponics system can be an alternative option on mangrove seedling management.
Comparison of Two Imaging Methods for the Diagnosis of Pneumonia in Pediatric Patients
Introduction
Pneumonia is an inflammation of the lung parenchyma mainly due to an infectious process, under a histological diagnosis. Clinically, it is defined as the acute presence of fever accompanied by respiratory symptoms and signs that may or may not be accompanied by radiographic findings of pulmonary parenchymal infiltrates [1,2]. Acute lower respiratory tract infections represent one of the main causes of morbidity and mortality in the pediatric population worldwide. Despite the large reduction in infant mortality in the first decade of this century, it remains high in developing countries, accounting for up to 15% of total global mortality [1]. In 2015, there were an estimated 200 million cases of pneumonia in children under 5 years of age, of which about 15 million progressed to severe clinical forms and have caused 2 million deaths. The incidence and mortality from pneumonia has an inverse relationship with age in pediatrics. The greatest burden of this disease is represented in the youngest, mainly those under 2 years of age, where pneumonia has partial mortality rates of up to 80%. Seventy percent of pneumonia mortality in children under 5 years of age occurs in developing countries [3].
Viruses are responsible for most cases of pneumonia in the pediatric age group, mainly in children under 2 years of age, with an overall prevalence of 14-62%, reaching 40% in children under 6 months of age and 30% between 6 months and 2 years of age. Streptococcus pneumoniae is the most frequent germ in bacterial pneumonias; it affects 0.7 to 1 million children under 5 years of age living in developing countries [4,5]. Clinical ultrasound is a technique based on ultrasound that is performed at the patient’s bedside, integrating in real time the ultrasound findings with the clinical information and the physical examination. Its objective is to provide an answer to a specific question, and it provides information that allows guiding the diagnosis or the initial therapeutic attitude in a short time [1,2]. Because it is a non-invasive and innocuous technique, its use in pediatrics has increased notably in recent years, especially in the emergency and intensive care areas [1,3].
In recent years there is increasing evidence of the usefulness of ultrasound in the management of patients with pulmonary conditions, most notably pneumonia. Thoracic ultrasound does not expose the child to ionizing radiation, when a specific diagnostic approach is required, obtaining capabilities is quick for the provider, and it can be performed practically anywhere in a hospital centre, without the need to move the patient [6,7]. Several studies have described the value of lung ultrasound in specific clinical situations in comparison with conventional thoracic imaging modalities, such as chest radiographs and computed tomography. [8] However, its use is not yet routine in emergency and hospital wards, leaving thoracic ultrasound for clinical indications that include, among others, dyspnea, respiratory failure, shock in any of its types, clinical pneumothorax, evaluation of pleural effusions, evaluation of the presence of alveolar consolidation, diaphragmatic function, trauma, intra-thoracic masses, as well as planning and orientation for an invasive thoracic procedure [9].
The guidelines recommend against the routine use of chest radiographs to confirm suspected community-acquired pneumonia in children not requiring hospitalization and suggest monitoring the clinical course of patients [10]. Chest radiography in an official audit by the British Thoracic Society (BTS) identified that chest radiography had been performed to confirm the diagnosis in 90 to 94% of suspected cases of community-acquired pneumonia and concluded that there was an overreliance on investigations to diagnose pneumonia [11].
Methodology
For the realization of this article a bibliographic search was performed in various databases such as Elsevier, Scielo, Medline, PubMed, ScienceDirect and Ovid, thus selecting original articles, case reports and literature reviews from 2013 to 2021, in Spanish and English language using MeSH terms: Pneumonia, chest radiography, ultrasound, pediatric patients, diagnostic tests, and the Boolean operators and and or. Thus, including all the documents dealing with Lung ultrasound vs radiography as a diagnostic method for pneumonia in pediatric patients, the data found were 30 records, thus using 21 articles for this document.
Results
In a single-centre prospective observational study, conducted in the Pediatric Emergency Department of the Hospital Universitario Parc Taulí in Sabadell between November 2015 and May 2017, they included patients under 18 years of age with suspected pneumonia, is defined as patients with respiratory symptoms plus at least one of the following symptoms: fever greater than 38 °C of more than 48 h of evolution, altered general appearance or suggestive auscultation (crackles, tubal murmur, hypophonia’s). Patients with underlying lung disease (cystic fibrosis, lung transplantation, bronchopulmonary dysplasia, post thoracic surgery) were excluded. The most frequent ultrasound images in pneumonia diagnosed by PE were apparent tissue image in 10 cases (71.4%), ill-defined pleura in 9 (64.3%), underlying pattern B in 8 (57.1%), air bronchogram in 4 (28.6%) and pleural effusion in 2 (14.3%) Of the 2 pleural effusions detected by PE, 1 was not detected by RT (parapneumonic effusion < 1 cm that resolved with intravenous antibiotic treatment) The mean time required was 9 min (SD 3.5) for PE and 25 min (SD 9.2) for RT, with a difference
of 16.2 min (95% CI: 12,7-19, 6), p < 0,01. [12]. Pereda et al. conducted a meta-analysis in 2015 in which a systematic search was performed reference standard (RT). As a result, eight studies (765 children) were analysed for analysis, of which 6 were conducted in the general pediatric population and 2 in neonates. Five studies (63 %) reported the use of highly qualified sonographers.
PD had a sensitivity of 96 % (95 % CI 94-97 %) and specificity of 93 % (95 % CI 90-96 %), and the positive and negative likelihood ratios were 15.3 (95 % CI 6.6-35.3) and 0.06 (95 % CI 0.03-0.11), respectively [13]. Caiulo et al. in 2012 studied a total of 102 patients with clinical suspicion of pneumonia, who underwent RT and PE on the same day. A total of 89 patients had a confirmed diagnosis of CAP, of which PE reported a total of 88 patients and RT a total of 81 patients; in addition, PE was able to identify pleural effusion in 16 cases, while RT only detected 3 cases [14]. Luri, De Candia and Pazzochi conducted a study in Italy in 2009 in 28 patients aged between 4 months and 17 years with clinical suspicion of community-acquired pneumonia (CAP), comparing RT and EP as a diagnostic tool. The results of RT identified subpleural consolidations in 22 patients, 7 perihilar consolidations, and 8 pleural effusions, while PD found the same 22 subpleural consolidations, but did not identify any perihilar consolidation, however, it did detect a total of 15 pleural effusions, thus achieving a sensitivity of 91.67% and a specificity of 100% [15]. Esposito et al. conducted a study including a total population of 103 patients where PD was performed by pediatric residents after training in this imaging study and still report a sensitivity of 97.9% and a specificity of 94.5% of PD for the diagnosis of CAP [16]. Recently, Jones et al. performed a randomized study of diagnostic tests comparing PE and RT in patients admitted to their emergency department with a clinical suspicion of pneumonia, including a total of 191 patients ranging in age from 0 months to 21 years of age. Those who performed the ultrasound services were emergency department physicians who received 1 hour of training.
These patients were randomly assigned to initially undergo PD or RT. Patients who were assigned to RT subsequently underwent PD, whereas those who initially underwent PD could undergo RT if deemed appropriate by the medical team or the patient’s family. Of the 103 patients who started in the PD group, 61 % subsequently underwent RT; of these in 29 cases (28 %) were requested from admission, by the family or by the physician after performing PD, and yet none of the RTs showed different results from PD. On the other hand, no diagnosis of CAP was missed in either group [17]. In 2014 in Beijing, they conducted an observational study with the aim of investigating the findings of lung ultrasound (PUS) in severe neonatal pneumonia (SNP) in order to evaluate its diagnostic ability for this disease. Forty neonates diagnosed with SNP according to their medical history, clinical manifestations and chest X-ray findings participated and 40 neonates without lung disease formed the control group, all of them admitted to the neonatal intensive care unit (NICU). They were excluded if there was no definitive evidence of infection or if they had serious complications that could affect the findings of the EchoP, which was performed by a single investigator, unaware of the diagnosis. The main sonographic findings in patients with NSN were respectively: pulmonary consolidation and interstitial syndrome in 100 %; pleural line abnormalities in 90 %; disappearance of pulmonary sliding in 75 %; dynamic air bronchograms in 52.5 %; pulmonary pulse in 30 %; pleural effusion in 20 %. The only finding in the subjects belonging to the control group were some B lines in 30 %. This being so, the p value <0.001 the data obtained. Large areas of pulmonary consolidation with irregular margins demonstrated a sensitivity and specificity of 100% for the diagnosis of NNS [18].
Discussion
In the study performed by Gelman and collaborators, they included 37 patients of which 17 of them were diagnosed with pneumonia, most of them were in a mean age of 3 years old and > 50% were girls, of these 17 patients the ultrasound was positive in 14 of them and the remaining 3 were negative to ultrasound.50% were girls, of these 17 patients in 14 of them the ultrasound was positive and in the remaining 3 were negative to ultrasound, The most common ultrasound images in the lung ultrasound diagnosis of pneumonia were evident tissue images in 10 cases (71,4%), unclear pleural border in 9 cases (64.3%), latent type B in 8 cases (57.1%), bronchial air in 4 cases (28.6%) and pleural effusion (14.3%), likewise, EP is an excellent test for the diagnosis of pneumonia in childhood, based on the improvement of quality of care and patient safety, which is why the use of EP is recommended as the first line test for the diagnosis of pneumonia in childhood, however, the results of this study support the usefulness of EchoP as the technique of choice for the diagnosis of pneumonia in children, with a high accuracy, slightly higher than RT, and less time consumption, results consistent with the existing literature [19]. In pneumonia, due to its frequency in clinical practice and its frequent occurrence in children, chest ultrasound is most useful in primary care (if the lesion is > 1 cm, the changes are important; the clinical relevance of lesions < 1 cm is not completely known).
Dynamic bronchial images, air or liquid (depending on time of evolution) and dendritic, hepatic, lamellar atelectasis. If it is not a large sheet, the border is irregular. B lines appear behind the lesion. Fragmented and thickened pleural line Basal parapneumonic effusion. Doppler: increased vascularization [20] According to a study conducted by Molina and Ortega, where eight studies were evaluated with a total of 765 subjects, the result was that ultrasound proved to be useful and effective for the diagnosis of pneumonia, with an S of 96% (CI 95: 94 to 97), where For every eleven ultrasounds that were performed in these patients, ten of these patients were diagnosed with pneumonia; although in various studies they conclude that there is no high relevance between the use of ultrasound vs. chest radiography and despite the heterogeneity in the studies and the skill of the sonographers, lung ultrasound is recommended and is a good tool for the diagnosis of pneumonia in pediatric patients and this can be considered a viable alternative for the timely diagnosis of pneumonia in children.
Conclusion
Among the imaging tests performed for the diagnosis of pneumonia in pediatric patients we have among others, pulmonary ultrasound and chest radiography, where according to the results of multiple studies ultrasound has better results in the diagnosis of pneumonia showing a high sensitivity and specificity, also proved better in identifying pleural effusion in patients compared to chest radiography, because this manages to identify effusions when these are of greater content; Nevertheless, chest radiography is a good diagnostic option for the identification of this pathology, having specific radiological signs of pneumonia such as air bronchogram that are of great help in the imaging diagnosis.
Cancer is one of the leading causes of death in the modern age worldwide. Many cancers are associated with progression and abnormalities, but chemical biomarkers play a significant role in the diagnosis of cancer. Therefore, detection and identification of these biomarkers in various biological fluid samples play a significant approach in the detection and pathophysiology of cancer diseases. Various analytical techniques are reported and available in the literature for the detection and identification of various cancer biomarkers. Liquid Chromatography coupled with Mass Spectrometry (LC-MS/ MS) is one of the advanced analytical techniques with high sensitivity and selectivity that have been utilized in the past few years for the detection, identification, and quantification of cancer biomarkers. In the present compilation, reports highlighted the significant impact of LC-MS/MS analytical techniques for the detection and identification of various cancer biomarkers in biological samples. Lung cancer is the leading cause of cancer-related deaths worldwide with a poor survival rate due to being diagnosed at a late stage. In the early-stage detection of lung cancer concerning clinical cost and disease prognosis at a defined location, biomarkers play a significant therapeutic benefit for early-stage cancer detection and identification [1]. Apart from early detection, body fluids analysis, such as blood, plasma, and serum also play a significant role in lung cancer diagnosis.
LC-MS/MS plays a major role in the analysis, identification, and well as thousands of complex compounds quantification in a biological matrix and proved to be a significant standard for this purpose [2]. Zeng et al. carried out the identification of lung cancer serum biomarkers through Liquid Chromatography coupled with Tandem Mass Spectrometry in Non-small Lung Cancer Cell patients with (n = 6) adenocarcinoma and (n = 23) squamous cell carcinoma. Apart from this, clinical control samples (n = 54) with nodules found on Computer Tomography were taken (Non-malignant lung cancer by biopsy confirmed) as well as from control patients (n = 106). On the other hand, serum samples were taken based on sex, smoking, and lung cancer tumor stage which pooled into sufficient pools, with (n = 9) cases of adenocarcinoma, (n = 6) cases of squamous cell cancer, (n = 8) cases of clinical control as well as (n = 8) cases of healthy control. The results indicate that 49 differentially abundant serum biomarkers such as gasoline, haptoglobin, alpha-1-acid glycoprotein 1, and N-acetylmuramyl-L-alanine amidase, were present in abundance in pooled lung cancer cells and compiled by negative model of binomial regression with value (p < 0.01). The analysis of the functional method was carried out by Ingenuity analysis pathway tools which imply an abundance of inflammatory proteins that play a pivotal role in cellcell signaling molecules, network interaction, and different physiological responses between two subtypes of non-small lung cancer cell patients.
This method proposed and confirmed that when it is fully validated it shows very significant results in the lung cancer diagnostic process [3]. Prostate cancer is the fourth most common cancer in Western Countries and the prevalence of this cancer is increasing day by day worldwide. The severity of prostate cancer is predominantly in males as well as the sixth major cause of death among males [4]. The chances of death survival are greatly increased by early diagnosis or by the biomarker identification involved in prostate cancer. One such biomarker is sarcosine which is a non-protein amino acid precursor of natural origin considered as an effective biomarker against prostate cancer. The increased level of sarcosine is of noticeable interest, especially in localized and metastatic tumor tissues. Sreekumar A. et al. carried out metabolomic profiles of sarcosine in the progression of prostate cancer by utilizing a combination of Liquid Gas Chromatography hyphenated with mass spectrometry (LC/GC-MS). The LC/ GC-MS was successfully utilized and identified greater than 1,126 metabolites in 262 prostate cancer patients’ specimens mainly tissue samples (n = 42) and urine and plasma match specimens’ samples (n = 110) were assayed. The specimens’ samples for analysis were biopsy-positive cancer patients (n = 59) and biopsy-negative control patients (n = 51) were analyzed, and the result obtained from studies may provide a determination of sarcosine compounds as well as other five metabolites named uracil, proline, leucine, glycerol-3-phosphate and kynurenine in biological samples.
Additionally, this study also reveals the prostate cancer progression concerning metabolite concentration and is helpful in benign prostate cancer differentiation, prostate cancer localization, and metastatic disease concerning metabolomic profiles [5]. Breast cancer is one of the leading causes of death among women, mostly in old age is breast cancer. However, many considerable studies are carried out, especially in mRNA profiling, proteomics studies, and breast cancer biomarkers but only a few molecular biomarkers are used for diagnosis and therapy due to their limited versatility [6,7]. Imai K et al. carried out their studies with Fluorogenic Derivatization Liquid Chromatography coupled Tandem Mass Spectrometry (FD-LC-MS/ MS) with differential proteome analysis techniques among cancer cells patients and normal cancer cells patients. The studies revealed any changes in the protein chromatogram of breast cancer patients (n = 7) and normal cancer patients (n = 1) due to the presence of Ran Specific GTPase Activating Protein (Ran-GAP) in both cancer patient’s cells. The characterization of cancer cells is due to the presence of Raf-1 kinase inhibitor whose abundance is higher as well as factors like Elongation Factor Tu (EF-Tu), Annexin-2, and Galectin-1 present in lower concentrations which implies that it could be helpful in the treatment of metastatic breast cancer. This method was advantageous for the diagnosis of metastatic breast cancer but further mechanistic investigation and studies at a larger scale are required [8].
Colorectal cancer is one of the leading causes of death worldwide and it is the second most common cancer in the Europe and USA in terms of mortality [9]. In China, the cases of colorectal cancer are increasing day by day and it takes place in fifth position in terms of death from colorectal cancer [10]. With the help of LC-MS and UPLC- MS, detection and metabolite profiling are possible but UPLC-MS possesses better characteristics in terms of peak capacity, resolution, selectivity, specificity, and sensitivity as compared to LC-MS. Ma YL et al. carried out the urine metabolomic analysis of colorectal cancer patients through Ultra High-Performance Liquid Chromatography (UPLC) coupled with Time of Flight Mass Spectrometry (UPLC/TOF– MS) to investigate the LMCs in urine samples of colorectal cancer patients (n = 24) which was taken before and after surgery as well as healthy controls of the same age (n = 80). Several thousand peaks related to metabolites are detected by UPLC/TOF–MS and profiling of urinary metabolite through data interpretation was carried out by Partial Least Squares Discriminant Analysis (PLS-DA). The PLS-DA data shows result differences among the three examined groups (n = 3) and compounds MW 283 and MW 294 whose levels are noteworthy higher in before-surgery patients and after-surgery patients the levels of two compounds are significantly decreased due to their involvement in biochemical processes which is of particular interest. These results also state the potential biomarkers are helpful in the diagnosis of colorectal cancer but the sample size for analysis is relatively small [11].
The most prevalent cancer among all cancers is gastric cancer which has many deaths worldwide [12]. The gastric cancer treatment like chemotherapy and curative radiotherapy are typically ineffective but the majority of countries still have inexplicably high stomach cancer death rates, despite decades of progressively reducing incidence [13]. With the help of LC-MS/MS techniques and Protein Antibody Array (PAA) based proteomics along with genomics approaches Guo et al. investigated two gastric cancer cell lines named transcriptome and phosphoroscope in gastric cancer patients. Due to the presence of these gastric cancer cell lines, 17 gastric cancer cell lines of endoscopic biopsies were taken into consideration including five cancer cell lines named SNU1, SNU5, AGS, YCC1, and Kato III for phosphoroscope analysis. The main purpose of this study is to carry out the studies of phosphoproteins proteins which act as a major pervasive molecule of signaling and play a crucial role in the carcinogenesis pathway. The combined spectral data and integrative analysis data of transcriptome and phosphoroscope from all the cancer cell lines give a clear representation of molecular signaling pathways that are involved in gastric cancer [14]. Liver cancer is one of the third largest causes of cancer related death as well as the fifth most common cancer around the globe with a survival rate of less than 7% within five years [15].
The mortality rate of liver cancer predominantly in countries like Southeast Asia, Africa, Western Europe, and North America despite significant advancements in diagnosis and treatment early diagnosis is still challenging [16]. LC-MS possesses significant advantages like biofluids analysis, complex molecules characterization as well as reliable quantitative analysis of molecules. Chen F et al. by the application of LC-MS, serum metabolites analysis was carried out in liver cancer patients (n = 41; mean age = 55) and control subjects (n = 38; mean age = 35). The levels of Aspartate transaminase (AST) & ALT were analyzed between liver cancer patients and healthy control patients, instead, both were higher in the liver cancer group which suggests factors like drug abuse, hepatitis virus infection, and toxin ingestion were responsible. Apart from that, Principal Component Analysis (PCA) suggests 1-methyladenosine as a potent compound for liver cancer disease and this compound was also characterized as a most significant biomarker in liver cancer disease [17]. Oral cancer is one of the six major common cancers worldwide instead of not being diagnosed at an earlier stage the overall survival rate is <50% within 5 years and among Americans, it possesses a very high impact oral cavity disease affecting 38,000 Americans and 350,000 annually cases worldwide [18].
The main purpose of this study is to carry out the profile of oral fluid (whole saliva) samples of humans for proteomic analysis with the help of Matrix-Assisted Laser Desorption Ionization Mass Spectrometry (MALDI-MS) technique between cancer of oral patients as well as control patients and the level of 46 proteins or peptides were found notably different between these two groups. By the application of liquid chromatography (LC) followed by the C4 column, oral fluid samples were separated and monitored by MALDI-MS. The fraction samples were digested with the help of the LC-MS/MS technique to quantify the protein biomarkers from the oral cancer patient’s clinical samples. This study also reveals that the oral fluids of saliva contain proteomic signatures that serve as a biomarker of oral cancer and once validated at a large clinical stage, it may be used in the future for diagnosis of human diseases such as oral cancer. This method was advantageous for non-invasive clinical diagnosis of oral cancer and informed further mechanistic investigation in oral cancer [19]. Bladder cancer (BC) is the seventh most common cancer in the United Kingdom, and it mainly occurs in the urinary system [20]. Instead of its continuous rise, the death rate of bladder cancer has not significantly changed in the past few decades, but the survival changes are highly increased by early diagnosis but only diagnostic tools like cystoscopy and urinary cytology are available currently [21]. Therefore, a non-invasive, accurate, and cheap method was adopted to identify a specific and potential biomarker for bladder cancer by metabonomic profiles.
The Liquid Chromatography Mass Spectrometry (LC-MS/ MS) technique, was utilized successfully with a combination of Reversed- Phase Liquid Chromatography (RP-HPLC) and Hydrophilic Interaction (HILIC) chromatography separations techniques, followed by multivariate analysis data to profile samples of urine between bladder cancer volunteers (n = 27) and healthy volunteers (n = 32), from which the two metabolites of bladder cancer named as component I and carnitine C9:1 were identified. The study suggests that the component I level was higher as compared to carnitine C9:1 level in bladder cancer patients which serves as a potential biomarker for bladder cancer. The results obtained from multivariate data analysis of both group patients were up to 96.9 % specificity and 92.6 % sensitivity but the increased level of component I reason, and function are still unclear. This method is advantageous and far better in combined biomarker identification as compared to single biomarker identification but further confirmation against bladder cancer is still highly needed [22]. Kidney cancer or renal cell carcinoma (RCC) is one of the greatest interests among scientists in terms of its rarely discovered and it is the leading death cause in the USA [23]. The signs and symptoms of kidney cancer are equivocal which leads to late diagnosis but other procedures like nephrological screening act as diagnostic tools in kidney cancer, but non-invasive and newer techniques are highly needed in early-stage detection of kidney cancer in terms of diagnostic process [24].
By the application of Hydrophilic Interaction Liquid Chromatography coupled with Mass Spectrometry (HILIC-MS), urine metabolic profiling was carried out in urine samples of kidney cancer patients to quantify potential biomarkers of kidney cancer. The main purpose of this study is to carry out the urine sample analysis between renal cell carcinoma (n = 50) patients and healthy control patients (n = 13) for urine metabolomics analysis as well as Principal Component Analysis (PCA), Linear Discriminant Analysis (LDA) and Variance Component Analysis (VCA) were utilized for group data analysis. The utilization of this technique depends upon urine site collection and residual variation source of urine metabolomics analysis suggests a promising diagnostic approach towards renal cell carcinoma and acts as sufficient viable biomarkers. It also summarizes that the method can identify potent biomarkers, but the source variability needs to be eliminated for specific substances in urine samples of kidney cancer patients [25]. The above insight-evidenced reports suggest the impact and application of LC-MS/MS in the identification, determination, and characterization of cancer biomarkers as well as useful to the analyst, and clinical technicians for the utility of LC-MS/MS technique.
Acknowledgements
The authors are heartily thankful to the management of CSIR – Central Drug Research Institute for their constant encouragement, support, and motivation.
Conflicts of Interest
The author declares no conflicts of interest, financial or otherwise.