Open Access Journals on Medical Research

Influence of Physical Properties of Hockey Stick Blade on Shots

Introduction

Ice hockey sticks have experienced a gradual development in recent decades. Progress in material science allowed the replacement of widely used wood by composite materials that nowadays represent the standard for hockey players worldwide. Broad usage of new materials like aluminium and composites has become an interesting topic for research as well. Interestingly, the performance of wooden sticks was shown to be superior to the performance of composite sticks [2]. Stick stiffness [3], as well as the hockey stick’s blade position and response [4] has been proven to directly influence the performance of hockey players. Studies [5] even found the ideal zone for the blade to impact the ice for maximum shot speed and prove that puck speeds increase when impact happens closer to the toe of the blade. However, the effect of blade surface on performance has not been addressed so far, except for Frayne et al. [6] who concluded that the tape covering the blade used in the study did not have a positive effect on performance (when compared to bare blade).

To fill the gap in existing research, in this study we decided to focus on the influence of the physical parameters of the blade, such as hardness and associated damping properties and roughness on parameters of the shots, namely speed, rotation and energy. Several solutions for changing the blade surface exist and can be divided into two basic groups. The first one, further denoted as traditional tape, consists of a long strip of textile or similar material with glue on one side. This tape is then applied on the blade in a rather personalised manner by each player, differing in the parts of the blade covered, as well as the number of layers used. Within our study, from the following products: Howie’s Hockey Tape [7], Renfrew Pro [8] and Comp-o-Stik [9] we decided to select Renfrew Pro as a very popular product among the tested players. Contrary to the traditional tapes, alternative blade covers are harder, rougher and are applied by sticking a single piece on the blade. From the spectrum of these products as Blade Tape [10], Blade Shark [11] and Specter Hockey Tape [12] we went for Specter as the one readily available.

We have examined two types of shots that are most widely used in ice hockey, namely the Wrist shot and the Slap shot [13]. Wrist shot is quicker in release and players use it to surprise the goalkeeper, when shooting covered by a defender. The Slap shot is the most powerful shot with the highest speed, although it takes more time to carry out and allows the goalie to prepare. We have invited a set of 13 players (9 lefties and 4 righties) ranging from skilled amateurs through junior players to top NHL professionals. All players have carried out a series of Wrist shots and Slap shots. From our experiments we have seen that for most players both speed and frequency of rotation of the puck where higher for both types of shots using Specter tape in comparison to Renfrew tape. Whereas for individual players the results varied depending on the type of the shot and other parameters, the collective statistics showed rather smooth results confirming the increase in both speed and frequency with almost certainty, while the expected increase was in the order of a few percent. We argue that this is due to the lower loss in damping, as well as due to the rougher surface of the Specter tape comparing to Renfrew.

This paper is organised as follows: In Results we first present the data obtained from the experiments for individual players and then its collective statistical analysis. In the last part we elaborate on physical background of the results obtained. In Methods Section, we describe the setup, conditions and methodology of the experiments performed with both Renfrew and Specter as well as precision and pre-processing of data obtained for individual players. We also describe the experiment for measuring the friction coefficient.

Results

We analysed results for 13 different players with various experience and skill level. 3 NHL professionals were joined by junior, senior and amateur hockey players with above average shooting skills. 12 players completed the experiment, 1 player was excluded because his stick broke during the experiment.

Individual Players’ Statistics

In the first step, statistical analysis was performed for each individual player. Expectantly, the stability of shots for each player was not perfect, due to unavoidable human influence. This is why we first decided to remove outliers from the raw data by arguing that some of the shots might have been spoiled. Outliers were defined as lying outside Tukey’s fences [14], i.e. outside of the interval

where Q1 and Q3 are the first and third quartiles and IQR refers to the interquartile range:

First we tested the level of correlation between the results in speed of the shots and frequency of rotation of the shots. The correlation coefficient for all available data (all players all shots) was at the level of 0:66. This means that there is a reasonable, although not extremely strong, correlation between the two types of data. Based on this we decided to take each shot as a single event with two parameters (speed and frequency of rotation) and, if needed, to remove the shot as a whole, i.e. both the speed and the rotation from further analysis. For each player independently both speed and frequency of rotation were evaluated for both types of shots and taping methods. As the research question was aimed on the effect of taping method on parameters of the shot, a measure Ih is independent of player’s skill is needed. Such measure shall at the same time allow us to compare data from all players, which is not possible with absolute speeds, naturaly different for differently skilled players. Therefore we define a simple measure called relative gain:

where X is the parameter of interest, in our case average speed, average frequency of rotation or energy for each player and type of shot. Relative gain is a measure of impact of the taping method on shooting performance of each player: positive gain implies increase in performance with Specter compared to Renfrew, negative gain a decrease in performance. Gain is also the quantity of interest when evaluating the change in performance due to change of taping, as it is independent on the performance level of the player. The effect of taping method on each player’s performance was thus characterised by two numbers: gain in speed and gain in rotation. To obtain a unifying parameter, we also calculated the gain in energy. Kinetic energy of a moving and rotating puck is defined as:

where m is puck’s mass, I = 1/2 mR2 is puck’s moment of inertia for rotation around its canonical axis, R is puck’s radius, v is its speed, ω = 2 f stands for angular speed and f is rotation frequency. Energy is interesting due to two reasons – firstly, it combines in a neat way both speed and frequency of rotation and characterises the shot by a single parameter. Secondly, the energy is, in the end, the physical entity that needs to be transferred from the player via the stick to the puck – shooting twice as fast needs four times more effort, as four times more energy is needed for such a shot.

Speed, Rotation and Energy

We analysed how speed and rotation of the shot differ between the two taping methods. The results for speed are shown in Figure 1 and the results for rotation in Figure 2. The gains in speed and rotation are show in Figures 3a & 3b, respectively. The results obtained show consistent increase in both speed and rotation, albeit comparable or smaller than the standard deviation for individual players. Both the mean and the variance in rotation gain are larger than of gain in speed, presumably due to lower stability of the shots for most of the players. Speed and rotation can be neatly joined into a single parameter – the energy of the shot, as defined in (4). The gains in energy are shown in Figure 3c. In almost all cases the gain is positive and in some cases even relatively high: four players achieved the gain of more than 10% and one of them even almost 20%. The energy gains – both averages and standard deviation – are in all cases very close the twice the values for speeds. This is due to the fact that, as expected, the energy is mostly determined by the speed of the puck and the speed enters the energy in second order.

biomedres-openaccess-journal-bjstr

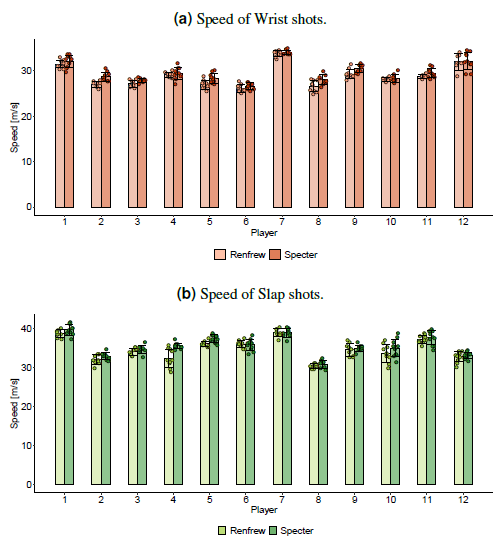
Figure 1: Speed. Figure shows speed of

a) Wrist shots and

b) Slap shots for individual players.

Bars represent mean value, error bars standard error and dots correspond to individual shots. For Wrist shots, average values are consistently higher for Specter tape. For Slap shots, the average values are clearly higher for a couple of players, in one case the value is slightly smaller and in one case almost identical.

biomedres-openaccess-journal-bjstr

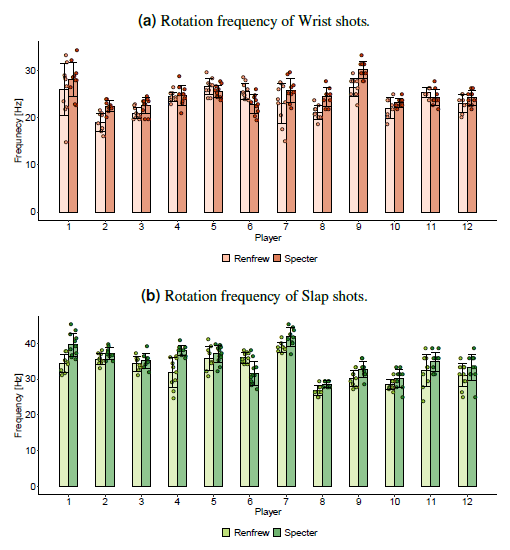
Figure 2: Rotation frequency. Figure shows rotation frequency of

a) Wrist shots and

b) Slap shots for individual players for Renfrew tape and Specter. Bars represent mean value, error bars standard error and dots correspond to individual shots. For Wrist shots, the average values are rising consistently more than for speeds, but there are two players with a clear drop. The smaller stability of the shots led to higher standard deviations, thus the rise in this case is also comparable or smaller than the standard deviation except of one player. For Slap shots, the average values are higher for all but one player.

biomedres-openaccess-journal-bjstr

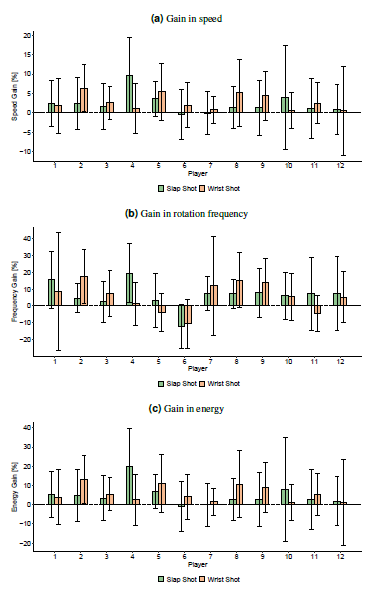
Figure 3: Individual gains in speed, rotation and energy for Slap and Wrist shots. Except for three players, the gains in all parameters were always positive. Some players reached gains higher than 10%, which is a considerable increase in performance.

Collective Statistics

Expectantly, the results for individual players are not particularly stable. Firstly, because each player has his own technique, that might be more or less adapted for using a different taping method. Secondly, having about 10 shots per player is statistically not enough to draw definite conclusions for individual players. Nevertheless, we decided to keep the total number of shots per session at 40 because of possible tiredness of players with higher load. In this setting, we can be certain that with regular breaks between shots tiredness will not be a factor. Results for collective statistics can be visualised in a form of boxplots (Figures 4a-4c). In each boxplot, median (horizontal line) and mean (full circle) of the sample are shown. The box encloses the middle 50% of data, i.e. data lying between the first and third quartile (lower and upper hinge). Vertical lines point to inner fences, as defined by (1). Coloured small circles are individual data points, corresponding to each boxplot (value of gain for each player). Dashed horizontal line denotes zero gain. The plots suggest that the gain is consistently higher than zero for all parameters. In other words, players performed better when using Specter compared to using Renfrew tape.

biomedres-openaccess-journal-bjstr

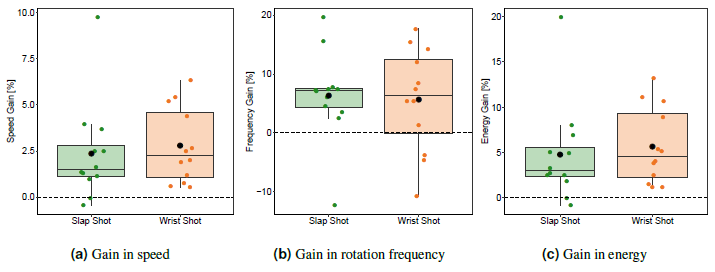
Figure 4: Boxplots of gains in the three performance parameters for both types of shots: Slap Shot (green) and Wrist Shot (orange). Median (horizontal thick line) and mean (full circle) as well as individual data points are shown.

To determine whether the taping method has significant influence on the parameters of shots, we performed statistical tests on gains. Depending on whether the sample analysed is likely from a normal distribution, two types of tests are used: Student’s t-test for normally distributed data and Wilcoxon signed rank test for samples, which do not fulfil the condition of normality. In our case, Wrist shots were analysed using Student’s t-test whereas for Slap shots, Wilcoxon signed rank test was used. Unlike for Wilcoxon test, output of t-test also includes confidence intervals, therefore the 90% and 95% confidence intervals have been calculated for Wrist shots. The results are shown in Tables 1 & 2. Details of statistical analysis are provided in Methods. Several conclusions can be drawn here. The first and most obvious one is that with very high confidence (higher than 97% for all cases) the Specter tape enhances player’s performance in all relevant parameters – that means a player will achieve higher speed, rotation frequency and energy of the shot using Specter tape when compared to Renfrew tape.

biomedres-openaccess-journal-bjstr

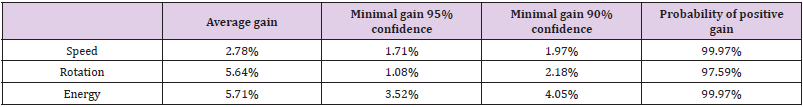
Table 1: Gains of Specter tape for Wrist shots. Table shows the gain of Specter tape for Wrist shots. One can conclude that with confidence of more than 99, 95% the Specter tape leads to a gain in speed and energy. The confidence in rotation is slightly smaller, albeit the expected gain is higher, due to larger variance in results.

biomedres-openaccess-journal-bjstr

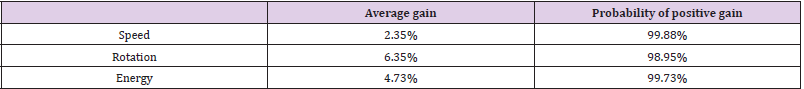
Table 2: Gains of Specter tape for Slap shots. Table shows the gain of Specter tape for Slap shots. One can conclude that with confidence almost 99% that Specter tape leads to a gain in all parameters. One can also see that while the gain in speed and energy is slightly smaller compared to Wrist shots, the gain in rotation is higher.

Furthermore, while the average gain in rotation is higher than in speed (in fact more than double), the associated uncertainty is higher as well. This leads to the fact that the gain expected with very high probability is smaller than that for speed. Interestingly, the variation between players in rotation frequency of Wrist shots was much larger than for Slap shots, though the average and median gains are similar. Also, judging from individual statistics (Figure 4b), Wrist shot rotation gain for each player is less stable than Slap shot rotation gain. This may be due to the different technique of the shots, that will be analysed in detail in the next subsection.

Physical Background

As described in previous subsections, it is clear from the experiments that specifically developed blade stickers like Specter lead to better results in both speed and rotation than standard tapes, such as Renfrew. Here we analyse the underlying physical principles. The naive interpretation of a Slap shot is that it can be compared to a slash of a hammer on a nail, where in a collision the momentum and energy is transferred from the stick to the puck. This is, however, true only to a certain extent. The blade speed of the Slap shot goes through several phases [3]. Making use of rather high elasticity of the stick, it is leaned against the ice (or a shooting mat as in our experimental setup) and bent like an arch. During this phase energy is accumulated in the elastic energy of the stick. The blade then touches the puck and collides in a mostly inelastic manner, while accelerating the puck to about 60% of its final speed [3]. Then the energy accumulated in the bending of the stick is gradually released as the blade is freed from the surface. Whereas the time of acceleration of the stick is on the order of tens of milliseconds (confirmed both by [3] and our measurements), the time of the primal collision of the blade and puck is much shorter, certainly less then a millisecond (below time resolution in both studies).

For Wrist shots, the situation is different. Here the blade touches the puck from the very beginning, so there is no collision involved. The accumulation of energy in bending is used to a smaller extent and the acceleration of the puck takes much longer (about 100ms or more). The energy and momentum transfer from the player to the puck is thus more direct meaning the forces acting on the puck are mostly limited to forces the player themselves can expend, which requires longer contact. During this time, the puck rotates along the blade, allowing both better aiming and stability. Let us first estimate the forces and momenta transferred during shooting. For the case of speed of 30ms−1 and the mass of the puck 165g, the momentum transferred is in the order of 5kgms−1. For Wrist shots, we can rather safely expect the force to be constant during contact (approximately 100ms), resulting into a force of 50N. For Slap shots the force is highest during the collision and much smaller during the further acceleration later on. If we approximate the momentum transferred during the collision lasting 0, 5ms to be 3kgms−1, we end up with a force of 6kN or more, as the collision might take even much shorter time.

Damping

While Renfrew is basically a textile tape with glue on one side, Specter has a more elaborate composition of several different layers. The thickness of both of them is very similar: 0, 37mm for Specter [15] and 0, 254mm for Renfrew [16], but the elastic/ damping properties are substantially different. While Specter does not deform almost at all even under very high pressures, Renfrew can be easily deformed even by hand (e.g. by pressing the disk of unused tape). We believe that the loss of energy for Renfrew (from now on, we shall switch the viewpoint and speak about loss of Renfrew rather then of gain of Specter) is caused by the inelastic deformation of the tape. To elaborate on this, let us calculate the energy balance. The energy of the puck is in the order of 100 Joules and the experimentally confirmed loss of Renfrew is thus in the order of 5 Joules (see Tables 1 & 2). For Slap shots, if we take 6kN as the force, it corresponds to the deformation in thickness of about 0.8mm. This is not realistic, as it is slightly more than the thickness of two layers of the tape as used during our experiment.

On the other hand, as all the numbers above are gross estimates where a factor of two can certainly enter (especially via the duration of the collision, which could surely be shorter), we can conclude that the hypothesis does not contradict experimental data. The situation is rather different for Wrist shots. Here the puck does not touch the blade at one contact point, but rather rolls on it during the shooting. Thus while the forces acting here are much lower (as there is no direct collision involved), the deformation of the tape has a higher effect with losses distributed on a large portion of the blade in the form of rolling friction. So while the primary source of losses (damping in the tape) is the same, the mechanism is substantially different and harder to estimate quantitatively. Let us model the experiment by rolling resistance of the puck rolling on the blade. The force resisting rolling can be modelled as

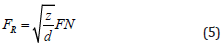
where z is the deformation depth, d is the diameter of the puck (76:2mm) and FN the normal force. We can express the energy loss as

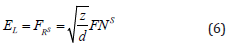
where s is the path travelled by the puck. Taking FN = 50N, the path along the blade 20cm and the deformation depth 0:4mm, we end up with an energy loss of around 0:7J. This is certainly less than the experimentally seen loss in order of 3:6J (see Tables 1 & 2). We conclude that the rolling friction connected with deformation of the Renfrew tape has a non-negligible effect on the losses, but most likely it is not the prevailing source. We discuss other possible source qualitatively below.

Friction

Naively one would expect the gain in rotation to be approximately the same as the gain in speed, based on a simple scaling principle – if mechanism of the shot with Specter are similar but quicker than with Renfrew, the speed should differ to the same extent as rotation. This was, however, not the case in our experiments – the average gain in rotation was almost double for Wrist shots and almost triple for Slap shots compared to gain in speed. At the same time, the gain in rotation was higher than in speed for 9 out of 12 players for Wrist shots and 10 out of 12 for Slap shots. To understand this, we again look at the shooting style of the two types of shots.

Here the understanding seems to be simpler for Wrist shots: the puck is rolling on the blade during the shot and therefore also gains rotation. The longitudinal force responsible for rotating the puck is, however, strictly limited by the friction force, which is proportional to the normal force and the friction coefficient. There is a large difference in friction coefficient between the two tapes: while Renfrew is basically textile, Specter has a surface similar to sandpaper with a clearly rougher surface.

We have measured the friction coefficients for both Specter (f = 0.69±0.02) and Renfrew for different configurations (longitudinally f = 0.46 ±0.07, transversely “downstairs” 0.43 ± 0.08 and transversely “upstairs” 0.50 ± 0.11. The configuration used for measuring the shots was upstairs; for details see the Methods section). While the different configurations of Renfrew tape do not differ significantly in friction coefficient, they are all much smaller than the one of Specter. Thus the magnitudes of longitudinal forces caused by friction while the puck is sliding on the blade are increased even more when using Specter than when using Renfrew compared to the effective normal (accelerating) forces, as both the normal force and the friction coefficient are increased.

For Slap shot, the shot can be modelled as a single hit into the puck followed by a gradual acceleration. While the second phase of the movement can be described in a similar manner as for Wrist shots, the first one is substantially different. Here the degree of rotation is given mostly by the level of non-centrality of the hit – the further off-axis the hit is made (the more the velocity vector of the blade and normal vector of the surface of the blade differ), the more rotation for a given speed of the puck is achieved.

This level is basically determined by the level of tilt of the blade as well as the exact point of contact, as the blade is curved. Neither of these is easy to control, what could partly explain why the variation in rotation for different players was much higher compared to variation is speed. Like for Wrist shots, the gain in rotation for Slap shots is on average higher than the gain in speed. Here one can argue that for Specter, with higher friction coefficient, the longitudinal force acting on the puck is generally higher than for Renfrew for the same normal force. For close-to-central hits, which is the case for Slap shots (as players aim to shoot with the largest speed possible), longitudinal forces contribute mainly to the gain in rotation. Thus higher longitudinal forces (due to higher friction) further contribute to the increase in rotation. For a more detailed quantitative analysis one would need to look in detail on the shot itself. This was not possible with the given equipment and goes beyond the scope of this research.

We also believe that the increased friction coefficient of Specter might contribute to a higher shooting speed in comparison to Renfrew for Wrist shots. During the shot, at certain moment the blade moves above the puck and looses the contact and hence the ability to further accelerate the puck. With higher friction, longer contact between the blade and the puck can be maintained, as the contact point will be more efficiently elevated by the blade while the centre of the puck moves further mostly horizontally. A mere 1cm longer contact with the blade would lead (in the constant force approximation) to more than 1% increase in the total energy. For a quantitative analysis of this hypothesis one would need to measure the contact time between the puck and the blade with very high precision and this was far above our experimental possibilities. To summarise, we have shown that the loss of Renfrew in speed is partly due to higher energy losses via damping in the tape. Damping itself can mostly explain the loss in speed for Slap shots, as well as around 20% of the loss in Wrist shots.

The rest of the difference can be attributed to the significantly higher friction coefficient of Specter, which allows for longer contact between the blade and the puck. This results in higher release speed of the puck, as the puck is being accelerated longer. The gain in rotation is even larger than gain is speed for both types of shot; this can be explained by the fact that longitudinal forces are increased both due to larger transversal forces (due to smaller damping), as well as due to higher friction coefficient.

Discussion and Conclusion

We have analysed the influence of the physical properties of the ice-hockey stick blade surface on both speed and frequency of the rotation of the puck. The analysis was performed by taking highspeed video recordings of shots of 13 different hockey players of different levels of skills and analysing it via a tracker software. We have also calculated the energy of the shots as a unifying parameter for both speed and frequency of rotation. We have seen that due to instability of the individual shots, it is rather hard to draw any conclusions for individual players. Each of them shot at least 10 shots both with the Renfrew tape and Specter tape, both by Wrist shot and Slap shot. It was not possible to increase the number of shots by one player due to different reasons – if doing more at once, it would lead to increased tiredness and decrease of performance. On the other hand doing it in more shifts would make it complicated to guarantee the same outer conditions, in particular the overall performance level of the player.

With these limited number of shots we have seen that for most cases, i.e. almost all players for all or almost all parameters, the harder and rougher surface achieved by applying of the Specter tape led to increase in performance: the shots were quicker and had higher frequency of rotation, which made them more stable on one side and harder to track by the goalie on the other. In most cases the change for individual players was smaller than the standard deviation. To capture the effect of the tape itself, collective statistical analysis was performed rather than analysing data for individual players independently. As parameters of shots vary greatly from player to player, we compared the changes as the unifying parameters and performed statistical tests on them (Student’s t-test and Wilcoxon signed rank test). We have seen that with very high confidence one can conclude that the harder and rougher surface leads to higher speed, rotation and energy of the shots. The expected gain is roughly 2.5% in speed, which translates (depending on the player) to about 0.75 m/s or almost 3 km/h. For Wrist shots, when shooting from 10 meters, it makes a difference of about 28cm in the shot trajectory, which is comparable to the diameter of the goalie catching glove.

For Slap shots, when shooting from the blue line (17, 3 meters), the average difference is as large as 40 cm. We argue that the results can be explained by two basic differences between surfaces achieved by applying Renfrew and Specter tape respectively. The first one is softer, what causes higher damping leading to smaller speeds and rotational frequencies. The later has also a rougher surface, which allows higher rotations even for the same speed, as well as longer contact between the blade and the puck. More detailed analysis of the shots itself would be needed for a more complex analysis, but this was beyond possibilities of our experimental equipment.

Methods

Experimental Methods

The primary motivation for setting up the experiment was to guarantee the most stable conditions for shooting players. Use of own equipment (stick, gloves), stable shooting conditions (shooting mat), stable room temperature and lighting guaranteed as stable experimental conditions as possible. Players were informed about the purpose of the study and voluntarily participated in it as expert collaborators; written informed consents were obtained from all the participating players in the study. Experiments were carried out in the Hockey Development Centre [1]. Players were shooting from stand and the puck was placed on a shooting mat, simulating conditions on ice. Distance to goal was approximately 6 meters, as described in Figure 5. Only those shots were taken into account that fitted into a small region of the goal marked by strings and spanning. The defined part of the net was a rectangle of 90cm x 82cm placed 20cm above the surface. Taking into account the findings of Paquette, et al. [17], the defined part did not include the top of the net. We decided not to include the bottom part of the net either.

biomedres-openaccess-journal-bjstr

Figure 5: Sketch of the experimental situation.

Only shots, where the puck was not sliding on the surface were considered successful, to prevent possible influence of the surface. Players were expected to shoot four series of 10 successful shots first using Renfrew tape for Wrist and Slap shots and then using Specter sticker, again for both Wrist and Slap shots. The overall efficiency of shots was more than 80% and the maximum number of shots needed for a single series was [16]. Renfrew tape wrapped from heel to toe in two partially overlapping layers on player’s blade, then the tape was removed and on the same stick Specter tape was applied. After a break of 10 minutes a series of the same shots was carried out. The hockey sticks used by the players were the following brands: CCM [18], Bauer and Easton [19], Sher-wood [20] and Warrior [21]. The whole experiment with one player took about 45 minutes, including the break. During this time period each player shot roughly 50 shots, what is comparable to a usual one hour training on ice, where further exercises are carried out as well. No statistically significant relationship between the time (order) of the shots and the speed or rotation frequency has been observed.

Shots were recorded about 2 meters from the release point with a digital high speed camera Sony RX100-V [22] on full HD resolution and 1000 fps. Three to four coloured dots (depending on the run) of different colours were positioned on each puck, one in the middle and the rest on the edge. Pucks were only coloured with paint not to influence the weight of the puck and to provide a smooth shooting motion for the players. Videos were downsampled by a factor of four and analysed by a tracker software. For some particular runs the software was not able to provide results due to low visibility of one of the dots or because of puck topple; in such cases the recording was analysed frame by frame by hand. Depending on the actual speed, about 30 frames were captured for each shot and on each frame the size of the puck (measured as the distance between centres of points on the edge) was about 35 pixels. This allowed to see about one period of rotation of the disc which was enough to calculate speed, rotation and energy of the individual shots.

Precision

An area of about 1 meter long was covered by the camera with 1980 pixels, leading to the resolution of about 0.5 mm per pixel. In post-processing the resolution was decreased for the tracker software by a factor of 2 in each axis, changing the resolution to about 1 mm per pixel. The size of the dot on the puck was about 1 cm in diameter with a precision of up to 1 mm, making it comparable to the pixel size. This led to a precision in speed of almost 0.1%, much better than the differences between different shots of the same type of the same player.

Rotation was read out using a series of angles formed by two dots placed closed to the border of the puck. With 76.2 mm diameter of the puck the distance between centres of the dots was about 50 mm, leading to a precision of 2 4% in the angle. This is substantially less than the speed itself, so frequency was calculated using the best linear fit of the increasing angle. Using this method the correlation coefficient between the experimental data and fit was in most cases in the range between 0.8 and 0.9. Lower precision in the frequency readout was connected also to the fact that the rotation of the puck was not necessarily around the main canonical axis. In many cases the puck was also carrying out precession, which led to deformation of the image of the puck and complications in read-out. However, all these effects were clearly having smaller impact onto the final results than the instability of the shots by individual players.

Measuring Friction Coefficient

We have measured the friction coefficients of both Renfrew and Specter directly with a puck of the same type as used during the experiment. We have glued Specter and Renfrew tape on the table on a path of about 25cm, where for Renfrew we have produced three different surfaces. In one case we simply glued a few long strips along each other (this way it is usually not used during playing, but the result shows basic physical properties of the tape). Two others had short strips glued perpendicular to the motion and partly covering each other, as players do on their blades. Here 11/14 one can define two different direction of motion, “uphill” and “downhill”, where the first corresponds to the way the tape was glued on the blade during our experiments. We have then slid the puck on the tape, fixed in a special cage holding the puck (of total mass including puck mp) on its side while sliding to prevent its rotation. The cage was fixed with a string via a pulley to a mass mw and the whole system was let to move freely. The motion was captured by camera and tracked to obtained the acceleration a of the system. The friction was then calculated by

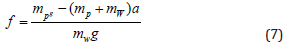
The results show f = 0:69±0:02 for Specter, f = 0:46±0:07 for Renfrew longitudinally, f = 0:43±0:08 transversely “downstairs” and f = 0:50±0:11 transversely “upstairs”. Thus we can conclude that the friction coefficient of Specter is significantly higher then of Renfrew.

Statistical Methods

For each set of about 10 shots of the same type of the shot and taping method we first defined outliers independently for speed and frequency of rotation, according to (1). Then all shots where either speed or frequency was specified as outlining were removed. This, in most of the cases, led to removal of no more 20% of shots. To test the assumptions of t-test, we performed Shapiro-Wilk normality test on speed, rotation and energy gains. Results (Table 3) show that normality of all parameters can not be ruled out for Wrist shots (P > 0.05), unlike for Slap shots, where the data seem to deviate significantly from normality (P < 0.05). Therefore, for Wrist shot gains we further use parametric Student’s t-test whereas for Slap shot gains we use non-parametric Wilcoxon (Mann-Whitney) signed rank test [14]. The research hypothesis is that gain in speed, rotation frequency and energy is significantly higher than zero, null hypotheses is that the gain is not positive.

P-values of statistical tests performed on gains are summarised in Table 3.

biomedres-openaccess-journal-bjstr

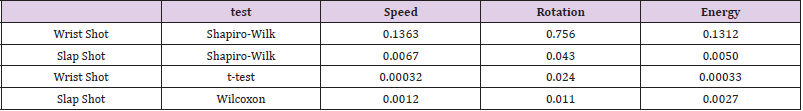
Table 3: P-values for significance tests. First two rows of Table shows results of Shapiro-Wilk normality tests of gains for all parameters for both Wrist and Slap Shots. For Wrist shots, all P-values are greater than 0.05 meaning the samples may be considered normal. Variances of each pair of samples under consideration can be considered equal according to the variance homogeneity test (P > 0.05). Thus all Wrist shot samples are considered parametric. However, for Slap Shots, the P-values are smaller than 0.05 suggesting the distributions of gains deviate significantly from normality and therefore Slap shot samples are considered non-parametric. The last two rows show results of statistical tests of whether gain in Speed, Rotation and Energy is significantly higher than zero. All P-values are smaller than significance level of 0.05, meaning Specter has a significant effect on gains in all three parameters.

All P-values are much smaller than 0.05, ruling out the null hypotheses that Specter does not improve performance. Apart from analysis on gains, we also performed paired tests on absolute speeds: paired t-test for Wrist shots and paired Wilcoxon test on Slap shots. Mathematically, a simple test on gains is by definition the same as a paired test on absolute speeds, up to a normalisation constant [14]. We also observed the results of paired tests to be very similar to the results on gains. As the gains, unlike the absolute numbers, are also comparable between players per se, we present here the results for gains. Table 3. P-values for significance tests. First two rows of Table shows results of Shapiro-Wilk normality tests of gains for all parameters for both Wrist and Slap Shots. For Wrist shots, all P-values are greater than 0.05 meaning the samples may be considered normal. Variances of each pair of samples under consideration can be considered equal according to the variance homogeneity test (P > 0.05). Thus all Wrist shot samples are considered parametric.

However, for Slap Shots, the P-values are smaller than 0.05 suggesting the distributions of gains deviate significantly from normality and therefore Slap shot samples are considered nonparametric. The last two rows show results of statistical tests of whether gain in Speed, Rotation and Energy is significantly higher than zero. All P-values are smaller than significance level of 0.05, meaning Specter has a significant effect on gains in all three parameters.

For More Articles: Biomedical Journal Impact Factor: https://biomedres.us

Open Access Journals on Medical Research

Practice of Self-Medication with Antibiotics Among the Adult Inhabitants in Dhaka City

Introduction

The World Health Organization has emphasized that selfmedication must be correctly taught and controlled as the selfmedication is a great threat for the health globally WHO, [1]. Antibiotic self-medication is highly prevalent in the developing countries due to easy availability. Resistance to commonly used antimicrobial drugs is remarkably high in countries where antibiotics are not restricted Sallam, et al. [2]. There are some other reasons like wider availability of medicine, greater choice of treatments, in preventing or reliving miner symptoms or condition, ailment was minor and financial constraint Jain, et al. [3]. Antibioticresistant infections also contribute to the financial burden on health care systems Gelband, et al. [4]. A study conducted in Bangladesh in 2014 found that 26.69% in Rajshahi city experienced self-medication with highest percentage of self-medicated medicines were metronidazole (50.43%), azithromycin (20.75%), ciprofloxacin (11.53%), amoxicillin (10.37%) and tetracycline (7.49%) respectively. The key reasons for the self-medication of antibiotics was the pre-experience (45.82%), Biswas, et al. [5]. A cross sectional study conducted in 2017 in Dhaka city found that undergraduate medical students were found to practice more selfmedication (78.1%) than the non-medical students (55.1%) Nasir, et al. [6].

Reason and Factors Influencing Self-Medication with Antibiotics

Parents medicate to their children to save money or to avoid a trip to doctor’s office Bennadi [7]. A number of reasons for selfmedication such as saving money and availability of drugs in drug shops are responsible for growing trend of self-medication Oluyemi [8]. Many studies showed that limited purchasing capability is a major determinant for self-medication with antibiotics in India, Nigeria, Philippines, Latino adults in the United States of America, and the non-Arab population in the United Arab Emirates. Pharmacy staff behavior can be a factor that puts patients at risk for self-medication with antibiotics Oluyemi, et al. [8,9]. Inappropriate Antibiotic and Nonprescription use of antibiotics can range from 19 percent to well over 90 percent outside the United States and Europe, Vietnam, in Saudi Arabia and Syria, pharmacies dispensed antibiotics without a prescription Van Boeckel, et al, [10].

OTC Drugs

Over the Counter (OTC) drugs are non-prescription drugs that are not normally covered by a Medicare Prescription Drug Plan. OTC medications are legal, non‐prescription substances taken for the relief of discomforting symptoms. Although OTC drugs are believed to be safe and effective, indeed they are not. They mask the underlying disease and may cause several adverse effects Parikh, et al. [11]. A prescription is an order that is written by the physician to tell the pharmacist what medication your patient wants to take Inlander, et al. [11,12]. Drugs that destroy microbes, prevent their multiplication or growth, or prevent their pathogenic action – Differ in physical, chemical, pharmacological properties, differ in antibacterial spectrum of activity, differ in their mechanism of action.

Worldwide Antibiotic Resistance Rates and Trends

In the United States, more than 2 million infections and 23,000 deaths are due to antibiotic resistance each year and in Europe, an estimated 25,000 deaths CDC, [13]. Antibiotic-resistant infections also contribute to the financial burden on health care systems Gelband Quet, et al. [4,14]. A vast majority (93%) of the patients were totally unaware of the possibility of side-effects Teck, et al. [15-17].

Parental Knowledge About Antibiotic Use/Discontinuation in Bangladesh

High percentage of parents thought that antibiotics could cure infections caused by viruses and also cold, fever and sore throat. Resistance to commonly used antimicrobial drugs are remarkably high in countries where antibiotics are not restricted Sallam, et al. [2]. In Bangladesh, increasing rates of antimicrobial resistance andthe prevalence of self-medication is thought to be high, as a result, minor illnesses are treated with antimicrobials which have potentially harm the individual Gutema, et al. [18- 21,3]. Many older adults independently manage their prescription and nonprescription (OTC) medications Keshari, et al. [22,23]. A majority of the prescribers diagnose infection by clinical assessment and suspect a microbial etiology Faiz, et al. [24].

Methods and Materials

The study is a Cross-sectional descriptive study andit was helpful to describe the current conditions and situations based on the impressions and views of the respondents of the study (Thomas et al., 2005). The study location was Azimpur, lalbagh, Kamrangirchar belongs to Zone-5 of Dhaka South City Corporation. These areas are highly populated, and it was feasible to find people or respondents from every economic status like lower, middle and higher socioeconomic. The total study duration was 10 months from May 2019 to February 2020.

Study Population

The target population was adult age group (18 or more than 18 years old). Both male and female were selected from any religion and socioeconomic status. Pre-tested, semi structured interview questionnaires. This balance was useful for a comprehensive analysis. Data was entered in Microsoft Excel and analysis was done by using descriptive statistics in Microsoft Excel 2010 and SPSS version 20.

Ethical Consideration

Permission was taken from Institutional Review Board (IRB) of American International University-Bangladesh (AIUB), the committee on activities involving human subjects.

Results

Distribution of the Respondents’ Socio-Demographic Variables

Among the total (140) participants, 37.9% participants were between the 18 and 28 years old, 33.6% between the 29 and 39 years old, 20.7% between the 40 and 50 years old, 5.7% between the 51 and 61 years old and 2.1% were 62 years and above. Among the respondents, 56.4% participants were male and 43.6% were female and among them 64.3% were married and 35.7% were unmarried. It reveals that the participants’ education level was as illiterate 6.4%, primary 10.7%, secondary 14.3%, SSC 13.6%, HSC 15.0%, graduation 20.0%, masters and other higher degrees also 20%. Graduation, masters and other higher degree holder participants were more in numbers than others.

Knowledge about Antibiotic Resistance among Medicated and Non-Medicated Group

The result demonstrates that 37 participants out of 79 (46.8%) consulted doctor and other 42 participants out of 79 (54.2%) didn’t consult reg. doctor. Among the 42 participants who didn’t consult MBBS/reg. doctor 14 participants (17.7%) visited local pharmacy and took suggestion/medicines, 10 participants (12.7%) consulted quack/village doctor/medical assistant, 9 participants (11.4%) medicated from home stored medicine/family/friends, 3 participants (3.8%) consulted doctor of alternative medicine (Homeopathy/Uniani/Ayuryeda/Others) and 6 participants (7.6) did other health seeking behavior (Figures 1 & 2).

biomedres-openaccess-journal-bjstr

Figure 1: Status of antibiotic use in last 12 months.

biomedres-openaccess-journal-bjstr

Figure 2: Gender based knowledge about antibiotics.

Antibiotics Medication and Gender

Status of antibiotic use among the antibiotic users: The rate of self-medication with antibiotics (53.16%) is higher than the use of antibiotics (Figure 3) prescribed by doctors (46.84%). Selfmedication number was higher in male (31.65%) than the female (21.52%) and alternatively the number of antibiotics prescribed by doctor was higher in female (29.11%) than the male (17.72%).

Antibiotic Medication and Education Level

Education plays an important role to grow up the level of health awareness. In this study, most of the persons whom education levels were “Primary” (11.39%) used antibiotics as self-medication in higher rate and most of the persons whom education level was “Master” (16.46%) used antibiotics as prescribed by reg. doctors in higher rate. Practice of antibiotic prescribed by doctors is gradually higher in higher education group and gradually lower in lower education group. Alternatively practice of self-medication with antibiotics is higher in lower education level and lower in higher education level (Figure 4). Practice of self-medication is higher in male persons (59.52%) and comparatively lower in female parsons (40.48%). Practice of self-medication is higher in married people (59.52%) and comparatively lower in unmarried people (40.48%). (Figure 4). Practice of self-medication is higher in lower education level (illiterate 4.76%, primary 21.43%, secondary 19.05%, SSC 16.67%, HSC 14.29%, graduation/honors 16.67% and masters and other higher degrees 7.14%).

biomedres-openaccess-journal-bjstr

Figure 3: Antibiotics Medication and Gender.

biomedres-openaccess-journal-bjstr

Figure 4: Self-medication with antibiotics and education level.

Antibiotic Medication and Income Level

Income is a vital factor to improve the health seeking behavior. In this study, most of the persons whom income level were BDT>40000 to 60000(15.19%) and BDT >80000(12.66%) used antibiotics as prescribed by doctor. But most of the persons whom income level were BDT<=20000(24.05%) used antibiotics as selfmedication. Practice of self-medication with antibiotics is higher in lower income level and practice of antibiotic prescribed by doctor is higher in higher income level (Figures 5 & 6).

biomedres-openaccess-journal-bjstr

Figure 5: Antibiotic medication and Income Level.

biomedres-openaccess-journal-bjstr

Figure 6: Medication Type and occupation among antibiotic users.

Gender and Source of Self-Medication with Antibiotics

The most common source of antibiotic for self-medication was “bought from private pharmacy without prescription” for male (38.10%) and for female (14.29%). ‘Previously stored antibiotics’ for male (11.90%) and for female (14.29%). ‘From family and friends’ for male (7.14%) and for female (9.52%) and other sources were for male (2.38%) and for female (2.38%) (Figure 7). The highest rate of used antibiotics for self-medication is Metronidazole (21.4%), secondly Ciprofloxacin (19.0%), Thirdly Azithromycin (16.7%). Cloxacillin (9.5%), Amoxicillin (7.1%), Cefixime (7.1%), Cefuroxime (2.4%), other antibiotics (2.4%) and under not sure (14.3%).

biomedres-openaccess-journal-bjstr

Figure 7: Gender and source of self-medication with antibiotics.

Use of Antibiotics (Self-Medication) and Diseases

Metronidazole was most commonly used for Dysentery (21.43%), Secondly Ciprofloxacin was used for Fever (11.90%) and Common cold (7.14%). Thirdly Azithromycin was used for Fever (4.76%), for Sore throat (4.76%), for Sinusitis (2.38%), for Injury (2.38%). Amoxicillin used for Common cold (4.76%) and for Cough (2.38%). Cloxacillin was used for Injury (4.76%). Cefixime was used for Sore throat (2.38%), for Cough (2.38%) and for Dental infection (2.38%). Cefuroxime was used for Sore throat (2.38%), other antibiotics were used for Dermatological condition (2.38%) and under not sure 7.14% for Fever and 4.76% for Dental Infection. Most of the people (whom taken antibiotic as self-medication) were taken antibiotic due to Dysentery fever (Figure 8).

Discontinuing Antibiotics after Starting with Self- Medication

Majority of the participants didn’t stop taking antibiotics (incomplete course of treatment) (59.52%), and some participants stopped taking antibiotics without completing the course of antibiotic (33.33%) and 7.14% participants were not sure (Figure 9).

biomedres-openaccess-journal-bjstr

Figure 8: Use of antibiotics (self-medication) and diseases.

biomedres-openaccess-journal-bjstr

Figure 9: Continuity antibiotics after starting with self-medication.

Cure Diseases after Self-Medicating with Antibiotics

30.95% participants reported that they were not cured after taking antibiotics (self-medication) although majority of the participants 66.67% reported that they cured from diseases after taking antibiotics (self-medication), 2.38% participants were not sure (Figure 10). The association between the gender and antibiotic use and that is statistically significant (P-value = .024). There is relationship among self-medication with antibiotics group, antibiotics prescribed by doctor and no use of antibiotics group. The association between the income level and antibiotic use and that is statistically significant (P-value = .017). There is relationship among self-medication with antibiotics, antibiotics prescribed by doctor and no use of antibiotics group with income level. Practice of antibiotics varies on the income level. Income has an effect on use of antibiotic practice.The association between the education level and antibiotic use and that is statistically significant (P-value = .002). There is relationship among self-medication with antibiotics, antibiotics prescribed by doctor and no use of antibiotics group with education level. There is relationship of self-medication with antibiotics, antibiotics prescribed by doctor with education level.

The Chi square test showing that there is no association between education and self-medication with antibiotics and no use of antibiotics (P-value= .357). Statistically there is no significant. There was strong association between the education and antibiotic user prescribed by doctor and that is statistically significant (P-value = .012). There is relationship of antibiotics prescribed by doctor with education level. There was strong association between the income level and antibiotic user prescribed by doctor and that is statistically highly significant (P-value = .000). There is a strong relationship of antibiotics prescribed by doctor with income level. Practice of antibiotics prescribed by doctor varies on the income level. Higher income leads to the visit of registered doctor and proper practice of antibiotic use (prescribed by doctor).

biomedres-openaccess-journal-bjstr

Figure 10: Rate of cure after self-medicating with antibiotics.

Discussion

A study conducted in Rajshahi city of Bangladesh in 2014 found that 347 (26.69%) out of 1300 participants in Rajshahi city experienced self-medication with antibiotics Biswas, et al. [5]. The percentage of self-medication has been increased more than previous years which is very alarming. The selection of antibiotics in a study conducted in Dhaka city found that the reasons behind the self-medication was ‘minor illness’ (40%) and ‘confidence on self-knowledge’ (33%) among the medical students; whereas the main reason among non-medical students was ‘need immediate relief’ (24%) Nasir, et al. [6]. Antibiotic-resistant infections also contribute to the financial burden on health care systems Gelband, et al. [4]. Antibiotic prescribed by doctor group 13.57% know more about antibiotic resistance than self-medication 4.29%. The rate of self-medication with antibiotics (53.16%) is higher than the use of antibiotics prescribed by doctors (46.84%). Another study conducted on “Self-medication with antibiotics in Lithuania” in 2006 found higher prevalence of self-medication with antibiotics Berzanskyte, et al. [25]. It might be a global problem especially in developing countries Sallam, et al. [2].

Self-decision by previous experience/confidence was higher in age group 40-50 years. A study found that the parents who medicate their children do so in order to save money or to avoid a trip to doctor’s office Bennadi, [26-41]. Another study found that a number of reasons could be counted for self-medication such as strong desire of self-care, feeling of sympathy towards family members in sickness, previous experience of having antibiotic, lack of health services, saving money, ignorance, misbelieves, extensive advertisement and availability of drugs in other than drug shops are responsible for growing trend of self-medication and most importantly weak implementation of regulation related to medicines Oluyemi [8]. Most of the people (whom taken antibiotic as self-medication) were taken antibiotic due to Dysentery fever. Ciprocin, Metronidazole and Azithromycin, Cloxacillin and Amoxicillin were mostly used as 500mg dose. Daily frequency of taking antibiotics twice daily was most frequently practiced and the Ciprocin was highly practiced twice daily and secondly Azythromycin. Thrice daily was also most common for Metronidazole.Another study conducted in Bangladesh in 2014 also found that the highest percentage of self-medicated antibiotics was metronidazole (50.43%) followed by azithromycin (20.75%), ciprofloxacin (11.53%), amoxicillin (10.37%) and tetracycline (7.49%) respectively. The key reasons for the self-medication of antibiotics was the pre-experience (45.82%), suggestions from others (28.24%) and knowledgeable of the antibiotics (16.14%) Biswas, et al. [10].

There was strong association between the gender and antibiotic use and that is statistically significant (P-value = .024). The association between the income level and antibiotic use and that is statistically significant (P-value = .017). The association between the education level and antibiotic use and that is statistically significant (P-value = .002). There is strong association between the education and antibiotic users (self-medication and prescribed by doctor) and that is statistically highly significant (P-value = .000). Statistically there is no association. There was strong association between the income level and antibiotic user prescribed by doctor and that is statistically highly significant (P-value = .000). There was a strong relationship of antibiotics prescribed by doctor with income level. Income has an important effect on use of antibiotic practice (prescribed by doctor.

Conclusion

The practice of self-medication is higher in lower income andeducation level as these groups might have less knowledge about side effects and it is statistically significant also. The most common self-medicated antibiotics were Metronidazole, secondly Ciprofloxacin and thirdly Azythromycin. Antibiotics were selfmedicated mostly for the Dysentery, Fever, Common cold and Sore throat. Most of the participants’ source of antibiotics for selfmedication was private pharmacy and bought antibiotics from the pharmacy without prescription. Visiting pharmacy was the most common health seeking behavior among the participants who selfmedicated with antibiotics.

For More Articles: Biomedical Journal Impact Factor: https://biomedres.us

Open Access Journals on Biomedical Research

Disabled Afghan Refugees in Iran: Beginning for the Future

Introduction

Afghan refugees’ population is estimated at over 950,000 in Iran [1,2] and most of them are living in urban areas [2] and out of camps [3] where are considered unsafe and poor environments [4]. It has been well known that delivering services are directly or indirectly affected by demographic characteristics of the refugees’ population [5,6], for example, the prevalence of chronic diseases can be higher in the older population [6]. On the other hand, providing services such as combined primary care and mental health have more obstacles when we are in contact with specific populations such as refugees [7] mostly as a result of differences in their attitude and believe [4]. Although as a result of the new registration system in Iran named Amayesh, more demographic characteristics and information has been collected [8] and few studies had performed on the health status of Afghan refugees in Iran [9] (as main purpose [4,5,10] or as a part [11-14] of those studies), there is, unfortunately, no accurate data and information regarding the prevalence of disability, its incidence and sociodemographic characteristics of disabled Afghan refugees in Iran. This may partly be because of the out-of-camp living of Afghan refugees in Iran [3] which makes data collection harder. The United Nations High Commissioner for Refugees (UNHCR) and The State Welfare Organization of Iran (SWO) are collaborating to provide rehabilitation services, assistive devices and equipment, and rehabilitation and treatment costs for disabled refugees in Iran [1,2]. Accessing that information will help SWO and other partners for better service deliveries and the sustainability of projects in the future. The main objective of our descriptive study is providing and obtaining sociodemographic characteristics of disabled Afghan refugees participating in a joint project of UNHCR and SWO in Golestan province, Iran between June until December 2015.

Materials and Methods

Data Collection

This study was a part of a joint project for disabled Afghan refugees in Iran between UNHCR, the Bureau for Aliens and Foreign Immigrants Affairs (BAFIA) of the Ministry of Interior of Iran, and SWO in 14 Provinces between June until December 2015 (project number: UNHCR 15/IRN/SWO/180). Golestan province is located in the northeast of Iran and for this project. we had 40 disabled Afghan refugees recruited based on information and profile of disabled Afghans in Gorgan city Welfare Administration. In total, there were 136 disabled Afghan refugees have been registered in the Golestan Welfare Administration. We included the first 40 individuals with a complete profile and passed a special commission to approve their disability type and its severity. During the project, two Afghan facilitators were trained by the province Welfare Organization to collect data and facilitate the delivery of rehabilitation services including individual and family education, assistive devices, medical follow-up, and providing basic needs.

Ethics Approval

Afghan refugees’ Information and data were used and analyzed by agreement of the Golestan Welfare Administration. All attention was paid to information confidentiality.

Statistical Analysis

The STATA SE v.12 (STATA Corporation, College Station, Texas) was used for analysis. We were cross-tabulated sociodemographic characteristics of the study population to calculate and present total and by sex prevalence.

Results

There were 40 individuals including 28 men with a mean age of 31.89 ± 18.07 (age range 8-72 years) and 12 women with a mean age of 19.67 ± 14.36 (age range 1-57 years). Most of the individuals (40.00 %) belong to the age group of 11-20 years old and single (72.50 %). Half of the sample lived in the urban area and 82.50% of them did not have any educations and were mostly unemployed (72.50 %). There was no individual with a university education. Almost all of the individuals lived in the rental house (95.00 %). There were not any individuals without a caretaker, but 75.00 % of them were cared for by one of the family members of which, 62.50 % of them were cared by their father and only 25 % were self-helped. Only 7 individuals had another disabled in their family (Table 1). In total, 42.50 % of individuals had Physical and motor disabilities. There were 42.50 % of individuals had a severe disability Table 2 showed information regarding disability types and severity among men and women. From 40 individuals, there were more men with physical and motor (35.71 %) and mental retardation (32.14 %) disabilities. Among 12 women, about 58% had physical and motor disabilities. In both sex, individuals with severe disability was more prevalent (men= 42.50 %, women= 50 %).

biomedres-openaccess-journal-bjstr

Table 1: Sociodemographic Characteristics.

Note: Results are presented as n (%) or mean ± standard deviation.

PCI: Percutaneous Coronary Intervention; CABG: Coronary Artery Bypass Graft; PAD: Peripheral Arterial Disease; CRF: Chronic Renal Failure; TIA: Transient Ischaemic Attack; CVI: Cerebrovascular Insult; CEA: Carotid Endarterectomy; CAS: Carotid Artery Stenting; CTA: Computer Tomographic Angiography.

biomedres-openaccess-journal-bjstr

Table 2: Disability Characteristics.

At the beginning of this project, none of the individuals had healthcare insurance. But, during the project they could get the Salamat Health Insurance booklet (the universal public health coverage scheme in Iran) [1], therefore we did not show this information. Of 40 individuals, none of them had official training.

Discussion

Up to our search and knowledge, there were no published papers regarding disabled Afghan refugees’ status in Iran. This is a descriptive study as a part of a joint project between SWO, UNHCR, and BAFIA on disabled Afghan Refugees in Golestan province, Iran. There were 40 disabled Afghan refugees with mostly physical and motor disabilities who had received rehabilitation services and basic needs. Most of the individuals were without education and unemployed which can hinder any sustained empowerment of them. There are different partners with UNHCR for protecting, educating, health, and increasing the self-reliance of Afghan refugees in Iran [1,2]. This is a golden opportunity when Iran health system is faced with a high burden [4], so this capacity can be used to decrease the expenditure of the national health system [14], a succession of the international project, and the probability of the individual’s empowerment as an ultimate goal of the projects. Although only 12 women were in this project, we must consider cultural barriers, different attitudes, and being a refugee to participate in society [4]. In addition, service delivery for refugees living out of the camp is more difficult than residence in camps although they settled in urban areas and cities [6], and living space can affect individual’s health through their insight and type of relationship with those environments [15]. Although access to the number of health services such as family planning is the same for all individuals in Iran, the study showed lower usage by Afghans [4]. Therefore, programs and projects must-have elements and factors to integrating refugees into those societies besides providing rehabilitation, treatment costs, assistive devices, and environment adjustments.

Having one family member as a caretaker, although can reduce disability side effects and can lead to low family income especially when a father or mother with older ages becomes a caretaker and there might be an ambiguous future for them after losing their caretaker. This can also, besides low socioeconomic status, unemployment, and low grades of education may increase food insecurity [16] which may aggravate disability. Therefore, having an insurance system that covers both treatment and rehabilitation costs and pension payments can help them to have a better quality of life. Comprehensive health insurance would be one way for lowering out-of-pocket payments for using rehabilitation and health care services when it is almost the same as other citizens’ insurance. Health insurance in itself may not guarantee better access to health services for refugees. Since this coverage is at the very beginning steps, studies must be carried (both qualitative and quantitative) to discover accessibility, advantages, disadvantages, barriers, and the attitudes of refugees using services. Iran’s government has started to repatriate Afghan refugees but on the other hand, education, medical treatments, work, and economy have been reported as the main concerns of refugees to return to Afghanistan [8]. This situation may become more prominent for disabled refugees. Therefore, more comprehensive planes and dedicated projects to empower refugees are needed to facilitate repatriation. Changing trends from no education for girls towards educating them at any costs, as a result of staying in Iran during the past years, can be used as an opportunity for a succession of educational projects [8], although most of our disabled refugees remained without education. A program such as family planning and reproductive health was successful in the Afghan refugee society through shifting attitudes and beliefs [3] which indicates the possibility of making changes among them to achieve disability prevention.

Limitations and Strengths

The main limitations were the unwillingness of refugees and their families to participate and attend in disability assessment commissions and projects in addition to difficulties to have accurate information when asking sensitive questions such as housing and employment status. We were not able to collect income information of refugees since they did not have regular and monthly paid jobs. These limits may be partially or completely due to fear of returning to Afghanistan [16]. Although we had training sessions for our facilitators, a longer period of education with more materials would increase their competence. Inability to have and involve undocumented disabled refugees [17] in this and similar projects was another problem since they live in the society, not in camps. As a strength, we used Afghan facilitators to make better trust and tackle the language and ethnic barriers.

Conclusion

Although joint programs are comprehensive and may lead to better service delivery to those marginalized groups including refugees, cooperating organizations and sectors need to be in line with the goals of those programs.

For More Articles: Biomedical Journal Impact Factor: https://biomedres.us

Open Access Journals on Biomedical Research

Biomarker of Cerebral Injury S100 During Carotid Endarterectomy

Introduction

Carotid Endarterectomy (CE) is a surgical procedure that has been widely accepted as the appropriate means to reduce the likelihood of Ischaemic Stroke (IS) in the setting of severe carotid artery stenosis. A possible complication of the surgery may be IS. The main cause of a cerebrovascular insult is reduced blood flow through the brain during cross clamping of the Internal Carotid Artery (ICA). Immediate and correct recognition of insufficient collateral flow is crucial for a good outcome of the vascular surgery [1]. General use of a temporary vascular bypass (shunt) during surgery increases the complexity of the endarterectomy and may injure the vascular wall, leading to thromboembolism [2]. This implies the need for neuromonitoring to select patients who will benefit from shunt insertion [3]. Patients undergoing CEA under Local Anaesthesia (LA) are monitored clinically, preferably with neuromonitoring, which enables a more appropriate shunt insertion than other methods [4].

This is not possible in patients undergoing surgery in general anaesthesia, and therefore a suitable method of good neurological monitoring is being sought for these patients. Objective value of methods of monitoring patients during CEA was evaluated by studying serum levels of biochemical markers of brain injury. One of the most investigated is the serum protein S100B [5]. The neuroprotein S100B is a subunit of calcium-binding protein B identified in astroglia and Schwann cells. S100B’s function has yet to be fully explored and defined. At nanomolar concentrations, S100B stimulates axon development and neuronal survival. At micromolar levels, it causes apoptosis and increases the production of inflammatory cytokines [6]. Even during clinically atypical CEA, S100B in peripheral blood is a sensitive sign of Blood-Brain Barrier (BBB) failure and ischemic brain injury [7,8]. Peak S100 B levels can be found as early as 20 minutes after brain injury. On the other hand, it has a biological half-life of 30 to 113 minutes and is eliminated quickly by the kidneys [9]. In the previous decade, concerns regarding mild, subclinical brain harm after carotid revascularization have been raised [10].

Cappocia [11] et al. analyzed SB100 values as continuous and categorical data and found that they can be correlated with subclinical brain injury to some extent. Sahlein [12]. Inserted a 6 French Fogarty catheter rostral to the jugular bulbus through the facial vein. Fifteen minutes after carotid artery blockage, S100B levels in the jugular bulbus were considerably higher compared to baseline values. Some studies linked slight cerebral injuries following CEA and a large increase in serum S100B levels [13,14]. Several studies have found a large increase in S100B levels after declamping [15,16], followed by a reduction in S100B levels 24 hours later [10,17]. Falkensammer [18] investigated the relationship between perioperative levels of the molecular marker S100B and the likelihood of subclinical abnormalities in cerebral function and mild cerebral injury following CEA. Aleksic [4] observed a small but considerable increase in arterial S100B levels during carotid ventricular declamping.

NIRS (near-infrared spectroscopy) is a technique for determining regional oxygen saturation (rSO2). NIRS monitoring was employed in our department during CEA in all patients. A near-infrared light (NIR) emitting element is placed on the skin above the forehead to perform NIRS. Because NIR light penetrates through human tissue, some of it passing through the skin, subcutaneous tissue, and bone. The cerebral parenchyma reflects some of the light that reaches the brain. At particular wavelengths, the reflectance of brain tissue is substantially determined by the concentration of oxygenated haemoglobin in the tissue. The device records the amount of reflected photons as a function of wavelength by detecting the reflected photons. The INVOS system determines tissue oxygenation by measuring the amount of reflected light at wavelengths of 730 and 810 nm and calculating the regional oxygen saturation of haemoglobin (rSO2 index, sometimes known as simply rSO2) [19]. The aim of this pilot investigation was to see if a raised serum S100B level or a decrease in rSO2 following carotid revascularization with CEA might be used to detect neurological instability in CEA patients. Increased serum S100B levels during CEA, we hypothesized, would be linked to neurological symptoms after surgery.

Patients and Methods

Study Population

A prospective observational study design was performed with patients admitted to the Department of Vascular Surgery of Novo mesto General Hospital who underwent CEA between. Sixty adults (41 men, 19 women) between the ages of 50 and 86 years who underwent 64 CEAs over a 12-month time period were studied. The approval of the National Medical Ethics Committee of the Republic of Slovenia was obtained; written informed consent was obtained from all the patients. Indications for CEA included ipsilateral neurological symptoms (stroke, Transient Ischaemic Attack [TIA], amaurosis fugax), with ≥50% ICA stenosis, and both symptomatic and asymptomatic patients with 70% to 99% stenosis.

Carotid Endarterectomy

Twenty-six patients were symptomatic, and all were scheduled to undergo CEA with regional anaesthesia achieved by the combination of superficial and deep cervical plexus block (100 mg levobupivacaine + 200 mg lidocaine). After carotid clamping, neurological assessment was performed by having the patient squeeze into the contralateral hand and speak. Neurological assessment was continuous throughout the operative procedure at 3-min intervals. The patients were assigned to one of two groups: those who developed neurological symptoms (neurological symptoms group) during clamping and those who did not (no neurological symptoms group). Criteria for the neurological symptoms group were development of motor weakness, slurring of speech, inability to respond appropriately to verbal commands, loss of consciousness, or seizure. These were also used as criteria for insertion of a shunt or anticipating a very short clamp time with primary closure. The patch closure was performed in 58 CEAs, with primary closure in 6.

Cerebral Oximetry

The cerebral oximeter INVOS 5100C (Somanetics) was used to measure simultaneous, bilateral rSO2 throughout the procedure. During surgery, brief and variable degrees of cerebral ischaemia occur during cross-clamping of the ICA [20,21]. The pre-clamping bilateral rSO2 value and the lowest ipsilateral measurement after ICA clamp placement were recorded. Inter subject variability in rSO2 index values is well known and was noticed in this study. To facilitate comparison of rSO2 changes after carotid cross-clamp among all patients, and to determine the magnitude of rSO2 change that was associated with a change in neurological function, the rSO2 data were normalised by calculating a percentage change in rSO2 reading during cross-clamp periods in each patient according to a formula (Figure 1). On the basis of previous studies [22], a decrease in rSO2 of ≥12% was considered clinically significant.

biomedres-openaccess-journal-bjstr

Figure 1: Thus, a change of rSO2 reading from a mean preclamp value of 60% saturation to a minimal (after cross-clamp) of 54% saturation according to this formula would represent a 10% decrease in rSO2 reading (percentage change = 10%).

Serum Biomarker of Brain Injury

Venous blood samples were obtained for each patient preoperatively (basal sample, preclamp), immediately after the end of the procedure (declamp), and 12 hours, 24 hours, and 48 hours after the surgery. Samples were allowed to clot. Blood samples were centrifuged within 30 minutes, and serum was stored at –20°C until assayed in duplicate in a single batch within 6 months. The concentrations of protein S100B and NSE were measured by automated electrochemiluminescence assay (Cobas e411 analyser, Roche Diagnostics, Mannheim, Germany). The lower limit of detection for protein S100B was 0.005 μg/L. The upper reference limit of protein S100B was set at 0.105 μg/L, representing the 95th percentile of the healthy population. The reference limit was provided by the manufacturer of the assay and verified by the laboratory. We compared the baseline value with the sample taken immediately after the end of the procedure. An increase of 25% was considered abnormal [11].

Statistical Analysis

The lowest values of rSO2 and highest values of S100B were used for comparison between the no neurological symptoms and neurological symptoms groups. The baseline characteristics of patients who developed neurological symptoms were compared with the patients with no symptoms using the chi-square test or Fisher exact test, where appropriate. In the case of continuous variables, the independent samples t-test or Mann-Whitney test was used. Of these results Positive Predictive Value (PPV), Negative Predictive Value (NPV), positive Likelihood Ratio (LR+), Negative Likelihood Ratio (LR-) and Diagnostic Odds Ratio (DOR) with 95% Confidence Intervals (CI) were calculated. ROC curve analysis was applied to identify the threshold values of parameters and the Area Under the Curve (AUC) values were compared. Statistical analysis was performed with R 3.5.2 statistical software (R Foundation for Statistical Computing, Vienna, Austria). A p-value less than 0.05 was considered as statistically significant.

Results

Baseline Characteristics

In this study, 64 CEAs were performed under regional anaesthesia. There were 41 (67%) men and 19 (33%) women; patient mean age (±SD) was 70.9 ± 8.5 years (range, 50-86 years). Two men and two women were operated bilaterally. Fifty-nine per cent of the CEAs were performed for asymptomatic disease, in comparison with 41% for symptomatic disease.

Demographics, Anatomy, and Pre-Operative Variables

There were no differences (Table I) in diabetes mellitus, hypertension, smoking, hypercholesterolaemia, coronary artery bypass graft, and chronic renal failure or peripheral artery disease between those with and without neurological symptoms. There were no significant differences in rates of overall prior carotid intervention, symptomatic features, contralateral carotid stenosis grade, or pre-operative diagnostics between the two groups. However, ipsilateral carotid stenosis grade of 50–69% (43% vs. 12%) were more common in those with neurological symptoms and ipsilateral carotid stenosis grade of 70–89% (57% vs. 88%) were more common in those without neurological symptoms (P = .056).

biomedres-openaccess-journal-bjstr

Table 1: Baseline characteristics of no neurological symptoms (NS-) and neurological symptoms (NS+) group.

Note: Results are presented as n (%) or mean ± standard deviation.

PCI: Percutaneous Coronary Intervention; CABG: Coronary Artery Bypass Graft; PAD: Peripheral Arterial Disease; CRF: Chronic Renal Failure; TIA: Transient Ischaemic Attack; CVI: Cerebrovascular Insult; CEA: Carotid Endarterectomy; CAS: Carotid Artery Stenting; CTA: Computer Tomographic Angiography.

Operative and Post-Operative Variables

Neurological deterioration after carotid clamping occurred (neurological symptoms group) in 7 (10.9%) operations. Neurological change resolved after insertion of an intravascular shunt. The median [1stQ, 3rdQ] duration of carotid cross-clamping were 23.2 [19.8, 28.9] minutes and 20.9 [12.4, 29.2] minutes in the no neurological and neurological symptoms groups, respectively (Table 2). This difference was not statistically significant (P=.519). A prosthetic patch was used in 58 (90.6%) procedures and primary closure in 6 (9.4%) procedures.

S100B

biomedres-openaccess-journal-bjstr

Table 2: Operative in post-operative factors in patients without Neurological Symptoms(NS-) and patients with Neurological Symptoms (NS+) during CEA.

Note: Results are presented as median [interquartile range].

CEA = carotid endarterectomy; rSO2 = cerebral oxygen saturation; S100B = protein S100B.

Median [1stQ, 3rdQ] baseline serum levels of protein S100B in the asymptomatic patients and symptomatic patients were 0.030 [0.021, 0.053] and 0.037 [0.025, 0.060], respectively. There were no significant differences in baseline preclamp concentrations of protein S100B between the patients (P = .456; Mann-Whitney U test). Percentage of increase in S100B parameter at different timeframes for the no neurological symptoms and neurological symptoms groups are depicted in Figure 2. The median serum S100B level increase was 36.2% [6.9%, 79.0%] (median [1stQ, 3rdQ]) in the neurological symptoms group, compared with –2.7% [–30.9%, 25.5%] (median [1stQ, 3rdQ]) in the no neurological symptoms group. The highest increase of serum S100B protein was 209%. The increase was significantly different between the groups (P = .040; Mann-Whitney U test) (Figure 2). This finding indicates that neurological instability that occurs after clamping correlates with the increase in S100B level. Neurological change could be predicted as a function of a 25% increase of S100B marker. Applying this technique, the Area Under the Curve (AUC) was 0.7393 (95% confidence interval CI = [0.5472, 0.9315]), and the diagnostic sensitivity and specificity were 71.4% and 75.4%, respectively. The threshold for S100B of 22.5% increase was optimal to identify patients with neurological symptoms (Figure 3 & Table 3).

biomedres-openaccess-journal-bjstr

Figure 2: Percentage of increase in S100B parameter at different timeframes for the no neurological symptoms and neurological symptoms groups.

biomedres-openaccess-journal-bjstr

Figure 3: ROC curve for performance of S100B declamp percentage change in prediction of neurological symptoms. The closest top left point is at threshold value 22.5% with sensitivity of 71.4% and specificity of 75.4%. The area under the curve is 74% (95% CI: 55-93%).

Cerebral Oxygen Saturation

The decrease in rSO2 from the preclamp to cross-clamp period on the ipsilateral side was not statistically significant between the groups. The median rSO2 decrease was 15% [6%, 21%] (median [1stQ, 3rdQ]) in the neurological symptoms group vs. 10% [6%, 19%] (median [1stQ, 3rdQ]) in the no neurological symptoms group (P=.675, Mann-Whitney U-test). The correlation between changes in rSO2 and neurological symptoms was analysed and by ROC analysis, a cut-off of rSO2 decrease of 13.4% was determined to be optimal for identifying patients with neurological symptoms, AUC = 0.5489, 95% CI = [0.3327, 0.7651]. Sensitivity and specificity were 57.1% and 63.2%, respectively (Figure 4 & Table 3).

biomedres-openaccess-journal-bjstr

Table 3: Results of ROC curve analysis with threshold values.

Note: Results are presented as value (95% CI).

AUC: Area Under The Curve; rSO2: Cerebral Oxygen Saturation; S100B: Protein S100B.

biomedres-openaccess-journal-bjstr

Figure 4: ROC curve for performance of rSO2 post-clamp percentage change in prediction of neurological symptoms. The area under the curve is 55% (95% CI: 33-77%).

Contralateral Carotid Occlusion

There were no statistically significant differences between contralateral carotid occlusion and neurological symptoms (P=1), contralateral carotid occlusion and serum S100B increase (P=.466), or contralateral carotid occlusion and rSO2 fall (P=.418).

Prediction of Neurological Symptoms

The PPV for the prediction of neurological symptoms during the CEA was 16% for the rSO2 parameter; for the S100B parameter the values were 26% for declamp, 22% for 12h post-operative, 19% for 24h post-operative, and 14% for 48h post-operative. The NPV for the rSO2 parameter and S100B parameter at different timeframes were 92%, 96%, 91%, 92% and 91%, respectively (Table 4). However, in terms of LR considered as minimally predictive, the declamp S100B parameter had amongst other measurements the highest LR+ (2.9, 95% CI: 1.5-5.6) and lowest LR- (0.4, 95% CI: 0.1- 1.2). Also in terms of DOR, this parameter performed best (7.7, 95% CI: 1.4-44.0).

biomedres-openaccess-journal-bjstr

Table 4: Performance of rSO2 and S100B parameters in prediction of neurological symptoms.

Note: Results are presented as value (95% CI).

rSO2: cerebral oxygen saturation; S100B: Protein S100B; PPV: Positive Predictive Value; NPV: Negative Predictive Value; LR+: Positive Likelihood Ratio; LR-: Negative Likelihood Ratio; DOR: Diagnostic Odds Ratio

Peri-Operative Outcomes

Two (3.1%) perioperative strokes occurred. The single major stroke happened on day 6, and the patient had decreased responsiveness to verbal commands and developed left hemiplegia. The diagnosis of stroke was based on the clinical and computed tomography finding of a focal ipsilateral ischaemic cerebral infarct with a patent CEA site on angiography. The patient was asymptomatic. The other patient had mild neurological deficits with complete recovery without re-exploration of the carotid artery. The patient was symptomatic. Both patients were shunted, and had normal rSO2, and increased S100B markers.

Discussion

The key conclusion of this pilot investigation was that increased serum levels of S100B protein, a brain marker, were associated with increased neurological instability. A statistically significant difference was only revealed by decapitation measurements and disregarded by 12-, 24-, and 48-hour post-operative measurements. The early mechanism of S100B release, which happens minutes later, is still unknown. The low amount of hypoperfusion associated with carotid artery occlusion may cause minor blood-brain barrier disruption, which could explain the early rise of serum S100B. [12,23]. Although S100B been linked to cerebral ischaemia, developing it into a biomarker for differential diagnosis in clinical practice has been problematic [24,25]. Several writers have claimed that elevated levels of S100B in the blood are not unique to stroke, claiming that the rise occurs in other neurological disorders with similar symptoms [26].

During carotid clamping, seven (10.9%) of the patients who needed shunting developed cerebral ischaemia (neurological deficit). These findings for CEA in conscious patients are similar to those reported by Hans [27] (10%), Evans [28] (9.7%), Calligaro [29] (7.2%), Stroughton [30] (14%), and Rockman [31] (11%). Of the 7 patients who required shunting due to a lack of compensatory blood flow, five patients were in the S100B-positive group. With a sensitivity of 71.4 percent and a specificity of 75.4 percent, we were able to predict neurological alterations in connection to an increase in the S100B marker. A 22.5 percent rise in neurological symptoms was used as the threshold value. Because of the lengthy test process, measuring serum S100B protein for perioperative neuromonitoring is currently not possible. Existing assays lack sensitivity and are difficult to use, and they often take 3 hours to complete. For the measurement of S100B protein, a quick and sensitive immunoassay would be required.

Furthermore, when compared to results acquired after carotid surgery under general anaesthetic, the observed rise in serum S100B protein during transverse clamp in LA was less pronounced (GA). In our study, the average rise in S100B was 12 percent. During CEA in the LA, Aleksic [4] observed a rise of 18% in serum S100B levels. Jaranyi [32] found a 170 percent increase in serum S100B levels in patients undergoing CEA while under GA. This indicates relevant global cerebral ischaemia. S100B levels and cerebral ischaemia alterations in patients undergoing CEA under LA are unlikely to apply to patients undergoing CEA under GA [29].

Symptomatic patients had greater preclamp S100B concentrations than asymptomatic patients. The median baseline serum S100B protein levels were 0.037 g/L and 0.030 g/L, respectively. The difference (P = 456) was not statistically significant. S100B protein peak levels could be identified as early as 20 minutes after cerebral injury. Its biological half-life ranges from 30 to 113 minutes, and it is quickly excreted by the kidneys. Concentrations return to near pre-clamp levels 24 hours after surgery, and by the third post-operative day, they recover completely. In our investigation, all symptomatic patients were operated on more than 72 hours after the onset of carotid symptoms. There were no expected significant variations in baseline S100B protein levels between asymptomatic and symptomatic individuals before surgery. Dragas [10] discovered that symptomatic patients had considerably greater preclamp S100B concentrations. He attributed this to greater embolic potential of symptomatic carotid plaques.

In the group with neurological symptoms, the decline in rSO2 from the preclamp to the cross-clamp period on the ipsilateral side was not significantly greater (P =675). Furthermore, the low AUC value shows that the link between rSO2 percentage reduction and neurological symptoms is at best shaky. In recognizing patients with neurological symptoms, the relative decline in rSO2 is neither sensitive (57.1%) nor specific (63.2%). These findings do not support cerebral oximetry as the sole monitoring modality during carotid endarterectomy. When comparing groups, the absolute lowest value of rSO2 on the contralateral side was statistically different (P =042). This has no clinical implications because baseline rSO2 measurements vary greatly between individuals [33,34]. The range of baseline rSO2 values is large, ranging from 47% to 86%. Rather than using absolute numbers, relative changes in rSO2 should be used [35]. One of the existing rSO2 monitoring’s drawbacks is that the oxygen sensor can only be utilized on hairless scalps.

Other areas of the brain may acquire focal cerebral ischaemia without the drop in rSO2 seen by the scalp sensors [20]. After an abrupt fall in blood flow in brain tissue (which may involve an exponential decrease in tissue oxygenation) with compensation for blood pressure variations, secondary dilatation of the microcirculation due to autoregulation or opening of collateral arteries occurs [36]. Even if intracranial collateral anastomoses exist, they are insufficient to sustain baseline intracerebral oxygen saturation in the brain. The presence of moderate reductions in rSO2 has not been linked to cerebral hypoperfusion severe enough to cause cerebral ischaemia [1]. The crucial rSO2 drop that the brain can endure is unknown.

One of the existing rSO2 monitoring’s drawbacks is that the oxygen sensor can only be utilized on hairless scalps. Other areas of the brain may develop focal cerebral ischaemia without a drop in rSO2 registered by the scalp sensors [20]. After an abrupt fall in blood flow in brain tissue (which may involve an exponential decrease in tissue oxygenation) with compensation for blood pressure variations, secondary dilatation of the microcirculation due to autoregulation or opening of collateral arteries occurs [36]. Even if intracranial collateral anastomoses exist, they are insufficient to sustain baseline intracerebral oxygen saturation in the brain. The presence of moderate reductions in rSO2 has not been linked to cerebral hypoperfusion severe enough to cause cerebral ischaemia [1]. The crucial rSO2 drop that the brain can endure is unknown.

A 13 percent (13.4 percent) reduction in rSO2 was found to be best for detecting individuals with neurological symptoms in our study, with sensitivity and specificity of 57.1 percent and 63.2 percent, respectively. The results were identical to those of Al- Rawi [21] and Mille [22], who used cut-off values of 13% and 12% (11.7%), respectively. There were 8 patients with contralateral carotid occlusion among them. One exhibited neurological symptoms, one had an elevated S100B level in the blood, and two had a considerable drop in rSO2. The need for a shunt is not consistently predicted by contralateral carotid occlusion. Two patients experienced a cerebrovascular insult (CVI). The patient suffering CVI during the procedure exhibited the largest rise in serum S100B protein of all the patients, but her rSO2 was normal. Higher blood S100B protein levels with a late peak are linked to more extensive cerebral injury. In patients with subclinical cerebral tissue death, serum levels are lower and peak increasingly earlier [37]. On the sixth day after the operation, the second patient developed a CVI. Although there was a considerable rise in serum S100B protein, rSO2 remained normal. The CVI attack was predicted by neurological instability and an elevated level of S100B. This was not the case with rSO2.

Limitations

The study had several limitations. First, despite the huge patient group, it was constrained by the small number of patients who experienced neurological symptoms during the surgery. Second, the reported higher S100B levels in the blood of hypertension patients relative to healthy controls made employing the S100B biomarker to diagnose cerebral ischaemia challenging [38]. In terms of serum S100B increase, we did not compare the hypertensive and nonhypertensive categories. Third, different surgeons may assess neurological signs differently during surgery.

Conclusion

Awake neuromonitoring has been found to provide a sensitive and direct evaluation of brain tissue perfusion and is specific to CEA under LA. Although there was a favourable connection between CEA and an increase in serum S100B protein, due to the long assessment time, serum S100B monitoring was not practicable (usually 3 hours). The small number of patients in the study makes it impossible to draw clear conclusions, particularly in the group of people who suffer from neurological problems. Future research will either support or refute our findings.

For More Articles: Biomedical Journal Impact Factor: https://biomedres.us

Open Access Journals on Medical Informatics

Stress Prevalence in College Students During COVID-19 Pandemics: Evidence from Economics Undergraduates in a Developing Country

Introduction

On December 31, 2019, the Wuhan Municipal Health Commission reported a cluster of pneumonia cases caused by a new coronavirus. As of March 11, 2020, the WHO determines COVID-19 as a pandemic due to the disease’s levels of spread and severity. On March 14, 2020, the Secretary of Public Education, Esteban Moctezuma, reported on suspending primary and upper secondary school classes. By March 30, Mexico enters a health emergency, and new measures against the coronavirus are announced, including the suspension of non-essential activities. Studies show that a long period of confinement during a pandemic can negatively affect children’s physical and mental health [1]. Furthermore, university students appear to be particularly susceptible to the adverse effects of quarantine [2]. Learning through online platforms has given rise to depressive and anxiety disorders among university students [3]. The fact that students face various challenges when entering university is added. Authors such as Martínez-Otero and Torres (2005) mention that academic work and time dedicated to studying can affect the students or generate concerns. The objective of this study is to analyze the difference in academic stress levels among first-year students of the Bachelor of Economics of the Faculty of Economics of the Autonomous University of Nuevo León (FAECO-UANL), who began their university studies virtually, and the generation that experienced classes face-to-face before the COVID-19 pandemic. This methodology permits identifying the possible impact of starting university studies on students’ mental health during the pandemic.

Background

Rivas Espinosa, et al. [4] find that the level of academic stress between groups of students who studied the semester with online lectures and face-to-face classes is different, being moderately high in the first group. Acevedo, et al. [5] show that students who took the semester online presented more severe manifestations of stress, anxiety, and depression. Among the stressors presented by students during the COVID-19 pandemic are the overload of tasks and the work that must be completed within the deadlines established by teachers [6], the resolution of online exams, academic work deadlines and waiting for a teacher’s response [7]. Lovón, et al. [8] analyze the repercussions of the COVID-19 quarantine on the mental health of two groups of students: one with adequate technological resources and the other lacking quality technologies, finding that the main consequence for the first group is the stress due to academic overload, while for the second group, in addition to stress, they result in frustration and university dropout.

Method

Participants

The sample design framework was created considering the representative university student in the total population of the Faculty of Economics at UANL as the unit of study. For this purpose, an unrestricted random sample was designed, stratified in two dimensions: semester of study (first, third, fifth, seventh, and ninth semesters) and gender (male and female), giving a total of 10 classification strata. Thus, the student composition of the FAECOUANL for the semester August-January 2020-2021 was taken as a database. Therefore, the composition observed in Table 1 was considered as the target population.

biomedres-openaccess-journal-bjstr

Table 1: Composition of target population: economics students, FAECO-UANL.

Data

The data presented in this research work comes from a survey prepared with a set of instruments that allow knowing: the student’s cognitive abilities, vocational academic aptitudes, socioeconomic, family and home context, consumption habits, and metrics of selfconcept perfectionism and multiple intelligences.

Instruments

Socioeconomic questionnaire. The instrument consists of six parts: identification data, personal data, housing data, domestic equipment, scholarship program and resources to carry out the studies. In addition, questions related to the place of study, privacy at the time of studying, as well as questions about the previous knowledge of the faculty and opinions about studying economics were included, which were written by Brenda Medina (psychologist of the Faculty of Economics, UANL). SISCO Inventory of Academic Stress [9]. This instrument recognizes the stress characteristics that usually accompany upper secondary, higher, and postgraduate students during their studies [10]. It is made up of 45 items, 15 for each of the three dimensions of academic stress: stressors, symptoms, and coping strategies, to measure students’ academic stress. Academic stress is classified into 5 levels: very low stress levels (.01 to 1), low stress levels (1.01 to 2), moderate stress levels (2.01 to 3), strong stress levels (3.01 to 4) and very strong stress levels (4.01 to 5) of academic stress. The response scale has six values: never, hardly ever, rarely, sometimes, almost always, and always, to indicate the frequency with which stressors, symptoms, and coping strategies occur.

Procedure

Brenda G. Medina Soto, the psychologist from the Faculty of Economics, oversaw the application of questionnaires and the design of the informed consent that the students had to sign before answering. The questionnaires were administered virtually with prior authorization from the Directorate of the Faculty of Economics during October and November 2020. Multiple application sessions were held via the Microsoft Teams platform. Participation was entirely voluntary and anonymous. The importance of answering honestly was highlighted to the students and the fact that the data would be treated confidentially by the psychologist of the Faculty of Economics.

Results

Table 2 shows the means and mean differences of each level of academic stress, according to whether the student started their university studies during the pandemic (this means first-year students that started with online classes) or if they experienced face-to-face classes before the pandemic (older generations). The Table 3 shows that first-year students are 14.19% more likely to experience moderate stress levels than older generations. On the other hand, older generations are 14.63% more likely to experience intense stress than first-year students.

• Each column presents the sample mean of each variable conditional on whether the student began their university studies virtually or if the student experienced classes face-toface before the COVID-19 pandemic, and the mean difference.
• The third column shows the difference in means corresponding to the test (Student’s t) of differences with unknown and different variance.
• In variables of the dichotomous type (1=Yes 0=No), the interpretation of the average is the percentage of declared response: for example, 0.78 is interpreted as 78% of affirmative response.
• The statistical significance indicators of the statistical test (p-value) are: [a] p<0.10, [b] p<0.05, [c] p<0.01, [d] p<0.001. Source: Own estimation.

biomedres-openaccess-journal-bjstr

Table 2: Sample composition by stratified random unrestricted design: students surveyed by semester and gender.

biomedres-openaccess-journal-bjstr

Table 3: Means and differences in means between first year students and older generations.

Conclusion

This study analyzes the difference in academic stress levels between generations of the Faculty of Economics of the Autonomous University of Nuevo León (UANL) in the context of the COVID-19 pandemic. The results show that students that started their university studies with online lectures during the pandemic are more likely to have moderate academic stress levels. In contrast, students who experienced face-to-face learning are more likely to have strong academic stress levels. This suggests that older generation students present a higher level of academic stress, possibly caused by the transition from face-to-face to virtual education. However, one limitation of the study is that there is no information regarding the mental health situation of students prior to the pandemic, so it cannot be concluded that there has been a change in the levels of stress as consequence of confinement. In addition, the results are limited to the student population of the Faculty of Economics, so they cannot be generalized to the student population in general. Finally, Dewi, et al. [11] show that implementing teaching materials to develop coping strategies to manage stress during the pandemic becomes beneficial for students. Therefore, it is recommended that counseling be strengthened for students regarding stress management and the possibility of receiving professional support from a psychologist. Teachers should also consider offering virtual office hours and supporting students to process and address academic concerns [12-16].

Acknowledgement

The authors are grateful for Brenda G. Medina Soto’s support, the psychologist from the Faculty of Economics who collaborated in selecting instruments and applying the questionnaires. The authors appreciate the support of Dr. David Hernández Barajas, who provided the funding for the application of instruments for the questionnaires. Likewise, the authors appreciate the facilities granted by the Directorate of the Faculty of Economics of the UANL to realize this study. The results are solely the authors’ responsibility and do not reflect the position of any binding institution.

For More Articles: Biomedical Journal Impact Factor: https://biomedres.us

Open Access Journals on Biomedical Research

Pathogenic Microorganisms in Meat Products

Introduction

Ready to eat meat products are highly demanded due to their high biological value, reasonable price, agreeable taste and easily serving. Meat products are considered as excellent sources of high quality protein, minerals and vitamins (WHO, [1] and Mosupy, et al. [2]). In Egypt, the meat products such as sausage, beef burger and luncheon are gaining popularity because they represent quick easily prepared meat meals and solve the problem of fresh and expensive meat shortage, which is not within the income reach of many families with limited income (Shawish, et al. [3]). Food borne diseases caused by E. coli, Salmonella species and Staph. Aureus that transmitted mainly through consumption of contaminated food and the presence of them in meat and raw meat products has relevant public health implications (Shaltout, et al. [4]). Microbiological aspects are a useful way to determine the safety and quality of meat product and they may be contaminated during processing from the hands, workers clothes, knives, the hide, the gut or from the environment and transportation resulting in an inferior or even unfit quality for human consumption (Akhater, et al. [5]).

The most important bacterial pathogens in beef and meat products that are responsible for food borne infection includes E.coli, salmonella and coagulase positive (s.aureus Farag, et al. [6] and Hamed, et al. [7]). The bacterial contamination and hygienic measures during meat production and bad storage conditions for frozen meat products can be measured using the aerobic plate count, total psychrotroph counts, Total Enterobacteriaceae, total Coliforms and Escherichia coli biotype 1, which is the most important indicator for faecal contamination (Zweifel, et al. [7,8]) As the contamination of meat products such as lanchoun, beef burger, kofta and Frankforter with different food-borne pathogens constitutes dangerous problems for consumers. So, this study was done to evaluate the pathogenic microorganisms in the examined meat products (lanchoun, beef burger, kofta and Frankforter) which were collected from different markets in Elgharbia governorate.

Material and Methods

Collection of Samples

A total of 100 random samples of meat products (100 gm of each sample), were collected from different localities (Tanta city, centers and villages) at Elgharbia governate. Each sample was kept in a separate sterile plastic bag and put in an ice box then transferred to the laboratory under possible aseptic conditions without undue delay and examined bacteriologically to evaluate the bacterial quality and the hygienic health hazard of them with some food borne pathogens.

Preparation of the Sample

Twenty five grams of frozen meat samples( kofta, farnkfort beef, lanshon and beef burger) under examinations were taken under aseptic condition to sterile stomachers bag then add 225 ml sterile 0.1%peptone water , the contents were homogenized at stomacher (M A 106402,FRANCE,450 to 640 strokes per minute) for 2 minutes, the mixture was allowed to stand for 5 minutes at room temperature .the contents were transferred into sterile flask and thoroughly mixed by shaking and 1 ml was transferred into separate tube each containing 9 ml sterile 0.1%peptone water, from which tenth-fold serial dilutions were prepared.

Bacteriological Examination

Determination of Total Aerobic Plate Count (ICMSF, 1996): A 0.1 ml from each of chosen prepared dilution was inoculated separately onto duplicate sterile plates of plate count agar. Spread the inoculum using sterile bent glass, the plates were incubated 35c for 48 hours. Plates containing 25-250 colonies were countered and aerobic plate count (APC) per gram of the sample was calculated and recorded.

Determination of Total Psychotropic Count (APHA, 2001): Method applied according to (APHA, 2001), the inoculated plates are incubated at 4c for 10 days. Accordingly, the total psychotropic bacterial count per gram was calculated on plates containing from 25 to 250 colonies.

Determination of Total Enterobacteriaceae Count (ICMSF, 1996): The technique recommended by ICMSF, 1996 using the surface plating method using violet red bile glucose agar medium (VRBG). The plates were incubated at 37c for 24 hours. All purple colonies were then counted and the total number of colonies was determined. Hence, the Enterobacteriaceae count /g was calculated and recorded.

Determination of Total Coliform Count (ICMSF, 1996): The same technique of the previous surface plating method was applied using violet red bile agar medium. The plates were incubated at 37˚c for 24 hours. All pink colonies measuring 0.5 mm or more in diameter on uncrowded plates were then counted and the average number of colonies were determined. Multiply the number of colonies by the dilution to obtain the number of coliform organisms per gram of sample.

Isolationof E.Coli and Sereological Identification According to edwards and ewing(1972): One ml of each previously prepared serial dilution was inoculated into tubes containing 8 ml of EC broth and incubated at 45.5˚c for 48 hrs, after that a loopful from each positive tubes of EC broth (turbidity due to acid production and formation of gas in Durham’s tube) was streaked on Eosin Methyelene blue agar plates, then incubated at 37˚c for 24 hours. Typical colonies of E.coli appeared greenish metallic with dark purplecenter. Suspected colonies were purified and inoculated into slope nutrient agar tubes for further identification.

Determination of the Total Staphlococcus Aureus Count: Accurately, 0.1 ml from each of previously prepared serial dilutions was spread on duplicated plates of mannitol salt agar using a sterile bent glass spreader. The inoculated and control plates were incubated at 36c for 48 hours. The developed colonies were enumerated and the total staphylococci count/g calculated.

Results

(Figures 1-5).

Egyptian Standard (E.S.) (1114/2005): stated that the aerobic bacterial count should not be higher than 104

biomedres-openaccess-journal-bjstr

Figure 1: Mean values of total aerobic plate count in the examined meat.

biomedres-openaccess-journal-bjstr

Figure 2: Mean values of staphylococcus auereus count of examined meat products(25) sample for each.

biomedres-openaccess-journal-bjstr

Figure 3: Mean value of enterobactericea count in examined meat products.

biomedres-openaccess-journal-bjstr

Figure 4: Mean of total psychrotrophic count (cfu/g) of examined meat product samples (n=25).

biomedres-openaccess-journal-bjstr

Figure 5: Mean value of total coliform count (cfu/g) of examined meat product samples (n=25).

Discussion

Contamination by pathogenic microorganisms is one of the most important challenges faced by producers of processed meat products. The presence of food borne pathogens in meat and meat products can result in a range of human health problems as well as economic losses to producers due to recalls from market places (Sofos JN, 2008). Ready-to-eat (RTE) meats are especially a concern since these may be consumed without further cooking and are known to be good growth substrates for pathogenic microorganisms (Zhu M et al., 2005). The most important bacterial pathogens in beef and meat products that are responsible for food borne infection includes E.coli, salmonella and coagulase positive s.aureus (Farag, et al. [7,9]). So our study was carried out on ready to eat meat such as lanchoun, kofta, beef burgers and frankfurter at Elgarbia governorate to evaluate the bacterial count and the hygienic health hazard of them with some food pathogens.

Total Aeorobic Bacterial Count

The standard plate count (SPC), also referred to as the aerobic plate count or the total viable count, is one of the most common tests applied to indicate the microbiological quality of food. The significance of SPCs, however, varies markedly according to the type of food product and the processing it has received. The data in Table 1 revealed that the minimum and maximum aerobic plate counts in the examined meat products (lanchoun, beef burger, kofta and frankfurter) collected from different localities were ranged as follow 2×10² to 5.8X10⁶, 7X10³ to 3.6X10⁶, 3X10² to 8.8X10⁴ and 2X10² to 7.4X10⁴ with mean value 3.2X10⁵±2.5X10⁵, 4.2X10⁵ ±1.3X10⁵, 2.5X10⁴±2.2X10³ and4.9 X104±1.2X10³ respectively. All examined samples were contaminated 100%. On the same side, (Shaltout, et al. [10]) said that the APC/g of the examined samples of ready to eat meat meals ranged from 2.1×10³ to 1.7×10⁴ with an average of 6.03×10³± 1.45×10³cfu/g for meat, 4.6×10³ to 2.9×10⁴with an average 9.91×10³± 2.18×10³/(cfu/g) for meat kofta.

biomedres-openaccess-journal-bjstr

Table 1: Statistical analytical results of Aerobic Plate Count (cfu/g) of examined meat product samples (n=25).

*Note: a-b: mean with superscripts differ significantly at p<0.05.

Zalouk-enas (2013) examined 25 samples of ready to eat burger that collected from different localities at Giza governorate. The results revealed that, the mean value of APC were 8x 10⁴ CFU/g that was higher than the mean value for burger in our study. Higher results were reported by (Gab-Allah [11], Saleh, 1991, Shalaby, 1992). Higher results may be attributed to the difference in number of the examined samples, season of work and maybe there was a difference in the incubation period, as well as the high bacterial count found in the examined locally manufactured beef luncheon samples may be attributed to the contamination of the flesh meal itself that was used in the manufacture of the product, also equipment, knives and grinders were considered as a source of infection and contamination of the product during processing(Bryan,1975), Water used for washing, air, cleavers, vessels and personnel were considered another sources for contamination of the product (Muray, 1969).

Total Staphylococcus Count

The obtained results in Table 2 cleared that the minimum and the maximum staphylococcal count in the examined samples (lanchoun, kofta , beef burger and frankfurter ) 2X10² to 7X10², 3X10² to 5X10³ , 2X10² to 9X10² and 5X10² to 5X10³ with a mean value as follow 6.3X10²±1.6 X10a, 8.7X10²±1.5X10²a, 5.3X10²±1.1X10²a and 9.7X10² ±0.5X10²a respectively. On the same side Also Shaltout et al (2015) isolated Staph. Aureus in kofta with mean value 8.13×10² and mean value of 7.54×10² in burger. On the other hand, Staphylococcus had not been detected in beef burger or minced meat as reported by (Tolba 1994, Abdel-Aziz, et al. [12], Duffy et al. 1999, Chung et al. 2003).

biomedres-openaccess-journal-bjstr

Table 2: Statistical analytical results of Staphylococcus aureus count (cfu/g) of examined meat product samples (n=25).

Isolation of Coagulase Positive S.Aureus

Coagulase positive S.Aureus is still major cause of food poisioning (le Loir, 2003). The Table 3 revealed the Incidence of coagulase positive Staph. Aureus isolated from different examined meat product samples were as follow 20(40%) from launchon, 30(54%) from kofta, 20(25%) from burger and 30(50%) from frankfurter. This results agreed with that results obtained by (Eleiewa 2003; Zaki–eman (2003); El daly et al 2014; Djoulde et al 2015 and nadim- samaa 2016). These results disagreed with (Benzerra et al 2010 and mousa et al., [13]) who isolated S aureus in higher incidence in beef burger also disagreed with Wehab and Hegazy (2007) who failed to isolate S.aureus from frozen beef burger samples. The presence of S.aureus in meat and meat products indicates poor hygiene of meat handlers as well as lack of sterilization of utensils and they grow without pronounced change in odor or taste in the products (Protocarrero et al., 2002).

biomedres-openaccess-journal-bjstr

Table 3: Incidence of coagulase positive Staph.

Total Psychrotrophic Count

Psychtrophic bacteria are the main cause of spoilage of meat products which are kept under refrigeration temperature due to their ability to grow at low temperature. Total Psychtrophic bacterial count can provide useful information about the keeping quality of some meat products. The results in Table 4 revealed that the minimum and the maximum of total psychotropic count in the examined meat samples (lanchoun, kofta , beef burger and frankfurter ) were as follow2X102 to 7X10², 3X10² to 6X10³ , > 102 to > 102 and > 102 to > 102 with mean value as follow 5.9X10² ±2.7X10ab and 2.4X10³ ±1.9X10²a respectively. As all positive samples were lower than 105, so all samples were accepted following (ES 2005) .these results were agree with (Karaboz and dincer 2002).

biomedres-openaccess-journal-bjstr

Table 4: Statistical analytical results of Enterobacteriaceae count (cfu/g) of examined meat product samples (n=25).

Total Enterobacteriaceae Count

Enterobacteriaceae is a group of organisms are used in food testing as hygiene indicator organisms and can give advance warning of failures in hygiene procedures in food manufacturing site. Presence of Enterobacteriaceae indicates fecal contamination and microbial proliferation, which includes all the multiplication of wide range of pathogenic and toxigenic organisms and constituting a public health hazard (Hichelmanet et al., 1973 and ICMSF [14]). The public health hazard of isolated Enterobacteriaceae constituted in Escherichia coli(verocytotoxigenic) including serotype O157: H7 are one such group causing severe chronic and potentially fatal illness such as hemorrhagic colitis, hemolytic uremic syndrome, thrombotic thrombocytopenic purpura and in severe cases death occur (Hiko et al., 2008).

The results in Table 5 revealed that the minimum and the maximum Enterobacteriaceae count in the examined samples (lanchoun, kofta, beef burger and frankfurter) were as follow 1X10² to 3X10³, 5X10² to 1.5X10³, 2X10² to 3.7X10³ and 1.2X10² to 6X10² with mean values as follow 1.3X10³ ±1.03X10²a, 1.0X10³ ±2.7X10²a, 5.5X10²±1.2 X10²a and 3.4X10² ±1.1X10a respectively. Limits suggested for Enterobacteriaceae count in various foods are lower than 104 microbes /g center of food safety [15]. The current results were relatively agreeing to that obtained by (El-Daly et al. 1987, Pivarov et al. 1988, Elwi 1994) who found that the mean values of Enterobacteriaceae in kofta were 45 x 102/g, while higher findings were obtained by (Hassan 1991, Daif 1996, Hussein 1996) who found that the mean Enterobacteriaceae for kofta samples were 1.9 x 10⁵/g.

biomedres-openaccess-journal-bjstr

Table 5: Statistical analytical results of total psychrotrophic count (cfu/g) of examined meat product samples (n=25).

Total Coliform Count

Members of coliforms groups are referred as general indicator microorganisms to measure the potential presence of enteric pathogens in foods, besides the measuring of fecal contamination of food products and the sanitary condition in the foods processing environment (FAO, 1992). The presence of these organisms in RTE food (sandwiches) depicts a deplorable state of poor hygiene and sanitary practices employed in the processing and packaging of this food product (Jay, 2005).

Data in the Table 6 showed the minimum and maximum of total coliform count in the samples examined (lanchoun, kofta , beef burger and frankfurter ) as follow 2X10² to 7X10³, 3X101 to 6X10³, 5X10² to 9X10² and 1X10² to 3X10² with mean value as follow 5.9X10² ±2.7X10ab, 2.4X10³ ±1.9X10²a, 3X10²±1.3X10ab and 2X10²±0.7X10ab respectively. The current results agree with those recorded by (El-Rayes 2008) who recorded that the mean value of total coliform count in kofta was 2.83 x 10³± 0.74 x 10³ /g. While, lower results were recorded by (EL-Daly et al. 1987) who found that the mean values of coliform counts were 1×10² /g. In disagree with our results (Stagnitta et al. 2006) examined 100 hamburgers samples to detect the microbiological and hygienic quality of meat foods in San Luis city. They reported that the counts of coliforms in samples ranged from 101 and 103CFU/ g.

biomedres-openaccess-journal-bjstr

Table 6: Statistical analytical results of total coliform count (cfu/g) of examined meat product samples (n=25).

Isolation of E.Coli

The isolation of E.colifrom meat samples indicates fecal contamination and implies that other pathogens of fecal origin may be present so E.coli is considered as an indicator of fecal contamination beside, it may induce severe diarrhea in infants and young children as well as food poisoning and gastroenteritis among adults (synge et al.,2000) Results in Tables 7-9 showed Incidence of E. coli isolates isolated from meat product samples (lanchoun, kofta , beef burger and frankfurter )were 15(30%), 20(40%), 9(18%) and 6(12%) respectively. Also As our results, the Escherichia coli isolated in kofta samples that reported by El-Mossalami (2003) were (40%). However, lower values were recorded by (El-Taher- Omyma 1998 (25%), Saleh 2001 (16%), Al-Mutairi 2011) 7 (28%). On the other side (Mansour [13]) reported that E.coli was detected in 44 beef samples and their incidence were 14 (56%), 12(48%), 10(40%) and 8(32%) in kofta, burger, sausage and frankfurter respectively that was higher than our results. Also results that were found by previous investigators. (Duitschaever 1977 and Fathi et al., 1992), they detected E.coli in 28.3%of the examined beef burger samples that was less than our results.

biomedres-openaccess-journal-bjstr

Table 7: Serological typing of E. coli isolated from different examined meat product samples.

biomedres-openaccess-journal-bjstr

Table 8: Frequency distribution of total aerobic bacterial counts in the examined meat product samples (n=25).

biomedres-openaccess-journal-bjstr

Table 9: Incidence of E. coli isolates isolated from meat product samples.

Isolation of Salmonella

In our study, Salmonella serovars were failed to be detected in all examined samples of meat products. Salmonellae were failed to be isolated from the examined samples, this may be due to thermal treatment of luncheon during processing or cooking in a temperature around 70-73oC within it may destruct the pathogenic bacteria, also this may be due to addition of additives such as preservatives, spices and nitrites, which have an antimicrobial effect on Salmonella which inhibits their growth and multiplication (Moffat et al., 2006). This result agreed with the legal requirement of E.S. (1114/2005). Obtained result was similar to those reported by (Amal and Seham 1998, Hala and Hoda 2002, Amal 2004 and Ibrahim 2009), all of them failed to detect Salmonellaein luncheon. While (Youssef et al., 1999 and Karmi, 2013) isolate Salmonellae from luncheon samples with an incidence 2% and 10% respectively. This may be due to highly contaminated samples, before a cooking step. On the same side, (Abdel-Aziz et al. 1996, Kuplul and Oral, 2003) failed to isolates salmonella from any of examined luncheon samples. Salmonella species were not found in any of the examined luncheon samples or kofta samples).

For More Articles: Biomedical Journal Impact Factor: https://biomedres.us

Open Access Journals on Emergency Medicine

Pore Characterization of Alumina Short Fiber Using Small Angle X-Ray Scattering Technique

Introduction

Alumina or Aluminium Oxide (Al2O3) is ceramic metal oxide and have wide variety of applications [1]. Alumina is also widely used as biomaterials for bone replacement [2]. This is due to the fact that Alumina is relatively high strength and has good tribological properties especially wear resistance. Improvement in terms of material purity has led to great chemical resistivity and excellent tissue compatibility. Thus, it is not surprising the usage of Alumina even is found in dental implants [3]. Alumina could be produced by electrospinning technique. It is a process of producing fibers by employing electrohydrodynamic properties with a relatively simple set-up [4]. The set-up includes a high voltage power supply, pump, syringe and grounded collector. Raw material for the electrospinning process is in the form of sol-gel. Prior to sol-gel injection by using the syringe, an electrical field is generated between the syringe and the collector. As the sol-gel is injected from the syringe, an electrical repulsive force directs the material in the form of fiber onto the collector. The obtained material on the collector finally in the form of thin layer of mats. The material is carefully removed and calcined at high temperatures to remove the unwanted polymer precursor. Then the desired Alumina is obtained. The fiber produced by this technique demonstrate good performance and properties. This is due to the increase of the specific surface area of the nanofiber. The nano-scale could be achieved by various approaches includes reduction of fiber diameter. Electrospinning process allows manipulation of setting parameters to achieve that [5]. Electron microscopy (EM) and small angle scattering (SAXS) are two approaches of data acquisition method for characterizing nanoparticles. Both are considered as direct technique but one is in real space (EM) and the other is in reciprocal space (SAXS). These two methods are usually utilized to produce data such as size distributions, determine pore sizes, high resolution imaging and much more [6]. Fundamentally, electron microscopy (EM) uses high speed electron as a source of illumination to obtain high resolution image while small angle x-ray scattering (SAXS) involves successive irradiation mode of passing the x-ray beam through the sample and data built based on scattered x-rays [7,8].

There are idiosyncratic advantages and disadvantages between these two techniques. With regard to application on different types of samples, small angle x-ray scattering (SAXS) has further advantages due being able to study variety of sample states includes solid, powder, sol-gel as well as thin film [9]. Estimation of particle sizes of electron microscopy (EM) methods is made from measurements of limited number of particles which makes small angle x-ray scattering (SAXS) provide more accurate data on particle sizes due the estimation is made from vast number of particles [10]. In addition, preparing samples for small angle x-ray scattering (SAXS) are often require very little time, comparing to the complicated electron microscopy (EM) sample preparation procedure where often taking longer period. It is the interest of researchers to probe the specific surface area for confirming the success of obtaining nano-scale materials. One of the technique is through the use of Small Angle X-ray Scattering (SAXS) technique.

SAXS is advantageous as compared to fluid for probing the pore space. It covers both close and open pore. In SAXS, a beam of X-rays of fixed wavelength and known intensity is illuminated on the sample, and the intensity of the scattered signal is measured versus the scattering vector. X-ray probe the fluctuations of the electronic density and reflect the chemical heterogeneity and density variations within the sample. From this result, many information on the sample are obtainable such as size, shape and specific surface area.

Materials and Methods

The Alumina nanofibers were prepared from electrospinning process. The raw materials used were reagent grade Aluminium Isopropoxide (AIP) as the source of alumina precursor, Polyvinylpyrrolidone (PVP with Mw 1300000) as polymer precursor, nitric acid (HNO3) and Ethyl Acetoacetate. All chemicals were from Sigma Aldrich. The optimum electrospinning setting parameter were followed based on previous work [11]. Surface morphology was carried out using SEM/EDX FEI Quanta 400. SAXS experiments were performed using Anton Paar Saxpoint instrument, operated at 50kV and 1mA with the point collimation geometry. The radiation used was a Ni filtered CuKα radiation of wavelength 0.154nm. The intensity profiles are recorded using a CMOS 2-D detector (Eiger) and the scattering vector q, covers from 0.035 to 5 nm-1. One-dimensional scans of I(q) were extracted from two- dimensional scattering patterns using the analysis package SAXS analysis, Primus and Easyswax. Angular calibration of the scattered intensities in the small angle regime for the detector is performed using silver bahenate (d = 58.38 Å). Sample to detector distance is 575.5mm and sample exposure to the source is 600 seconds. All experiments are carried out at room temperature, 20ºC. The measured scattering vector is related to the scattering angle through the equation:

θ = Scattering angle or half of diffraction angle (degree)
q = scattering vector (nm-1)
𝝀 = 0.154 (nm)
Another parameter under consideration is Invariant. It is the integral of second moment of the scattering curve I(q) q2. The equation is given below:

Qp shall be calculated by extrapolating scattering intensity towards zero (Guinier approximation) and infinitely large scattering angle (Porod’s q-4 dependence). Pore is assumed to be spherical in shape.
Surface to volume ratio is based on the equation of:

where:
Kp = Porod Constant
Qp = Invariant
θ = Volume fraction of particles
Specific surface is obtained by dividing the surface to volume ratio with the apparent density. All equations are based on Heimo Schnablegger [12]. SAXS experiment were subjected to two samples namely Alumina Quantachrome Reference standard and Alumina nanofiber. The result for Alumina Quantachrome Reference standard is compared with the value given by the manufacturer but by using a different technique, BET technique. Then, the second sample, Alumina nanofiber is subjected to SAXS measurement. 2D-SAXS image of Alumina Quantachrome Reference (Figure 1) and Alumina nanofiber (Figure 2) with the same linear scaling in the q-range of 0.035nm-1 < qz < 5nm-1. Exposure time was 300s (avarage of 2 reading). 2D scattering data are reduced to 1D scattering profile by radial integration from 0° – 180°. Further analysis is performed based on 1D scattering profile as shown in (Figure 3). From Invariant (Porod and Guinier) calculation, It was found the value of Kp/Qp are 0.19 for standard Alumina Quantachrome Reference sample and 0.62 for Alumina sintered nanofiber sample. The specific surface area for both sample is calculated and given in (Table 1). The existance of nanopores are clearly visible by the excess SAXS signal in (Figures 1 & 2). Ring pattern for both sample indicates there is no preferred orientation of the nanopore within the plane of the samples.

biomedres-openaccess-journal-bjstr

Figure 1: 2D scattering of Alumina Quantachrome Reference sample.

biomedres-openaccess-journal-bjstr

Figure 2: 2D scattering of Alumina nanofiber sample.

biomedres-openaccess-journal-bjstr

Table 1: Specific surface area.

The intensity of alumina Quantachrome Reference standard is found much more higher than the Alumina sintered nanofiber. This reflect that many scatterer in the alumina Quantachrome Reference sample as intended from the reference material. In terms of pore size, it is found that the alumina nanofiber exhibits smaller pore size as indicated by the higher specific surface area, 399.98 m2/g. Comparing specific surface area values for alumina Quantachrome Reference material between SAXS and BET technique reveals that both values are in good agreement. SAXS gives the value of 95.58 m2/g and BET is reported to give the value of 107.5 m2/g. However, slight differences might be caused by damages to the sample during the crushing of the Quantachrome Reference sample from solid to powder form in order to mount the sample into the holder for SAXS experiment. The surface morphology of Alumina sintered nanofiber is given in (Figure 4). it is clearly seen the fibers are in the range of 100-200nm in diameter. The pore between the fibers are expected to be much more smaller than that. This will give rise to the scattering event in the sample. The applicability of SAXS technique in assessing the pore in the sample is found to be comparable to BET technique. The simple sample preparation makes the technique very attractive and is successfully shown in this work by probing Alumina sintered nanofiber.

biomedres-openaccess-journal-bjstr

Figure 3: 1D scattering of Alumina Quantachrome Reference and Alumina sintered nanofiber sample.

biomedres-openaccess-journal-bjstr

Figure 4: Alumina sintered nanofiber, short fiber with the average diameter of 100- 200 nm.

For More Articles: Biomedical Journal Impact Factor: https://biomedres.us

Open Access Journals on Bioregenerative Medicine

Inhibitory Effects of Ninjin’yoeito Ingestion on a Reduction in Chewing-Like Movement and Cognitive Hypofunction in Powder Diet-Fed Mice

Introduction

“Mastication” refers to a series of processes from food ingestion until food mass formation through mixing with saliva. During mastication, the mandible rhythmically moves through cooperation among the teeth, jaw, and masticatory muscle. These movements are complexly and exquisitely regulated by the central nervous system based on various pieces of oral sensory information [1]. A recent study showed that mastication promoted the process of food digestion/absorption, exhibiting various actions: the activation of the brain, inhibition of brain aging, maintenance/improvement of the motor function, and regulation of blood circulation [2]. Thus, mastication is associated with various functions, playing an important role. However, recently, the influence of soft-diet-related masticatory hypofunction on biological bodies has been indicated [3]. Furthermore, a decline in the masticatory function (oral frailty) associated with aging-related tooth loss or oral hypofunction is considered to be an early, important sign of aging.

It increases the risk of dementia and promotes the risk of drymouth- or dysphagia-related aspiration pneumonia or a decline in the physical function (frailty) related to a reduction in energy intake. Many elderly persons have multiple diseases, and multi-component-system Kampo medicine formulations are usually used from the viewpoint of polypharmacy with high risk of adverse reactions [4]. Among these formulations, Ninjin’yoeito, which has been used in clinical practice, is effective for symptoms, such as a decline in physical strength after illness, fatigue/malaise, anorexia, night sweats, coldness of the hands and feet, and anemia. Recently, this formulation has been particularly prescribed for frail patients [5,6]. In this study, we examined the effects of Ninjin’yoeito on reduction in chewing-like movement and cognitive hypofunction using powder-fed mice.

Materials and Methods

Experiment Materials

Laboratory pellet chow (solid diet) and powder chow (powder diet) were purchased from CLEA Japan (Osaka, japan). The dried extract powder of Ninjin’yoeito (NYT, Lot No. 1712111AO) was used in the present study and was manufactured by the GMP Pharmaceutical Factory of Kracie Pharma, Ltd. (Qingdao, China). NYT consists of 12 crude drugs: Rehmannia Root, Japanese Angelica Root, Atractylodes Rhizome, Poria Sclerotium, Ginseng, Cinnamon Bark, Polygala Root, Peony Root, Citrus Unshiu Peel, Astragalus Root, Glycyrrhiza, and Schisandra Fruit. The details are presented in Table 1.

Animals

Three-week-old male C57BL/6J mice were purchased from Japan SLC Inc. (Shizuoka, Japan), and maintained in a 12 h/12 h light/dark cycle in a temperature- and humidity-controlled room (room temperature, 23±2℃; humidity, 55±10%). The animals were divided into 4 groups. The animals were divided into 4 groups: solid diet group fed laboratory pellet chow (solid diet), powder diet group fed the powder chow (powder diet), and the two experimental groups which fed powder diet plus 1% NYT or powder diet plus 3% NYT. Animals had free access to food and water for 5 months. The body weight of each mouse was measured once a week and the total amount food and water consumed recorded 5 times per week. After the mice had been fed these diets for 5 months (at 25 weeks of age), blood was taken from each mouse by venous puncture using a heparin-containing syringe under anesthesia with isoflurane. Subsequently, the masseter muscle, temporal muscle, large salivary glands (parotid gland, submandibular gland, sublingual gland), gastrocnemius muscle, soleus muscle, and epididymal adipose tissue were extirpated, and the respective wet weights were quickly removed and weighted. The plasma was prepared and frozen at -40°C until analysis. This experiment was performed after approval by the Animal experiment committee of Kracie Pharmaceutical, Ltd. Kampo Research Laboratories following regulations on animal experimentation specified by the Research Laboratories and ‘Basic guidelines for the conduct of animal experiments in implementing agencies under the jurisdiction the Ministry of Health, Labour and Welfare’.

Measurement of Chewing-Like Movement

A device to measure chewing-like movement in mice was prepared, as described by Ayada, et al. [7], and the amount of chewing-like movement was measured, utilizing a mouse escaping habit by tail fixation (Figure 1); each mouse was placed in a thin cylinder, and plastic plates were set at the anterior and posterior notches of the cylinder. The murine tail was fixed with tape for a specific time, and the amount of change in the plastic plates was calculated. In this study, the measurement time was established as 1 hour, and the amount of change in the plastic plates was regarded as the amount of chewing-like movement in mice. The amount of chewing-like movement was measured 30, 90, and 150 days after the start of powder feeding (51, 111, and 171 days of age).

biomedres-openaccess-journal-bjstr

Figure 1: Experimental schedule for chewing-like movement and memory function of mice impaired by soft diet feeding.

Passive Avoidance Learning Test

The passive avoidance learning test was conducted from 120 days after the start of powder feeding (141 days of age). A grid was installed on the floor of an experimental device, and the space consisted of a white-light-illuminated bright room (9x25x32 cm) and dark room (30x29x32 cm). A plastic door was present between the two rooms. This test consisted of 3 parts: pre-training, training, and retaining trials. Pre-training trial (Day 120): Each mouse was placed in a bright room with the door closed and acclimated for 30 seconds. Subsequently, the door was opened. After the posterior limbs of the mice entered a dark room, the door was closed. The mice was acclimated in the dark room for 30 seconds, and collected from the device. Training trial (Day 121): Each mouse was placed in a bright room with the door closed. After 30 seconds, the door was opened. After the posterior limbs of the mice entered a dark room, the door was closed. After 3 seconds, electric stimulation (0.25 mA, 2 seconds) loading was conducted. The mice was collected from the dark room 30 seconds after electric stimulation, and placed in a breeding cage. Retaining trial (Days 122, 125, and 136): Each mouse was placed in a bright room, with the door closed. After 30 seconds, the door was opened. The latency time (cut off 300 seconds) until the posterior limbs or half body of the mice entered a dark room was measured.

Measurement of the Plasma NO levels

Plasma was centrifuged at 4°C and 14,000 g for 15 minutes using Amicon Ultra-0.5-PLGC Ultracel-10 membrane (UFC501096, Merck KGaA) for deproteinization. For measurement of the plasma NO level after deproteinization, a Nitrate/Nitrite Colorimetric Assay Kit (Item No. 760871, Cayman Chemical Company) was used.

Measurement of the Plasma Albumin Levels

For measurement of the plasma albumin level, an LBIS Mouse Albumin ELISA Kit (AKRAL-121, FUJIFILM Wako Chemicals) was used.

Statistical Analysis

The results are expressed as the mean±standard error (means±S.E.M.). Significance tests were conducted using Dunnett’s method with Statcel [3] software. P value of less than 0.05 was considered to indicate statistical significance. For the significance tests with serial data, repeated measure-variance analysis (repeated measure ANOVA) was performed. P value of less than 0.05 was considered to indicate statistical significance.

Results

Measurement of Chewing-Like Movement

The amount of chewing-like movement was serially measured 30, 90, and 150 days after the start of powder feeding. As shown in Figure 2, in the powder diet group, the amount of change in the plastic plates was smaller than in the solid diet group, and there was a reduction in the amount of chewing-like movement. The powder diet plus 3% NYT group, significantly suppressed the reduction in the amount of chewing-like movement compared to the powder diet group, but the powder diet plus 1% NYT did not affect.

biomedres-openaccess-journal-bjstr

Figure 2: Effect of NYT on chewing-like movement.

Note: The amount of chewing-like movement was serially measured 30, 90, and 150 days after the start of powder feeding. The murine tail was fixed with tape for a specific time, and the amount of change in the plastic plates for 1 hour was calculated. Mice were divided into the following 4 groups: solid diet group (SD), powder diet group (PD), powder diet plus NYT 1% group (NYT1%), powder diet plus NYT 3% group (NYT3%). Closed circle: SD; open circle: PD; open square: NYT 1%; open square: NYT 3%. Each value represents the mean ± S.E.M., n=12, #p<0.05 vs. SD and *p<0.05 vs. PD (repeated measure ANOVA).

Passive Avoidance Learning Test

To measure mice memory function 120 days after the start of powder diet, the passive avoidance learning test was conducted. As shown in Figure 3, a retaining trial was performed 122, 125, and 136 days after the start of powder diet. In the solid diet group, memory was maintained throughout the test period, but in the solid diet group, the latency time until the mouse entered a dark room was shortened at Day 136, suggesting a reduction in memory. In the powder diet plus 3% NYT group, the latency time until entering a dark room was prolonged in comparison with powder diet fed mice; a powder-diet-related reduction in memory was inhibited.

biomedres-openaccess-journal-bjstr

Figure 3: Effect of NYT on memory function.

Note: Latency to enter the dark compartment before and after conditioning was measured in passive avoidance test. The cut off latency was set at 300s. Mice were divided into the following 4 groups: solid diet group (SD), powder diet group (PD), powder diet plus NYT 1% group (NYT1%), powder diet plus NYT 3% group (NYT3%). Closed circle: SD; open circle: PD; open square: NYT 1%; open square: NYT 3%. Each value represents the mean ± S.E.M., n=12, #p<0.05 vs. SD and *p<0.05 vs. PD (repeated measure ANOVA).

Body Weight/Food Intake/Water Intakes

The body weight, food intake and water intake were serially measured. As shown in Figures 4 & 5, in the powder diet group, food/water intake increased in comparison with the solid diet group. In addition, weight gain was noted in the powder diet group but was not significantly different among the powder diet group, powder diet plus 1% and 3% NYT groups.

biomedres-openaccess-journal-bjstr

Figure 4: Effect of NYT on body weight.

Note: Whole-body weight was measured throughout the experimental period. Mice were divided into the following 4 groups: solid diet group (SD), powder diet group (PD), powder diet plus NYT 1% group (NYT1%), powder diet plus NYT 3% group (NYT3%). Closed circle: SD; open circle: PD; open square: NYT 1%; open square: NYT 3%. Each value represents the mean ± S.E.M., n=11-12, ###p<0.001 vs. SD (repeated measure ANOVA).

biomedres-openaccess-journal-bjstr

Figure 5:

(A) Effect of NYT on food intake and

(B) Water intake.

Note: Whole food and water intake were measured throughout the experimental period. Mice were divided into the following 4 groups: solid diet group (SD), powder diet group (PD), powder diet plus NYT 1% group (NYT1%), powder diet plus NYT 3% group (NYT3%). Closed circle: SD; open circle: PD; open square: NYT 1%; open square: NYT 3%. Each value represents the mean ± S.E.M., n=4, ###p<0.001 vs. SD (repeated measure ANOVA).

Wet Weights of Tissues

As shown in Figure 6, the epididymal adipose tissue weight significantly decreased in the powder diet group. Whereas, there was a slight increase in the powder diet plus 1% NYT group. However, there were no differences in the weights of masseter muscle, temporal muscle, gastrocnemius muscle, or soleus muscle among the groups (data not shown).

biomedres-openaccess-journal-bjstr

Figure 6: Effect of NYT on epididymal adipose tissue weight.

Note: Mice were divided into following 4 groups: solid diet group (SD), powder diet group (PD), powder diet plus NYT 1% group (NYT1%), powder diet plus NYT 3% group (NYT3%). Each value represents the mean ± S.E.M., n=8-9, *p<0.05 vs. PD (Dunnett’s test).

Plasma NO Levels

As shown in Figure 7A, the plasma NO level in the powder diet group was slightly lower than in the solid diet group. In the powder diet plus 3% NYT group, there was a significant increase compared to the powder diet group, and the plasma NO level was maintained at the same level as the solid diet group.

Plasma Albumin Levels

As shown in Figure 7B, the blood albumin level in the powder diet group was significantly lower than in the solid diet group. In the powder diet plus 1% NYT group, there was a significant increase.

biomedres-openaccess-journal-bjstr

Figure 7: (A) Effect of NYT on plasma NO level and

(B) Plasma albumin level.

Note: Mice were divided into the following 4 groups: solid diet group (SD), powder diet group (PD), powder diet plus NYT 1% group (NYT1%), powder diet plus NYT3% group (NYT 3%). Each value represents the mean ± S.E.M., n=8-9, *p<0.05 vs. PD (Dunnett’s test).

Discussion

Solid diet serially increased the amount of chewing-like movement in mice, whereas there was no serial increase during powder diet. 3% NYT-containing powder diet serially increased the amount of chewing-like movement, as demonstrated for solid feeding. However, there were no changes in the weights of masseter muscle, temporal muscle, or large salivary gland among the groups (data not shown). As the cause, it is possible that NYT administration contribute to the actions of other masticatory organs, such as the mouse jaw and mouth-opening muscle.

A reduction in masticatory movement reduces memory [8]. As nerves are extensively distributed in the brain area responsible for oral-tissue domination, so the mechanism of masticatory function and memory is complicated. Mastication-related mechanical stimuli from the oral area potentiate central nervous stimulation, leading to the activation of cholinergic neurons in the pedunculopontine tegmental nucleus, neurogenesis in the hippocampus, and increases in BDNF secretion and synapse transmission efficiency [9]. Furthermore, several studies indicated that masticatory movement increased intracerebral blood flow [10,11]. Recently, it was shown that an increase in cerebral blood flow was mediated by the nucleus basalis of Meynert [12]. This nucleus is known as a cholinergic nucleus, and NO released by the vascular endothelium may activate cholinergic nerves. In this study, powder feeding resulted in a reduction in memory on the passive avoidance test, and NYT administration improved it. Although cerebral blood flow was not measured in this study, NYT administration suppressed the decrease in blood NO level induced by powder feeding. Thus, it was suggested that NYT contribute to memory improvement by increasing cerebral blood flow through the enhancement of NO production. NYT consists of 12 crude drugs (Table 1).

biomedres-openaccess-journal-bjstr

Table 1: Composition (daily dosea) of Ninjin’yoeito Formulations.

Note: aApproximate 6700 mg of dried water extract of NYT was prepared in GMP-standardized factory of Kracie Pharma, Ltd. (Japan) on the basis of above described composition.

Ginsenoside Rb1, which is contained in ginseng, was reported to increase the NO level [13]. In addition, a study indicated that cinnamaldehyde contained in Cinnamon Twig and paeoniflorin contained in Peony Root exhibited NO- or inducible NO synthase (iNOS)-mediated anti-inflammatory or vasodilative actions [14]. Several studies reported the assessment of memory using the passive avoidance test in powder-fed mice [8,15]. Fukushima-Nakayama et al indicated that powder feeding reduced memory in mice and confirmed a reduction in the hippocampal BDNF level as a part of the action mechanism [15]. It was also reported that reductions in the hippocampal nerve activity, neuron count, acetylcholine level [16], and neuron density [17] involved in powder-feedinginduced memory impairment. Furthermore, in addition to the hippocampus, powder-feeding-related decreases in the cerebral cortex levels of BDNF [18], dopamine, and acetylcholine [19] were indicated. However, in this study, there were no significant changes in the mouse hippocampal BDNF level (data not shown). In the future, changes in the above neurotransmitters should be examined using the hippocampus and cerebral cortex to clarify the action mechanism of NYT.

Powder feeding increased food/water intake in comparison with solid feeding. With this, weight gain was noted. Several studies indicated that powder feeding slightly increased the body weight [20,21], and it suggests that the satiety center is not stimulated through a decrease in the opportunity of mastication, leading to weight gain in some cases. Mastication promotes saliva secretion, assisting digestion/absorption [2]. However, powder feeding decreased the fat volume, although there were no changes in the gastrocnemius or soleus muscle weights (data not shown), suggesting some change in nutrient absorption in mice. The blood albumin level, which reflects the nutritional status, significantly decreased through powder feeding in comparison with solid feeding, suggesting that intestinal nutrient absorption is reduced in the absence of mastication. Furthermore, the maintenance of plasma colloid osmotic pressure is known as the function of albumin, and when the plasma albumin level decreases, a specific blood osmotic pressure is maintained.

Therefore, clinical symptoms, such as edema and ascites, occur through extravascular water leakage [22]. From these results, powder feeding may have affected intestinal nutrient absorption, reducing the blood albumin level, influencing water metabolism, and resulting in a heavy body weight despite a small fat volume, that is, swelling or a flabby body. NYT administration increased the blood albumin level, with a slight improvement in the fat volume. A study indicated that NYT improved the small intestinal morphology and intestinal absorption function in old mice [23]. In this study, neither the small intestinal morphology nor intestinal absorption function of mice after NYT ingestion was measured. However, the albumin-level- and fat-volume-improving effects of NYT may be associated with improvements in the small intestinal morphology and intestinal absorption function of mice.

Conclusion

This study showed that NYT inhibited a reduction in chewinglike movement and cognitive hypofunction in powder-fed mice.

For More Articles: Biomedical Journal Impact Factor: https://biomedres.us

Open Access Journals on Microbiology Research

Multiaxial Tensile Properties of Soft Biological Tissues

Short Communication

The results of virtual simulation of soft biological tissues often differ significantly from their real behaviour. Possible reason is that only data from unidirectional tensile test is considered. The aim is therefore to provide usable information on the mechanical behaviour of tissues under multiaxial loadings. The bulge test is the simplest way to realize biaxial tensile loadings on soft tissues. Several literature sources are critically examined and the known test specifications for the biaxial tensile test are significantly improved, see [1-5] among others. Our method supplies data for understanding human health and for reliable material modelling in adjustment of components for medical industries.

The implemented optical 3D measurement during the loading allows the precise capture of the mechanical response of the tissues until failure. The data from new test specification improves the material modelling thus providing the basis for an enhanced design quality in medical techniques and applications. The method was originally applied on elastomer sheets. In this way, parts for automobiles, components in aircraft construction or products for sports, medicine, and household can be designed more reliably and cost-effectively.

Mechanical Tests

Soft biological tissues obviously have some properties comparable to elastomers. The first standards on mechanical testing of elastomers date back to 1912 [6]. The state-of-theart recommendations are summarised in BS 903-5:2004 [7]. The characterization of elastomers occurs as experimental determination of the stress / strain relations. Often, only the measurements in tension are carried out according to ASTM D412 or DIN 53504:2017-03. Although the required material parameters can be determined from this test, the reliability of the material answer under multi-axial loadings is unsatisfactory.

For reliable material modelling, it is necessary to consider further measured data under shear and uniaxial compression.

Some testing standards for these tests like:

• Quadruple test according to ASTM D4014 and

• Compression test according to ASTM D395-18, D6049- 03, D6147-97, DIN ISO 815-1:2016, DIN ISO 7743:2016 are sometimes hard to apply to soft biological tissues. An alternative to the uniaxial compression test is the biaxial tensile test. Both tests describe the same deformation mode and, with the assumption of incompressibility, are convertible. The biaxial tensile loading on tissues can be implemented as bubble inflation test or bulge test. The disadvantage is that this test is not specified in any standard and provide results, which can often be arbitrarily interpreted. Large deviations in measurement series happen due to the different sample dimensions, ways of fixation, and test settings.

Bulge Test

The test setup consists of a base plate and a circular ring with an orifice (Figure 1). The tissue is clamped in the fixture and inflated with water, causing it to expand as a bubble. Stress singularities in the clamping area are reduced by a special design of the edges of the orifice. To ensure optimum fixation of the test specimen, the circular ring is centred and carefully bolted to the base plate. The protrusion of the specimen in the test area during clamping is minimised by design of the ring. A balanced biaxial stress occurs in the centre of the bubble during the loading (Figure 2). The ruler is used only for visual control of the height of the bubble. The evaluation of the geometry change in the bubble is performed in a subsequent post-processing step using the GOM Aramis 3D software. Alternative fluids like physiological saline solution can be used as a pressure medium. The tests can be performed according to customer specifications or our standard.

biomedres-openaccess-journal-bjstr

Figure 1: Inflated test specimen without black & white pattern, applying the orifice of the Ø50 mm diameter. Photo: Fraunhofer LBF.

biomedres-openaccess-journal-bjstr

Figure 2: Inflated test specimen without black & white pattern close to failure. Stress whitening can be observed. Photo: Fraunhofer LBF.

Specimen

Optimal results are obtained for specimens with an external diameter until Ø110 mm. The thickness of the materials is measured before the test at three positions. This measurement is based on a method developed at the Fraunhofer LBF, which avoids the induction of stress concentrations in the specimen. The specimen is speckled with a statistically distributed black & white pattern and then tested directly to ensure optimum adhesion between the specimen and pattern (Figure 3). This allows the evaluation of two- dimensional strains on the specimen surface by digital image correlation as function of pressure. To obtain data on possible anisotropy of the tissue, all specimens are mounted in the test fixture in the same position, considering their orientation when taken out. The setup allows the sample to be placed on the base plate without air bubbles, ensuring that the incompressibility assumption for the pressurized media is met.

biomedres-openaccess-journal-bjstr

Figure 3: Inflated test specimen with black & white pattern. A spot of Ø16 mm without pattern is left unpainted in the fourth quadrant of the specimen to study possible stress whitening during the loading. Photo: Fraunhofer LBF.

Evaluation of Three-Dimensional Deformation by Digital Image Correlation

The test results can be evaluated up to an approximate height of the bubble of 45 mm. Here, the maximum height is set by varying the diameter of the circular orifice. The inner diameter of the circular orifice of Ø40 to 50 mm is recommended for a test specimen (e.g., pleura or peritoneum) to obtain useful results in the evaluation. For thin tissues such as foetus vesicae, the diameter is reduced to Ø30 mm. An elliptical orifice can also be used to obtain additional stress states in the bubble for more in-depth material analysis.

Design engineers may be provided with the following data (Figure 4):

1. Time,

2. Pressure,

3. Height and curvature of bubble,

4. Principal strain,

5. Max. strain in x and y direction, and

6. Max. VON MISES equivalent strain.

biomedres-openaccess-journal-bjstr

Figure 4: Results of the evaluation of the bulge test: logarithmic strain s𝑦𝑦 at maximum load. Photo: Fraunhofer LBF.

All experimental data are available as ASCII, .jpg, and .mov files.

Modelling

Soft biological tissues are often modeled as a perfect hyperelastic material. For 3D description, the existence of the strain-energy function W is assumed: the stress response can be determined from the applied deformations alone [5].

with 𝜆i – principal stretches and 𝜎i – principal stresses related to the undeformed condition.

The W-function is unknown. Different approaches are compared in [1,8-12] among others. The polynomial RIVLIN equation for hyperelastic material behaviour, postulated without material structure considerations

contains some known W-functions. It is formulated as function of the irreducible invariants of the left CAUCHY-GREEN stretch tensor.

This RIVLIN equation can be reformulated as function of the trace 𝐼1 and residual invariants 𝐼′2 and 𝐼′3 with subtracted influence of the axiator by analogy with the axiatoric-deviatoric invariants of the stress or strain tensor [13,14]

to exclude the superposition effects in the fitting of measured data.

The first order approximation provides the neo-HOOKE model W(𝐼1) = 𝑅100 (𝐼1 − 3). The truncated series of the second order

includes the MOONEY-RIVLIN model, cf. SATO [14, 15]. The third order approximation W(𝐼1, 𝐼2 ′ , 𝐼′ 3) for compressible materials

With this method, the impact of each term in the modified equation is easy to assess. For the FEM application, the parameters are converted back into the parameters of the original RIVLIN equation which allows the use of standard implemented routines.

Conclusion

Multiaxial test data are required for reliable material description. In addition to the uniaxial tensile test, the data from the planar tensile test and bulge test should be considered. In this paper, we discuss the valid test specification for the biaxial tensile test on soft biological tissues. The setup dimensions can be easily adapted to the properties of the specimen. The approximations are visualized in 𝜆 − 𝜎, the MOONEY plot, and further diagrams. Clearly better quality of the modelling is achieved. Our tests have gained acceptance in industry and research [15-17]. The scientists analyse the individual challenges of modelling elastomeric materials and provide expertise at all levels of the design process [18,19].

For More Articles: Biomedical Journal Impact Factor: https://biomedres.us

Journals on Biomedical Research

Study on Compound Animal Feed Demand and Animal Products, Supply, Price and Marketing in Ethiopia

Introduction

In developing economies, the livestock sector is evolving in response to rapidly increasing demand for livestock products due to the human population growth, higher prosperity and urbanization [1]. Animal feed and nutrition are the essential link in the livestock production chain that is between crop cultivation and animal protein production and processing. Surging demands and struggling supplies result in stressed surroundings in which animal feed operators and farmers need to balance their activities continuously, taking into account animal performance as well as customer, consumer and societal demands [2]. Earlier study FAO [3] indicated that producing the additional food needed to feed all people and livestock in 2050 will require a 9 percent expansion of arable land, a 14 percent increase in cropping intensity and a 77 percent increase in yields. Ethiopia is a country with largest livestock population in Africa and with a huge livestock genetic diversity.

However, due to various factors, the country is far beyond the utilization of these huge resources. In the second Growth and Transformation Plan (GTP) of 2015, Ethiopian government has identified livestock sector as a new source of economic growth. In order to achieve the GTP plan on livestock sectors, feed subsector is central for all livestock commodities and is a key pillar of livestock growth and transformation from various perspectives. From economic point of view, about 70 percent of the cost of animal production is feed and suggesting economic feasibility of animal agriculture is mainly a function of quantity and quality of nutrients and the science of feeding. Thus feed is a point of convergence and a critical commodity for which all livestock species compete and it is a major pillar towards ensuring economic, social and environmental goals of livestock production [4]. Historically, the development of feed processing plants in Ethiopia dates back to the beginning of modern livestock husbandry in the early 1950’s followed by establishment of feed processing enterprises during the socialist regime. As a follow up of the new economic policy since 1991, the feed processing enterprises operated by government were privatized and a number of feed processing plants of various capacities came into operation [5].

Availability, quality and escalation of price of commercially manufactured feeds have been reported to be a major problem affecting the feed and livestock industries involved and consumers. Commercially manufactured feeds are important input for marketoriented poultry, dairy and beef production system in Ethiopia accounting for about 70-80% of total cost of production. The share of commercial feed in the total supply of all feed sources in the country is increasing from time to time to satisfy the emerging sector of poultry, dairy and beef enterprises. From [6], data on supply, demand and price over the last five years indicates that there has been a steady increase of demand, price and supply shortage of this commercially processed feeds. This situation is feared to reach a crisis proportion unless there is an emergent response to this very important demand and supply gaps that lead to high price. This issue needs attention of policy makers, development agencies and the private sector concerned to draft short- and long-term intervention plans to minimize the effects on the general economy, consumers and private sector to survive in the face of this harsh marketing realities.

Statement of the Problem

In the recent years supply and price situation of feeds and feed ingredients have shown a steady decrease and increase respectively but the dimension of this general trend was highly aggravated in the last one or two years probably due to current development related to the general inflation of food commodities in the country negatively affecting the feed and animal production sub-sector as well [4]. Commercial feed processors and modern poultry, dairy and beef farms which are seriously confronted by this supply and escalation of price are voicing their concern requesting the responsible government bodies to intervene to solve this issue through forming positive environment that encourages both private sectors involved in feed manufacturing and modern animal production.Therefore the ministry of trade and industry precedes initiative to handle the issue and establish study team from different institutions to assess the cause of the problems mentioned above and propose policy recommendation.

Scope of the study

The scope of the study is focused on commercial feed processors, price and marketing situations in market-oriented poultry, dairy and beef farms. Hence, this study was initiated with the following objectives:

General Objectives

Assessing the current compound feed and livestock product supply, price and market related constraints.

Specific objectives of the study are:

a) Studying the current status and dimension of compound feed demand, supply, price and marketing constraints

b) Indicating the major factors or reasons contributed to the development compound feed related problems particularly for the past five years

c) Identify possible strategic directions for the commercial feed sub-sector and livestock product processing industries

Methodology

The study was undertaken from March-July 2021. In this study data were collected from different private and farmers Union animal feed processors, suppliers, flour and oil industries, associations. Besides, data were collected from livestock farms like poultry, dairy, beef and others.

The methodology employed during the course of the study is indicated as follows:

a) Basic information was collected by using check list

b) Informant discussions were used to understand details of particular issues regarding key challenges and strategic directions of feed processing plants

c) Desk reviews were made from print media including published and unpublished materials, websites and others

Data Source

Primary and secondary data were collected from feed processors, poultry, dairy and beef farms, Government organizations, different associations, previous studies, different reports, prospective plans.

Data Type Used for the Study

Data were collected on production, consumption, market supply of compound feed of the year 2016/17-2020. Compound feed price, livestock product price data for the past five years were collected. Current data on direct employees at on farm, feed industry and livestock product processing industries were included.

Statistical Analysis

A Generalized linear model (Proc GLM) procedure of SAS (SAS, 2008) was used for the analysis of cereals and oil crops production and utilization from 2016-2020. The effects of year and crop type were included in the model. Then the analyzed data were organized using descriptive and inferential statistics. When there was significant difference of dependent variables among independent variables mean, comparison was undertaken using Tukey-test at P value of 95%. The model was:

Result and Discussion

Feed Ingredients Demand and Supply Dynamics

The major ingredients used to formulate compound feed include maize, sorghum, flour processing by-products (wheat bran, wheat short, rice bran), different kind of oil seed cakes (soyabean meal, Nuog seed cake, linseed cake, groundnut cake, cotton seed cake, sesame seed cake, and others), molasses, and ingredients that are added in tiny quantities to boost production (vitamins, minerals, amino acids and premixes). A list of the ingredients demanded by feed industry in 2020/21 is presented in (Table 1). As indicated the highest amount of ingredient required by feed industries is wheat followed by maize and soyabean. This is because compound feed for ruminant required more volume of maize and wheat by products (wheat bran and wheat middling) and soyabean is mainly required for poultry. Generally, demands for feed ingredients by feed processing industries were increased from 120,897 to 574,734 tons between the study periods. However, the supply of feed ingredients for feed industries was only around 50% (Table 2) and (Figure1).

biomedres-openaccess-journal-bjstr

Table 1: Feed processing ingredient quantity demand by types in 2020/2021 EC.

Note: Source: Calculated from design capacity of feed companies.

biomedres-openaccess-journal-bjstr

Table 2: Total feed ingredient demand, supplied and deficit quantity.

Note: Source: calculated from the Feed company design capacity.

biomedres-openaccess-journal-bjstr

Figure 1: Total feed ingredient demand, supply and deficit.

As Figure 2 shows demand of feed industries was increased at a faster rate than supply in the study periods. With this deficit, the feed industries had performed below their capacity. The deficit in feed industries is related with low market supply of wheat for flour industries to produce wheat bran and wheat middling, absence of the produced maize for the industries and the lower local market supply of oil seeds. This shows that as livestock sectors intensifies protein meal and cereal use would expand. This expansion should be supported by increasing oil seeds and cereal production and supply to the market. However, as observed in Table 1 market supply (sale to the market) for oil seeds and cereals were lower than the demand. The study [3], indicated that as livestock production intensifies in the coming years, protein meal use expands across most of SSA, with the fastest growth recorded in Western Africa (43%) and Eastern Africa (32%). This implies that the demand for oil seed and oil seed cake would be increased and it could be a good opportunity to produce more oil seed to utilize locally and to export.

biomedres-openaccess-journal-bjstr

Figure 2: Animal feed price increment index.

The production of cereal grain crops in Ethiopia is destined for human consumption. Consequently, only the milling by-products such as maize bran and wheat bran are available for livestock feed production. Maize bran and wheat bran are the most commonly used cereals. The most widely available oilseed cakes are Noug and sunflower. All the feed premixes are imported. The raw materials available to the animal feed industry are generally those that are produced within the country. These include oilseeds (soya, cotton and sunflower seeds maize, maize bran, wheat bran, soya cake and cotton cake.). The livestock industry is a driving demand for animal feeds especially for poultry, and poultry feed accounts over 60- 96% of the compound feed. The high demand for poultry feed is driven by increasing demand for poultry products especially due to population increase that is becoming urbanized, and higher levels of disposable income.

The highest demand for livestock products would appear that growth in the animal feeds industry will be driven by growing demand for livestock products. However, this growth has been slow owing to limited production of the major ingredients. The projected increase in demand for animal feed will put pressure on the availability of raw materials. It follows then that to meet this demand, there needs to be a corresponding increase in production of raw materials such as maize, wheat and oil seeds and as a result their by-products would be available for feed processing industries.

Compound Feed Demand by Species

The demand for animal feed is a function of livestock population, price of feed, price of substitutes, and other exogenous factors. From the data generated in 2020/21 from 60 (sixty) feed industries found throughout the country dairy, beef and poultry demanded higher volume of compound feed in their order of importance (Tables 3 & 4 and Figure 3). However, only 6.3, 2.6 and 68.7% of the compound feed were supplied for dairy, beef and poultry farms respectively. The highest gap between supply and demand was recorded for dairy feed followed by beef and poultry farms. The higher gap for ruminant is due to scarcity of wheat and non-appearance of maize in the market. Generally, the gap in supply and demand implies scarcity of cereals and oil seeds in the market, inaccessibility of some cereal (maize) in the market and as a result rising of prices and affordability of compound feed to the livestock farms. From production point of view, animal production is essentially a conversion of feed into animal product which dictates the level of production and product quality and safety. From economic point of view about 70 percent of the cost of animal production is feed and suggesting economic feasibility of animal agriculture is mainly a function of feed. The demand for animal feeds is derived from the demand for animal source food. The general trend in this regards is that demand rises in animal source food is in response to urbanization, increasing in population (3%) annually, increases in income at disposal, GDP growing at 7-8%, and preferences to ASF [7].

biomedres-openaccess-journal-bjstr

Figure 3: Total feed ingredient demand, supplied and deficit quantity for the year 2020/2021.

biomedres-openaccess-journal-bjstr

Table 3: Feed demand and supply for the years 2020/21.

Note: Source: Calculated from number of animals need this feed.

biomedres-openaccess-journal-bjstr

Table 4: Employment created by feed industries and commercial farms.

These demands justify the demand for compound feed is associated with intensification of livestock production to meet the growing demand. The demand for livestock commodities in Ethiopia is rapidly growing. Compared to the production base year of 2014/15 with estimated 167million liters of milk, 1.3 million tons of red meat and 419 million eggs, the projected demand is expected to be 1490 million liters of milk, 1.9 million tons of red meat and 3.9 billion eggs by 2020 [3]. There is a policy push to improve the current per capita consumption of livestock products in Ethiopia. However, currently one of the lowest in the World (9 kg meat, 56.2 liters milk, 4 eggs; [3] which is urgently calling for production increment and productivity improvement. Projected increment in the demand and production of beef, poultry, and others lead to substantially higher demand for compound feed. Under the baseline, the combined demand for cereals and oilseeds used as livestock feeds increases from 304,300 MT in 2010 to 608,900 MT in 2030 and 1,085,100 MT in 2050.

For this increment population growth, urbanization and income growth are important factors. These projections of feed demand quantities reflect impacts of both future economic and climatic change and are more variable in 2050 than in 2030. (FAO, 2019).

Feed and Feed Ingredient Price

Compound feeds are the sole diet for semi-intensive and intensive poultry and commonly used by dairy and fattening farms. The supply of these feed ingredients is challenged by low production of feed ingredients, rising prices and quality. Consequently, affect the access and affordability of processed feeds to livestock producers. Feed prices are determined mainly by the supply of feed, the number of animal units to be fed, and the level of livestock product prices. In recent years there are several reports from feed processors, policy makers and farmers on the rise of feed price. According to producers’ associations this situation is leading to the closing of some commercial farms both dairy and beef producers, due to low return on investment. This is supported by Joe (2008) stated that when grain prices spike can be more production of red meat and poultry, as herd sizes are reduced and/or as more animals and milk are sold to maintain cash flow to cover higher prices. This can depress farm (and wholesale) prices at least temporarily, further exacerbating the cost-price squeeze.

If current market conditions persist, meat supplies will decline and prices rise through producer attrition and reduced capacity. According to Figure 3, price of feed ingredient has shown continues increment over the past five years from 2016/17 to 2020/21. Comparing the increment growth between the base year 2016/17 and 2020/21 has shown 303.8, 244, 416, 443.5, 627.3, 112.5 and 211% for wheat bran, wheat middling, noug, groundnut, soya, linseed cake and maize respectively. The highest price increment was observed in soya bean followed by ground nut and noug seed cake. Similarly, compound feed price for different species was increased by 85.5,80, 89.6, 110.8, 239.4 and 148.8% for layer, broiler, chicken, dairy, beef and others respectively (Figure 4). The highest average price growth rate of compound feed for five years was observed in beef and dairy farms which are negatively related with the highest gap for demand and supply of compound feed for dairy and beef farms.

biomedres-openaccess-journal-bjstr

Figure 4: Feed ingredients price (9ETB/quintals).

biomedres-openaccess-journal-bjstr

Figure 5: Animal feed price (ETB/quintals).

This implies that feed supply and feed prices are negatively correlated. The lower production of cereals and oil seeds in 2019 production years have brought the maximum inflation rate in 2020 on different feed ingredients and compound feed of different species. This price surge of animal feed is induced by significant rises in the price of feed ingredients due to supply shortage and other factors. From the point of view of the supply of compound feeds, the principal cost is that of raw materials, which amount as much as 80% of operating costs and additionally there is high transport costs. According to a study by MOA and ATA 2021 the other reasons for the high prices of feed ingredients and feeds are VAT and other taxes imposed on the feed ingredients. Multiple taxations due to unnecessary long supply chain could add the VAT imposed on feed ingredients up to 60% or more (Figure 5). The involvements of brokers along the marketing chain lead to multiple taxation and elevate the price of ingredients and compound feed.

Animal Feed Ingredients and Compound Feed Inflation Rate (Price Index) for Different Species

As observed in Figure 6 the highest inflation rate (price index) for compound feed was observed in the year 2020/2021 as compared with the previous year on shoat farms followed by beef and dairy farms with the value of 55, 48 and 45% respectively. Lower price index with one digit was observed in 2017/18 production year which result from high production of oil seeds and cereals in the previous year. With regard to feed ingredients of soya bean, inflation rate (price index) was higher (>50%) than all in 2020/21 followed by ground nut, noug cake and wheat products (Figure 7). As [6-10] indicated, the country level food inflation rate was 24.1 percent in July 2021 as compared to the previous year. This shows the animal feeds inflation rate (45-55%) was much higher than food inflation rate on the same year in Ethiopia. This implies the abnormal inflation of animal feed which may be due to less production and scarcity in the market of oil seed and cereals. In addition there are many factors including illegal marketing in long value chain and artificial/ manmade.

biomedres-openaccess-journal-bjstr

Figure 6: Feed ingredient price increment index.

biomedres-openaccess-journal-bjstr

Figure 7: Average animal product price.

Price Increment Trend of Animal Source Food

As Figure 8 indicate the price of milk, beef, egg and poultry meat has raised at least three folds in the past four years with highest increment in 2020. Feed is the largest single cost item for livestock production, accounting for 70%– 80% of the total cost although energy, labor, and other inputs have increased in the last 5 years. As Figure 9 indicated, inflation rate between 2020 and 2021 for egg, milk, beef and chicken meat were 46, 37, 35.5 and 55.8% respectively. As price takers in competitive markets, animal producers cannot simply pass their higher costs on to consumers. To date, rising costs have largely been absorbed by livestock and poultry producers, often with significant financial loss. However, higher costs of production will ultimately reflected in higher prices for meat, milk, and eggs at retail counters. This apparently reduces the affordability of livestock products by consumers and will reduce purchasing power of consumers.

biomedres-openaccess-journal-bjstr

Figure 8: Animal product price increment index (%).

biomedres-openaccess-journal-bjstr

Figure 9: Industry product is plagued by inefficient linkage between actors leading to decrease production quantity, multiple taxes and higher price.

This in turn reduces the demand of livestock product by the consumers and livestock producers reduce their supply and would go to bankruptcy or financial loss. This will also affect the current per capita consumption of livestock products in Ethiopia, which is one of the lowest in the World (9 kg meat, 56.2 liters milk, 4 eggs; [3]. In contrary to the current higher inflation rate on beef meat in Ethiopia which would reduce beef consumption and production, the study [2] described that beef consumption growth is strong across the region (SSA), expanding by 2.6% to 2025. Growth is particularly strong in Eastern and Western Africa, where rates exceed 4%. Within these regions, consumption growth is mainly driven by Kenya, Tanzania, Ethiopia, Zambia and Nigeria, all of which increase consumption by an annual average of at least 3%. The same study continued that notwithstanding the small base, the projected expansion of 35% in total meat consumption by 2025 outpaces any other region in the world.

Underpinned by rising incomes, urbanization and sustained population growth, robust consumption growth is projected across most of SSA, with an expansion of more than 38% evident in Central, Western and Eastern Africa. Egg consumption provides an important alternative that reflects consumption growth of 36% over the ten year period. Consumption growth is also robust across the region and exceeds 50% in Eastern Africa. This all shows the high demand of animal products in Africa which provide high local and export market for Ethiopia. Livestock improve food and nutrition security as ASF are rich in major and micro-nutrients. ASF are a major source of iron, zinc, calcium, riboflavin, vitamin A, vitamin B-12, and retinol, which have numerous benefits including linear growth, cognitive development and general health, leading to long term improvements in income and productivity.

Milk in particular contains several critical micronutrients such as calcium, vitamin A, riboflavin and vitamin B12 that are essential for growth and development of children older than 12 months. Children, pregnant and lactating mothers should be receiving ASF, whose consumption currently is quite low. However, to assure that this increased local demand can be met by local supply and not by imports, more attention will need to be paid to feed price and the facilitation of an enabling environment that will allow for efficient livestock feed industry.

The Status of Compound Feed Industry

Over the past decade, the use of compound feed and feed supplements has increased. In the year 2020/21the livestock feed industry required 1,944,490tons of compound feed. Unfortunately, despite adequate installed production capacity, only 292,761.90tons of feed were produced. The shortfall in production was attributed to an inadequate supply of raw materials. A total of about 32 privately owned and 28 cooperatives feed processing plants are currently operational in Ethiopia. The feed processing plants owned by private companies and cooperatives engaged in production of compound feed. In terms of facilities, all the privately owned feed processing plants have feed mill, mixer and storage places for ingredients and for processed feeds. Only few plants mill limestone and make multi-nutrient blocks.

Pellet maker is limited to two feed processing plants, liquid mixer exists only in one feed processing plant and no feed processing plant has a laboratory for analysis of ingredients and feeds. Most feed processing plants are currently operating below their installed capacity mainly due to low demand for the product, shortage of ingredients supply and inconsistent supply of electricity. Average operational capacity of feed processing plants at farmers’ unions level is 2.0 tones per hour [5]. In terms of operational capacity as percentage of installed capacity for the feed mixer, farmers’ unions are currently operating at an average processing capacity of 66 percent. Traditionally the feed industry has been linked to the supply of the raw materials, as these were generally the by-products of other processes and of low value relative to the main product. However, market orientation mainly as a result of advances in nutritional science the value has improved to great degree. At the same time nutritional knowledge has become more widespread, so that the demand for byproducts has increased and their prices have risen, thereby reducing the advantages of supply orientation. At the same time, since the distribution system is often poor, and since feeds are usually made for particular markets, sales advantages are likely to be gained from market proximity.

Employment and Socio-Economic Importance

The feed manufacturing industry also plays an important role in the socio-economic development in the country, making important contributions to employment, income generation, and to linkages within the value chain. Furthermore, an efficient animal feed industry, producing affordable feed of high quality, can help and ensure that smallholder livestock keepers are not excluded from the market opportunities presented by the socio-economic transformation taking place.

Marketing of Compund Feed

Even though Agro-industrial factories (flour mills, oil mills) are VAT registered, they sell their products to middlemen, and the brokers without a receipt. This make that the market is engulfed in illegal trade and leading to widespread shortages and inflation. On the other hand, the lack of market linkages and the lack of chain of command have created favorable conditions for brokers and traders. Several government institutions are actors in supporting the feed industry development; however, there are weak interests to collaborate and coordination efforts. It is common practice of making decisions on feed industries without taking situation of the food processing industries into account. The lack of a formal marketing system for the by-products of the flour and oil mills used by the feed industry and the lack of a single institution around the market is creating a serious problem for the feed and fodder inputs and creating favorable conditions for brokers and greedy traders to lower their prices.

Conclusion

The highest gap between demand and supply was recorded for dairy compound feed followed by beef and poultry. Inflation rate of feed ingredients and livestock products (the product of feed ingredients) were higher as compared to inflation rate of food items. Feed prices are determined mainly by the supply of feed, the number of animal units to be fed, and the level of livestock product prices. Main reasons for the high prices of feed ingredients and processed feeds are VAT and other taxes imposed on the feed ingredients, export of feed ingredients, oil seeds and oil factory by products. Multiple taxes due to unnecessary long supply chain adds the VAT imposed on feed ingredients up to 60% or more.

For More Articles: Biomedical Journal Impact Factor: https://biomedres.us