Biomedical Journal of Scientific & Technical Research (BJSTR) is a multidisciplinary, scholarly Open Access publisher focused on Genetic, Biomedical and Remedial missions in relation with Technical Knowledge as well.
Study of COVID 19, COVID 19 Vaccination and its Impact
Introduction
COVID-19 has rapidly become a major public health crisis, affecting 86.4 million individuals, and causing 1.9 million deaths globally by January of 2021. The US has reported more than 21 million cases and 357,000 deaths as of 5 January 2021 [1]. To curb this pandemic, apart from effective public health measures such as social distancing, wearing face masks, hand washing, and avoidance of crowded indoor spaces, educating the general population, efficacious vaccination is emerging as essential to mitigating disease and death [2-6]. Despite unprecedented movement restrictions, social distancing measures, and stay-at-home orders enacted in many countries, the COVID-19 pandemic has caused devastating morbidity and mortality. However, the vast majority of the global population remains susceptible to COVID-19, highlighting the need for an effective vaccine. To mitigate the mounting burden of COVID-19, vaccine development has occurred at an unprecedented pace. As of December 31, 2020, safety and efficacy results for a number of vaccines have been reported, and Phase III clinical trials for several other candidates are underway [5]. Results from two large efficacy trials (Pfizer – BioNTech, Moderna) indicate a vaccine efficacy of over 90% against symptomatic and severe disease, exceeding the preferred population-based efficacy specified by the World Health Organization and the United States (US) Food and Drug Administration (FDA).
These vaccines have received emergency use authorization by the FDA, and vaccination has already started in the US with prioritization of healthcare workers, long-term care residents, and high-risk individuals. This compels an urgent need to understand the potential population-level impact of vaccination on COVID-19 transmission and disease outcomes [6]. COVID 19 has emerged as greatest challenge that has weakened the very basis of human existence. It has devastated economies and created unparralled human needs. It has overstretched health systems that has been seen never before. Even plague of middle age Europe and Spanish flu were less devastating than COVID 19 pandemic. The study aimed at showing the impact of vaccination on people.
Objective
Study of impact of COVID 19 vaccination.
Methodology
• Study design: Prospective study design.
• Study duration: Two weeks.
• Study setting: Multi centric study, hospital and community based.
• Study tool: A Predesigned and pretested proforma validated by a pilot study.
• Sampling: Simple random sampling.
• Exclusion criteria: Preprocedural cases.
Data analysis
The data was received from the answered questionnaires and was plotted on excel 2013. The data was analyzed statistically with the help of statistical software SPSS v19. All the continuous variables of the study were represented by the descriptive statistics and all the categorical variables in the term of frequency and percentage.
Result
(Tables 1-4).
Table 1: Total Subjects.
Table 2: Vaccination Status.
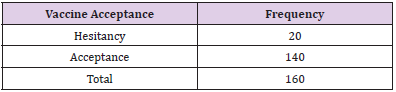
Table 3: Vaccine Acceptance.
Table 4: Side Effects of Vaccination.
Discussion
COVID-19 outbreaks have caused significant global morbidity and mortality, in addition to undermining the economic and social well-being of individuals and communities. Despite this devastating toll, the majority of the population remains susceptible to SARSCoV- 2 infection. Thus, vaccine development has been a high priority. The scale and speed of vaccine development efforts have been unprecedented, and highly protective vaccines are beginning to be distributed. This study shows that COVID-19 vaccines with 95% efficacy in preventing disease, even if they conferred limited protection against infection, could substantially mitigate future attack rates, hospitalizations, and deaths. Given the limited population-level immunity to COVID-19, vaccination remains a key preventive measure to reduce disease burden and mitigate future outbreaks. Our study suggests that a vaccine could have a substantial impact on reducing incidence, hospitalizations, and deaths, especially among vulnerable individuals with comorbidities and risk factors associated with severe COVID-19. Thus, mobilizing public health resources is imperative to achieve the proposed goal of distributing 100 million vaccine doses over 100 days in the US population by the incoming administration.
Our findings support the Advisory Committee on Immunization Practices recommendations, highlighting that a targeted vaccination strategy can effectively mitigate disease burden and the societal impact of COVID-19. We also find that, even with the relatively rapid roll-out simulated here, it may take several months to control COVID-19 at the population level. Moreover, this impact is achieved in the context of continued public health efforts and is not possible without diligent attention to the other aspects of infection prevention and control such as masking, hand hygiene, testing, contact-tracing, and isolation of infected cases. If current vaccination programs are accompanied by widespread relaxation of other measures, a much higher coverage will be necessary with a significantly higher distribution capacity. Nevertheless, our results are an encouraging signal of the power and promise of vaccines against COVID-19.
Summary
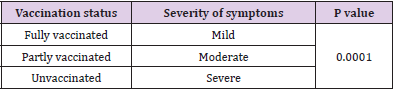
Vaccination with a 95% efficacy against disease could substantially mitigate future attack rates, hospitalizations, and deaths, even if only adults are vaccinated. Non-pharmaceutical interventions remain an important part of outbreak response as vaccines are distributed over time. A multicentric study was carried out two sites. A total of 160 patients were studied, 80 in a hospital set up and 80 in community. It was observed that severity of symptoms in cases who had received vaccination was less as compared to unvaccinated lot. Also, the vaccination was viewed positively by the majority of the respondents.
Study of COVID 19, COVID 19 Vaccination and its Impact
Introduction
COVID-19 has rapidly become a major public health crisis, affecting 86.4 million individuals, and causing 1.9 million deaths globally by January of 2021. The US has reported more than 21 million cases and 357,000 deaths as of 5 January 2021 [1]. To curb this pandemic, apart from effective public health measures such as social distancing, wearing face masks, hand washing, and avoidance of crowded indoor spaces, educating the general population, efficacious vaccination is emerging as essential to mitigating disease and death [2-6]. Despite unprecedented movement restrictions, social distancing measures, and stay-at-home orders enacted in many countries, the COVID-19 pandemic has caused devastating morbidity and mortality. However, the vast majority of the global population remains susceptible to COVID-19, highlighting the need for an effective vaccine. To mitigate the mounting burden of COVID-19, vaccine development has occurred at an unprecedented pace. As of December 31, 2020, safety and efficacy results for a number of vaccines have been reported, and Phase III clinical trials for several other candidates are underway [5]. Results from two large efficacy trials (Pfizer – BioNTech, Moderna) indicate a vaccine efficacy of over 90% against symptomatic and severe disease, exceeding the preferred population-based efficacy specified by the World Health Organization and the United States (US) Food and Drug Administration (FDA).
These vaccines have received emergency use authorization by the FDA, and vaccination has already started in the US with prioritization of healthcare workers, long-term care residents, and high-risk individuals. This compels an urgent need to understand the potential population-level impact of vaccination on COVID-19 transmission and disease outcomes [6]. COVID 19 has emerged as greatest challenge that has weakened the very basis of human existence. It has devastated economies and created unparralled human needs. It has overstretched health systems that has been seen never before. Even plague of middle age Europe and Spanish flu were less devastating than COVID 19 pandemic. The study aimed at showing the impact of vaccination on people.
Objective
Study of impact of COVID 19 vaccination.
Methodology
• Study design: Prospective study design.
• Study duration: Two weeks.
• Study setting: Multi centric study, hospital and community based.
• Study tool: A Predesigned and pretested proforma validated by a pilot study.
• Sampling: Simple random sampling.
• Exclusion criteria: Preprocedural cases.
Data analysis
The data was received from the answered questionnaires and was plotted on excel 2013. The data was analyzed statistically with the help of statistical software SPSS v19. All the continuous variables of the study were represented by the descriptive statistics and all the categorical variables in the term of frequency and percentage.
Result
(Tables 1-4).
Table 1: Total Subjects.
Table 2: Vaccination Status.
Table 3: Vaccine Acceptance.
Table 4: Side Effects of Vaccination.
Discussion
COVID-19 outbreaks have caused significant global morbidity and mortality, in addition to undermining the economic and social well-being of individuals and communities. Despite this devastating toll, the majority of the population remains susceptible to SARSCoV- 2 infection. Thus, vaccine development has been a high priority. The scale and speed of vaccine development efforts have been unprecedented, and highly protective vaccines are beginning to be distributed. This study shows that COVID-19 vaccines with 95% efficacy in preventing disease, even if they conferred limited protection against infection, could substantially mitigate future attack rates, hospitalizations, and deaths. Given the limited population-level immunity to COVID-19, vaccination remains a key preventive measure to reduce disease burden and mitigate future outbreaks. Our study suggests that a vaccine could have a substantial impact on reducing incidence, hospitalizations, and deaths, especially among vulnerable individuals with comorbidities and risk factors associated with severe COVID-19. Thus, mobilizing public health resources is imperative to achieve the proposed goal of distributing 100 million vaccine doses over 100 days in the US population by the incoming administration.
Our findings support the Advisory Committee on Immunization Practices recommendations, highlighting that a targeted vaccination strategy can effectively mitigate disease burden and the societal impact of COVID-19. We also find that, even with the relatively rapid roll-out simulated here, it may take several months to control COVID-19 at the population level. Moreover, this impact is achieved in the context of continued public health efforts and is not possible without diligent attention to the other aspects of infection prevention and control such as masking, hand hygiene, testing, contact-tracing, and isolation of infected cases. If current vaccination programs are accompanied by widespread relaxation of other measures, a much higher coverage will be necessary with a significantly higher distribution capacity. Nevertheless, our results are an encouraging signal of the power and promise of vaccines against COVID-19.
Summary
Vaccination with a 95% efficacy against disease could substantially mitigate future attack rates, hospitalizations, and deaths, even if only adults are vaccinated. Non-pharmaceutical interventions remain an important part of outbreak response as vaccines are distributed over time. A multicentric study was carried out two sites. A total of 160 patients were studied, 80 in a hospital set up and 80 in community. It was observed that severity of symptoms in cases who had received vaccination was less as compared to unvaccinated lot. Also, the vaccination was viewed positively by the majority of the respondents.
The Effect of Abrasive Peeling of Wheat-Triticale Grinding Grain Mixture on the Yield of Intermediate Grinding Products and Flour
Introduction
The actual directions of development of one of the most important branches of the processing industry – flour milling – are both the improvement of technologies for processing traditional crops (wheat and rye) and the development of new technologies for processing non-traditional crops, such as triticale [1-7]. One of the main areas of development of the industry is the development of new and improvement of traditional technologies and the creation of processed products of various types of grain with a given composition and properties, incl. and products of deep processing [8-12]. In addition, the direction of joint processing of grain of various crops, including those based on wheat and triticale, is very promising. Triticale is the first grain crop created by man and obtained by crossing wheat (lat. Triticum) and rye (lat. Secale). The use of triticale as a food crop is an interesting, promising direction not only for flour milling, but also for other food and processing industries. This is confirmed by the increased interest in this culture, both on the part of researchers and food producers, not only in our country, but also abroad. Bakery products with the use of processed products from the central part of the triticale grain endosperm are characterized by increased nutritional value due to a higher content of protein and essential amino acids the main limiting acid, lysine [13-16]. The combination of the positive properties of rye – a high content of biologically active aromatic substances and wheat – the rheological properties of the dough, make it possible to produce food products of mass consumption from triticale grain processing products and mixtures based on it. At the same time, the technological properties of baking flour obtained from various grain mixtures, including wheat-triticale grain grinding mixture, remain little studied. Peeling of the wheattriticale grain mixture during varietal bakery grinding is carried out to maximize the cleaning of the grain surface from dust, dirt, mold, bacteria, as well as to reduce and simplify the length of the technological scheme [1-3]. Removal of surface shells with the use of shelling machines allows, in addition, to reduce the number of torn and grinding systems and to shorten the technological process of processing the grinding wheat-triticale grain mixture into flour.
When using abrasive peeling in the finished product, the number of shell particles decreases, and its appearance improves [1-2]. The ash content of the grinding grain mixture of wheat and triticale after peeling is reduced.
Removing shells allows you to:
1. Get a more solid and hygienic clean product.
2. To receive baking flour with a higher whiteness index from tattered systems.
3. Significantly reduce the number of grinding and sieve systems, simplify the technological scheme of grinding.
In addition, it should be noted that in the process of peeling, not only impurities are removed from the surface of the grain, but also part of the fruit and seed coats. This, on the one hand, has a positive effect on reducing the grain moisture process, but on the other hand, due to the exposure of the endosperm and injury to the grain germ, it can lead to the loss of its viability, which is not given enough attention. In this regard, additional studies of the peeling process and its effect on the properties of wheat grain are required [3]. The purpose of our research is to determine the effect of abrasive peeling on the yield of intermediate grinding products and flour during the processing of a hulled wheat-triticale grain mixture with varietal bakery grinding.
Materials and Methods of Research
In studies conducted at the Department of “Grains, Bakery and Confectionery Technologies” of the Federal State Budgetary Educational Institution of Higher Education “MGUPP” and at the Department of Food Technologies and Restaurant Business Organization at the Oryol State University. I.S. Turgenev conducted experiments to determine the effect of the degree of peeling of the wheat-triticale grain mixture on the yield of intermediate grinding products. The objects of research were the wheat variety “Radmira” and the triticale variety “Nemchinovsky 56”, bred by the breeders of the Federal State Budgetary Scientific Institution “Federal Research Center “Nemchinovka” and differing from other wheat varieties in the increased protein content of the 2020 harvest. The main physicochemical and chemical parameters of the initial wheattriticale grain mixture are as follows: moisture content – 11.2%, ash content – 1.83%, protein content – 13.2%, gluten content – 23.8%, gluten quality – 79 units device, glassiness – 46% and the falling number – 354 seconds. When preparing a wheat-triticale grain mixture for laboratory grinding as a hydrothermal treatment (HTT), a mandatory operation for varietal grinding, cold conditioning was used as the most common method and the cheapest way. After hydrothermal treatment, before grinding wheat-triticale grain mixtures, abrasive peeling was carried out. For grinding, an MLP-4 laboratory grinding mill with cut rollers with back-to-back corrugations was used.
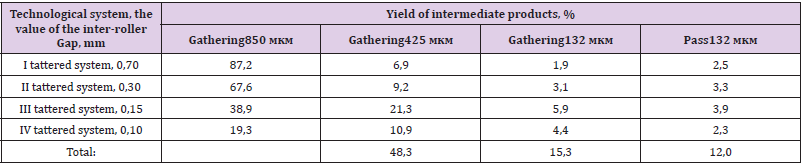
The main mechanical and kinematic indicators of the MLP-4 mill with cut rollers are as follows: productivity – up to 100 kg / h, the speed of the rapidly rotating roller is 4.5 m/s, the differential is 1.75, the location of the flutes is back-to-back, the number of flutes per 1 linear centimeter is 8 pieces, the slope of the flutes is 8%. The gap between the rollers on the I torn system was 700 μm, on the II torn system – 300 μm, on the III torn system – 150 μm and on the IV torn system – 100 μm. When conducting research to determine the effect of the number of shells removed during abrasive peeling of wheat-triticale grain mixtures on the yield of intermediate grinding products, laboratory grinding of shelled wheat-triticale grain mixtures was carried out with preliminary removal of shells in the amount of 2.5%, 5.0%, 7, 5%, 10% and control sample without peeling. Further, laboratory grinding was carried out and 4 out of 5 main, groat-forming tattered systems were modeled when grinding the initial wheat-triticale mixture and hulled wheat-triticale grain mixtures. The data obtained to determine the effect of abrasive hulling on the grain-forming ability of hulled wheat-triticale grain mixtures are presented in (Tables 1-5). As can be seen from (Table 1), the yield of intermediate products of grinding during the processing of the original wheat-triticale grain mixture without peeling, sent for grinding-to-grinding systems, was 63.6%, the yield of wheat-triticale flour was 12.0%, the yield of the end product sent on the V tattered system, amounted to 19.3%.
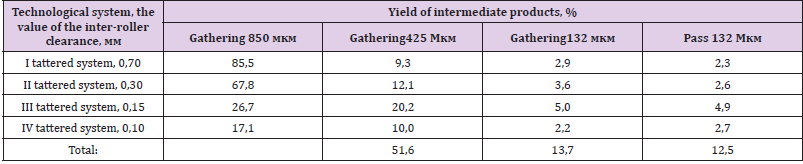
Table 1: Yield of intermediate products of grinding and flour of the initial wheat-triticale grain mixture without peeling.
Table 2: The yield of intermediate products of grinding and flour during the processing of hulled wheat-triticale grain mixtures with the removal of 2.5% of the shells.
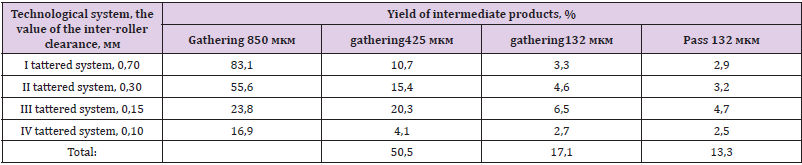
Table 3: The yield of intermediate products of grinding and flour during the processing of hulled wheat-triticale grain mixtures with the removal of 5.0% of the shells.
Table 4: The yield of intermediate products of grinding and flour during the processing of hulled wheat-triticale grain-mixtures with the removal of 7.5% of the shells.
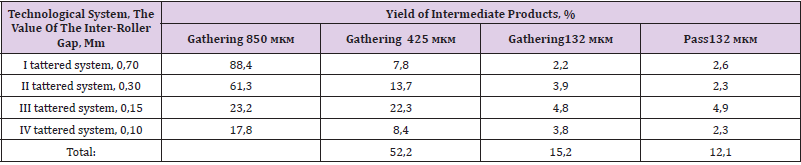
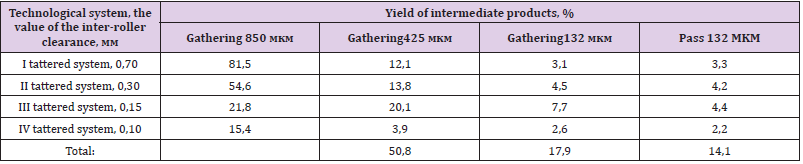
Table 5: The yield of intermediate products of grinding and flour during the processing of hulled wheat-triticale grain mixtures with 10% shell removal.
As can be seen from (Table 2), the yield of intermediate products of grinding during the processing of hulled wheattriticale grain mixture with the removal of 2.5% sent for grindingto- grinding systems was 67.4%, the yield of wheat-triticale flour was 12.1%, the yield of of the product sent to the V torn system amounted to 17.8%. As can be seen from (Table 3), the yield of intermediate products of grinding during the processing of hulled wheat-triticale grain mixture with the removal of 5.0%, sent for grinding-to-grinding systems, was 65.3%, the yield of wheattriticale flour was 12.5%, the yield of of the product sent to the V torn system amounted to 17.1%. As can be seen from (Table 4), the yield of intermediate products of grinding during the processing of hulled wheat-triticale grain mixture with the removal of 7.5%, sent for grinding-to-grinding systems, was 67.6%, the yield of wheat-triticale flour was 13.3%, the yield of of the product directed to the V torn system amounted to 16.9%. As can be seen from (Table 5), the yield of intermediate products of grinding during the processing of hulled wheat-triticale grain mixture with the removal of 10.0%, sent for grinding-to-grinding systems, was 68.7%, the yield of wheat-triticale flour was 14.1%, the yield of of the product directed to the V torn system amounted to 15.4%. Thus, according to the results of the studies, it was found that the highest yield of intermediate products of grinding and flour during the processing of wheat-triticale grain mixture is obtained when 10% of the shells are removed and is 82.8%, which is 6.9% more compared to the original non-husked grain.
Conclusion
Thus, according to the results of the studies, it was found that abrasive peeling with the removal of up to 10% of the shells of wheat-triticale grain mixtures before grinding into varietal baking flour has a positive effect on the grain-forming ability and leads to an increase in the yield of intermediate coarse dunst products of grinding and an increase in the yield of flour on torn systems. The highest yield of intermediate products of grinding and flour during processing of the initial wheat-triticale grain mixture is obtained by removing 10% of the shells and is 82.8%, which is 6.9% more compared to the original non-hulled wheat-triticale grain mixture.
The Effect of Abrasive Peeling of Wheat-Triticale Grinding Grain Mixture on the Yield of Intermediate Grinding Products and Flour
Introduction
The actual directions of development of one of the most important branches of the processing industry – flour milling – are both the improvement of technologies for processing traditional crops (wheat and rye) and the development of new technologies for processing non-traditional crops, such as triticale [1-7]. One of the main areas of development of the industry is the development of new and improvement of traditional technologies and the creation of processed products of various types of grain with a given composition and properties, incl. and products of deep processing [8-12]. In addition, the direction of joint processing of grain of various crops, including those based on wheat and triticale, is very promising. Triticale is the first grain crop created by man and obtained by crossing wheat (lat. Triticum) and rye (lat. Secale). The use of triticale as a food crop is an interesting, promising direction not only for flour milling, but also for other food and processing industries. This is confirmed by the increased interest in this culture, both on the part of researchers and food producers, not only in our country, but also abroad. Bakery products with the use of processed products from the central part of the triticale grain endosperm are characterized by increased nutritional value due to a higher content of protein and essential amino acids the main limiting acid, lysine [13-16]. The combination of the positive properties of rye – a high content of biologically active aromatic substances and wheat – the rheological properties of the dough, make it possible to produce food products of mass consumption from triticale grain processing products and mixtures based on it. At the same time, the technological properties of baking flour obtained from various grain mixtures, including wheat-triticale grain grinding mixture, remain little studied. Peeling of the wheattriticale grain mixture during varietal bakery grinding is carried out to maximize the cleaning of the grain surface from dust, dirt, mold, bacteria, as well as to reduce and simplify the length of the technological scheme [1-3]. Removal of surface shells with the use of shelling machines allows, in addition, to reduce the number of torn and grinding systems and to shorten the technological process of processing the grinding wheat-triticale grain mixture into flour.
When using abrasive peeling in the finished product, the number of shell particles decreases, and its appearance improves [1-2]. The ash content of the grinding grain mixture of wheat and triticale after peeling is reduced.
Removing shells allows you to:
1. Get a more solid and hygienic clean product.
2. To receive baking flour with a higher whiteness index from tattered systems.
3. Significantly reduce the number of grinding and sieve systems, simplify the technological scheme of grinding.
In addition, it should be noted that in the process of peeling, not only impurities are removed from the surface of the grain, but also part of the fruit and seed coats. This, on the one hand, has a positive effect on reducing the grain moisture process, but on the other hand, due to the exposure of the endosperm and injury to the grain germ, it can lead to the loss of its viability, which is not given enough attention. In this regard, additional studies of the peeling process and its effect on the properties of wheat grain are required [3]. The purpose of our research is to determine the effect of abrasive peeling on the yield of intermediate grinding products and flour during the processing of a hulled wheat-triticale grain mixture with varietal bakery grinding.
Materials and Methods of Research
In studies conducted at the Department of “Grains, Bakery and Confectionery Technologies” of the Federal State Budgetary Educational Institution of Higher Education “MGUPP” and at the Department of Food Technologies and Restaurant Business Organization at the Oryol State University. I.S. Turgenev conducted experiments to determine the effect of the degree of peeling of the wheat-triticale grain mixture on the yield of intermediate grinding products. The objects of research were the wheat variety “Radmira” and the triticale variety “Nemchinovsky 56”, bred by the breeders of the Federal State Budgetary Scientific Institution “Federal Research Center “Nemchinovka” and differing from other wheat varieties in the increased protein content of the 2020 harvest. The main physicochemical and chemical parameters of the initial wheattriticale grain mixture are as follows: moisture content – 11.2%, ash content – 1.83%, protein content – 13.2%, gluten content – 23.8%, gluten quality – 79 units device, glassiness – 46% and the falling number – 354 seconds. When preparing a wheat-triticale grain mixture for laboratory grinding as a hydrothermal treatment (HTT), a mandatory operation for varietal grinding, cold conditioning was used as the most common method and the cheapest way. After hydrothermal treatment, before grinding wheat-triticale grain mixtures, abrasive peeling was carried out. For grinding, an MLP-4 laboratory grinding mill with cut rollers with back-to-back corrugations was used.
The main mechanical and kinematic indicators of the MLP-4 mill with cut rollers are as follows: productivity – up to 100 kg / h, the speed of the rapidly rotating roller is 4.5 m/s, the differential is 1.75, the location of the flutes is back-to-back, the number of flutes per 1 linear centimeter is 8 pieces, the slope of the flutes is 8%. The gap between the rollers on the I torn system was 700 μm, on the II torn system – 300 μm, on the III torn system – 150 μm and on the IV torn system – 100 μm. When conducting research to determine the effect of the number of shells removed during abrasive peeling of wheat-triticale grain mixtures on the yield of intermediate grinding products, laboratory grinding of shelled wheat-triticale grain mixtures was carried out with preliminary removal of shells in the amount of 2.5%, 5.0%, 7, 5%, 10% and control sample without peeling. Further, laboratory grinding was carried out and 4 out of 5 main, groat-forming tattered systems were modeled when grinding the initial wheat-triticale mixture and hulled wheat-triticale grain mixtures. The data obtained to determine the effect of abrasive hulling on the grain-forming ability of hulled wheat-triticale grain mixtures are presented in (Tables 1-5). As can be seen from (Table 1), the yield of intermediate products of grinding during the processing of the original wheat-triticale grain mixture without peeling, sent for grinding-to-grinding systems, was 63.6%, the yield of wheat-triticale flour was 12.0%, the yield of the end product sent on the V tattered system, amounted to 19.3%.
Table 1: Yield of intermediate products of grinding and flour of the initial wheat-triticale grain mixture without peeling.
Table 2: The yield of intermediate products of grinding and flour during the processing of hulled wheat-triticale grain mixtures with the removal of 2.5% of the shells.
Table 3: The yield of intermediate products of grinding and flour during the processing of hulled wheat-triticale grain mixtures with the removal of 5.0% of the shells.
Table 4: The yield of intermediate products of grinding and flour during the processing of hulled wheat-triticale grain-mixtures with the removal of 7.5% of the shells.
Table 5: The yield of intermediate products of grinding and flour during the processing of hulled wheat-triticale grain mixtures with 10% shell removal.
As can be seen from (Table 2), the yield of intermediate products of grinding during the processing of hulled wheattriticale grain mixture with the removal of 2.5% sent for grindingto- grinding systems was 67.4%, the yield of wheat-triticale flour was 12.1%, the yield of of the product sent to the V torn system amounted to 17.8%. As can be seen from (Table 3), the yield of intermediate products of grinding during the processing of hulled wheat-triticale grain mixture with the removal of 5.0%, sent for grinding-to-grinding systems, was 65.3%, the yield of wheattriticale flour was 12.5%, the yield of of the product sent to the V torn system amounted to 17.1%. As can be seen from (Table 4), the yield of intermediate products of grinding during the processing of hulled wheat-triticale grain mixture with the removal of 7.5%, sent for grinding-to-grinding systems, was 67.6%, the yield of wheat-triticale flour was 13.3%, the yield of of the product directed to the V torn system amounted to 16.9%. As can be seen from (Table 5), the yield of intermediate products of grinding during the processing of hulled wheat-triticale grain mixture with the removal of 10.0%, sent for grinding-to-grinding systems, was 68.7%, the yield of wheat-triticale flour was 14.1%, the yield of of the product directed to the V torn system amounted to 15.4%. Thus, according to the results of the studies, it was found that the highest yield of intermediate products of grinding and flour during the processing of wheat-triticale grain mixture is obtained when 10% of the shells are removed and is 82.8%, which is 6.9% more compared to the original non-husked grain.
Conclusion
Thus, according to the results of the studies, it was found that abrasive peeling with the removal of up to 10% of the shells of wheat-triticale grain mixtures before grinding into varietal baking flour has a positive effect on the grain-forming ability and leads to an increase in the yield of intermediate coarse dunst products of grinding and an increase in the yield of flour on torn systems. The highest yield of intermediate products of grinding and flour during processing of the initial wheat-triticale grain mixture is obtained by removing 10% of the shells and is 82.8%, which is 6.9% more compared to the original non-hulled wheat-triticale grain mixture.
Synthesis of CVD Diamond Nanoparticles and Cytotoxicity Evaluation in Murine Metastatic Melanoma Cells
Introduction
Diamond has a diversity of extraordinary properties that continue to attract scientific interest in the search for new technological applications [1-3]. This widespread interest has led to new approaches to grow and process diamonds and diamond films [4]. A series of applications have been developed based on the combination of diamond properties and the multiplicity of film properties obtained by combining the microstructure, morphological surface, impurities, and surfaces [4,5]. Diamond Nanoparticles (DNPs) are a class of carbon-based nanomaterials of increasing interest in science and technology [3], including their use as a drug delivery [4]. DNPs are inert [5], optically transparent, photoluminescent [6], and biocompatible [7]. The application of DNPs as a drug delivery platform for cancer therapy is based on the known passive tumor targeting due to the enhanced permeability and retention (EPR) effect of NPs with 30–100 nm. The efficiency of DNPs as drug delivery has been proven to be a result of increased vascular permeability provided by DNPs [4,8]. Additionally, DNPs have been shown to remain inside the cell for a longer period of time, increasing the efficiency of chemotherapeutic treatment. These effects are probably a result of the cell internalization of DNPs by endocytosis [8], which may eventually carry also external compounds into the cell due to their complexation with DNPs [9]. Since DNPs can bind tightly to a variety of molecules and deliver them directly to a tumor [10], the use of DNPs as delivery agents considerably reduces the toxic side effects of chemotherapy [11]. Therefore, DNPs are a useful tool in the search for better drug administration against cancer via an induced permeability of vascular barrier [3,12].
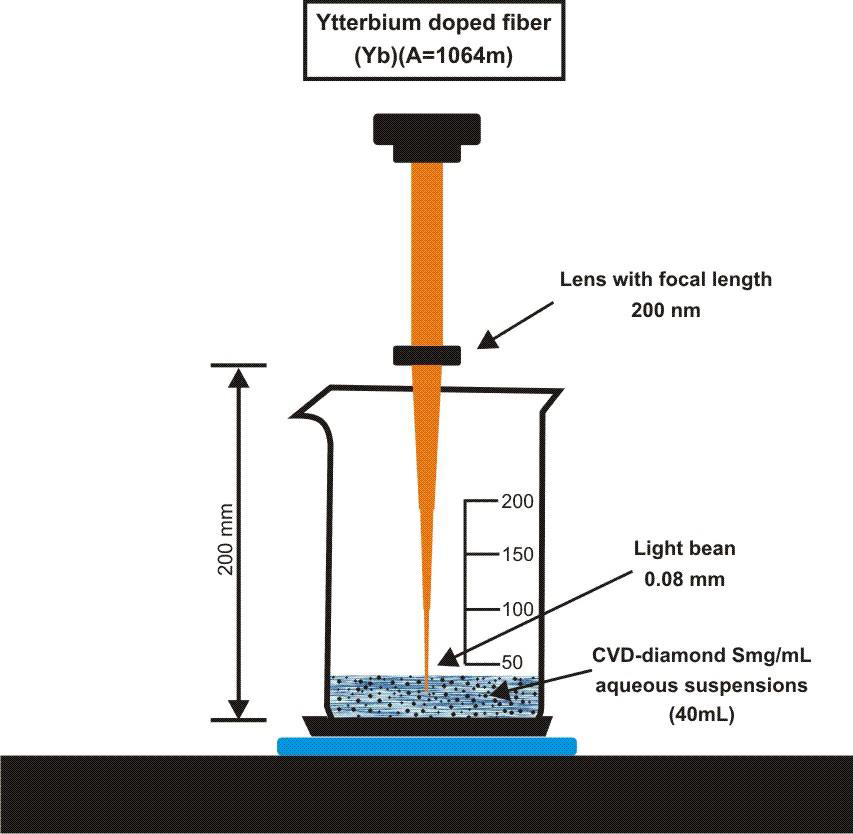
As with all commercial applications, cost-efficient production methods are as important as the application itself. Current research has focused on how DNPs can be synthesized through explosions. More recent studies indicate that the synthesis of detonation DNPs has already been optimized for a commercial scale, with rigid structure clusters that can reach hundreds of nanometers or even several micrometers [12]. Therefore, for most of its applications, particularly in biology and medicine, DNPs must be purified after synthesis [13]. Other ways to synthesize may be classified in two approaches: “bottom-up”, when atoms are aggregated to originate the nanomaterial, and “top-down”, when the material is removed from a bulk structure [14,15]. Pulsed laser ablation used in. this study is a top-down approach and is gaining special attention within the scientific community [16-18]. This study focused on producing low-cost CVD-Diamond Nanoparticles (CVD-DNPs) and their cytotoxicity, to evaluate a possible application as drug delivery platform. To synthesize CVD-DNPs, the Synthetic CVD-diamond was obtained by an innovative technology manufacturing from the CVDVale company. The CVDVale uses hot-filament chemical vapor deposition (HFCVD), which makes the CVD diamonds suitable for implantable medical, dental, and drug delivery interests. This work addresses the use of LASER ablation and evaluates the impact of this technique on the particle size, morphology, and cytotoxicity of CVD-DNPs.
Materials and Methods
CVD Diamond Productions
For diamond film growth, the HFCVD reactor employed composed of a set of 6 tungsten filaments, with 125-μm diameter and 4-mm equidistant, maintained at a temperature of approximately 2200°C. The total gas pressure was 50 Torr during the 3 h of growth. The reactive gas mixture consisted of 2% CH4 and 98% H2. The ramp downturn off period was 1h. The sample was placed on the substrate holder at a distance of 5 mm for growth at 700°C, which was approximately 0.43 μm/h and 10 mm for growth at 550°C. An approximately 30 to 50 micrometer microcrystalline diamond was grown in columnar structure without re-nucleation. This is process was used at CVDVale, which is a company specialized in the CVDdiamond coating.
Synthesis and Preparation of the CVD Nano-Diamond Suspensions
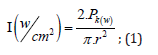
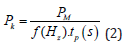
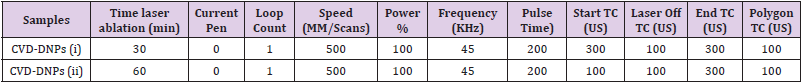
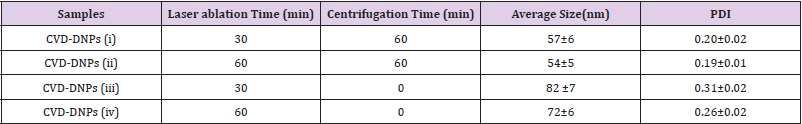
To perform the laser ablation process, we used CVD-diamond film obtained via the HFCVD technique provided from the CVDVale Company. CVD diamond film, 30 μm thick, was macerated using an agate mortar and pestle, and sifted in a granulometry sieve of 200 mesh (0.074 mm of mesh opening). CVD-diamond 5 mg/mL aqueous suspensions from Deionizer Millipore Milli-Q system (40 mL volume) were prepared and irradiated by pulsed laser ablation of ytterbium-doped fiber (Yb) (λ=1062nm) using the PRO Marking (Pulsed Fiber-Yb laser), as shown in (Figure 1). The CVD-DNPs were ablated for 30 (i) and 60 (ii) min. Next, the colloidal suspension was centrifuged in a Hettich Rotina 4500 RPM for 0 and 60 min, respectively, to remove aggregates, shown in (Table 1). Hydrofluoric acid(HF) was used to remove SiO2 contamination from the sample due to abrasion in the Agate mortar. To reduce the size of CVD-NDs, at 30 (i) and 60 (ii) min, the colloidal suspensions were centrifuged for 0 and 60 min, respectively, as shown in (Table 1). The CVDDNPs were obtained by the laser ablation method. Using a gaussian laser beam, pulsed average power 20 W, pulse time of 200 ns, and frequency of 45 (KHz), the irradiance is obtained by:
Where,
Figure 1: Draft pulsed laser ablation of ytterbium doped fiber (Yb) (λ=1064nm) PRO Marking (Pulsed Fiber-Yb laser).
Table 1: CVD-DNPs synthesis by pulsed laser ablation of ytterbium doped fiber (Yb) (λ=1064 nm).
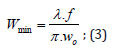
and where the minimum beam Ø is 0.04 mm, obtained by:
However, considering that this beam radiated particles of 10 micrometers of edge during the experiment, these microparticles when irradiated in the highest energy region of the beam (central region) were probably ablated.
Characterization Techniques
Dynamic Light Scattering (DLS) and Zeta Potential: Hydrodynamic diameter, size distribution, and ζ-potential values were obtained through the dynamic light scattering (DLS) technique. The equipment used for this analysis was the DelsaTM Nano C by Beckman Coulter, belonging to ICT-UNIFESP multi-user NAPCEM laboratory. For each sample, the dilutions were made in deionized water and the measurements were performed in triplicate to obtain mean and standard deviation values, both generated by the equipment software.
Raman Scattering Spectroscopy
The Raman scattering spectra were obtained using the Horiba Scientific equipment with a helium cadmium laser excitation (325 nm), from LAS/INPE. This vibrational spectroscopy technique is employed to determine molecular structures, quantification, materials identification, and the degree of crystalline network disorder information. Raman spectroscopy was also used to identify different forms of carbon.
X-Ray Diffractometry: The diffractograms were obtained using the PAN alytical brand system from the X’PertPro series, from LAS-INPE and operated at 45kV and 40 mA. This technique was used to identify and quantify crystalline phases, orient crystallites, determine single cell parameters, and residual stress [19]. FT-IR (Fourier Transformed Infrared Spectroscopy): The infrared spectra were acquired by Fourier transform infrared spectroscopy using a universal attenuated total reflectance sensor (FT-IR-UATR) (Perkim Elmer Spectrum, model Frontier). The FT-IR spectrum was an average of 32 scans at a speed of 2 s per scan in a range of 400–4000 cm-1. The resolution of the spectrometer was of 4 cm-1.
Field Emission Scanning Electron Microscopy (SEM-FEG): CVD-DNPs were physically and morphologically characterized using a scanning electron microscope. The micrographs were performed in collaboration with the LAS/INPE group and obtained with Field Emission Scanning Electron Microscopy by Tescan Mira 3, MIRA 3 model, which was coupled to the X-Ray dispersive energy spectroscopy (EDS) system.
Transmission Electron Microscopy (TEM): The micrographs were obtained using the Transmission Electron Microscope MET Tecnai G2 Spirit Bio TWIN 120 kV (FEI) with a digitally controlled system, CompuStage Single-Tilt tilt support, Olympus- SIS Veleta CCD 120/200 kV digital camera, tungsten emitter (W), TIA (TEM Imaging and Analysis) program for image visualization, in collaboration with the Institute of Advanced Studies of the Sea (IEAMar), UNESP.
In vitro Assays
Cell Culture and Cell Line: The B16F10-Nex2 cell line studied here as a tumor cell model was kindly provided by the Laboratory of experimental biology of cancer (LABEC-UMC, BR). Tumor line B16 was isolated from spontaneous melanoma in C57Bl/6 animals. Fidler [20] obtained gradually more aggressive and invasive strains after successive in vivo passages, numbering them from F1 to F10. The most aggressive strain was B16F10, obtained from the Ludwig Institute for Cancer Research. B16F10-Nex2 cells were maintained at 5% CO2 at 37°C and grown in medium RPMI-1640 (GIBCO) composed of vitamins, amino acids, salts, D-glucose, 24 mM sodium bicarbonate, 40 mg/mL gentamicin (GIBCO), and supplemented with 10% fetal bovine serum (SFB) (Cultilab), pH 7.4. For cell washing, the buffer was PBS (Phosphate Buffer Saline) with composition of 140 mM of NaCl, 2.7 mM, KCl, 10 mM of Na2HPO4, and 1.8 mM of KH2PO4, pH 7.4). Since B16F10-Nex2 cells are adherent, trypsin (GIBCO) was used to release cells from culture flasks and plates.
Analysis of Cell Viability: The cell viability assay was based on the indirect measurement of mitochondrial activity of cells after incubation with the materials under study. In viable cells, the salt 3-[(4,5-dimethylthiazol-2-yl)-2,5-diphenyltetrazolium bromide] (MTT) (Sigma-Aldrich) was reduced and forms formazan, which is a purple insoluble salt. The formazan was quantified by absorbance measurement after solubilization in organic solvent. In this study, B16 cells were cultivated in RPMI1640 culture medium and plated in 96-well plates at the concentration of 103 cells per well (300 μL). After 12 h, the supernatant was removed, and the cells were incubated with 50 μL of 5 different concentrations of CVD-DNPs suspension. After the incubation period of 24 and 48 h, the culture medium was removed and 100 μL of MTT solution (2 mg/mL, PBS solvent) was added in each well. The MTT was removed 3 h later, and the formazan salt was solubilized with 200 μL of DMSO. The solution was left to rest for 30 min,followed by measurement of absorbance at 540 nm in a plate reader (Biotek). Absorbance of the wells where the cells were incubated in the absence of NDs were considered as 100% of viability.
Statistical Analysis: The assays were performed in quintuplet, expressed as mean ± standard deviation and mean ± mean standard error of MTT assays. All the assays were statistically analyzed by Graphpad Prism® software, using the one-way analysis of variance (ANOVA), followed by the Bonferroni test to compare with the control group. A probability value equal or less than 0.05 was considered statistically significant.
Results and Discussion
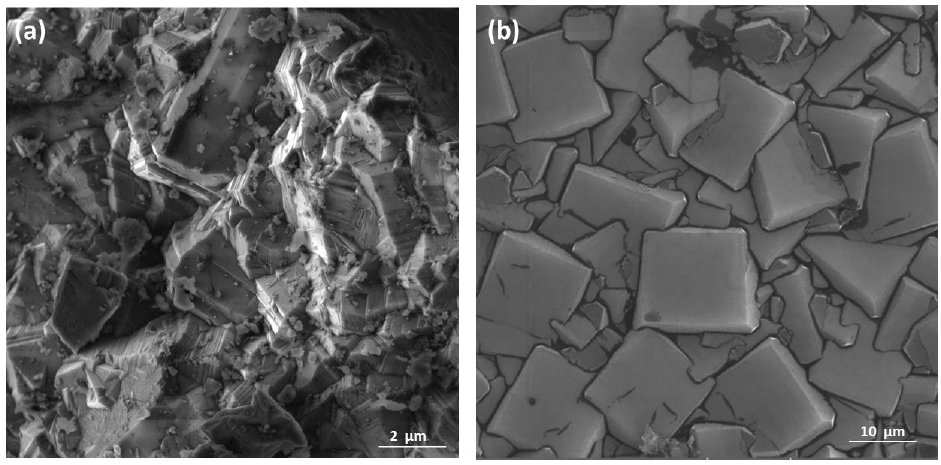
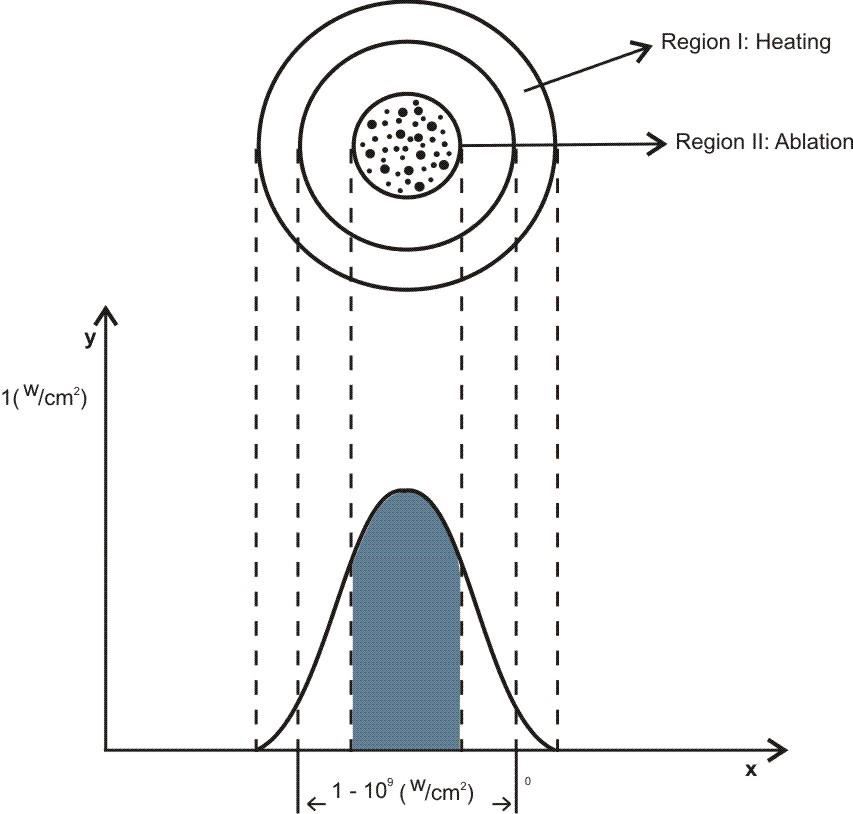
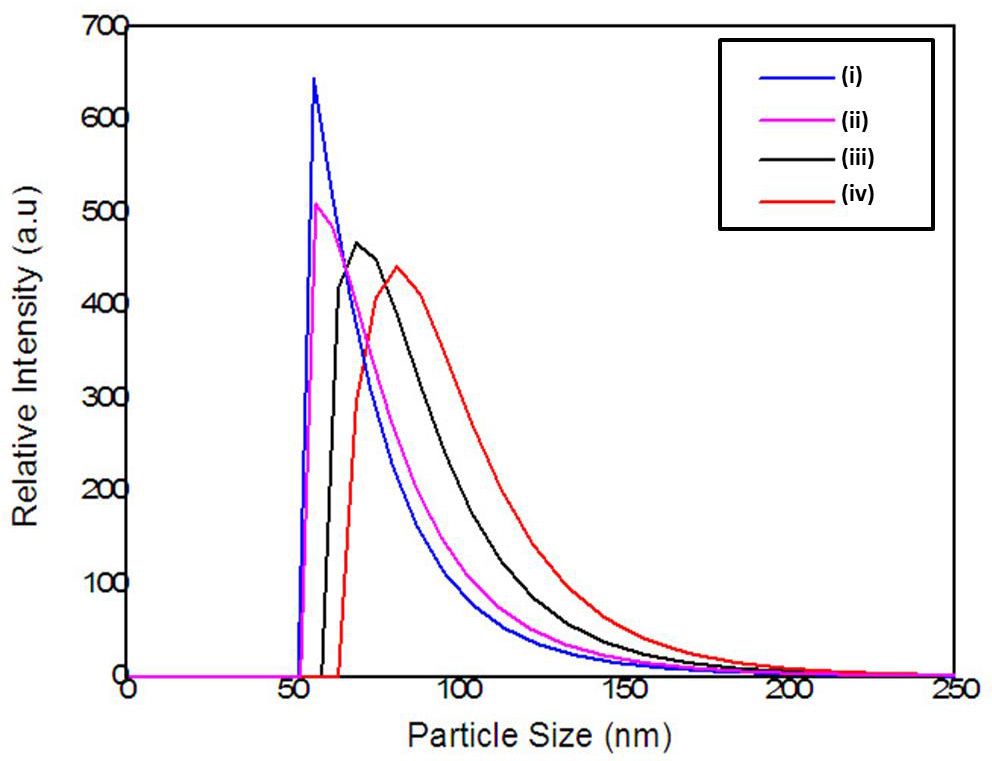
The relationship between the morphology of diamond crystals and the conditions of their crystallization has been the subject of great scientific debate in the last two centuries. Based on the analysis of external morphology and diamond surface, Evdokimov [21] concluded that more than one growth and dissolution process can occur in the same crystal, revealing precisely the same surface shapes, and may represent overlapping stages of growth and/or dissolution. In our diamonds, the symmetry of their structure was demonstrated by the morphology of the material viewed with SEMFEG analysis, which found faceted morphology of the CVD Diamond crystals (Figure 2). Particles irradiated by the beam in area 1 are heated and in area 2 are ablated with consequent size reduction, as illustrated in (Figure 3).Water suspensions of laser ablation CVDDNPs were used to determine the size distribution of the obtained particle through the centrifugation process at 4500 rpm, performed at 0 and 60 min (Table 2).The decreased particle size (Figure 4) was due to the laser ablation and centrifuging time, in which the disagglomeration and stability of CVD-DNPs occurred. This size is very close to that of a single diamond nanocrystallite [22], indicated by the left dislocating curves at 30–60 min ablation time and 0–60 min centrifugation time, where the medium hydrodynamic radius was 54 and 57 nm (Figures 4a-4b). The non-centrifuged CVDDNPs exhibited the medium size of 72 and 82 nm (Figures 4c-4d), respectively. Furthermore, a wider distribution curve was observed with laser ablation time, and centrifugation for 60 minute provided the precipitation of larger nanoparticles and average diameter of NDs in suspension. The high stability of aqueous suspension of CVD-DNPs was indicated by the low polydispersity index (PI) (0.2) and a small increase in the mean value of hydrodynamic diameter during the observation period. The high stability was provided by the high charge density on the surface of the NDs, as suggested by the high Zeta-potential (-36.39 and -30.94 mV), respectively (Table 3).
Figure 2: Sample surface in CVD Diamond before laser ablation
(a) Magnification of (100 kx);
(b) Magnification of (500 kx).
Figure 3: Schematic representation of irradiance (w/a) as a function of beam diameter.
Figure 4: Particle size distribution of the
(a) 60 min laser ablation and 60 min centrifugation;
(b) 30 min laser ablation and 60 min centrifugation;
(c) 60 min laser ablation;
(d) 30 min laser ablation without the centrifugation process.
Table 2: Particle size distribution data for samples centrifuged for 60 min and different laser ablation times.
Table 3: Stability of the aqueous suspension Zeta potential CVD-DNPs laser ablation.
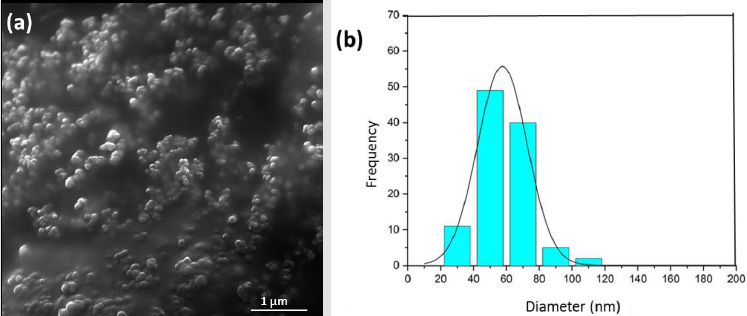
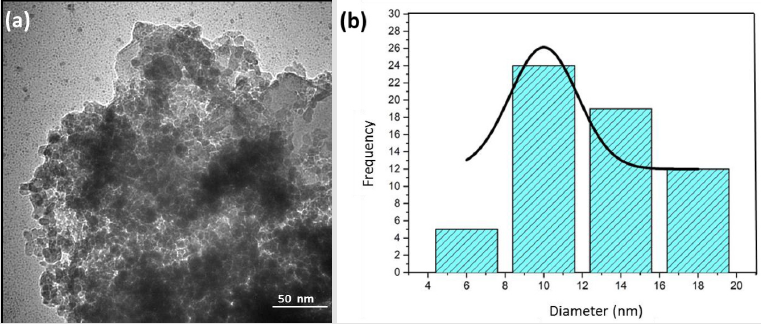
According to studies by Koniakhin [23], these z-potential values evidence the produced colloidal stability. Measures were taken in colloidal solutions before and after centrifugation. From the measurements carried out on these solutions, a comparison between the results of the mean hydrodynamic size measurements using SEM and TEM analysis was possible. Purity identification and contaminant ND content were employed to elucidate the characteristics used SEM/TEM [24], XRD [25], Raman Spectroscopy [26], and FTIR [27]. (Figure 5) shows images after laser ablation for 60 min and after centrifugation for 60 min, respectively. The morphological change in the diamonds was due to the process (Figure 5a). The obtained images illustrate the aggregates of CVD formation and the uniform particle size. In addition, the ablated and centrifuged CVD-DNPs are significantly smaller in size. The software image J was employed to analyze the SEM-FEG images, which allowed us to measure the size of CVD-DNPs through a statistical count to find the mean size value of the size distribution for each sample. For each case, using a sample of 100 particles, we obtained the particle size distribution curve, as shown in (Figure 5b). The average particle size of the CVD-NDs before and after centrifugation was 50.62 ± 14.28 nm.Note the morphological difference in (Figure 6) of the average particle size, morphology, and dispersion of CVD-DNPs after ablation as obtained by transmission electron microscopy (TEM), after centrifugation (Figure 6a). The synthesized CVD-DNPs are agglomerated with rounded shape due to the performed process. (Figure 6b) is the image analyzed with the image J software to estimate size distribution. Thus, analyzing four regions of each sample were, a statistical calculation was done by adding the areas of the CVD-DNPs found in each of the two images taken for each sample. The medium particle size for the samples after centrifugation and laser ablation was 20.50 ± 6.19 nm. In addition, the discrete difference in the ND size evidenced by the Dynamic Light Scattering (DLS) and the Scanning Electron Microscopy (SEM), does not indicate that the results found were.
Figure 5: SEM images of the particles
(a) Sample after 60 min of laser ablation, 60 min centrifugation and purification (increase of 500kx);
(b) Image distribution of particle sizes, with average size of 50.62 ± 14.28 nm.
Figure 6: TEM images of the particles
(a) Sample after 60 min of laser ablation, with 60 min centrifugation and purification (20 Kx);
(b) Image granulometric distribution, with average size of 20.50 ± 6.19 nm;
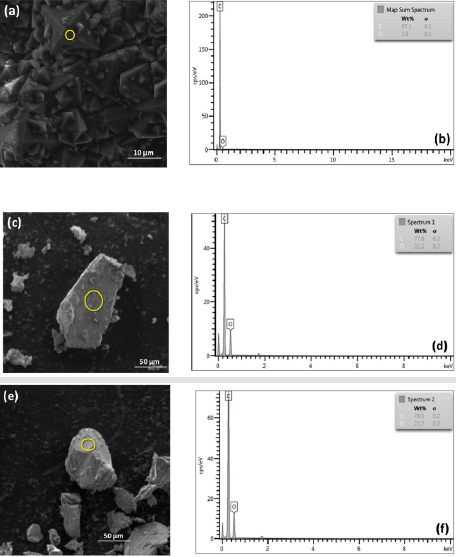
Incompatible, because the second method provides only a small portion of the nanoparticles isolated from the medium. With transmission electron microscopy (TEM), the diameters found were between 10 and 20 nm. According to the results, laser ablation time and the centrifugation process produces diamond nanoparticles with nanometric size [28]. The dispersive energy spectroscopy (EDX) was used to analyze the chemical composition of the CVDDNPs before and after the laser ablation and centrifugation processes. For this analysis, a drop of the colloidal solution was placed under a carbon tape. Due to equipment limitations, we chose a sample region of EDS with larger particles (Figure 7). EDX spectrum with 5 kV energy from laser ablation sample (Figure 8a) shows the mass concentration, where we obtained the same 97.1% carbon and 2.9% oxygen values. Figure 7b presents the mass concentration, where we obtained the same 77.8% carbon and 22.2% oxygen values; and (Figure 7c) exhibits the mass concentration, where we obtained the same 78.3% carbon and 21.7% oxygen values, indicating that carbon is present in these samples. Oxygen concentration is possibly due to high reactivity; in both CVD-DNPs groups, the concentration remained the same. According to Pearce [28], EDX spectra indicated the presence of only C and O; the purified NDs also confirmed the absence of impurities. This result supports those of Yang et al. [29] and confirms that diamond may be produced by ablation under water. Results indicate that, as expected, the final material does not present contamination in the CVD-DNPs from the ablation techniques.
Figure 7: EDS graph
(a) CVD diamond;
(b) CVD-NDs;
(c) 30 min laser ablation and 60 min centrifugation, after acid treatment to remove SiO2 from the sample.
(i) CVD-NDs;
(ii) 60 min laser ablation and 60 min centrifugation after acid treatment to remove SiO2 from the sample.
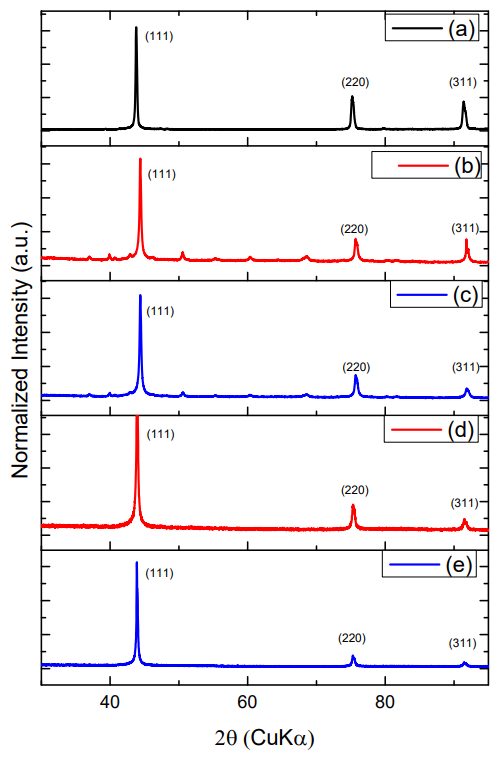
Figure 8: XRD graphics:
(a) CVD diamond before laser ablation,
(b) CVD-DNPs
(i) 30 min laser ablation and 60 min centrifugation,
(c) CVD-DNPs
(ii) 60 min laser ablation and 60 min centrifugation,
(d) CVD-DNPs (i) 30 min laser ablation and 60 min centrifugation, after acid treatment to remove SiO2 from the sample, and
(e) CVD-DNPs
60 min laser ablation and 60 min centrifugation after acid treatment to remove SiO2 from the sample;
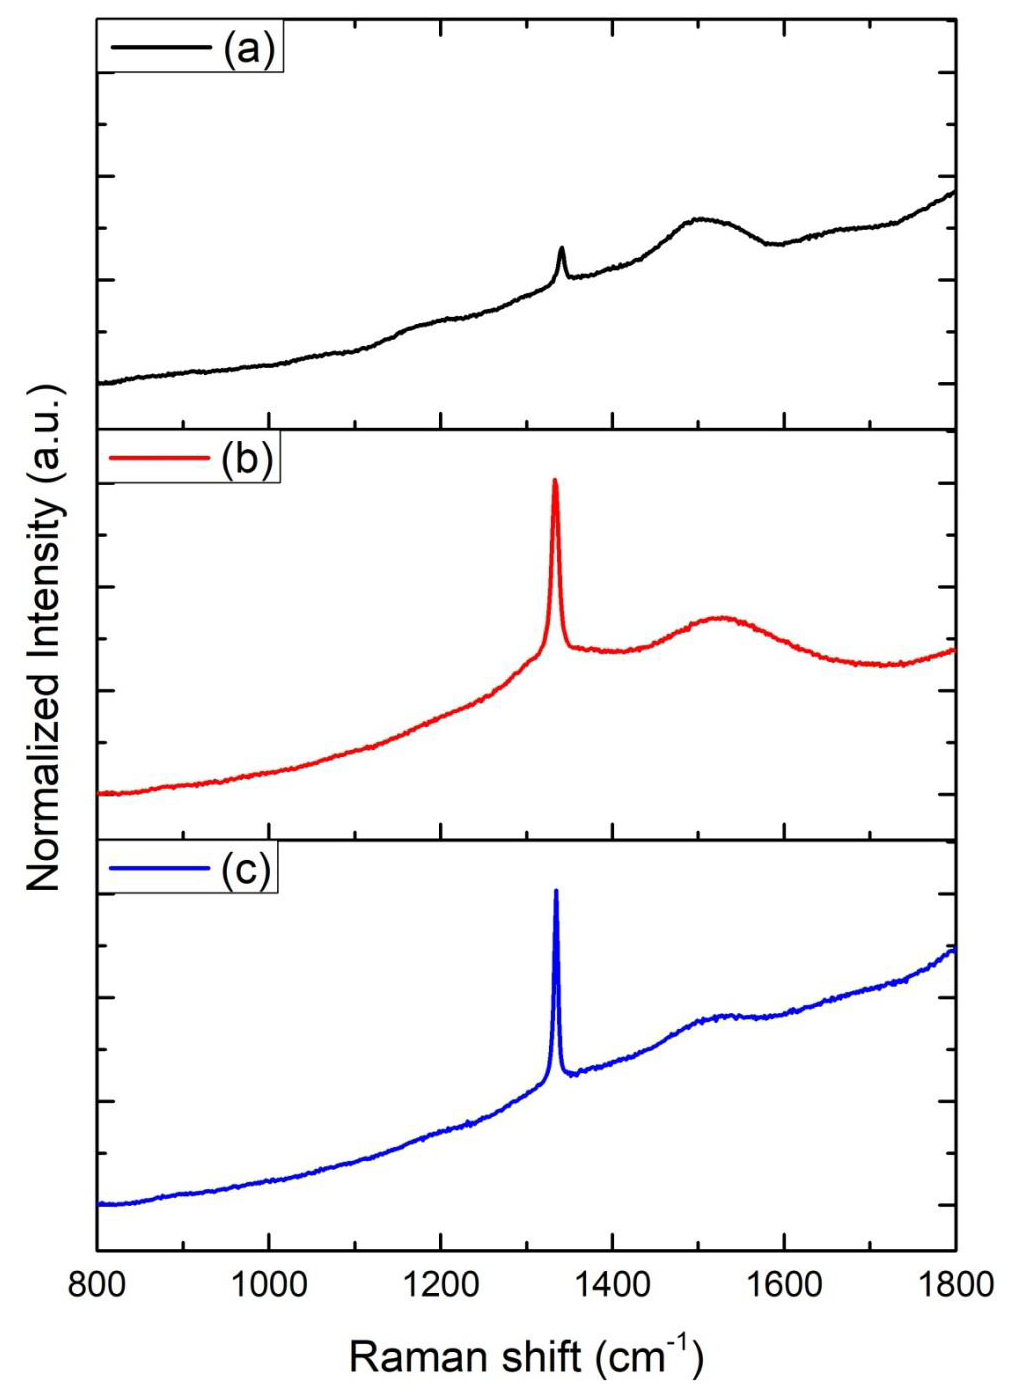
The Raman spectra of all ND colloids suspensions after the laser ablated CVD-DNPs processing, were measured using a laser Raman spectrometer employing 25% of laser power with wavelength of λ = 532 nm (Figure 9). The material was characterized by Raman spectroscopy, which provides the information of photoluminescence frequency of different carbon structures [30]. The size of the nanodiamonds was also studied using Raman spectroscopy, which also made it possible to determine molecular structures as well as quantify and identify materials and degree of crystalline network disorder. The spectral analysis of the CVD-diamond sample showed the characteristic peak of sp3 hybridization at 1332 cm [31] of a residual stressless diamond [32] (Figure 9a). The band of amorphous carbon, centered at 1550 cm-1, much wider than diamond, was also observed. The peaks, found for all CVD-diamond samples and CVD-DNPs analyzed, confirm the literature data that indicated the Raman shift at 1332.5 (cm-1) for carbon in the formation of crystalline diamond, and amorphous carbon at 1550 (cm-1) [33]. The evident luminescent background is due to its visibleluminescence spectrum, as well as to the symmetry of the carbon atoms in the form of graphite (sp2 hybridization) on the CVD-diamond crystal and to the continuous emission because of expected crystal defects in CVD-diamond. The laser ablation process reduced the size of the diamond crystals and their luminescence effect in the Raman spectrum, (Figures 9b-9c) respectively, characteristic of structural diamonds.
Figure 9: Raman spectra intensity (u.a) Vs of
(a) CVD diamond before laser ablation,
(b) CVD-NDs,
(c) 30 min laser ablation and 60 min centrifugation,
(i) CVD-NDs
(ii) 60 min laser ablation and 60 min centrifugation.
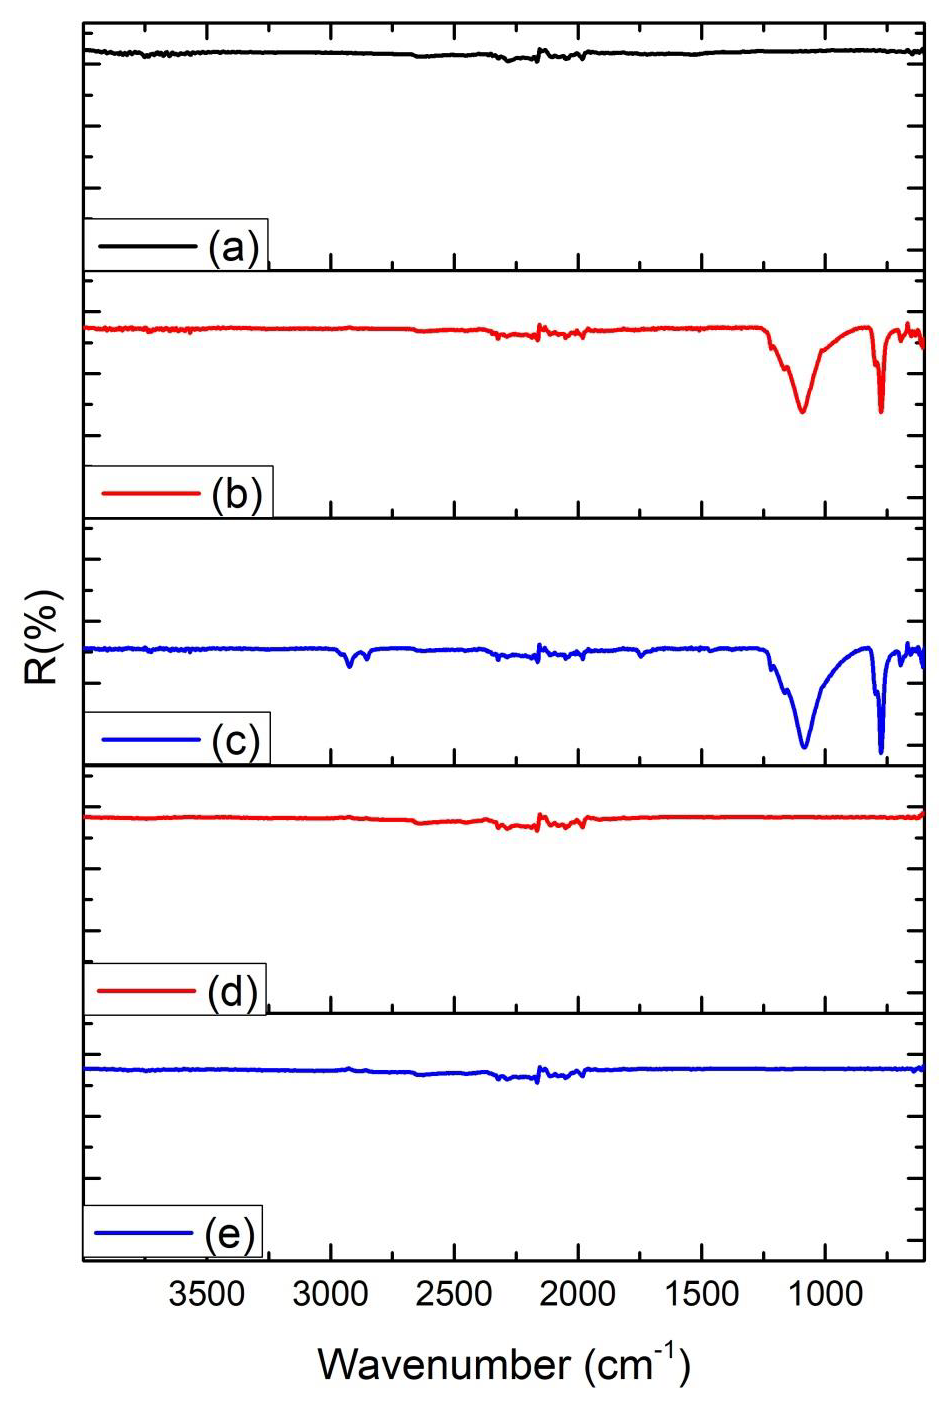
Another feature is the principle of incident and dispersed light, where the intensity of the Raman lines is dramatically increased when the scattered light intensity between the incident photons is equal to the permissible electronic interband transition energy [33-36]. Both spectra indicated that the diamond had a high degree of purity, due to the low G-band intensity, which is related to a low graphite inclusion in the diamond, proving the technological efficiency of the process. Therefore, the laser ablation process showed no difference, indicating that the resulting material was not modified. To identify the contamination present in CVD diamond films and CVD-DNPs, a detailed FTIR analysis was performed on each sample as well as those formed the with laser ablation synthesis. This analysis verified whether there were changes in the chemical structure resulting from ablation, since it provides the possibility of functionalization of ND surface to promote biological or materials application. The FT-IR spectra of the CVD-Diamond sample and the CVD-DNPs obtained herein are depicted in (Figure 10). The spectra are presented in a range between 4000 and 400 cm-1. Above 4000 cm-1, there was no absorption in any of the samples. On the other hand, with the ATR sampling technique used, the absorbances obtained below 400 cm-1 were no longer reliable. Spectrum analysis was performed based on the peak assignment available in the literature [37]. The absence of absorption bands in the FT-IR spectrum of CVD diamond confirmed that this sample did not have contamination (Figure 10a). The FT-IR spectrum of CVDDNP laser ablation (Figures 10b-10c) showed very intense bands at 1089 cm-1 and 777 cm-1, which were attributed to Si-O-Si stretching and bending, suggesting the contamination of the sample with silica due to the agate mortar and pestle, wherein the raw diamond was macerated at the beginning of the process of ND preparation. Despite the contamination with Si-O-Si silica, FT-IR spectrum indicated that NDs obtained herein starting from laser ablation could be eliminated by acid treatment with HF followed by washing with deionizedwater and centrifuged for 300 min. The success of cleaning step could be certified by the absence of Si-O-Si silica absorption band in the FT-IR spectra of cleaned CVD-DNPs obtained herein as depicted in (Figures 10d-10e). Based on the identification and quantification of crystalline phases, the determination of single cell parameters, the orientation of crystallite, and the determination of residual stress [38] and its possible contaminants, we used an X-Ray diffractometer to identify and quantify crystalline phases. The material was characterized by x-ray diffraction before and after laser ablation (Figure 8), using the Highscore software. The observed characteristic diffraction peaks of the diamond, for angles of 2ϴ = 43.9°, 75.3°, and 91.5°, were related to the diffraction of the planes (111), (220), and (311), respectively, as shown in (Figure 8a), with Plane (111) being the most intense. This analysis verified that the CVD-DNPs did not present any contamination after laser ablation and purification process of the CVD-DNPs.Using the Scherrer equation [38-40] and the values of the width at half height of the most intense diamond, considering λ=1.54056, it was possible to calculate the crystallite size (Eq.1):
Figure 10: FTIR spectra of the:
(a) CVD diamond before laser ablation,
(b) CVD-DNPs
(i) 30 min laser ablation and 60 min centrifugation,
(c) CVD-DNPs
60 min laser ablation and 60 min centrifugation,
(d) CVD-DNPs
(ii) 30 min laser ablation and 60 min centrifugation, after acid treatment to remove SiO2 from the sample, and (e) CVD-DNPs
(iii) 60 min laser ablation and 60 min centrifugation after acid treatment to remove SiO2 from the sample. The FT-IR spectrum was an average of 32 scans at a speed of 2 s per scan in a range of 400–4000 cm-1.
(iv) The resolution of the spectrometer was of 4 cm-1.
Where, D = average size of the crystallite,
𝑘 = dimensionless form factor,
β = line widening in radians,
θ = Bragg angle, and
λ = X-ray wavelength.
The mean size was determined from the total half-width maximum (FWHM) of the X-ray diffraction peak [41].
The FWHM value includes errors originating from noise and equipment conditions, such as the width of the X-ray diffraction slit. In general, it is difficult to calculate the deconvolutions when the observed signals have high level noise. According to table 4, to obtain the FWHM value of each peak, we used the Voigt line shape approximation by the sum of a Gaussian-type distribution and a Lorentzian width [42]. Sample ablated for 60 minutes had a wider peak, as shown in (Table 4) for all diffraction planes exhibiting a smaller particle size. Likewise, (Figures 8b-8c) shows the orientation of crystallite (111) in the characterization of CVD Diamond after the laser ablation process, and (Figures 8d-8e) indicates that the purification process was efficient for cleaning the CVD-DNPs. In accordance with theoretical studies reported by Telling [43], the Diamond cleavage energy was lower for Plane (111), meaning that there was a priority for the cleavage of the CVD diamond in these crystalline phases. The experimental results presented are coherent with the literature. All observed peaks are in accordance with JCPDS (Joint Committee on Powder Diffraction Standards) no. 00-006-0675 (ND). Considering that one of the main applications of DNPs under investigation in the biomedical field has been drug delivery for cancer therapy [44,45], we evaluated the cytotoxicity of the DNPs prepared herein. The MTT assay was employed for this and offers a quantitative, convenient method to evaluate whether a material affects cell viability.
Table 4: Full width at half maximum (FWHM) of the diffraction peaks after laser ablation of CVD-DNPs.
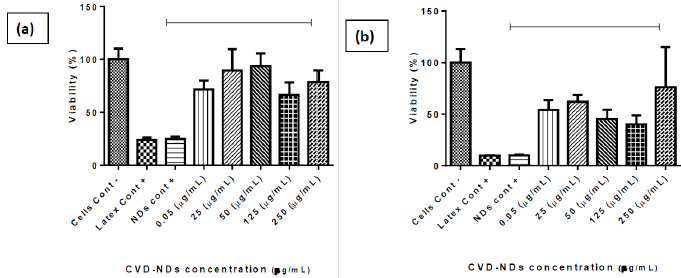
The extension of MTT reduction by mitochondria of viable cells is proportional to the absorbance of formazan [46]. The cytotoxicity of CVD-DNPs was evaluated against murine melanoma cells B16F10. The MTT assay was performed by incubating cells for 24 h and 48 h with CVD-NDs at 5 different concentrations: CVD-DNPs (0.05 μg/ mL), (25 μg/mL), (50 μg/mL), (125 μg/mL), and (250 μg/mL). As depicted in (Figure 11), CVD-DNPs were not cytotoxic to B16 cells after 24 h of incubation at any of the studied concentrations. In this assay, all the values of cell viability were equal or above 70%, considered the standard deviation, which is the limited value accepted to consider a material as non-cytotoxic. This observation is in agreement with the results reported by Schrand et al. [47]. In their work, NDs with 2–10 nm of diameter were not cytotoxic to neuroblastoma cells or macrophages at concentrations in the range of 5–100 μg/mL.Nevertheless, CVD-DNPs showed increased cytotoxicity after 48 h of incubation. At the range of 0.05-125 μg/ mL cell viability decreased in function of CVD-DNPs concentration. Interestingly, at the highest concentration of 250 μg/mL, the cell viability was high (76%), indicating non-cytotoxicity at this condition. Increased cytotoxicity after a longer incubation time was not observed by Gismondi, et al. [45], after incubation of B16 and HeLa cells with NDs; however, the authors used smaller DNPs (4-5 nm) and a higher concentration range (5–200 μg/mL). Our results were in line with previous observations of the group and the information found in the literature [48-50]. The cytotoxicity of CVD-DNPs at low concentration is a consequence of the interaction between small nanoparticles with cell membrane, inducing loss of membrane integrity and cell death. On the other hand, when CVDDNPs are at higher concentration, they are prone to form large aggregates, mainly due to the proteins of the culture medium, which adsorb on ND surfaces. These large structures are not able to insert into cell membrane; thus, the cell viability is not compromised. Therefore, as low cytotoxicity is one of the key features required for a drug delivery platform [47], the NDs prepared in this work have the potential to be used in the cancer therapy, such as melanoma. Notably, the concentration of DNPs suspension has to be carefully controlled. Another alternative is the application of these small DNPs to prepare larger structures wherein several kinds of drugs could be loaded, as already reported [45,47,51].
Figure 11: B16 F10 murine metastatic melanoma cells viability assessed by MTT assay in cells cultivated for 24 h and 48 h with CVD-NDs produced by laser ablation technique (a–b) at 5 different concentrations. The results are presented as average ± standard error for n = 5 (One Way ANOVA test and Tukey multiple comparisons). Incubation of CVD-NDs without cells followed by the incubation with MTT and measurement of absorbance was performed to evaluate possible interfering signals from CVD-NDs (CVD-NDs control).
Conclusion
The synthetic diamond-CVD, which has the same physical and chemical properties as natural diamonds, was useful to synthesize DNPs by Laser ablation (ytterbium doped fiber laser). It was possible to obtain DNPs with average hydrodynamic diameter of 54 nm and a particle size distribution between -2–10 nm. These CVDDNPs properties favor the adsorption or complexation with other compounds, and the cell internalization due to their small size. The cost of diamonds is become less, encouraging the use of this important class of materials for a variety of applications, especially biological ones. The cell viability assay evidenced low cytotoxic of CVD-DNPs. The incubation of murine metastatic melanoma B16-F10 cells with CVD-DNPs for 24 h and 48 h resulted in cell viability of 70–80% at 250 μg/mL. The low cytotoxicity against tumor cells indicated the potential use of CVD-DNPs as drug delivery platforms for antitumoral therapy. The conjugation of photosensitizers (PS) CVD-DNPs and cytolocation will be investigated in future stages of this research.
Cutaneous Melanomas: Current Concepts and Advances in Immunohistochemistry Applied for the Diag
Introduction
Cutaneous melanoma (cM) is a malignant and potentially lethal tumor developing from the transformation of melanocytes normally resident in the basal layer of the skin epidermis and forming with the keratinocytes the epidermal-melanin unit [1,2]. The annual incidence and morbidity of cM are constantly increasing worldwide (the number of newly diagnosed cases has more than doubled since 1973), probably due to population aging, the increase of risk factors as chronic sun damage and the improvement of diagnostic tools; besides, unlike other malignancies, cM affects a higher proportion of younger patients (median age: 57 years), with the sex preponderance that varies in different age groups [female preponderance in younger age groups (4:10 in 20-30-year-olds); male preponderance (16:10 in >85-year-olds)] [3,4]. cM is also the most lethal cutaneous tumor, with mortality rates ranging between 3.5/100,000 in Australia and 1.7/100,000 in Europe [3,4]. This review aims to present and summarize all the data related to the immunohistochemistry of cM, discussing its application for diagnosis, prognostic characterization and treatment of this deadly disease.
Diagnosis
Histological Exam
Despite an everyday increasing understanding of molecular biology and the etiology of cM, the diagnosis of cM is mainly performed by the pathologists with the histological exam rendered on hematoxylin and eosin (H&E) slides [5,6]. The differential diagnosis between cM and cutaneous nevus (cN) is based on the identification and the assessment of numerous morphological criteria. Nevertheless, none criteria are completely specific of cM and all of them could be potentially found also in cN, some criteria are found only in specific cN and cM subtypes, and others are qualitatively assessed and so suffer from low interobserver agreement [5,6]. Besides, new histological entities of cN and cM are identified every day based on different clinical-pathological and molecular backgrounds [5-8]. As result, the diagnosis of cM remains one of the most difficult of the surgical pathology and it should be rendered by only dedicated dermatopathologists that integrate the histological exam rendered on H&E slides, with available clinical, immunohistochemical and molecular data [5,6,9,10].
Immunohistochemistry
Despite the continuous development of molecular-genetic diagnostic techniques, immunohistochemistry remains the most frequently performed and cost-effective tool to implement the histological exam for the diagnosis of cM. In this review, we analyzed the immunohistochemical markers preferentially adopted by us and the other surgical pathology laboratories for the diagnosis of melanocytic lesions, along with their expression profile, the routinary use and clones, the potential diagnostic pitfalls and the ongoing research topics. For a more practical purpose, we divided them into four major classes (in italic, we reported the markers subsequently described):
• Markers useful for the differential diagnosis between CN and CM (HMB-45, Ki67, p16, p21, p53, PRAME, NKI/beteb, 5-hmC, PTEN, PHH3, H3KT and H3KS)
• Markers useful for the identification of specific histological subtypes of CN and CM (BRAF V600E, c-Kit/CD117, ROS1, ALK, pan-TRK, BAP-1, β-catenin, PRKAR1A, NF1, IDH1)
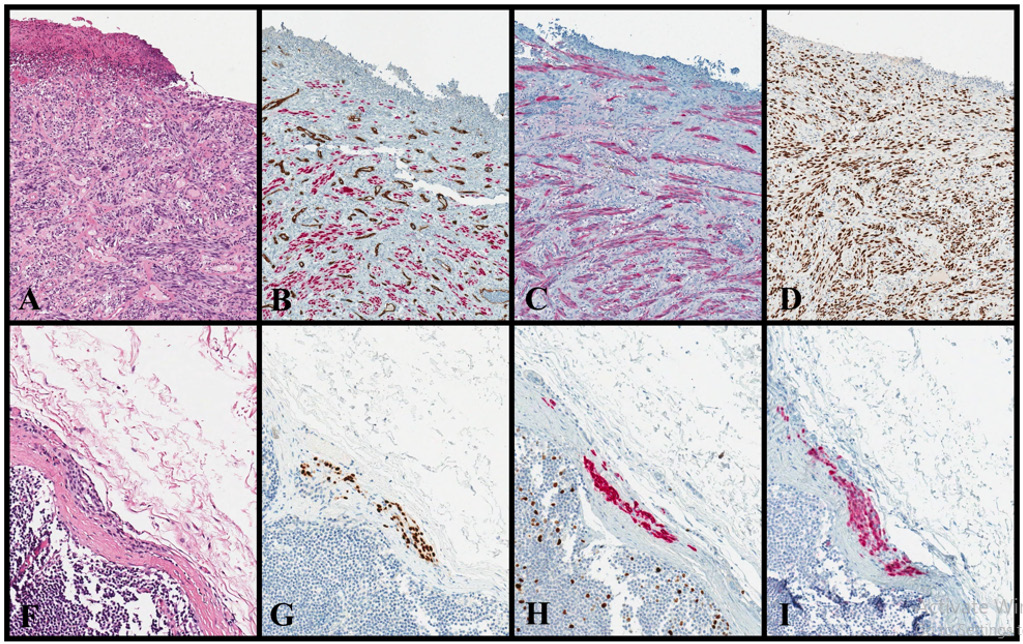
Some of these markers could belong to more than one class (HMB-45) and have been discussed only in one of them. A summary of the main application fields of the immunohistochemical markers most frequently adopted for the diagnosis of cM is presented in (Table 1). Illustrative examples of the immunohistochemical markers adopted in complex routine diagnostic cases are shown in Figure 1.
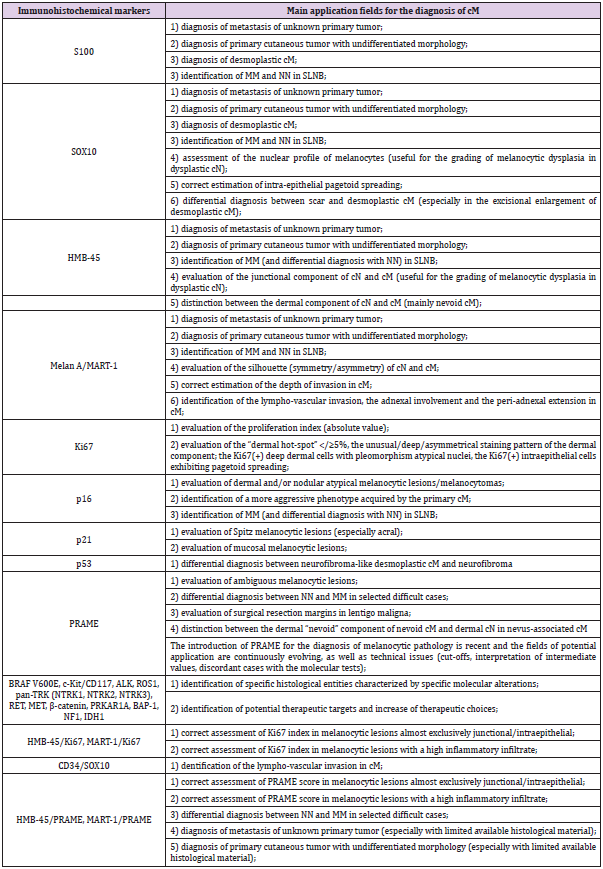
Table 1: Summary of the main application fields for the immunohistochemical markers most frequently adopted for the diagnosis of cM.
A case of ulcerated desmoplastic cM with marked desmoplasia, atypical spindle cells and rare mitoses (1A: H&E, original magnification x100). This case turns out positive for SOX10 (1B: CD34/SOX10, original magnification x100; CD34: brown, SOX10: red), S100 (1C: S100, original magnification x100) and p53 (1D: p53, original magnification x100). Note as DS CD34/ SOX100 shows the absence of lympho-vascular invasion (1B), without SOX10(+) cells inside the vessels (labeled with CD34). • NN (1E-1H):
A small intra-capsular NN that histologically resembles cN, with bland nuclei and absence of mitoses (1E: H&E, original magnification x200). This NN is positive for SOX10 (1F: SOX10, original magnification x200), MART-1 (1G: MART-1/Ki67, original magnification x200; MART-1: red, Ki67: brown) and p16 (1H: p16, original magnification x200). Note as DS MART- 1/Ki67 shows the absence of proliferating melanocytic cells (1G), without MART-1(+)/Ki67(+) cells; by contrast, it shows proliferating lymphocytes MART-1(-)/Ki67(+) within the lymphoid follicles.
Melanocytic Differentiation Markers
S100: The S100 protein family comprises about 25 members encoded by different genes located on chromosome 1q21 and involved in a wide variety of cellular processes (cell growth, cell cycle regulation, protein secretion, etc.) [11-14]. The most commonly used antibodies against S100 in routine practice are mouse and rabbit monoclonal antibodies [clones SHB1, 9A11B9 and SP127 (used in our laboratory)] direct against the S100B protein subtype [15,16]. S100 is probably the most historically known and commonly used melanocytic differentiation marker in surgical pathology laboratories, being expressed in almost all cN and cM (also desmoplastic cM) [17-20]. Its sensitivity ranges between 93% and 100% in the published series, with a characteristic staining pattern in both the nucleus and the cell cytoplasm; however, S100 is not highly specific being also expressed by several soft tissue tumors (nerve sheath tumors, adipocytic tumors, chondroid tumors, notochordal tumors and many others), hematopoietic disorders (Langerhans cell histiocytosis) and others tumors (glial tumors, sex cord-stromal tumors, myoepithelial carcinoma and other salivary gland tumors) [17-25]. For this reason, we always recommend using S100 in conjunction with other melanocytic (HMB-45, MART-1) and case-by-case selected immunohistochemical markers, in specific diagnostic settings (metastasis of unknown primary, primary cutaneous tumors with undifferentiated morphology). On the other hand, taking into account the high sensibility of S100, this marker has been largely used for the detection of melanoma metastases (MMs) in sentinel lymph node biopsy (SLNB) [26,27]. However, as S100 could label histiocytic and dendritic cells in lymph nodes, in the last years we always added HMB-45 and recently started to substitute it with SOX10.
SOX10: The sex determinant region Y box 10 (SOX10) is a member of a family of approximately 20 transcription factors encoded by a gene located on chromosome 22q13.1 and involved in the development of neural crest, peripheral nervous system and melanocytes [28,29]. At present, several antibodies anti-SOX10 are commercially available, among which clones 1E6 (used in our laboratory) and A-2 [30-35]. SOX10 is universally accepted as the most sensitive marker for cN and cM (98%-10 in metastatic CM, 78%-100% in desmoplastic CM) with the advantage of not staining dendritic cells and/or histiocytic cells in lymph nodes; as result, it is largely preferred to S100 in for the evaluation of SLNB with the updated EORTC protocol and the characterization of unknown primary metastatic and/or primary cutaneous undifferentiated tumor [27,30-33]. However, similarly to S100, SOX10 exhibits a low specificity being potentially expressed by a large number of tumors (carcinomas and soft tissue tumors) and it should be always used in conjunction with other immunohistochemical markers depending on the diagnostic scenarios [32,34-35].
The staining pattern of SOX10 is nuclear and provides a cleaner signal compared to cytoplasmatic (HMB-45, MART-1) and cytoplasmatic/nuclear (S100) melanocytic markers; for this reason, in our personal experience, it results more appropriate for the highly pigmented lesions, the evaluation of the nuclear profile (useful for the assignment of melanocytic dysplasia according to WHO 2018 criteria) and the correct estimation of intra-epithelial pagetoid spreading. An additional advantage of SOX10 is the potential application for the differential diagnosis between proliferating fibroblasts of scar [SOX10 (-)] and the residual component of desmoplastic cM [SOX10(+)] in excisional enlargements [36].
HMB-45: The name HMB-45 (human melanoma black) originated to indicate the immunogen associated with the monoclonal antibody and targeting PMEL17/gp100, which is a membrane-bound melanosomal protein encoded by a gene located on chromosome 22q13.1 and involved in the intracellular organization of melanosomes [37,38]. The most frequently adopted antibody (also in our laboratory) to detect HMB-45 in routine practice is the monoclonal mouse antibody, clone HMB- 45 [38]. HMB-45 has a lower sensibility as melanocytic marker if compared to S-100 and SOX-10 (73%-100% in primary cutaneous cM, 58%-95% for metastatic cM and only 9-15% in desmoplastic cM), so the latter should be preferred for the immunohistochemical characterization of unknown primary metastatic and/or primary cutaneous undifferentiated tumor [38-40]. Nevertheless, HMB-45 is negative in most of the tumors that could histologically mimic cM and be positive for S-100 and SOX-10, so we often add it to the immunohistochemical panels adopted in these diagnostic settings [32,41]. HMB-45 could turn out positive in PEComa and related tumors, melanotic schwannoma, clear cell sarcoma, sex cordstromal tumors, MiT family translocation renal cell carcinomas, pheochromocytoma and rare cases of salivary gland tumors (it reacts with the fibrillar matrix in stage II melanocytes and should be more appropriately considered an organelle-specific marker rather than a lineage-specific marker) [42-45].
In the melanocytic lesions, HMB-45 strongly reacts with the junctional and intraepidermal melanocytes and, in our experience, it is the best marker for the evaluation of the junctional component, with the intensity that correlates with the grade of the dysplasia in dysplastic cN [46,47]. By contrast, the dermal component of cN is completely negative for HMB-45 and/or tends to retain it only in the superficial portion and loses it with maturation, differently from the dermal component of cM (mainly nevoid cM) that retains the stain (diffusely or patchy/focal with isolated and/ or clustered cells in both superficial and deep parts of the lesion) [46,47]. However, dermatopathologists are aware that this axiom has several exceptions in routinary diagnostic practice: 1) blue cN, deep-penetrating cN and other benign dermal melanocytosis are usually HMB-45(+); 2) nevoid cM could be completely HMB- 45(-) in the dermal component exhibiting the so-called “pseudomaturation” [46-50]. An additional diagnostic field for HMB-45 is the differential diagnosis between nodal nevi (NN) [HMB45(-)] and MM [HMB45(+)] in the pathological evaluation of SLNB [51]. Nevertheless, according to the literature data and also in our experience, p16 and PRAME [NN: p16(+) and PRAME (-); MM: p16(-) and PRAME (+)] have much more sensibility and specificity than HMB-45 in this specific diagnostic set [51,52].
Melan A/MART-1: Melan A/MART-1 is a melanoma-associated antigen recognized by autologous cytotoxic T lymphocytes, encoded by the MLANA gene located on chromosome 9p24.1 and involved in the formation and trafficking of melanosomes [53]. At present, several antibodies anti-MART-1 are commercially available, but the most commonly used in routine practice and for research purposes are the mouse monoclonal antibodies clone M2-7C10 and A103 (used in our laboratory) [54]. Like HMB-45, also MART- 1 shows a lower sensibility compared to S-100 and SOX-10 (85%- 97% in primary cM, 57%-86% in metastatic cM and only 0-7% in desmoplastic cM) and it is negative in the majority of tumors that could be immune-histologically be confounded with cM; as result, in our daily practice routine, we often use MART-1 alone and/or in combination with HMB-45 (and obviously with S-100 and SOX-10) in the above-mentioned diagnostic settings [49,50,55,56]. MART- 1 strongly reacts with the junctional, intraepidermal and also dermal melanocytes in both cN and cM and, we always performed it in conjunction with HMB-45 to evaluate the silhouette of the melanocytic lesion (symmetry/asymmetry), estimate the depth of invasion in cM, and assess the lympho-vascular invasion, the adnexal involvement and the peri-adnexal extension [46,49,50,54].
However, dermatopathologists should be aware that:
1) cN with neurotization and/or stromal metaplasia, congenital cN and hyper-maturating cN could completely lose or show a gradual diminishing of expression of MART-1;
2) MART-1 could be expressed by adrenal cortical tumors, PEComa and related tumors, mesotheliomas, salivary gland tumors and sex cord-stromal tumors (interestingly, some authors showed as these tumors do not produce MART-1 RNA and so concluded that this “apparently paradoxical” positivity is related to an immunologically cross-reaction with unrelated antigens) [45,50,54,57,58].
Because of its high sensitivity for melanocytic lesions, MART- 1 is a useful marker for the pathological evaluation of SLNB, to identify but not to differentiate, NN and MM [both MART-1(+)] [59,60]. Besides, MART-1 has the advantage (over S-100 and HMB-45) to not be expressed in histiocytes and dendritic cells and, as result, it is frequently used in association with the other immunohistochemical markers for the evaluation of SLNB [59,60].
Markers Useful for the Differential Diagnosis between cN and cM
Ki67: Ki67 is a protein associated with cell proliferation and encoded by the MKI67 gene located on chromosome 10q26.2 [61]. It is expressed during all active phases of the cell cycle (late G1, S, G2, and mitosis, but not in G0 and early G1) and it is a reliable tool to evaluate the growth fraction of a cell population [61]. At present, the antibody adopted in the vast majority of laboratories (and also in our) do detect Ki67 is the mouse monoclonal antibody, clone MIB1 (it is often used as a synonym of Ki67, sometimes creating linguistic confusion) [62,63]. Several authors showed as Ki67 shows significant differences between cN and cM [49,50,62-65]. Specifically, conventional, Spitz, congenital, blue and dysplastic cN exhibit positivity in about 1-3% of cells, usually disposed at the dermal-epidermal junction with no/scattered positive cells in the deep part of the lesion (“dermal hot-spot” with Ki67<5%) [62-65]. By contrast, cM shows a higher percentage of positive cells (>15%) and a different staining pattern, with clustered positive cells in the deeper part of the lesion (“dermal hot-spot” with Ki67>5%) and/or a random pattern of staining [62-65].
Although in 2018 WHO Classification of Skin Tumors, Ki67 is strongly recommended for the differential diagnosis between dysplastic cN (<5%) and superficial spreading cM (>30%), in our personal experience it is quite impossible to find “early” superficial spreading cM (those that raise more diagnostic problems with dysplastic cN) with a so high Ki67. Besides, the pathologists should be aware of several diagnostic pitfalls in the application of Ki67 to the diagnosis of melanocytic neoplasms; namely, cN with a high Ki67 index (recurrent/persistent cN, traumatized cN, proliferative nodules in congenital cN, etc.), cM that could display a Ki67 similar to that of cN (especially nevoid cM), and cN for which it is difficult to evaluate Ki67 only in the melanocytic component (cN with a high inflammatory component as halo cN, Meyerson cN, regressed cN) [62-67]. To reduce these pitfalls, several authors elaborated “combined scoring systems” (integrating Ki67 with other markers to obtain a predictive score) and/or DS (Chapters 2.2.4) that allow evaluating Ki67 only in the melanocytic component [68,69]. In our laboratory, we adopt DS (MART-1/Ki67 and HMB-45/Ki67) and we found that more than the absolute value of Ki67, should be taken into account:
1) unusual, deep and/or asymmetrical staining pattern of the dermal component;
2) Ki67(+) deep dermal cells with pleomorphism atypical nuclei;
p16, p21 and p53: p16/INK4a (p16), p21/WAF-1 (p21) and p53 are all proteins involved in the regulation of the cell cycle and encoded by CDKN2A, CDKN1A and TP53 genes, located on chromosomes 9p21.3, 6p21.2, and 17p13.1, respectively [70,71]. p16 and p21 belong to the CIP/KIP family of kinase inhibitors and play a critical role in cell cycle progression and senescence, mainly cooperating with Rb (“p16/Rb pathway”) and p53 (“p53/ p21 pathway”); p53 is a master regulator of the cell cycle, apoptosis and genomic stability through several mechanisms (activation of DNA repair proteins, arrest of the cell cycle at the G1/S, initiation of the apoptosis and senescence response to short telomeres) [70,71]. Several antibody clones (E6H4, JC8 and G175-405) have been developed for the detection of p16 but the most commonly used in surgical pathology laboratories (and in our laboratory), is the mouse monoclonal E6H4 [49,50,72,73]. p16 attracted great interest in the field of melanocytic pathology since it has been shown that the biallelic/homozygotic inactivation of CDKN2A gene and the corresponding loss of immunohistochemical expression is a molecular step able to distinguish cM [p16 (-)] from cN [p16(+)] [72-75]. Numerous studies showed that almost cN stain (61%- 100%) for p16 with a typical “mosaic/puzzle” staining; by contrast, only 12-80% of cM are p16(+) [72-75].
Nevertheless, the major limits of these studies are the criteria used to define p16 positivity (nuclear, cytoplasmatic, or both; percentage of positivity; the pattern of staining) and the differences between the cohorts (different histotypes of cN and cM, different stages of cM, primary VS metastatic cM; etc.) [72-78]. It is well known that specific histotypes of cN and cM preferentially show loss of p16, due to the relevance of the biallelic inactivation of CDKN2A for their oncogenesis process [78]. Besides, CDKN2A biallelic inactivation is recognized to be a late molecular step in in the oncogenesis of cM, mainly involved in the advanced/metastatic stages (the percentage of metastatic cM p16(+) ranges between 0% and 41%); as result, p16 is not useful for the differential diagnosis of superficial lesions (superficial spreading cM and dysplastic cN), which represent the majority of routine diagnostic dilemmas [77,78]. In our experience and in line with most of the literature data, the diagnostic scenarios in which p16 is mainly useful are the followings: 1) the evaluation of dermal and/or nodular atypical melanocytic lesions/ melanocytomas (atypical Spitz tumor, atypical cellular blue tumor, atypical proliferative nodule arising in congenital cN), where p16 loss reflects the biallelic inactivation of CDKN2A (also proved by molecular techniques) and represents a strong criterion of malignancy; 2) the identification of a more aggressive phenotype acquired by the primary cM, as p16 loss is characteristic of the advanced/metastatic cM; 3) differential diagnosis between NN and MM in the evaluation of SLNB [26,27,51,52,72-79].
Although some studies showed that PRAME is superior to p16 to discriminate NN from MM, in our experience p16 remains a reliable diagnostic tool in this diagnostic setting [51,52,78,79]. Interestingly, we found very exceptional cases of cM that show a “paradoxical” diffuse and/or clonal overexpression of p16, representing a potential diagnostic pitfall and reflecting complex cell cycle deregulation that results in the intracellular accumulation of p16 protein [80]. p21 protein exhibits an opposite pattern compared to p16, with over-expression observed in cM and noor hypo-expression in cN [81,82]. However, this molecule and the underlying molecular mechanisms are less known compared to p16 and the immunohistochemistry for p21 is not frequently adopted in routine practice but mainly for research purposes [81,82]. At present, we use p21 (clone 4D10, mouse monoclonal) in our daily routine as an additional diagnostic tool only in selected scenarios for which the literature data are more substantial, such as Spitz lesions (especially in acral sites) and mucosal melanocytic lesions [81-85]. Although the alterations of the TP53 pathway are very frequent in cM, from a molecular point of view these could underlie numerous genetic, epigenetic and post-translational alterations, whose effects on the protein production (and therefore on our capability to immunohistochemically detect it) are very complex to predict [6,49,50,86,87].
Furthermore, the alterations of the TP53 pathway are a late event in the carcinogenesis of cM (therefore not so useful in the routine practice for the diagnosis of the most problematic cases) and rarely could also affect cN and melanocytic lesions with unpredictable biological potential [6,49,50,73,80,86-88]. At present, we use p53 (clone DO-7, mouse monoclonal) in our daily routine as an additional diagnostic tool only in the context of desmoplastic melanoma, especially for the differential diagnosis between neurofibroma-like desmoplastic cM and neurofibroma [89].
PRAME: PRAME (PReferentially expressed Antigen in MElanoma) is a tumor-associated antigen identified through T-cell clones obtained from a patient with metastatic CM and encoded by the PRAME gene located on chromosome 21q11.22 [90]. PRAME is expressed in several normal tissues and tumors, with a large variety of functions in oncogenesis, immune response, apoptosis and metastases [91-94]. It became of great interest in the field of melanocytic tumors as it proved to be expressed (and so immunohistochemically detectable) in cM but not in cN, so potentially being the marker able to solve one of the most problematic issues of the surgical pathology [95]. Over the last years, several antibodies against PRAME have been developed, but the most commonly used in routine practice and for the evaluation of melanocytic tumors is the rabbit monoclonal, clone EPR20330 [95]. Lezcano et al. developed a score based on tumor cells with nuclear stain (0: 0%, 1+: 1-25%, 2+: 26-50%, 3+: 51-75%, 4+: ≥ 76%) and showed that it has a high sensibility and specificity in distinguishing cM and cN (4+: 87% of metastatic cM, 83.2% of primary cM, 93.8% of in situ cM, 94.4% of acral cM, 92.5% of superficial spreading cM, 90% of nodular cM, 88.6% of lentigo maligna melanomas, 35% of desmoplastic cM and only 1 case of Spitz cN; 0-1%: 86.4% of all cN, 100% of NN, 100% of solar lentigo) [95]. The same authors found a 90% of concordance between PRAME score and cytogenetic tests results, supporting this marker as an important ancillary test (cheaper and faster but not completely interchangeable with cytogenetic tests) for the diagnosis of complex melanocytic lesions [96].
Subsequently, other authors tested this antibody in the most problematic areas of the melanocytic pathology (atypical Spitz tumors, pauci-cellular lentigo maligna, nevus-associated cM, resections margins of lentigo maligna, NN and MM, etc.) and found very promising results; however, they adopted different cut-offs and raised the problem to correctly identify the exact percentage of positive cells able to differentiate cN from cM and whether different percentages need to be adopted for different melanocytic lesions [97-102]. Besides, these results need to be validated in large case series with long-term follow-up able to prove the real nature of ambiguous melanocytic tumors and many other aspects have to be clarified before the adoption of this marker as the “answer to all our problems” (how to interpret “intermediate” results? How to interpret PRAME results in cases of a discordant molecular test?). Besides, PRAME is expressed in many other tumors (germ cell tumors of the testis, lymphomas, peripheral nerve sheath tumors, ovarian carcinomas, etc.) but not in the majority of desmoplastic cM (one of the most challenging melanocytic lesions), and we already suggested great caution before the adoption of PRAME as “panmelanoma” marker [91-95,103]. We recommend using PRAME in conjunction and/or with DS adopting a melanocytic marker (HMB- 45 or MART-1), only in appropriately selected diagnostic settings, and integrating this result with the histologic exam, the other immunohistochemical analyses and the molecular techniques in “really-difficult-to-diagnose” melanocytic lesions. In our practice, we adopt this marker as an adjunctive diagnostic tool especially for
1) Ambiguous melanocytic lesions (atypical Spitz tumors VS Spitz cM, high-grade dysplastic cN VS early cM in situ, etc.);
2) Differential diagnosis between NN and MM in selected difficult cases;
3) More accurate evaluation of surgical resection margins in lentigo maligna;
4) Distinction between the dermal “nevoid” component of nevoid cM and dermal cN in nevus-associated cM.
Markers Useful for The Identification of Specific Histological Subtypes of cN and cM (BRAF V600E, c-Kit/CD117, ROS1, ALK, pan-TRK, BAP-1, β-catenin, PRKAR1A, NF1, IDH1): Over the last years, the growing research in the field of molecular biology made it possible to identify as specific clinical-pathological entities are characterized by specific molecular alterations and 2018 WHO classification of melanocytic lesions is mainly based on their molecular background and its correlation with the entity of UVdamage. As result, the search of these genetic alterations has become fundamental to identify and characterize these new histological entities, thus allowing a more detailed diagnosis and prognostictherapeutic stratification (many of these molecular alterations identify potentially targetable therapeutic targets). Since these genetic alterations lead to an over- and/or aberrant expression of specific molecules and these latter are associated with welldefined histological features of the melanocytic lesion, an expert dermatopathologist could suspect a specific genetic alteration just from the H&E exam and prove it with the immunohistochemistry [104-117]. In our routine practice, we do not use standard panels but the choice of the immunohistochemical panels is performed case-by-case based on the H&E exam. Specifically, the antibodies we use in our laboratory and the specific histological entities related to their over and/or aberrant expression are the following:
• IDH1: recently introduced category of melanocytoma
Double Stains (DS)
(HMB-45/Ki67, MART-1/Ki67, CD34/SOX10, HMB-45/ PRAME, MART-1/PRAME): Over the last years, the development and application of DS have greatly increased in surgical pathology, due to the more detailed assessment of specific histopathological features (compared to the respective single stains) and the saving of time, money and histological material [118]. Specifically, in the field of melanocytic pathology, the most commonly used DS are those combining Ki67 with cytoplasmic melanocytic markers (HMB-45 and MART-1), thus allowing to more correctly assess the proliferation index only in the melanocytes (ignoring lymphocytes, keratinocytes and endothelial cells) [119]. In our experience, these DS (HMB-45/Ki67 and MART-1/Ki67) are particularly useful in lesions almost exclusively junctional/intraepithelial and in lesions with a high inflammatory infiltrate (halo cN, highly regressed cM, etc.). Other promising DS are those that allow to correctly evaluate the presence of lympho-vascular invasion (D2-40/MITF, D2-40/ SOX10, D2-40/S-100, D2-40/MART-1), even if the obtained results and the superiority compared to single stains and H&E are partially discordant [120-122]. We are currently leading a study aimed to evaluate the accuracy of the DS CD34/SOX10 (“pan-vascular marker” and “pan-melanocytic” marker) to identify the lymphovascular invasion and predict survival compared to H&E [123]. As just clarified (Chapter 2.2.2.3), our working group has recently developed two DS combining PRAME (nuclear) with HMB-45 and MART-1 (cytoplasmatic) that showed very encouraging results and become part of the immunohistochemical panels used routinely in our laboratory [123]. In our experience, these DS (HMB-45/PRAME and MART-1/PRAME) are particularly useful in the following diagnostic scenarios:
a. Lesions almost exclusively junctional/intraepithelial (allowing not to evaluate keratinocytes)
b. Lesions with a high inflammatory infiltrate (allowing not to evaluate lymphocytes)
c. Differential diagnosis between NN and MM, especially in SLNB
d. Metastasis of unknown primary tumor and/or primary
cutaneous tumor with undifferentiated morphology, especially with limited available histological material.
Conclusion
Here we summarize the current concepts and advances on the application of immunohistochemistry in the diagnosis of cN and cM. Despite continuous progress in the genetic classification of melanocytic lesions, there is still a need for improvements in the correct immunohistochemical characterization and diagnosis of this deadly disease. Hopefully, this diagnostic progress could result in the improvement of the therapeutic choices and the reduction of mortality and morbidity by cM.
The novel device presented is related to oral and maxillofacial instruments [1], particularly curved distractors for oral and maxillofacial reconstruction, which offer improved anatomical conformity for reconstruction, easy access for regular adjustments, and light weight for convenience of use and ease of manufacture (Figures 1 & 2). Commonly used surgical procedures for anterior alveolar defects, such as cleft alveolar defect repairs, require bone augmentation for esthetic and functional requirements to furnish a foundation for the completion of dental reconstructions, such as dental implants. However, some patients do not possess the requisite physiological foundation of soft and hard tissues for reconstruction the shape of the dental arch to facilitate dental implants placement. Typically, the oral anatomy of one patient differs from another to varying degrees. Distraction Osteogenesis (DO) is a procedure that remedies such deficiencies by inducing additional or new bone and soft tissue growth at the deficient target area [2-5].
A typical DO procedure augments bone and soft tissues by transecting a bone segment adjacent to the target area using a distractor device that maintains a preselected separation between the transected sections and transfers gradually the aimed sectioned bone segment towards the opposing side of the bone defect with the activation of the distractor by preferably 1 mm each day [6]. The distractor is incrementally activated over time until the desired separation and induced growth is attained in the distracted area.
Materials and Methods
Description of the Distractor
The presented curved distractor permits necessary adjustments to accommodate the specific anatomy of a patient’ dental arch. (Figure 1) illustrates components of the presented distractor and example of its use for augmenting a defect in an anterior upper alveolar defect. (Figure 2) shows a prototype of the curved alveolar distractor fixed on a model of a phantom upper dental arch illustrating the application of the distractor on an anterior defect site. The curved alveolar bone distractor includes an elongated curved and threaded traction rod supported on opposite ends by anchor brackets. The anchor brackets fix the traction rod onto the bony foundation of a patient’s jaw. The endcaps cap the opposite ends of the traction rod to prevent dislodging and define the extent of the working length of the traction rod. A traction bracket freely slides along the traction rod, while the traction bracket is fixed to a movable bony segment. A translator nut is threaded onto the traction rod to abut against the side of the traction bracket. The curved shape of the traction rod ensures that the distraction occurs along a curvilinear path such that the new bone and tissue growth conforms more to the natural contours of the patient’s jaw.
The selective rotation of the translator nut pushes the traction bracket to move the movable bony segment at a predetermined distraction distance. When assembled and installed, the working components of the curved distractor are exposed in the oral cavity to the facial side for easy access. Tools were provided to operate the translator nut. The proposed anterior alveolar bone defect is aimed to gain a new bone matching the curvature of the dental arch. A targeted and sectioned bone segment in one side of the defect was distracted through the curvature of the curved activating rod towards the opposing side conforming the curvature of the dental arch (Figures 1 & 2).
Figure 1:
A. Is a perspective view of the curved distractor device in the patient mouth. The anchor plates is fastened with mini- screws to the alveolar bone at both sides of the defect in the maxilla.
B. The moving bone segment is fastened to the mesh plate with mini-screws.
C. Its bracket is attached to the curved activation distraction bar.
D. The translator nut.
E. Is placed left to the sectioned bone segment.
F. Pushing the bone segment in increments during its rotation allowing gradual movement of the bone segment towards the other side of the maxilla following the curved path of the distraction bar.
G. Note a pair of first and second endcaps threaded onto the ends of the traction rod to prevent dislodging of the distractor components.
Surgical Procedure
The following is an example of a surgical procedure. Under local anesthesia, the labial mucoperiosteum of the alveolar bone on both sides of the defect was surgically exposed together with the labial mucoperiosteum of the bony segment that was preselected as the freely moving part. The freely moving bony segment was separated from the adjacent fixed bony part by a surgical saw starting labial until it reached palatal. The traction bracket was adapted to the labial surface of the freely moving bony segment, for example, by trimming and/or shaping the mesh plate or shaping the mounting ring as necessary. The traction bar passed through the mounting ring with the mesh plate in place. The translator nut was threaded onto the traction rod from the side of the surgically created bony cut line mesial to the mounting ring and distal to the anchor bracket. The translator nut was assembled between the anchor brackets and adjacent to the mounting ring. The ends of the traction rod were inserted through the mounting rings in a passive manner the anchor plates were then shaped by bending to conform or adapt to the surfaces of the non-moving bone at both sides of the defect before fixing the anchor plates and mesh plate.
Figure 2: Shows photographs of prototype of the curved alveolar distractor fixed on a phantom model of upper dental arch illustrating the application of the distractor on a defect site at the premaxilla.
A. The proposed alveolar bone defect gained new bone matching the curvature of the dental arch by distracting an aimed sectioned bone segment in one side of the defect
B. distract it through the curvilinear of the curved activating rod towards the opposing side.
The traction rod was supported by the mounting rings during adaptation of the anchor plates and mesh plate. The anchor plates were then fixed with fasteners, such as self-drilling screws, on the labial surface of the non-moving parts of the jaw. Subsequently, several fasteners were used to fix the mesh plate to the labial surface of the moving bony segment. After fixing the anchor plates and mesh plate, the freely moving bony segment was completely separated from the adjacent fixed bony surfaces at the surgical bony cut line using a small chisel. After verifying the stability of all components of the curved distractor, the endcaps were tightened to the ends of the traction rod. The translator nut was rotated using a wrench or pinlever provided with the surgical kit for approximately two counterclockwise revolutions, equating to a distance of approximately 1 mm. This process verifies the action of the curved distractor and the smooth traction of the freely moving bony segment. The soft tissue layers were sutured back, and the distraction process was then commenced at a typically recommended rate of 1 mm per day until the targeted distraction distance was reached. When the distraction process and healing duration is complete, the curved distractor may be easily disassembled and removed with minor surgery.
Discussion
Distracting the hard and soft tissues to augment alveolar defect in in the anterior dental cannot be by any means result in an ideal aesthetic contour and functional bone foundation to reconstruct dental missing teeth by using the straight distractor devices. Currently used distractors to augment anterior alveolar maxillary and mandibular defects are typically constrained to distract the bone in a straight line or are dependent on tooth bearing [2, 3] tend to be heavy owing to their relatively large components, not stable as they depend on their weak anchors attached to the adjacent teeth and may be designed with components submerged under the submucosal layers. These factors may lead to a final reconstruction that does not comply with the correct curvature of the jaw arch, patient discomfort, losing of their components in the dental anchored dependent distractors or unforeseen complications as their components covered by the soft tissue layers. Difficulties in solving problems with the distractor bar activation and difficulties in performing adjustments may also arise from the submerged portions of the typical distractor owing to limited accessibility. Moreover, the area for reconstruction may not follow a curvilinear line.
To this end, a curved alveolar bone distractor that solves the aforementioned problems is presented in this paper. The exposed Curved distractor components permits necessary adjustments to accommodate the specific anatomy of a patient. The bone anchored distractor ensures that distraction process and the distracted bone segment moves with stability. Thus, the curved distractor serves as a relatively simple, convenient, and easy-to-use device for distraction. The curved shape of the traction rod ensures that the induced growth of new bone and tissue follows a curvilinear path that closely matches the contours of the patient’s jaw. The working components of the curved distractor, such as the traction rod and translator nut, are exposed to the facial side of the patient’s mouth so that they can easily be accessed by the oral surgeon for periodic adjustments of the distraction distance. Moreover, the components of the curved distractor are constructed from relatively lightweight materials, which substantially reduces potential discomfort and complications for the patient.
The Sundarbans mangrove forest (SMF) is the single largest coastal belt, with an area of 10,000 km2 and a network of 450 rivers across the province of Bangladesh (60%) and India (40%) [1]. It covers 44% of the forest land and 4.2% of the total area of Bangladesh [2]. It places in the ancient delta of the Ganges River and spreads across Satkhira, Khulna, and Bagerhat districts. The Sundarbans, one of the world‘s richest biodiversity hotspots, constitute 35% of the wildlife of Bangladesh [2] where 500 species of plants, 448 vertebrates including the mighty Bengal Tiger and Ganges Dolphin, about 300 hundred fish and shrimp species and about as many as 240 insect species are found in the biome [3]. The UNESCO declared as a “Ramsar Site” in 1992 and solicited three wildlife sanctuaries of the forest as “World Heritage Site” in 1997. The Sundarbans execute ecological functions and provide support for livelihood [4]. About 3.5 million people live around the Sundarbans and they depend directly or indirectly on this forest [5]. Mainly, the rural people living within 20 km outside the forest frontier, stated to as the influence zone, are primarily reliant on the mangrove forest for their livelihoods and subsistence [6]. Most of the dependent people are illiterate and poor in the Sundarbans as well as Bangladesh [7,8]. Islam, et al. [9] found the average literacy rate and income of the Sundarbans dependent people were class five and 4,620 BDT respectively where Saha, et al. [10] found the average income was Tk. 8495 and 4433 for the boatman and ecotour guide respectively.
Shah and Dutta [4] found that about 50% of the households depending on forest- earn 75%-100% of their total income from the forest resources. The Sundarbans provided a wide variety of ecosystem, economic and cultural services [11]. It provided foods, fishery products, and income for coastal inhabitants [12] and also acted on a natural blockade, defending lives and property from flooding, storms, cyclones and soil erosion [13,14]. The people entered the Sundarbans for fish, honey, golpata, fuel wood, hogla, prawn, hantal, crab, nall, grass, keora fruit, malia, goran stick, molasses and medicinal plants [15,16]. Using official records of revenue collected by the Forest Department during 2001-2010, the value of major provisioning services and cultural services of the Sundarbans amounting US$ 1.39/ha/year. About 90% of saleable fishes and 35% of all fishes in the Bay of Bengal depend on the Sundarbans [17]. It contributed 1.7% of Bangladesh’s total domestic fisheries production [18]. On average, about 10.37 metric ton (MT) of fish was harvested every day from the Sundarbans and the revenue from fish products was US$ 158,368 in 2014-2015 [19]. However, about 2.6 million shrimp and 1,123 MT mud crab were collected per year from the Sundarbans, making revenue of US$ 52,026 [18]. In 2014-2015, about 2,773 MT of dry fish produced in the region and US$ 1,79,761 collected as revenue. Each household adjacent to Sundarbans caught about 1.4 metric tons of fish and about 1.1 tons of crab every year where the household’s consumption amount to about 68 kg and 10 kg per year, respectively [20].
It means that 1-4% of the total harvest was consumed while the rest was sold on local markets or traders. The Government of Bangladesh has banned all types of timber harvesting from Sundarbans in 1995. Yet, about 26,930 ft3 wood fuels was collected in the fiscal year 2014-2015, mainly from timbers seized from encroachers as well as trees collapsed during natural calamities [20]. Each household collected about 1,100 kg of fuel wood per year and bought approximately 200 to 300 kg at local markets [20]. Around 16,868 MT of golpatta (Nypa fruticans) collected in 2014- 2015 [18] where a family harvested around 27.8 tons per year, of which the collectors consumed about 4% of the total harvest [20]. An estimated 67 MT of honey and 63 MT of wax harvested from the Sundarbans in 2014-2015 [21]. A honey collector harvested about 0.7 tons per year, of which they consumed about 1% [20]. The Sundarbans contribute about US$ 53.14 million per year to Bangladesh’s national economy and offer outstanding prospects for developing ecotourism [22]. The economic paybacks of the cultural services of the Sundarbans mainly come from tourism. The scenic beauty, river cruise, wildlife watching, and hiking activities in the Sundarbans attract many tourists each year. In 2014-2015, a total of 96,949 native and 3,868 foreign tourists visited the Sundarbans, making around US$ 1,44,832 as revenue [21]. Tourism has some adverse influences on the Sundarbans like habitat annihilation, eutrophication, diversity loss and coastal contamination for tourism activities [23,24].
Ecotourism can be a conceivable resolution for solving this problem as it has an appropriate approach for dropping the environmental impacts of tourism [24]. It found that most of the individuals approved that they will halt removing natural resources from Sundarbans, if they find an alternative income source [23]. Moreover, Haque and Aich [25] reported that the Sundarbans generate Ecological Services worth about US$ 450-1000/ha/year. The Sundarbans is commonly known as the lungs of Bangladesh also crucial in terms of carbon sequestration. In 2010, the total predictable carbon in the Sundarbans was about 56 million MT and traded the Sundarbans carbon at US$ 5–15 per ton that would be about US$ 280-840 million per year [1]. In conclusion, a huge livelihood hub like the Sundarbans is playing a crucial role in the economic development of the whole of Bangladesh along with the coastal areas of our country. The mangrove ecosystems have been exploited over the year with little or no knowledge of residents and stakeholders. The benefits provided by the Sundarbans include but not limited to food, wood, fishes, climate regulation, recreation, waste management and erosion prevention. We need to adopt various long-term plans now to meet the needs of the growing population as well as to ensure sustainable development of the Sundarbans for future generations.
Use Scientific Method to Detection and Comparison of Menstrual Blood Samples Found at the Crime Scene
Introduction
Menstrual (liquid or stain) blood is a type of biological evidence in forensic biology & serology. Menstrual blood is discharged from the uterus in a fluid state, and it contains no fibrinogen and cannot be made to clot [1,2]. This condition is a result of a fibrinogen process during which the blood clots and subsequently reliquaries before the menstrual period. Menstrual blood or impure blood is not highly oxygenated, it’s darker than normal blood or pure blood. It is a waste product that contains dead and no longer functional tissue [3-5]. Iron, hemoglobin and protein concentration are less in menstruation than normal or pure blood. We see blood mostly following these cases such as (Rape, murder, sexual assault) and this type of case is a serious offence and identification of all body fluids organizing from sexual activities and offences has been an important aspect of forensic investigations for a long time. While reliable tests for the detection of semen, and saliva have been successfully implemented into forensic laboratories, and the detection of other body fluids, such as vaginal or menstrual fluid, is more challenging. Approving, the discrimination between peripheral and menstrual blood can be highly relevant for police investigations because it provides potential evidence regarding the issue of consent. All biological stain at the crime scene is one of the most important components in forensic science. This aids police investigation in capturing criminals as it possibly provides the investigators with all information about the crime [6]. Blood is one of the most commonly found body fluids at crime scenes, and accurate differentiation between peripheral blood and menstrual fluid could provide significant evidence, e.g, regarding the issue of consent in rape sexual assault cases. In many cases when blood is found, then the forensic expert used the TMB test for analysis of blood. TMB (tetramethylbenzidine) test is the presumptive test for blood, or it is used the founded blood is human or not. When the blood color is shown positive response that means human blood then the expert does a confirmatory blood test. Basically, in this paper further, we describe the main major difference between Normal blood/pure blood and Menstrual blood/impure blood with the help of the Teichmann test. The Teichmann test is the confirmatory blood test, and we easily identify the basic points such as the presence of cells in both types of blood, percentage of cells in both types of blood, and which blood quickly react to that particular test and give better results.
Composition of Menstrual or Impure Blood
Menstrual or impure blood is not highly oxygenated, that’s why it is darker than normal or pure blood. Menstrual or impure blood contains sodium, iron, phosphate and chloride, the extent of which depends on the women. As well as the blood, the fluid contains endometrial tissue, vaginal fluid and cervical mucus. Menstrual or impure blood contains all the five isozymes of lactate dehydrogenase LDH-1, LDH-2, LDH-3, LDH-4 & LDH-5 [7].
Material & Methods
Material
Chemical reagent including Teichmann reagent (potassium Chloride 0.1%, potassium iodide 0.1%, glacial acetic acid 10ml), Hemp fluid, Turk’s solution, Sahli’s hemoglobinometer and Haemocytometer grid, HCL, distilled water and antiserum ABH are used to detect blood group [8].
Sample Collection
The collection is done by the subjects of 30 normal women who were being selected with age groups between 18-30 years, to give menstruation and normal blood samples. Liquid menstrual blood samples collected bloodstains in sample containers and menstrual blood, or impure blood samples collected in closed plastic containers. Approximately 3 ml of blood was collected in a normal blood/pure blood sample from the same person.
Method
The Menstruation blood and pure blood are taken from the same person and the initial study was done to differentiate the blood type samples. The hemoglobin level was determined using std. Sahali’s hemoglobinometer, to which anti-coagulated blood is added 0.1 N HCl and kept for 5–7 min to form acid hematin. The colour of this acid hematin was mixed with the solution Calibration is present in the tube. Distilled water is added Color matches and then notice readings of both samples. Then RBC and WBC cells are counted with the help of Neubauer’s hemocytometer slide in both tried to sample the same person determine blood group from menstrual blood samples using the simple antisera ABH [9]. Blood group detection is done by menstrual or impure blood using antiserum ABH.
Result & Discussion
The result of the current study, we found the initial study, that is to differ the blood samples like Hemoglobin, RBC & WBC count show the great variation and this variation depends on the normal blood and abnormal blood samples of any person. In this, we observed that level of Hemoglobin, RBC & WBC is too much less in menstrual or impure blood as compared to the normal or pure blood samples. Normally the actual value of hemoglobin in pure or normal blood samples consider is 10-15gm% and in menstrual or impure blood is from 2-4gm%. In this paper, we find out that hemoglobin level in menstrual or impure blood is very low as compared to the normal blood or pure blood samples (Table 1). Based on our observation, the value of RBC cells in menstrual or impure blood is very low. The number of WBC that we identified in our results is between 6-9cu/mm in the case of normal blood or pure blood samples but in menstrual or impure blood samples the number of WBC cells is very low that is observed between 3-6cu/mm (Table 1). After the check of all cells count, we have studied a method for rapid and simultaneous analysis or examination of nucleated RBC samples and the main method and device for the simultaneous and quantitative, flow cytometric analysis of nucleated red blood cells and white blood cells from the whole blood cells. The based on these results we easily find that the composition of menstrual blood or impure blood show great variation and the content of blood like haemoglobin, RBC, WBC are present in fewer amounts in menstrual blood than the normal blood [10-11]. Based on findings, we found that menstrual blood/impure blood has less composition than normal blood/pure blood samples that give a better parameter for differentiating the menstrual blood from normal blood samples (Figures 1-6).
Figure 1: Techimann Crystal.
Table 1: Different parameters show different values exit is the blood and impure Blood Samples of The Same Individuals.
Figure 2: Showing the Hemoglobin Reaction with Teichmann Solution.
Figure 3: Shows the Comparison Between Normal and Abnormal Blood Samples.
Figure 4: Show’s the positive result with normal blood.
Figure 5: Shows the negative result with menstrual blood.
Figure 6: Exhibit with menstrual blood.
Microscopic Examination
Microscopic examination is the most important part of the field of forensic biology and serology. In this paper microscopic analysis is done by making thin smears blood is used to separate the menstruation or impure blood [12]. Normal blood or pure blood sampling and microscopy are very good parameters to separate menstrual or impure blood from normal or pure blood. PH of menstrual or impure blood samples with the help of pH paper, PH of blood samples observed at different intervals of time.
Forensic Aspect of Examination
A forensic examination was performed by the Confirmatory test by Teichmann test with menstrual or impure blood. Teichmann test was in this Teichmann solution, menstruation is performed on blood and add to the blood sample and cover with a coverslip and then heat the slide at 700C for 05 to 10 seconds and then allow it to do Cool and observe under the microscope. Then Teichmann test shows a negative result with menstruation or impure blood because the level of hemoglobin in menstrual or impure blood is very low while giving a positive result with normal or pure blood samples because the level of hemoglobin in normal or pure blood is too high [13-14]. That hemoglobin is reacted with the Teichmann reagent and gives positive results, we mention in this paper (Figure 4) [15].
Conclusion
The outcome of the result, it has been concluded that menstrual blood or impure blood gives a negative result, by using a confirmatory test (Teichmann test) because due to lack of WBC and RBC does not present in the menstrual blood samples. While we come under the scene of the crime, menstrual blood or impure blood is mostly seen in the crime of murder, rape, assault cases etc, on the onset of menstruation of the female suspect or victim. This is very useful for the identification of crime scenes due to the presence of bloodstain pattern and dead cell and hemoglobin levels in menstrual blood is much less than that of a normal blood sample. So above all parameters make it an important step for crime scene analysis evaluation and help with the reconstruction or corroboration of events.
Electrotherapy for the Treatment of Diabetic Distal Polyneuropathy
Introduction
Background
In many cases pharmacotherapy turned out to be ineffective in treatment of many patients with diabetic distal polyneuropathy. Clinicians in recent years have therefore begun to widely use nonpharmacotherapy to enhance the effectiveness of drug treatment of DN [1,2]. The advantages of non-pharmacotherapy methods are minimal side effects, as well as the absence of contraindications [1]. It is important to note that acupuncture and transcutaneous electroneuro stimulation were recommended by Toronto Diabetic Neuropathy Expert Group for treatment of diabetic distal polyneuropathy [1]. In many studies, the effectiveness of TENS in treatment of psychogenic, nociceptive and neuropathic pain syndromes has been proven. [3]. However, the effectiveness of TENS in the treatment of sensory and motor deficits in distal polyneuropathy was studied insufficiently [1,4,5].
Objective
To study the dynamics of sensory and motor deficiency in diabetic distal polyneuropathy syndrome by using Transcutaneous Electrical Neurostimulation (TENS) of peroneal and tibial nerves.
Materials & Methods
Our study included 60 patients with diabetic distal polyneuropathy of the lower extremities. Patients are between 35 and 65 years of age. The average age of the patients was 47 years (Figure 1). 20 patients underwent only standard pharmacotherapy. In addition to pharmacotherapy another 20 patients were managed with high frequency and Low Amplitude (HL) TENS and the rest 20 patients were treated with low frequency and High Amplitude (LH) TENS of peroneal and tibial nerves.
Figure 1: Distribution of patients into groups depending on the method of treatment.
Methods of Treatment
a. Pharmacotherapy: Pharmacotherapy was administered for 2 months with the use of vitamin B, Duloxitine and alpha lipoic acid (Figure 2).
b. TENS: TENS was carried out in the second month of pharmacotherapy. We used 2 variants of TENS: high frequency TENS (HL) and low frequency TENS. Characteristics of current are shown in (Figure 3).
• LH TENS: Frequency = 1 Hz. Amplitude (no painful muscular response). Duration = 200 μs.
• HL TENS: Frequency = 100 Hz. Amplitude (clear sensory response). Duration = 100 μs
Technique of TENS is shown in (Figure 4).
Figure 2: Observation of the treatment and outcomes of patients.
Figure 3: Characteristics of current.
Figure 4: Technique of labile low-frequency TENS of peroneal nerve (1) and tibial nerve (2). Cathode (A) is fixed in the proximal nerve. The stimulating anode (B) is labile and has the form of a pen. Each 10 cm the anode was moved from the proximal nerve in the distal direction. The ground electrode (B) is on the lower third of the leg and the active and reference recording electrodes (D) are fixed in foot area as in EMG examination of the peroneal and tibial nerves. The course consisted of 15 procedures every other day.
Methods of Examination
To assess the degree of peripheral nerve damage against the background of distal polyneuropathy of the lower extremities and their degree of regression after the treatment and in the follow-up, we used the following diagnostic methods:
• Negative sensory symptoms: Vibration, temperature, tactile and pain hypoesthesia were determined by 5-point scales.
• Positive sensory symptoms: Subjective sensory disorders such as tingling, numbness, burning pain and shooting feeling were described by the patients themselves using 10-point scales.
• Ankle dorsiflexion strength was investigated using a 5-point scale.
• The severity of neuropathic pain syndrome was determined on a 10-point visual analogue scale (VAS).
• By electromyography conduction velocity and amplitude of M-response of peroneal and tibial nerves were examined.
Results
Pain Syndrome
significantly decreased on the background of the TENS in comparison with pharmacotherapy by 43% (Figure 5). Analgesic effect of HL TENS proved to be more effective than LH TENS by 34, 7%.In the second and sixth months of the follow-up period there were no significant differences between the various modalities of TENS (Figure 4).
Negative Sensory Symptoms
Significantly decreased as a result of the additional application of TENS by 25, 9%. Improvement of sensory disorders was noted in patients who passed LH TENS more than HL TENS by 78% (p<0,05).In the second month of the remote period after LH TENS negative sensory continued to decline significantly by 19%(Figure 5). Positive sensory symptoms significantly decreased with the use of TENS 39% more than using of pharmacotherapy alone. Positive sensory symptoms regressed after application of HL TENS in comparison with LH TENS by 24% (p<0.05).In the follow-up period positive sensory symptoms in both groups showed no significant differences (Figure 6). Recovery of motor weakness was not observed after the use of pharmacotherapy alone and was detected only after LH TENS and was on average 17% in ankle dorsiflexion and 22% in ankle dorsi extension (Figure 7) Electromyography values of M-response and velocity of peroneal and tibial nerves were not significantly changed, however, in some cases there was an improvement in the M-response rate in electromyography after LH TENS (Figure 8).
Figure 5: Dynamics of negative sensory symptoms in different periods of observation.
Figure 6: Dynamics of positive sensory symptoms in different periods of observation.
Figure 7: Dynamics of ankle dorsiflexion strength.
Figure 8: Electromyography dynamics of M-response and velocity of left peroneal nerve after using LH TENS in treatment of patient with diabetic distal polyneuropathy (woman, 55 years old and MD 12 years).
Conclusion
TENS increases the effectiveness of pharmacotherapy in the treatment of diabetic peripheral neuropathy in reducing the negative and positive sensory symptoms, motor deficit and neuropathic pain syndrome. TENS has a prolonged effect that lasts for 6 months of the follow-up period. The maximum therapeutic effect is observed in the second month of the follow-up period. High frequency-low amplitude TENS is recommended for treatment of neuropathic pain and positive sensory symptoms. Low frequencyhigh amplitude TENS is the method of choice in treatment of negative sensory symptoms and motor deficit. Recovery of electromyographic abnormalities was not observed in all patients. However, in many patients, there was a noticeable amplitude increasing of M-response.