Biomedical Journal of Scientific & Technical Research (BJSTR) is a multidisciplinary, scholarly Open Access publisher focused on Genetic, Biomedical and Remedial missions in relation with Technical Knowledge as well.
On Possible Regulation of Cancer Cells Growth Dynamics Using Electromagnetic Effects on the Body
Introduction
This work is a logical continuation of a series of previous works devoted to the analysis of the influence of external constant and variable electromagnetic (abbreviated as EM) fields on biological objects (see articles [1,2]). This report will focus on the study of the influence of variable EM fields on the cellular structure of the body. In this case, the system of the Lotka-Volterra equations [3,4] will be taken as the basis for calculations and estimates, which we will modify accordingly in relation to our problem, relying to a large extent also on the work [5]. It is not difficult to formally introduce any type of interaction into the system under study. The main issue is always the physical and mathematical justification of the appropriate type of interaction and understanding how to apply it to a particular task. It is this justification that we will now deal with in order to achieve this goal. It is worth noting beforehand that issues related to the mathematical description of cancer diseases have been dealt with for a relatively long time, and there are a number of results in this area, described in some detail, for example, in [6- 7]. The approach proposed below is based on considerations other than those mentioned above and gives a theoretical prediction for the treatment of such diseases.
The Energy of Cell Interaction with the EM Field
In order to find the interaction we are interested in, we will need to take into account the following two very important points. Namely, firstly, this interaction should be invariant with respect to the time sign inversion, and, secondly, it should take into account the concentration of “predators” and “preys”. In our case the role of predators will belong to cancer cells, the concentration of which we will designate with a letter n , and the role of the preys – to healthy cells; their concentration we will designate with a letterm . Note that we adhere to the same designations as in [5]. It is quite clear (see monograph [8]) that the interaction of any bodies with the EM fields can be different from zero only if the internal structure of the object under consideration allows to take into account its polarization p and magnetization m . However, if almost any object, including a cell, is under long-term exposure to constant EM fields, it will be certainly polarized. This means that, despite its extremely complex structure, there will be a slight deformation of the cell, which allows us to consider the polarization p . This means that we may take into account the possible interaction of cellular substance with a variable electric field E′(t ) , but only after the 0 E polarization of the cell is induced by the applied constant electric field. Such an interaction, attributed to a unit of volume, as it is known [8], formally has the form of a negative scalar product −p⋅E′ , where
Where αñ − is the cell polarization coefficient As for the magnetic field, if there are magnetic atoms in the cell structure in the form of, for example, iron, manganese or other magnetic particles, as well as moving charges, the energy of interaction with an external variable magnetic field will necessarily manifest itself H′(t ) in the same way as with an electric field, but already having the form of −m⋅H′(t ) where
This vector represents the magnetic moment of the cellular substance, χñ − is the magnetic susceptibility of the cell, and H0 − is the constant magnetic field applied to the body.
The account of interaction with the field will be given further phenomenological (see formulas (18), (19)) in the form of dependencies of coefficients b(t ) and c (t ) (see equations (5)).
Basic Equations and their Analysis
If we denote some average energy of the corresponding group of cells as 1,2 ε , then taking into account (3) and based on the results of [5], we can write the following expression for the functional we are interested in
Where functions Φ1,2 (n,m) are given in [5], and their explicit form is not important for us now.
Using the general method of deriving equations proposed in [9], we arrive as a result at the following system of two nonlinear equations that adequately describes our case:
Where a − will be considered a constant parameter, and we will need functions b(t ) and c (t ) further below.
As we can see, if we assume that b(t ) = 0 in the upper equation, we get the generalized Lotka-Volterra equation [3], [4], in which coefficient c (t ) is a function of time. And if we believe that c (t ) = 0 , then we get the generalized Verhulst equation (see [5]), in which coefficient b(t ) is a function of time [10].
Equations (5) also automatically take into account the condition of preserving the total amount of cellular substance in the body, that is,
Where μ1,2 − the masses of one healthy and one cancer cell are, respectively, M − is the total mass of the cellular substance, and V − is the volume occupied by it.
Based on the ratio (6), it is easy to find the time dependencies n(t ) and m(t ) that we are interested in. Indeed, expressing one of them by equation (6), for example m(t ) , we have
Where
After substituting (7) into the upper equation of the system (5), we arrive to the following solution
Where 2 C − is the integration constant, and the function
Constant 2 C is found from the initial condition n(0) = n0 . As a result
Substituting solution (9) into (7) now, we come to the following time dependence of the temporal behaviour of healthy cells:
As we can see from obtained solutions (9) and (12), the healthy and diseased cells behave quite adequately. Specifically, if the function is A(t ) = b(t ) −Gc (t ) > 0 , then the disease wins, because
In this case, the function A(t )must be such that condition (13) is fulfilled. As we can see from (9) and (12), in this case
And
At some point of “switching” function A(t ) = b(t ) −Gc (t ) changes sign, that is, it becomes negative ( A(t ) = b(t ) −Gc (t ) < 0 ) and we get the opposite picture. In this case, the disease recedes, and we come to equality
And healthy cells are restored, that is:
Now, as for the functions b(t ) andc (t ) . Due to the fact that the connection with the EM field has the form of a dipole interaction, then, based on purely physical considerations and the correct dimension of the equations, the form of these coefficients can only be as follows:
Where 1,2 a − the linear dimensions of diseased and healthy cells are, respectively, c S − is the contact area along the border line between them, and the dot above the letter means differentiation according to time.
Thus, function (10) of out interest, taking into account (1), (18) and (19), should be the following
Where β − is the angle between the direction of the external constant field and vectorE ′(t ) .
As we can see from (20), when changing the direction of the polarity of the fields, function A(t ) must change the sign to the opposite. By doing this, we achieve the opposite effect, that is, following the theory proposed above, there will have to be the destruction of diseased cells and the growth of healthy ones.
In this case, we may express function E′(t ) , for example, in the form of a linear time dependence, that is
Where γ − is a certain growth coefficient.
The Main Idea of the Work
The general physical considerations outlined above concerning possible methods of combating malignant tumours (and not only them, but many other similar diseases), allow, in our opinion, to select such variable fields and their amplitudes, which, in the process of reversal magnetization of their directions, will certainly lead to a positive therapeutic result.
Conclusion
Concluding this message, it is worth paying attention to two important points. The influence of variable EM fields on the reproduction of malignant tumours has been studied; It is shown that the proposed model quite adequately describes both the growth and disappearance of cancer cells, that is, the recovery of the body.
Invent a Removable Orthosis with the Ability to Prevent Foot Drop and Venous Thrombosis and Maintain Muscle Contraction
Introduction
From the perspective of the World Health Organization (WHO), health is the science and technology of disease prevention, providing medical services for immediate diagnosis, treatment and development to address problems. Safety is one of the most important aspects of health care systems [1]. Increasing the quality of work, consequently, increases the accuracy and improvement of the treatment process, the speed of the treatment process and also patient satisfaction [2]. Intensive care includes taking care of patients with life-threatening diseases, under the supervision of the most skilled personal, with advanced equipment and facilities, which includes all sensitive care related to the patient’s life [3,4]. A significant part of the treatment system’s effort is focused on being able to provide the best services to its patients in the shortest time and at the lowest cost. Intensive care units (ICUs) have an important place due to the high human and economic costs that they can incur for the health care system [5,6].
Patients with problems such as diabetic ketoacidosis, hypertensive emergency, non-accidental self-poisoning, heart failure, ischemic heart disease and cerebrovascular disease and respiratory conditions can be mentioned [7-9]. Numerous studies have been performed to identify the increasing mortality factors of patients admitted to the ICU. Infectious shock, age, smoking and nosocomial infections are among the factors that increase mortality in ICU wards [10,11]. A comprehensive study of UK hospitals showed that the mortality rate of patients admitted to ICU wards is about 20.6% [12] and that of Singapore public hospitals is 9.4% [13]. Complications of hospitalization in the Intensive Care Unit include foot drop, deep vein thrombosis[14], muscle atrophy [15] and so on. Venous thromboembolism (VTE), including deep vein thrombosis(DVT) and pulmonary thromboendarterectomy (PTE), is a public health problem that results in 250000 hospitalizations per year in the United States [16,17]. On the other hand, one hundred to fifty thousand people are hospitalized every year due to a benign and treatable disease, but die due to pulmonary embolism, while with prevention, the death of these patients can be prevented [18].
Risk factors for this disease are immobility, cancers, myocardial infarction, respiratory failure, surgery, trauma, obesity, use of female hormones and inherited coagulation disorders [19]. Another complication of hospitalization is “foot drop”. Foot drop or foot prolapse is a condition in which a person is unable to perform the dorsiflexion joint function properly due to weakness or paralysis of the anterior tibialis muscle or other muscles originating in the peroneal nerve. Foot drop can be unilateral or bilateral. Symptoms such as pain, weakness, and numbness are sometimes seen with this complication [20]. Diagnosis of this complication is easily possible by physical examination, but the use of imaging techniques and electromyography can also help to examine this complication more closely [21]. Today, there are various treatments to control foot drop, which considering the cause of this complication, the appropriate treatment method is adopted. Among the available treatments for prevention and correction of foot drop, physiotherapy, electrical stimulation and teaching the most common treatments using ankle foot orthosis [22].
Other complications of hospitalization in the intensive care unit include muscle atrophy [15], bed sores, etc. At present, according to the subject and results of research, one of the ways to prevent and reduce complications in hospital wards is to produce and use a mobile orthosis with the ability to prevent foot prolapse and venous thrombosis and maintain muscle contraction. In the following, we will talk about its structure. This idea has been registered in the Patent Organization of Iran under invention number 103769.
Methods
This project started with a new researcher idea Then by searching in the scientific content of articles and book, the title and proposal the project was compiled with opinion of the supervisor. Then model of the device was designed in collaboration with graphic & mechanical engineers Fianccy. The main tool was invented by the researcher. By mechanic engineer and solid work the design of this tool with professional software with academic-theorical proposal researchers (Mahmoudi and Mohammadbeik) about making a tool for the purpose of preventing foot drop, deformity of toes, muscles atrophy, improvement of blood return from distal to proximal organs and keep the function of vainvalves, assessment of vital signs and keep the power of foot solid muscles and prevention from muscels atrophy. This idea is designed by softwares and then the file of this designing was transferred to laboratory by researcher and work mechanic engineer in order to hardware designing and maquette. The structure of orthosis was discussed in terms of all angle’s morphology, measurement of figure based on standards and again after changing s figures and ,measurement was redesigned by software expert.
Figure 1: According to Figure 1
1. Orthotic body
2. Mechanical lock
3. Electric leads.
This mobile orthosis with the ability to prevent foot drop and keep the function of vain valve and assessing the vital signs is composed of (mechanical lock: 3×2cm, body: 40 cm length , pulse sensor: 0.5× 0.5 cm, pulse oximeter sensor: 0.5× 1 cm, inflatable inner layer R: 12cm, outer layer R: 15cm, electrical message transmitter leads: R: 1cm, insole: 25cm, removale hinge R: 2cm, connector between inner laye and air pump R:2cm. Orthosis is made up of upper and lower sections which after right locating(positioning) of foot in it, two sections will be connected to each other by mechanical lock (according to Figure 1, number 2). for motion of foot in its rang of motion (ROM), first removable hinge(according to Figure 7, number 11) is connected to monitor screen which is seprated from orthosis by a wire. all normative motion for foot’s motion(foot’s dorsal flexion, foot’s sole flexion,invertion , overtion) will be done by a program which is designed on screen and by choosing each motion, message will be transferred to removable hing(according to Figure 2, number 11) by a wire and by moving the orthosis, the foot moves in the desired direction and according to instruction given to program , the foot remains at desired posture for specified period of time (5s) and returns to its initial posture again.
Figure 2: According to Figure 2
1. 7- outer layer of orthosis
2. 8- inner layer of orthosis
3. 11- Removable hinges.
Figure 3: According to Figure 3
1. Air pump
2. LCD
3. Power on
4. Power off
5. Junction with interface.
Figure 4: According to Figure 4
1. 4- Connector
2. 5- Orthotics insole
3. 6-Upper part of orthosis.
Figure 5: According to Figure 5
1. Tens devices
2. LCD
3. Power on
4. Power off
5. Wire connection position.
Four foot motion (foot’s dorsal flexion, foot’s sole flexion, invertion and overtion) is done through a program which is programmed on the screen memory via removable hing, the duration of doing this motion, number of times, the amount of foot’s rest until next move. For preventing deep vein thrombosis (DVT) and maintaining the one way valve function, first the portable small air pump (according to Figure 3, number 1) which is available in the market is connected to the connector between air pump (according to Figure 4,number 4) and inflatable inner layer (according to Figure 2, number 8 ) by an air tube through transfering air from pump to inflatable inner layer the action of inflating and emptying takes place. Of course the number of times, intensity of wind pressure is defined by screen (according to Figure 4, number 6) available on pump’s body(according to Figure 3, number 1) and applied on foot, which this action causes standard pressure(17 mmhg) on one way valve and it causes continuity and helping blood circulation and prevents from the reduction of one way valve function.
Figure 6: According to Figure 6
1. 9- pulse Oximeter sensor
2. 10- Pulse Sensor.
Also electrical leads (according to Figure 1, number 3) are connected to the desired position (according to Figure 5, number5) by a wire and after connecting to tennes machine (impulse maker machine) by making impulses causes electrical stimulation of muscles and prevents muscles failure and atrophy that voltage intensity, duration of muscle stimulation, number of stimulation are controlled and done by screen (according to Figure 5, number 2) and planning is done. According to location of the sensor in the upper part of orthosis(according to Figure 6 , number 10) number of dorsal pedis pulse is measured and shown on the screen. Also by placing pulse oximeter sensor on the upper part of orthosis (according to Figure 6, number9), the amount of oxygen saturation is shown on the screen. By making movable orthosis and due to structure and muscle electrical stimulation prevents reduction of muscle contraction, atrophy and foot drop and causes maintaining valve function and the amount of oxygen saturation is studied through dorsal pedis pulse sensor and pulse oximeter sensor and can prevent the accurance of many diseases and the death caused by them.
Discussion
This research has been done in the field of medicine and medical engineering. Due to the extent of the foot drop and Deep vein thrombosis when providing medical care to the drug, the use of preventive equipment is felt to prevent this problem. Due to the innovative design of this design, Used to prevent ankle foot drop, deformity of the toes, muscle atrophy, improve blood flow from the lower to the upper and improve blood flow from the lower to the upper and monitor vital signs monitor vital signs and maintain the strength of the leg muscles. The advantages of this plan include moving the foot in four directions (flexion of the back of the foot and flexion of the sole of the foot and inversion and oversight), the ability to plan the number and time of movements, check vital signs in the lower limb, prevent reduction of contraction Muscles, preventing blood stasis and thrombosis in the lower extremities, preventing atrophy and muscles mass. Also, according to the research of Esfandiari et al (2017), a study entitled Literature Review of the Effect of Ankle-Foot Orthosis on Gait Parameters After Stroke [23] and Alnajar et al (2020), with Title Advances in neuroprosthetic management of foot drop [24] and prenton et al (2018), with Title FUNCTIONAL ELECTRICAL STIMULATION AND ANKLE FOOT ORTHOSES PROVIDE EQUIVALENT THERAPEUTIC EFFECTS ON FOOT DROP [25], and this research, the use of preventive equipment to prevent Ankle foot drop, toe deformity, muscle atrophy, improving blood flow from the lower to the upper and maintaining pigeonhole valve function and monitoring vital signs and maintaining leg muscle strength is suggested.
Results
Results of this study and other surveys can be one of the most effective ways to prevent prevent ankle foot drop, deformity of the toes, muscle atrophy, improve blood flow from the lower to the upper and monitor vital signs and maintain the strength of the foot muscles. Also using orothesis can decrease it significantly. Besides, modifying the preventive policies such as producing instruments like Removable orthosis is recommended. We are ready to work with all institutions and individuals in the fields of economics, education, research and health and startups for this idea. If you wish, please contact us via masoudmahmoudi515@ymail.com email.
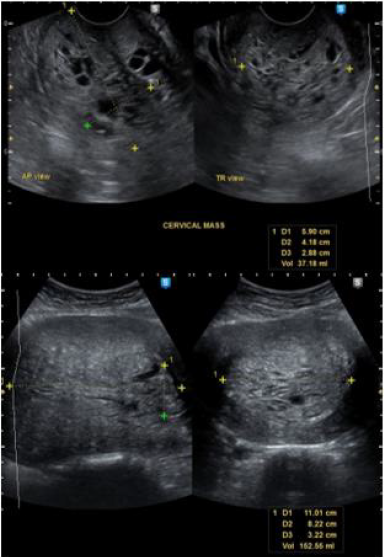
Screening of Cervical Cancer in the Dakar Region by Cervico-Vaginal Smear: Epidemiological and Cytological Aspect
Introduction
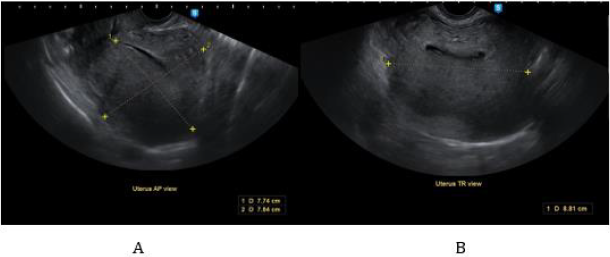
The cervical smear (CSF) or pap smear is a collection of cells from the cervix for the early detection of any cellular abnormality that may suggest precancerous or cancerous lesions of the uterus [1]. Cervical cancer is one of the most common cancers in the world, particularly in women. Indeed, it is the 3rd most common cancer in women worldwide and one of the most common in our regions [2]. More than 80% of uterine carcinomas are found in developing countries [3]. Cancerous and pre-cancerous lesions of the cervix are therefore a real public health problem in many African countries like Senegal [4]. Cervical cancer is preceded by a long latency phase characterised microscopically by a broad spectrum of events ranging from cellular atypia to various degrees of dysplasia or cervical intraepithelial neoplasia (CIN) before progression to invasive cancer.
Method
This is a retrospective study of 2391 cases of significant cervical smears performed in the period from 01 August 2014 to 01 June 2016. This work was carried out at the Laboratory of Cytology, Cytogenetics and Reproductive Biology of the University Hospital of Dantec in Dakar. First, patients were registered in a register with an identification number, surname, first name, age, origin and telephone number. The interview is carried out before the sample is taken and focuses on marital status as well as gynecological and obstetric complaints and history. The sample is taken from a woman in a gynecological position by inserting a suitable speculum which exposes the cervix then use a cytobrush to take the actual smear by scraping the ectocervix and then the endocervix. Finally, two slides marked exo and endo respectively and the patient’s ID number are spread out. The slides were then fixed with a fixative, dried and stained using the Papanicolaou method. After the staining step, the slides were mounted and then read under the microscope. We wrote the reports in the computer. We used the computer and the register for data processing and were able to collect cases of smears that could be interpreted. All women with inflammatory and atrophic smears of menopausal origin were excluded from the study. The data were stored and analysed in Excel.
Result
We collected 2391 files. The mean age of the patients was 47.72 years with a standard deviation of 11.37 years. The most represented age (mode) was 40 years. Referrals from level 1 and 2 hospitals were 65%. The rest were referred by private doctors’ surgeries, by the pension institute and by some clinics. Patients referred for routine check-up without apparent clinical manifestation were 43.16%. The other requests were due to various clinical manifestations: metrorrhagia, primary or secondary amenorrhea, pelvic pain, dysmenorrhea’s majority of patients (51%) were married in a monogamous union. single women accounted for 14% of the total. The remaining 35% were in polygamous households. Patients with intraepithelial lesions were 7.27% and of these highgrade lesions (HSIL) represented 2.63%.
Discussion
The systematic analysis of the results of our study has provided us with important information on the epidemiological data of cervico-vaginal smears in Senegal. Indeed, after 22 months of data collection, the average age of the patients in our series was 47.72 years with extremes between 15 and 88 years. In Ethiopia, Mesele and his team found the same average age in 2010 (47.7 years), after 6 months of study [5]. This age generally corresponds to the period of genital activity in most women. Epidemiological studies have shown a strong correlation between sexual age and certain infections, particularly HPV [6]. Patients were sometimes referred by various public (more than 65%) and private health structures. This can be explained by the relatively affordable cost of this examination in our center (less than 10 euros) compared to private facilities that perform the same examination. Our countries have very little universal health coverage, in contrast to several countries in the North, where the uptake of screening is greater but limited in some areas by disparities [7]. Patients living in the outskirts of Dakar were 53.47%.
The departments of Pikine and Guédiawaye account for more than 50% of the population of Dakar [8]. We therefore believe that increasing the number of public screening facilities in the suburbs of Dakar would probably increase adherence to routine screening. These results are in contrast to those obtained by Diallo and his team who showed 20 years ago that in the absence of functional urogenital signs, women rarely consulted health facilities in Senegal for early detection of cervical lesions [4]. In France, the Haute Autorité de Santé recommends systematic screening for precancerous and cancerous cervical lesions by cervico-vaginal smear every 3 years in women aged between 25 and 65 years [9]. We thus note that education, information and communication about cervical-uterine diseases are fundamental to their prevention. Of the patients screened who were in a monogamous union, 51% were in polygamous households compared to 35%. Polygamy is a major feature of matrimonial systems in sub-Saharan Africa. It is underpinned by cultural and religious perceptions [10].
Studies have shown a major preponderance of HPV infections in non-monogamous spouses, even in developed countries [5,6]. Our study also looked at the parity of women. Indeed, 8.67% of them had more than 5 children. High parity appears to be a very important risk factor for the occurrence of cervical cancer. Studies in Ethiopia, Costa Rica and Thailand found a higher incidence of cervical cancer in women who had more than five children. Weakening of the cervical mucosa, which reduces the spontaneous elimination of HPV, could explain this link. Other studies in Denmark and Manchester found no association between parity and cervical cancer incidence [5,11,12]. Patients with dyskaryotic cyto-morphological abnormalities of the cervical intraepithelial neoplastic type were 7.27% with 4.64% low-grade intraepithelial lesions (LSIL) and 2.63% high-grade intraepithelial lesions (HSIL). In 20 years, we have seen a very significant reduction in the rates of dysplastic lesions, which were estimated to be 20.54%, of which 17.56% were low Bethesda smears and 3.36% were high-grade smears [4]. Studies have shown that 12% of LSIL can develop into invasive cancer, compared with 1% of HSIL [13]. However, only histology after colposcopy of the lesions could confirm its cytological abnormalities.
Conclusion
Thanks to the work undertaken by Papanicolaou since 1928, gynecological cytology has proved to be of prime importance in the fight against and treatment of dysplastic lesions, and in raising the awareness of health workers, government officials and the education of women in Senegal.
Investigation of the Effect of Indoor Airflow on Separation of Coronavirus from Ambient Contaminated Surfaces
The Coronavirus disease 2019 (COVID-19) is a devastating challenge for many countries worldwide. A new class of Coronavirus, known as SARS-CoV-2 (Severe Acute Respiratory Syndrome Coronavirus 2) has been found to be responsible for the occurrence of this disease. According to the World Health Organization (WHO), the disease is rapidly spreading around the world, and, to date, the virus has affected more than 200 countries, causing severe health, economic, and social disruption to the entire human population [1]. There are two modes of transmission: the first is through respiratory droplets, while the second is through contact routes [2-4]. Respiratory droplet transmission is due to coughing or sneezing by an infected person to a healthy person. This type of transmission can be avoided by keeping a safe distance between people, and by not coughing or sneezing in open air [5] Another form of transmission is through contact route, in which the infected person somehow transmits the virus onto a surface and infects healthy persons through various mechanisms, such as the airborne contaminations considered in this investigation. This type of transmission depends upon surface stability, which is the duration of time a material can hold the virus. The Coronavirus can sustain itself up to 72 hours on surfaces like plastic and steel [6,1]. One of the principal uncertainties is related to how COVID-19 is transmitted, especially the factors which may accelerate or delay its spread. These factors include the mode and speed of transition, and interaction of Coronavirus with surfaces such as landing, attachment, survival and detachment. This is particularly important in indoor spaces, where density of people, availability of open surfaces, and circulating airstream can possibly increase the risk of infection. In this regard, World Health Organization (WHO) believes it is urgent to investigate the transmissibility of Coronaviruses from contaminated surfaces [7]. Very recent case studies in localized outbreaks of COVID-19, such as the Diamond Princess Cruise ship in Japan, some restaurants in China [8], and some Call Centers in South Korea [9], have shown that contaminated surfaces in indoor spaces are potential sources for spreading the Coronavirus. In the United States, Centers for Disease Control and Prevention (CDC) believes that because respiratory droplets can land and survive on some surfaces, it is possible that surfaces could be a real issue in transmission of COVID-19 (CDC, 2020). In fact, due to the lack of information, the mechanism by which a contaminated surface spreads the Corona virus is not clearly understood. It is crucially important to study whether the main cause of the Coronavirus spread is separation from surfaces by indoor airstream or touching of the contaminated surfaces.
The potential of viral spreading via contaminated surfaces depends particularly on the ability of the virus to maintain infectivity whilst it is in the environment. This is affected by a combination of biological, physical, and chemical factors. Rapid spread of viral infections through contaminated surfaces is common, particularly in crowded indoor establishments, such as schools, day-care facilities, nursing homes, business offices, hospitals, and transport systems [10]. Interactions that take place between viruses and surfaces are determined by their characteristics, which involve electrostatic, hydrophobic, and/or ionic strength of the virus [11,12]. Therefore, it is necessary to systematically investigate how ambient airflow influences the contaminated surfaces. Viruses are believed to be the most disinfection-resistant microbial pathogens [13]. Therefore, a better understanding of how they relocate and attach to surfaces is very important. In this regard, one of the significant factors that governs the spread of a virus is how it interacts with surrounding surfaces and the strength of the virussurface bond. This is especially important in indoor spaces such as hospitals, classrooms, offices, etc. When a virus lands on a surface, a variety of bonds can play role(s) in virus-surface interactions, such as electrostatic bonds, hydrophobic bonds, Van der Waals bonds, hydrogen bonds, charge-transfer bonds, and biospecific bonds [14]. In this list, electrostatic interaction has been recognized as the dominant factor for virus-virus or virus-surface interactions [15-19]. Viruses are colloid-sized particles composed of capsid proteins encapsulating infectious genetic material (nucleic acids). The surface charge on viruses is caused by ionization of the typical amino acid groups.
Surface functional groups on these amino acids are dominated by carboxyl and amine groups, which yield viruses with amphoteric surfaces and pH values ranging from 3 to 7. Therefore, viruses may be positively or negatively charged [20]. Many studies have been performed to measure the force needed to detach a virus from a surface. Several techniques have been developed for measuring forces between biological structures, including mechanical springs made from glass fibers [21], vesicle-based force transducers [22], optical tweezers [23], and surface–force apparatus [24]. These methods have sufficient sensitivity (0.01–1 nN ) to detect the intermolecular forces between protein bindings but lack spatial resolution. Atomic force microscopy (AFM) has been extensively used to measure the adhesive force of the protein-based structure of a virus to the surface. The major advantage of AFM over these other techniques is its spatial resolution and lateral resolution, which is of paramount importance at micron and nanoscales [25]. The average adhesion force of proteins (including Coronaviruses) to different surfaces has been reported from 44 up to 250 pN [26], 140 to 180 pN (ROHDE, 2020), and 257±25 pN [27]. The adhesion force between a surface and a protein-based structure can change due to a variation of many parameters such as the type of protein, pH, the morphology, and the materials of the surface. In this study, the average adhesion force of a virus to a surface (Fa) is considered between 40 and 140 pN . Moreover, Coronavirus virions are assumed spherical, with diameters of approximately 125 nm, as depicted in recent studies by cryo-electron tomography and cryo-electron microscopy [28-30].
SARS-CoV-2 viruses could be spread in the surrounding air due to the regular human activities such as exhaling, sneezing, coughing, talking etc. The virus can be considered airborne until the time that it deposits onto a surface. There have been several studies that investigated the motion and spread of the suspended viruses in air before their deposition on surfaces [31-34]. Deposition of the airborne particles on surfaces depend on different factors including the size, shape, and weight of the particles, and the velocity and direction of airflow (flow pattern) [35,36]. Numerous experimental and theoretical investigations have been conducted to study the conditions of particles’ deposition on solid surfaces [36-41]. Once the particles settled on a surface, the resuspension of the particles depend on the application of external force to detach the particle from the surface. Studies show that about 70% of the aerosol particles and droplets settle on the surfaces and walls. There have been several studies, which linked the transmission rate of SARS-CoV-2 viruses to the direct contact of the humans with contaminated surfaces [42-44]. However, if the indoor airflow could cause the resuspension of the SARS-CoV-2 viruses, then it increases the chance to be inhaled by the occupants in the vicinity of the surfaces.
This study focuses on the effect of airflow (the speed of air current flowing through indoor spaces) on transmissibility of the Coronavirus. Its aim is to investigate whether or not the Coronavirus can be dispersed from a contaminated surface into the air and transferred onto a new surface. The findings of this study can help us to have a better risk assessment of being in closed spaces, where Coronavirus contaminated surfaces exist. In this regard, regular surfaces in a typical building are simply modeled in two major categories, including flat plates and circular cylinders. Furthermore, the effect of surface roughness has been considered in the models. Three main categories of materials were considered in this study including glass, steel, and wood, with mean roughness values of 1,46, and 183 μm respectively [45]. Based on the ASHRAE standards [46], the velocity of air in a room depends on the various factors such as the floor area, height of the ceiling, cooling or heating purposes, number of occupants, and types of the buildings. However, regardless of the mentioned factors, generally, the goal is to keep the indoors air velocity below 0.25 ms-1 for cooling and less than 0.15 ms-1 for heating. Moreover, the duct design standards of ASHRAE, holds the limitation of 12.6 ms-1 of the maximum airflow through the ducts with different shapes [47]. A study by Gong et al. suggests that the acceptable air velocity range for local air movement, is between 0.3 and 0.9 ms-1 [48]. In this study, five different velocities including 0.1, 0.5, 1, 5, and 10 ms-1 were considered in order to cover the overall range of indoor airflows from regular applications to the very unlikely extreme cases. The indoor air flows have random directions, and the stagnant areas are also common; therefore, the exposure of the surfaces to the airflow varies with that regard. In this study, it was assumed a fan controlled the direction of the airflow with respect to the surface. In this regard, three conditions were considered: airflow parallel to a flat surface, perpendicular airflow toward a flat surface, and airflow over a circular cylinder.
Methodology
Airflow towards a Flat Plate
A condition can be considered, in which air flows toward a flat surface (e.g. fan blowing toward a screen, see Figure 1). If the direction of the airflow is perpendicular to the flat surface (Figure 1), the resulted momentum force on the surface is calculated from the following [49]:
Figure 1: Schematic of the momentum impact of the fluid flow perpendicular to the plate.
Where, FV (N) is the normal momentum impact on the area attacked by the fluid flow. The negative sign in Eq. 1 means that FV is in opposite direction to the incoming fluid jet. UA (ms-1) is the velocity of the air flow in x direction. ρ = 1.204 kgm-3, is the air density at T = 20°C, LA (m) is the thickness of the jet, and b (m) is the width of the plate in Z direction. Considering Eq. 1, FV is calculated based on the area of attack, LA×b. By assuming that LA =b = 1cm (the approximate area of the tip of a fingerprint), the calculated momentum impact with respect to the array of the applied velocities, U = {0.1, 0.5, 1, 5, 10} ms-1, was calculated. By modeling a Coronavirus as a sphere with diameter of D = 125 nm (Fehr and Perlman, 2015), the surface area of a virus is Therefore, viruses can be fitted in an area of the tip of a fingerprint (A=10-4 m2). By assuming that, the whole area covered by n number of viruses, the momentum impact on each virus was calculated by:
A viscous region with thickness of LB=LC forms along the flow in y direction in Figure 1.The analysis of the flow in those regions are similar to the boundary layer of a laminar flow parallel to the horizontal flat plate. If the airflow hits an inclined flat plate with the angle of β, the resultant momentum force is less or equal to the perpendicular air flow jet (β=0).
Airflow Parallel to the Flat Plate
Figure 2 shows the schematic of the flow over a flat plate. By assuming a one-dimensional flow (U>>V) over the plate, at room temperature as T = 20°C, and atmospheric pressure, the 2-D Naiver- Stokes equations for laminar, incompressible, steady state flow (Eq. 3) was solved with finite difference method.
Figure 2: A schematic of the parallel laminar airflow passes over a horizontal flat plate in macroscopic and microscopic scales (a model for a desk).
The nodal network considered as square with Δx=Δy=1μm. The boundary conditions were as in the following:
The assumption of non-slippery wall boundary condition was made based on the calculation of Knudsen number, Kn = λ/L, where λ is the mean free path of the gas (in current case, air at atmosphere pressure, λair = 68 nm) and L is the length-scale of the flow (in current case L=1cm). Based on theory [45], if Kn is significantly smaller than one (in current case, Kn =68×10-7), the wall can be considered nonslippery. The wall shear stress can be calculated with the Blasius exact solution for laminar boundary layer as the following:
The production of the surface area of a virus and the wall shear stress resulted from the airflow provides a good estimation of the amount of force applied to a single virus attached on a flat plate. Two assumptions were applied in this calculation (Eq. 5); first, the wall shear was calculated without considering the existence of a virus. Moreover, it was assumed the shear wall was applied 62.5 nm above of the flat surface at the equator of the sphere (see Figure 3).
Figure 3: Force acted on the virus attached on a flat surface.
The Effect of the Surface Roughness on the Force Applied on a Single Coronavirus
The mean roughness value is specifying and comparing the height difference between the peaks on an otherwise smooth surface or troughs of the same amplitude. The nanometer-scale viruses with unknown numbers can randomly occupy the entire peaks and valleys of a surface. On the other hand, the shape, height, and the number of micrometer-scale bumps and troughs are random on a rough surface (Figure 4). In order to investigate the effect of the roughness on vulnerability or resistance of an attached virus against the airflow, two models are considered. The models were considered based on Dejaguin method [50], which has been widely practiced for particle resuspension studies [51,52].
a) Model 1: Ziskind showed that particles tend to occupy stable positions. Therefore, if the roughness of the surface is greater than the particle sizes, the particles mainly occupy the vacant areas between the peaks. Those picks which surrounded the particles were actually protect the particles from the applied external flow rates and decrease the resuspension rate of the particles significantly. We assumed that the viruses were accumulated in a sharp corner or valley and attached there (Figure 5). Based on the Falkner-Skan solution of the inviscid flow passing corners [45,53], the maximum velocity that a fluid can reach into a valley is umax=0.9999 uin. The velocity in the valley depends on θ as shown in Figure 5; however, regardless of the shape of the valley, it cannot reach a value higher than umax. This means the viruses will be protected against the airflow inside the valley and will be less vulnerable to the airflow in comparison to the situation in which the virus are attached on the plane plate. Deeper in the valley, the re-circulating eddies form making the velocities even smaller in comparison with the velocity on the flat plate ().
b) Model 2: In this model, it is assumed that an isolated virus attached to a single peak next to a perfect plane plate under the influence of the air flow. The peaks and valleys of a rough surface work like obstacles and decrease the velocity of the flow passing through them. It can be concluded the most vulnerable condition for a virus against the attacking flow occurs when it is sitting at the top of a peak. (See Figure 6). The solutions of 2-D Naiver-Stokes equations with finite difference method, provide the value of the velocity vectors at each node with any desirable height. Moreover, by assuming the height of a peak (H) is equal to the mean roughness (Ra) value of a material, the amount of the drag force, which is applied on an isolated virus at the peak can be calculated by Stokes’ sphere-drag equation:
Figure 4: The random number of valleys and peaks with different heights and depths form a rough surface,
a) smooth surface of a glass sample
b) rough surface of a steel sample.
Figure 5: The schematic of the viruses attached in a shallow crevice.
Figure 6: The schematic of an assumption that a single virus attached at the peak of a rough surface just next to a perfect plane plate in order to guarantee the extreme possible vulnerability of a virus against an undisturbed airflow.
where U is the applied velocity, μ=1.825×10⁻⁵ Pa.s is the dynamic viscosity of air at T=20°,P=1 atm, and r=62.5 nm is the radius of a Coronavirus. The Stokes’ equation is valid if ; however, for the airflow over a Coronavirus the Knudsen number is . In this situation, a slip correction factor is needed to be considered to adjust the Stokes’ drag force [53,54]. By calculating the Cunningham slip correction factor (Cs) [54,55], the corrected drag force is equal to is as the following:
Where A1=1.257, A_2=0.4, and A3=0.55 are empirically determined constants [56,57] Cs is 2.53 and therefore, the calculated drag forces are needed to be divided by 2.53 to count for non-slippery condition; however, in order to increase the margin of safety and work with the higher values of applied forces on a modeled virus and roughness, the Cunningham correction is not considered in the current study.
Flow Over a Cylinder
Door handles are among the most touched surfaces in a room and their contamination with Coronaviruses are very likely. A typical door handle can be modeled as a circular cylinder with the diameter of 2.5 cm. It was assumed that the freestream wind velocity in x direction, U∞, is much greater than two other velocity components, V and W. The Reynolds number of the different air flows pass the cylinder with applied velocities of U∞ = {0.1, 0.5, 1, 5, 10} ms-1, at T = 20°C (ν = 1.516×10⁻⁵ m2s-1), are far less than the critical Reynolds number, ReD,C = 250,000, which guaranties the laminar flow regime around the cylinder. The Hiemenz’s polynomial velocity distribution [46] was considered for calculating the boundary layer with finite difference method.
Where, x^*=x⁄r is the dimensionless arc length and r is the radius of the cylinder. By considering x as the tangential and y as the vertical directions on the surface of the cylinder, a domain was defined like shown in Figure 5. The domain was considered for 2-D finite different solution of Naiver-Stokes equations on the cylinder. Based on Hiemenz model, the separation point takes place at ∅_ sep≈80.5°; therefore, the domain in x direction was considered as while and Δy=1 μm. Higher freestream velocities result in smaller thickness of boundary layers; therefore, the domain of 0 ≤ y ≤ 25 mm was considered for U∞=0.1,0.5 ms- 1,while 0 ≤ y ≤ 2.5 mm was taken for U∞=1,5 and 10 ms-1. The two-dimensional, steady, laminar, incompressible boundary layer equations at constant temperature and pressure are the same as Eq. 3-a and 3-b. The boundary conditions of the system were as the following:
Momentum Impact of the Airflow Perpendicular to a Plane and Rough Plate
The adhesion force (Fa) between a Coronavirus and a solid surface is estimated as 40 140 a N ≤ F ≤ p . The applied forces on a Coronavirus with respect to the jet velocities are shown in Table 1. Considering the values of the applied forces due to the perpendicular airflow jets, even for the extreme case of , is far less than . Therefore, it is very unlikely that such vertical airflowjets cause any movement or removal of a Coronavirus from a plane plate. Since the direction of the jet flow is perpendicular to the surface, the two roughness models in this study do not play a significant role. If model 1 is considered, the airflow should impact a virus in a sharp corner which is less vulnerable to the applied force at the plane plate. On the other hand, if model 2 is considered, the condition of a virus located just a few micrometers closer to the airflow jet makes no difference in compression with the condition of the attached virus on a plane plate.
Table 1: Momentum impact of the vertical airflow jet on the 1 cm2 of a plane plate and a sphere-modeled Corona virus with D=125 nm.
The Force Applied to an Isolated Virus Resulted from the Parallel Airflow to a Plane and Rough Plate
Considering the exact solution of Blasius for a laminar flow over a flat plate (Eq. 4), the wall shear stress leads to infinity at x=0. This means if a virus is attached to the edge of the plate x=0, it will be removed from the surface regardless of the free stream velocity of air. If a Coronavirus is attached at x=1 nm on a plane plate, then the wall shear for the highest velocity of airflow, U=10 ms-1, is W τ =1.56 kPa which leads into FD2=76.4 pN . This value indicates that the movement of a Coronavirus at x=1 nm is still possible with such an applied velocity. However, 3 nm further, at x=4 nm, the movement of virus becomes very unlikely since FD2 (x=4 nm) =38.2 pN for U=10 ms-1. It is also very important to consider the fact that experiencing velocities like U=5 or 10 ms-1, is extremely unlikely in a building and such velocities exist only inside the big air canals. Even for the extreme case of U=10 ms-1, only at the first 3 nm from the plates’ edge, an isolated virus is vulnerable to movement or removal from the surface. Figure 7 shows the magnitude of the force, D2 W s F =τ × A , applied on an isolated virus due to the wall shear at the first 100 nm of a plate from its edge for 2 free stream velocities of U=5 and 10 ms-1. The max value of FD2 for different applied freestream velocities at x=1 nm are shown in Table 2.
Figure 7: Magnitude of the forces applied on an isolated virus due to the shear stress on a plane plate in the first 100 nm from the edge of the plate.
Table 2: Force applied on an isolated virus located at x=1 nm from the edge of the plane plate due to shear stress.
Considering Figure 6, since the peak-height of the smoothest material, glass, with Ra=1 μm, stands outside of the boundary layer at x=0, the applied free stream velocity will hit the isolated virus at tip of the bump (see Figure 8a). The Stokes drag forces (Eq. 6), which applied on a virus due to the different applied free stream velocities are shown in Table 3. The force values in Table 3 show that even for the unreal extreme model 2 case (considering an isolated virus at the peak of a rough surface), at unlikely position of the edge of a plate (x=0), it is impossible for regular air velocities in a building to overcome the adhesion force (Fa) between a single Coronavirus and a solid surface. However, the results show that for extreme applied velocities with consideration of all extreme assumptions, it is possible for the airflow to move the virus from the edge of a flat surface. In this study, the highest peak of a rough surface is wood with Hwood=183 μm. The thickness of a boundary layer depends on the applied free stream velocity. Higher velocities result in boundaries with steeper edges and smaller thicknesses, δ. Therefore, in order to keep the peak of the rough surfaces inside the boundary layer, the peaks should be considered further far away from x=0 with respect to the applied free stream velocities. For U=10 ms-1, the first point at which the wood-peak will be located inside the boundary layer is at x=346 μm.
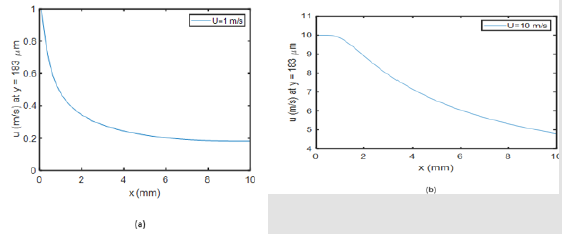
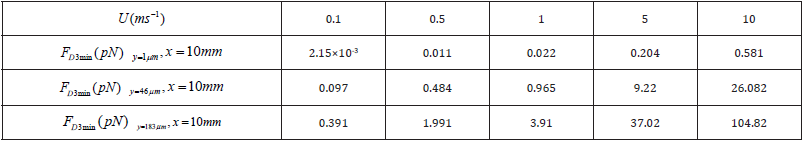
This is the furthest point among all applied velocities. Inside the boundary layer, the velocity of each node can result in a drag force applied on a single Coronavirus at the peak of a rough surface (see Figure 8b). The x-component velocities (u) versus x are depicted in Figure 9 at y=183 μm through the entire domain, 0 ≤ x ≤10 mm, for U=1 and 10 ms-1. The trends of the graphs for the other applied velocities are the same, but the (u) values are different. It is clear in Figure 10b that during the first 346 μm, the peak of a rough wooden surface stands outside the boundary layer u=U=10 ms-1. The average applied drag forces due to the x-component velocities at y=1,46 and 183 μm for all cases in the domain of 0 ≤ x ≤10 mm are summarized in Table 4. The possibility of the movement of an isolated virus from the peak of a modeled rough surface is relatively high for the free stream velocities of U=5 and 10ms-1 in 1 cm distance from the edge of the plate. However, it is very unlikely the other applied velocities cause the removal of the virus from the peak in that domain. The applied drag forces with respect to the free stream velocities in Model 2 of the roughness at x=10 mm, are summarized in Table 5. It is obvious that the movement of the virus is only possible for U=10ms-1 on the wooden-surface at x=10 mm. This means that within 1 cm distance from the edge of the plate, the displacement of an isolated virus is possible for freestream velocities equal or higher than U=10 ms-1, which exceeds the common indoors air velocities.
Figure 8: The condition of the peak of a rough surface with respect to the boundary layer.
a) at x =0, the green peak, all the peaks stand outside of the boundary layer.
b) The peaks (e.g. the orange one) of all three materials are inside the boundary layer at x ≥ 346 μm for all the applied free stream velocities.
Figure 9: Schematic of the laminar airflow passes the circular cylinder and the defined domain in order to study its boundary layer.
Figure 10: The velocity components in x direction at y=186 μm above the flat surface, representing the peak of a wooden rough surface, for two applied velocities
a) U=1 ms-1, and
b) U=10 ms-1
Table 3: The magnitude of force applied on an isolated virus attached at the peak of a rough surface at the edge of the plate (x=0 nm) outside the boundary layer.
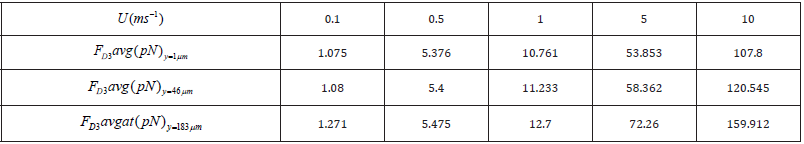
Table 4: The average applied drag force due to the x-component velocities at y=1, 46 and 183 μm for all applied free stream velocities in the domain of 0≤x≤10 mm.
Table 5: The applied drag force due to the x-component velocities at y=1,46 and 183 μm for all applied free stream velocities at x=10 mm.
The Force Applied to an Isolated Virus Resulted from Airflow Over Plane and Rough Circular Cylinder
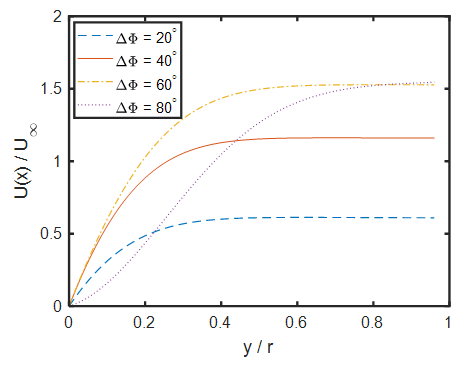
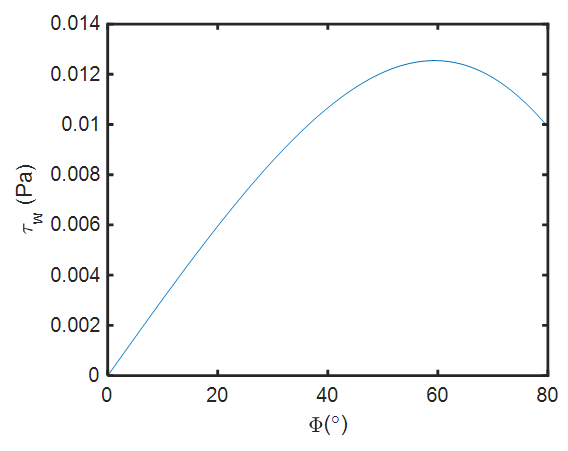
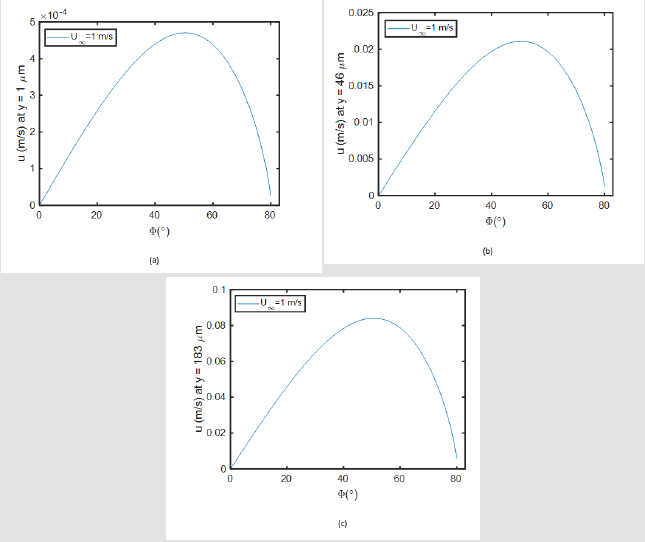
he Hiemenz velocity distribution model (Eq. 8) indicates that the maximum free stream velocity, U(x*), takes place at ∅=71.2° regardless of the applied U∞; however, the maximum wall shear stress forms between ∅=50°-60° for different applied U∞. Figure 11 shows how the boundary-layer profile forms along the curve from the stagnation point for every Δ∅=20° until it reaches its separation point at ∅sep=81°. The favorable gradient increases the wall shear stress up to ∅=60°. Figure 12 shows the shear wall profile of the U∞=1 ms-1 over the cylinder model. The trends of the shear wall profiles around the cylinder are as the same as Figure 12 for all five applied U∞, but the maximum values and their point of occurrences are different (Table 6). Even for the highest applied velocity U∞=10 ms-1, the drag force on an isolated Coronavirus is less than the adhesion force. Considering Figure 6, it would be necessary to figure out about the velocity profiles at y= 1,46 and 183 μm, which represent the peak of the glass, steel and wood surfaces inside the boundary layer around the cylinder (model 2). Having the velocity profile at each height, the max velocity will be considered in order to calculate the highest possible applied drag force on an isolated virus at the peak of a rough surface (FD3). Figure 13 Error! Reference source not found. shows the velocity profile of U∞=1 ms-1 at three desirable heights. The maximum velocity takes place around Φ=50°. The trends of the graphs for the other applied incident velocities (U∞) are the same with U∞=1 ms-1; however, the resulted velocities at each peak inside the boundary layer varies with respect to the applied incident velocities.
Figure 11: Velocity profile of the laminar flow pass a cylinder with free stream velocity of U∞=1 ms-1 based on Hiemenz model at four different arc ranges Δ∅ = 20°,40°,60°,80°.
Figure 12: Wall Shear profile on a cylinder exposed to the laminar external air flow with U∞=1 ms-1.
Figure 13: Velocity profiles in x direction at y= 1, 46, and 183 μm, representing the applied velocity at the peak of the three rough surfaces: glass, steel, wood consequently.
Table 6: The locations where the maximum wall shear stress takes place on the surface of a cylinder exposed to the laminar airflows with the various U∞ and its representative force with respect to the surface area of an isolated corona virus modelled as a sphere (AS).
Table 7 shows D3,max F values, it also indicates that only in the case of U∞=10ms-1, the maximum velocity at y=186 μm (wood model) within the boundary layer will result in a drag force of D3,max F =55.75 pN . Such a drag force may cause the removal of an isolated Coronavirus from the peak. Considering the extreme rareness of such an incident velocity in a room, it can be concluded that it is very unlikely that the regular airflows over the cylindrical shape objects (e.g. door handle) can cause the movement or removal of Coronaviruses from a surface.3.4 Verification of the obtained results. The mean roughness value of the surface in addition to the size of the particles specify the adhesion force between the particle and the surface and also determine the effect of external flow on the particles. However, it has shown in several research papers that when the size of particles are reduced from micro- to nano-scale, the topography of surfaces and the dimension of the particles play more important role in determination of required drag force for resuspension rather than the types and materials of the particles [58].
Table 7: Maximum possible drag forces, which resulted from the velocity profiles around the circular cylinder, applied at an isolated virus at the peak of three rough surfaces: glass, steel and wood.
Ziskind, Ibrahim et al, Jiang et al, Mukai et al., and Soltani and Ahmadi showed that for given flow and surface conditions the size of the particle plays the most important role in detachment [59-62]. Kim, and Corn and Stein showed that by decreasing the size of the particles the required drag force for resuspension of them increases significantly [63,64]. Therefore, due to the very small size of the SARS-CoV-2 viruses, it is justifiable to consider the experimental studies which conducted on the particles with the same sizes as the virus. Hubbe showed in his experimental studies that the required shear stress for detachment of TiO2 particles with diameter of 144 nm is about 200 Pa [65]. Considering the diameter of a Coronavirus, dp =125 nm, it can be concluded the applied shear must be greater than 200 Pa in order to detach the Coronavirus from the plane surface. Based on the analytical calculation provided in our study, the wall shear stresses resulted from the applied free stream velocities of U = 10 and 5 ms-1 can only reach over 200 Pa at the first 20 nm of the edge of the flat plate.
Such a conclusion can be made by only comparing the wall shear values and the obtained experimental results from other studies. In our studies, we concluded that the only first 4 nanometers from the edge of the flat plane can be regarded as a potential region for resuspension when U=10 ms-1 was applied [66]. showed in their experimental studies that the glass particles with the diameter of between 1-10 μm on hardwood and vinyl flooring were not detached by the applied freestream velocities less than 18 ms-1 [66]. Corn and Stein observed that the velocity up to 117 ms-1 was required for resuspension of glass particles with the diameter of 10.6 μm on smooth glass surfaces and Jiang et al. found that velocities greater than 50 ms-1 were necessary to resuspend 11 μm poly (methyl methacrylate) (PMMA) particles [67,68] gathered a wide range of experimental studies indicating that an average velocity of 25 ms-1 is required for resuspension of micro-scale particles from different surfaces [69]. Such experimental results support the provided conclusion in our study since for nano-scale size of a Coronavirus even greater applied velocities are required than the ranges suggested based on experiments in previous studies for micro-scale particles.
In addition to the technical fluid mechanics studies, the new experimental studies in real situations are in strong agreement with the conclusions of our model. For example, [70]. investigated the risk assessment of viral transmission of SARS-CoV-2 viruses from the contaminated surfaces due to the indoor airflows [70]. In their comprehensive study of Shanghai Public Health Clinical Center with 115 rooms, they concluded that the indoor airflow could not resuspend the SARS-CoV-2 viruses from various contaminated surfaces. They collected samples from floors, walls, washbasins, furniture, medical and personal protective equipment surfaces, as well as air samples, from airborne infectious isolation rooms. They also collected air samples from 15 rooms and areas close to the surfaces. They found no SARS-CoV-2 virus in the air close to the surfaces which all exposed to air supply from the air conditioning system in the rooms. Moreover, they collected surface samples from air exhaust and HEPEA filters and failed to detect any virus. Similarly, air samples collected in the corridor or the changing rooms of the semi-contaminated area did not show any presence of the virus. They finally concluded the risk of airborne transmission of SARS-CoV-2 in airborne infectious isolation rooms was low (1.62%) due to the directional airflows.
Many other studies have been conducted since the beginning of the pandemic, which do not directly verify the obtained results of our model; however, they show almost no evidence of the resuspension and spread of SARS-CoV-2 viruses due to the indoor airflows. For example, in a research study regarding the virus transmission in plane cabins, [71] concluded that in the regularly ventilated cabin, those who seated near the windows were subject to less infectious particles. [72] In their review and interpretation of [73]. investigation showed that despite the existence of the contaminated surfaces like windows, seats, laptops etc., the nearby passengers did not get infected by the viruses, while the direct air supply from the ceiling air inlets continuously reached those surfaces [74]. Some other studies like modeling study of the COVID-19 outbreak on the Diamond Princess cruise ship by Huang, et al. [75], or the epidemiological and modelling study of the COVID-19 transmission in train passengers by Hu et al. show no evidence of resuspension of the SARS-CoV-2 viruses due to the indoor airflows [76-80].
Conclusion
In this study, the effect of the indoor air circulation on the separation of a Coronavirus from surfaces was investigated. For this purpose, different configurations of the surface models with respect to the directions of airflows were considered. Regarding to the results, the following conclusions were made. In the case, where airflow applied perpendicularly on a flat plate, even for the highest applied velocity (10 ms-1), the separation of a Coronavirus is unlikely. The indoor parallel airflows to the flat surfaces have low potential to remove attached viruses in most of the conditions. In the case of the plane plates, at the edge of the plate, the applied shear is infinity due to the Blasius equation. At locations more than 4 nm away from the edge, even for the highest applied velocity (U=10 ms-1), the drag force applied on an isolated Coronavirus is less than the minimum adhesion force. In the case of the rough plates, at the edge of the plates, all of the modeled peaks are protruding out of the boundary layer. Therefore, the drag force was calculated on an isolated Coronavirus considering the freestream velocity. For three cases, where the free stream velocities were 0.1, 0.5 and 1 ms-1, the separation of a Coronavirus was unlikely. For two other cases, U=5 and 10 ms-1, the drag forces were 107.5 and 215 pN , respectively. Therefore, the viruses were vulnerable to removal. In the regions, a few micrometers away from the edge of the plate, where the peak of a rough model stood in the boundary layer, the applied drag forces were negligible for all the rough models except for U=5 and 10 ms-1. In the case of U= 10 ms-1 applied on the wooden-surface; the possibility of the virus movement was high since the minimum drag force in the domain of 1 cm from the edge was more than 100 pN .
For plane surface of a cylinder, the calculated drag forces were less than 1 pN for all applied velocities; therefore, the separation of an isolated Coronavirus was extremely unlikely. In the case of the airflow over the rough circular cylinders, most of the calculated drag forces were less than 40 pN, except for U= 10ms-1) applied on the wooden-rough model at ϕ=50°, which was 55.75 pN . Therefore, the separation of a Coronavirus from a rough cylindrical surface is very unlikely. Overall, it is very unlikely that typical indoor airflows could remove Coronavirus from different surfaces. The separation of viruses may take place at very high air velocities (e.g. 5 and 10 ms-1), at locations such as edges of flat plates or at specific angles with respect to the horizontal plane (ϕ=50°) on cylindrical surfaces.
Auxiliary Device for Full-Arch Digital Scans in Edentulous Jaws
Introduction
Digital impression is not a procedure in itself but represents the first step in a “new” way of conceiving the prosthetic procedure: the digital work-flow. Intra-oral scanning (IOS), Computer Aided Design (CAD) and Computer Aided Milling (CAM) make it possible to avoid the conventional procedures with a significant reduction in production times. Digital technologies are radically revolutionising the prosthetic approach in both clinical and laboratory aspects [1-6]. To date, in implant-supported dental prostheses, scientific literature has validated the use of IOSs for capturing optical impressions for the design and manufacture of short-span restorations such as single crowns (SCs) [7-10] and partial prostheses (PPs) [11-13]. However, in case of long-span restorations, in particular full arches (FAs), IOSs do not yet seem to be sufficiently accurate, as reported by several studies [14,15] and reviews of the literature [16,17]. Although some studies claim that optical systems provide sufficient accuracy in complete-arch impressions, scientific evidence on the intraoral scanning of complete-arches with teeth is lacking and outdated [17]. Elastomeric impressions of complete arches are significantly more accurate than those of optical arches [18] and the precision of intraoral scanners decreases as the distance between each scan body increases [19-21]. As the free scanning area increases, the intrinsic imprecision of the procedure increases, with progressive distortion of the impression and, consequently, a reduction in accuracy.
Edentulous arches, in particular the lower arch, represents still today a challenge for the optical impression: it is confirmed by the evaluation of full arch scans obtained with different scanning systems compared to data obtained with traditional impression. Taking impressions using elastomeric materials to capture dental implants position is still the most widely used technique and remains the gold standard. However, the elastomeric method requires procedural shortcomings and, in addition, the technique is uncomfortable either for the patient or for the clinician [6-8]. Nevertheless, a consensus regarding the implementation of IOS in complete-arch edentulous patients rehabilitated with multiple dental implants has not yet, been established [15].
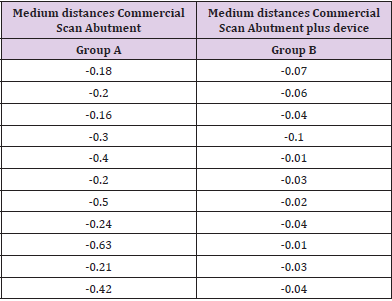
Obtaining reliable digital scans of arches where there are large homogeneous areas- between implants in edentulous arches- can be challenging, even impossible [20]. Difficulties are due to the absence of anatomic irregularities in the scanned area. In addition, Scan Bodies’ geometry can drive IOS to “interpretation errors”: scanners can recognize different Scan Bodies interpreting them as the same one [21]. Andriessen et al [21] reported that most digital scans of edentulous arches were unusable. The distance between implants also influences the accuracy of the digital scan so that longer the distance with a uniform surface is, more challenging the scanning process become [20,22]. These problems reflect IOS difficulties in matching multiple images captured during the scanning process [23]. Intraoral scanner’ software builds 3D images ‘by best-fit alignment’ of photographic frames collected by camera. The acquisition of larger areas is more challenging and software algorithm processes become more complex [23]. However, despite area’s extention, in edentulous patient, lack of differences in curvature radius leads additional difficulties. Geometric and colour differences (according to the technology used) detected by the scanner will simplify the matching process. The lack of these features in edentulous oral cavity means that digital scanning of edentulous arches is a very difficult tasks in these patients (Table 1).
Table 1: Medium distances group A and B.
To solve the problem related to intraoral scan of edentulous arches, several authors suggest several methods with the aim of create artificial anatomical references to compensate the distance between Scan Abutments; in this way, the intraoral acquisition is easier and more accurate. Some authors used auxiliary removable devices interconnecting the scanbodies (with guides, polymer bases obtained through the use of a 3D printer) [24-26]. Methods proposed in literature partially solved the problem but usually require very sophisticated procedures that often are not recommended to the traditional physical impression. To date, therefore, despite advanced technologies, in critical clinical conditions intraoral scanning can lead to non-faithful and inaccurate models.
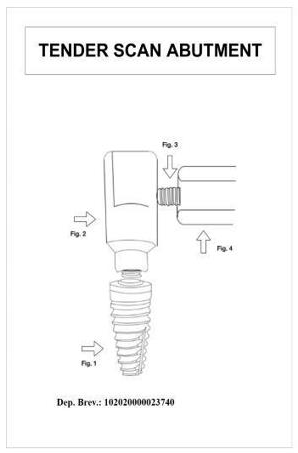
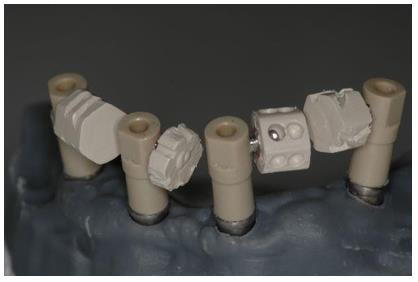
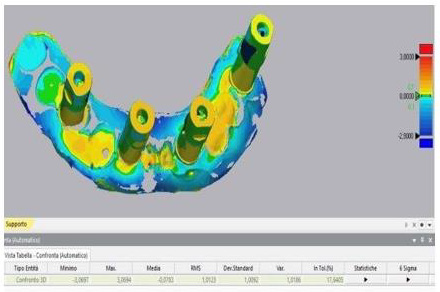
The aim of the study is to show a new concept to improve accuracy of intraoral acquisition in all those critical cases in which the distance between consecutive Scan Abutments affects the trueness of intraoral scans. The procedure outlined in the study has the peculiar property of not requiring complex and laborious steps. The auxiliary device is made of technopolymer material (Polyether ether ketone-PEEK) and it consists in an hexagonal body connected to a settable screw. (Figure 1) The device is designed to be screwed onto a previously drilled Scan Abutment and it does not rest directly on soft tissue so oral mucosa is not covered during the intraoral scan. The chance to successfully acquire oral mucosa with devices assembled on scan bodies avoids the need to acquire two separate impressions, with and without the auxiliary deviceresulting in discomfort for the patient and in extended clinical time.
Figure 1: Design of the device.
Materials and Methods
Stereophotogrammetry technology (PIC Camera; PIC DENTAL), thanks to extraoral scanner, allows to gauge the inaccuracy associated with intraoral scanning of an edentulous arches. Gold standard STL file is acquired by indirect method by taking a physical impression, developing the cast, placing PIC Abutments on the laboratory analogues and scanning it with an extraoral scanner. Then, the gold standard is compared to STL file obtained by the direct intraoral scanning of the same arch. The ethics committee examined the research project and gave its approval to the study (ethics committee “Università Federico II” protocol no. 128/21). Patients provided written informed consent to the treatments and to the publication of the study. Written informed consent was obtained from patients for the publication of any potentially identifiable images or data included in this article.
For each of the 11 subject involved in the study three different impressions were carried out. The physical impression was performed according to “open tray splinted” impression technique using polyether material (3M Impregum Penta Soft) mixed thanks to dedicated equipment (Pentamix type). Analog transfers were pooled with self-curing resin and interdental floss. Each impression thus obtained was made into plaster cast using class 4 gypsum mixed by a vacuum- pressure casting machine. Specific targets (PIC Abutments) were placed on each transfert; then, the model was scanned using an extraoral scanner (X5 Dentsply Sirona). EOS provides an STL file where abutments are truthfully setted and we can use it as control (gold standard). Intraoral scanner (Omnicam Dentsply Sirona) is used to record two different digital impressions: the first impression is normally acquired with the only scan abutments seated (Group A) while the second impression involves the experimental device assembled as part of the “scan structure” (Group B). All digital impressions were performed by the same practitioner and all of them have been obtained according to manufacturer’s scanning protocol, starting from the distal area on one side reaching the opposite side through the occlusal area. Using a specific software (Geomagic Control X 2020) we proceed to the alignment and subsequent one-to- one comparison of the STL files obtained from IOS with the STL file obtained from EOS (Gold standard). (Figures 2 & 3) The primary measurement refers to the mean distance (average of the points dismatching between the two STL files) obtained through Geomagic 3D software. P values under 0.05 are expected to be statistically significant. Data provided by the software, expressing mean and standard deviation values either the lowest or highest distances, were summarized using standard descriptive statistic.
The null hypothesis imposes no statistically significant difference between the mean distances Group B- Gold standard and Group A-Gold standard. The comparison between the two different approaches (IOS with and without auxiliary device) is carried out by Student’s t-tests for paired samples. In the current study, the alternative hypothesis does not state direction of deviation therefore “two-tailed” test is adopted. The two-tailed test is a nondirectional hypothesis test, described as a test in which the critical region falls on both sides of the normal distribution. Thus, an alternative hypothesis is accepted in place of the null hypothesis if the calculated value falls in one of the two tails of the probability distribution (Figure 4).
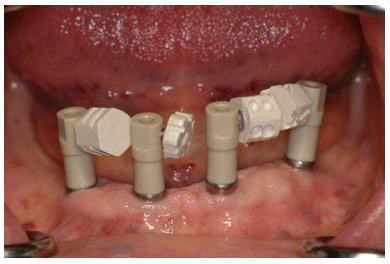
Figure 2: Scan Abutment plus device in peek on the model.
Figure 3: Device in peek in the oral cavity.
Figure 4: Comparison between stl control and stl with Commercial Scan Abutment.
Results
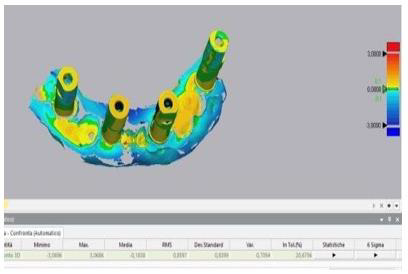
The two-tailed t-test for paired samples is used to test the null hypothesis that the average distances of the points made using the Scan Abutments according to the standard protocol (group A) are not significantly higher than those obtained using Scan Abutments with the experimental device (Group B). Assuming a difference of 0.1 mm between the two approaches (Group A and Group B) as clinically relevant and a standard deviation of the differences equal to 0.09 (value obtained through the evaluation of preliminary data), a sample size of 11 scans for each protocol will be enough to highlight any difference with a power of 0.9 and a two-tailed significance level of 0.05. Statistical analysis performed by using Spss software showed statistically significant differences (P <.05). Based on the results, the null hypothesis was rejected: group B values, significantly closer to zero, reflect a higher degree in their overlap with the control file. The “color maps” are used to qualitatively compare and evaluate the results: closer is the number to zero, smaller the difference between the two files is. The colors from blue to red indicate in a qualitative way the dimension of the mismatching between the file (A or B) and the gold standard control (Figures 5 & 6).
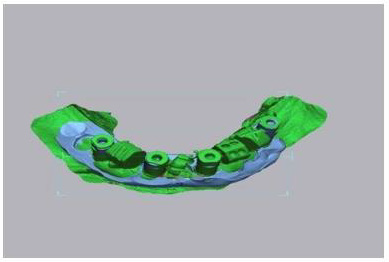
Figure 5: Alignment between stl control and stl with Commercial Scan Abutment plus device.
Figure 6: Comparison between stl control and stl commercial Scan Abutment plus device.
Discussion
Evidence suggests that intraoral scanning accuracy varies greatly with interimplant distance, intraoral scanner type, scan body type and operator experience. Several clinical factors can contribute to the global deviations in complete-arch intraoral scanning: the present study shows how the absence of anatomical references in edentulous arches has a negative influence on the accuracy of digital dental scans and how artifical anatomical references can be used to obtain easier and more accurate digital impressions. Limitations of the present study include the small sample size and the use of a single type of intraoral scanner. Comparison of the scans obtained with other intraoral scanners available on the market, still with the help of the device, will be reason for further research.
Conclusion
Based on the results, the null hypothesis was rejected. Full-arch digital implant impression, taken using intraoral scanners, was found to be less accurate than the same impressions recorded by the support of the experimental removable device. The present study shows how the absence of anatomical references in edentulous arches has a negative influence on the accuracy of digital dental scans and how artifical anatomical references intraoral make the acquisition in critical cases easier and more accurate.
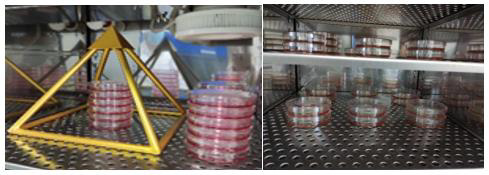
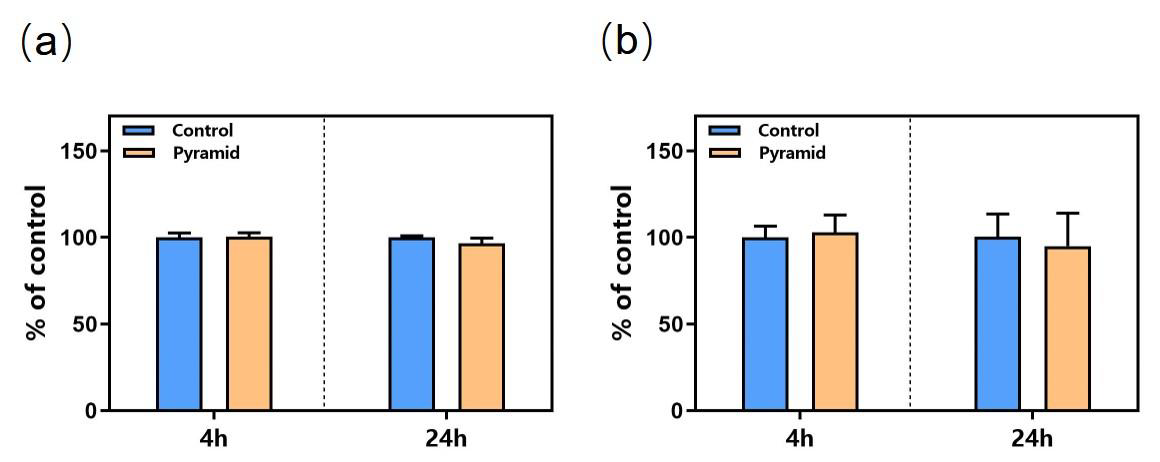
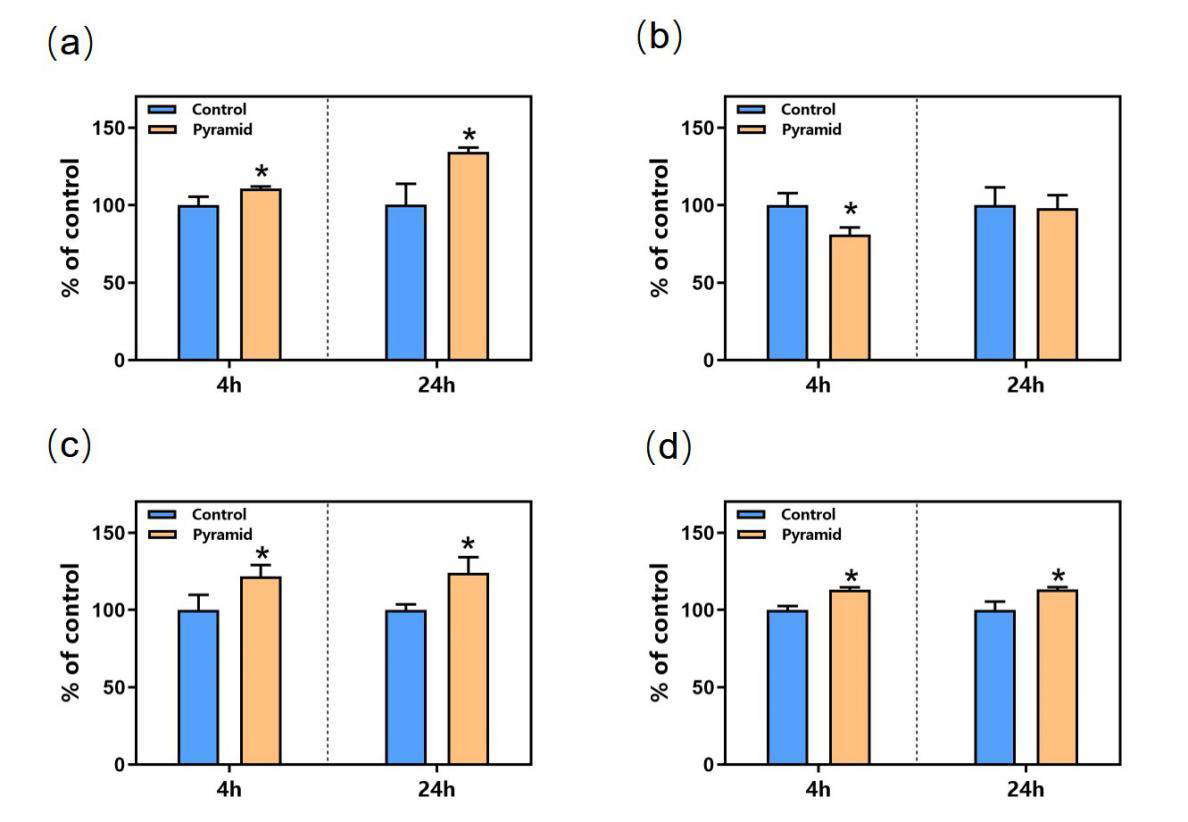
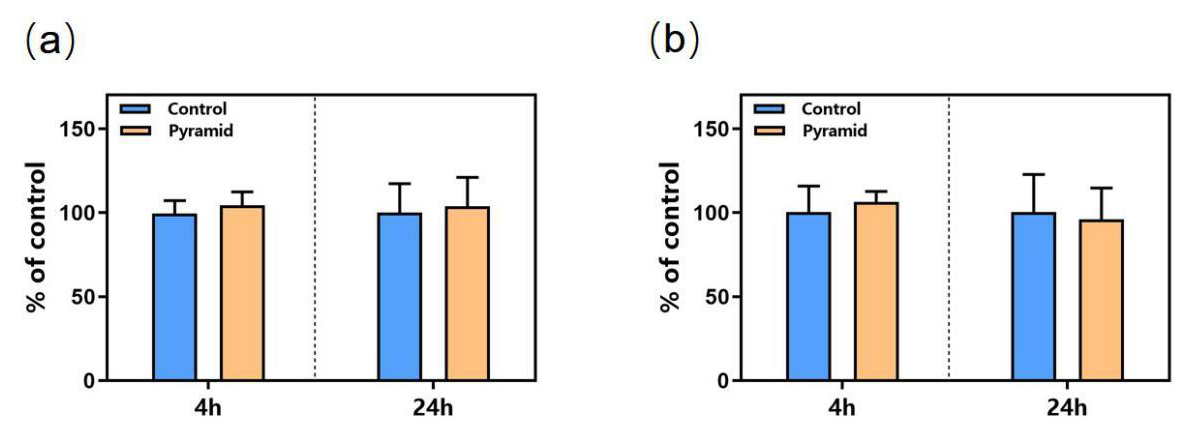
Numerous biological effects of pyramid structure (PS) have been reported in recent years. For example, Indian scholars found that the seed germination rate and radicle length of plants under the PS were significantly higher than those of the control group [1-3], and other reported effects included accelerated would healing of mice, improved preservation time of food [4-7], and reduction in the occurrence of tumor in mice accompanied by the improvement in liver enzyme activity along with some other biochemical and physiological indicators, which could explain the retardation of the tumor cell growth [8].Despite the accumulating amount of evidence of biological effects reported, there is very little research investigating the underlying biological mechanisms for the observed phenomena. The PS has been proposed to generate a torsion field [9], which has been extensively studied for its biosocial effects. As a portal to receive, process and integrate information in cells, mitochondria play a critical role when cells were exposed to stimuli including external Qi from a Qigong master [10], Chinese texts with different meaning [11], and torsion field [12]. Our group has previously found that the exposure of cultured mammalian cells to the above stimuli can induce changes in numerous parameters related to the mitochondrial functions, such as the production of ATP, ROS, MMP and mtDNAcn, as well as the cellular oxidant capacity reflected by the reduced GSH.In this study, we used 293T cells to examine any potential responses in the mitochondria for cells grown under PS, with the goal of examining potential underlying biochemical mechanisms of the effects generated by a pyramid. We examined parameters including the growth and vitality of the cells, mitochondrial functions including the production ATP, ROS, MMP, the cellular oxidant capacity reflected by the reduced GSH, as well as cell senescence related parameter such as the telomere length.
Materials and Methods
Cell Culture
The 293T cells was obtained from National Infrastructure of Cell Line Resource (Beijing, China, http://www.cellresource.cn) as visceral cells which grow rapidly. The culture conditions and inoculation process of these cells can refer to our previous articles [12].
Pyramid Structure Model
Figure 1: The copper pyramid model.
The pyramid model used in the study is made of copper (some studies believe that the effect of copper is more obvious than other materials [3]) according to the true proportion and angle of ancient Egyptian pyramids. The copper pyramid model with a square of length 280 mm and height 280 mm (Figure 1).
Experimental Design
Two groups of 293T cells culture were used, including a treatment group (cultured in the pyramid model and named as ‘PS’), and a control group, named CK (away from the pyramid model). 293T cells were seeded at a density of 5~6×10⁵ cells/plate into a 10cm plate, and after a 3h attachment period, plates of the ‘PS’ group were placed in the pyramid model for 24h treatment. The plates for the ‘CK’ group were placed under normal growth conditions in another room about 50 meters away. The cells were collected and subjected to different assays at 4h and 24h respectively during incubation. All experiments were performed in triplicate (Figure 2).
Figure 2: PS: pyramid structure treatment group; CK: control group.
Biochemical Analysis
In the experiment, the detection methods of various biochemical indexes of 293T cells, such as ATP, ROS, MMP, protein, cell viability, SOD and GSH, were unified in our research group [12].
Gene Expression Analysis
Because of using the same research vector (293T cells), the parameters of gene expression analysis such as transcriptome sequencing and mitochondrial DNA quantification can refer to the previous work [12].
Statistical Analysis
Values of different measurements were normalized to a respective mean control value from untreated samples and expressed as percent control. All data are expressed as mean ± standard deviation (SD). They were analyzed by analysis of variance (ANOVA) and Least Significant Difference (LSD) using GraphPad InStat software, where P <0.05 was considered statistically significant.
Results
Effects of Pyramid Structure on Cell Growth
Compared to the control cells, PS did not affect the cell growth and cell viability at 4 hours post treatment and 24 hours (Figure 3), indicating that PS treatment for short period did not affect cell growth evidently (Figure 3).
Figure 3: Effects of PS on 293T cells growth. (a) Cell Amount; (b) Cell Viability.
Effects of Pyramid Structure on Mitochondrion
However, the mitochondria were significantly affected by PS as shown in Figure 4. The ATP level of cells in the PS group was upregulated by 20% and 35% at 4h and 24h respectively (Figure 4a) compared to that of the control group. The cellular ROS level was significantly decreased by pyramid at 4h but was not affected at 24h (Figure 4b). MMP level was both upregulated significantly at 4h and 24h (Figure 4c). The activity of GSH, an antioxidant protein, was increased by pyramid at 4h and 24h (Figure 4d), showing a potential role of antioxidant of PS.
Figure 4: Effects of PS on mitochondrion. (a) ATP level; (b) ROS level; (c) MMP level; (d) GSH level. *, P<0.05. *Significantly different from the control group.
Effects of Pyramid Structure on mtDNAcn and Telomere Length
Cellular mtDNAcn and telomere length were detected using the qRT-PCR technology and no obvious changes was observed at 4h and 24h in the cells of pyramid group according to the results (Figure 5). All in all, PS modulated the function of mitochondrion in cells and may protect the cells from oxidative damage by upregulating the level of anti-oxidative protein and downregulating ROS level.
Figure 5: Effects of PS on mtDNAcn and telomere length. (a) mtDNAcn; (b) Telomere length.
Discussion
In this study, we found that the activity of mitochondria in 293T cells became more active under the influence of PS, and the levels of MMP and ATP were significantly up regulated. At the same time, the overall antioxidant capacity of cells was improved. The PS significantly increased the content of GSH and reduced the level of ROS. No significant changes in cell growth and telomere length were observed in the study, indicating that the PS has a mild effect on cells, which avoids the negative effects caused by strong stimulation. Studies have found that the liver enzyme activity of mice in PS shaped feeding cages is significantly increased [8]. The plasma cortisol content of adult female rats exposed to long-term PS changed significantly, and the antioxidant defense ability of erythrocytes was improved [13,14]. In addition, some researchers found that the PS can accelerate the healing of mouse wounds [4,6], which indicates that the cellular activity of mouse wounds is stimulated, which is very similar to our results. As the “power plant” of cells, mitochondria provide energy for cells, and as a bridge for energy transformation inside and outside cells, they can respond to external stimuli in time. The influence of PS is considered as a torsion field [9], which collects the surrounding fine energy through the spatial layout of the structure itself, and then through the induction of mitochondria in the cell, so as to improve the activity and antioxidant capacity of the cell.
Previous studies mainly focused on the effect of PS on biological system, but there were few studies on the effect at the cell level. In this study, we used biochemical and molecular biological methods to determine that the PS has an obvious promoting effect on cell antioxidant and mitochondrial activity, which is helpful to further study the mechanism of PS effect. The healing effect of this special spatial structure also provides a new way for noninvasive treatment.
… And What About those who Disagree with the Measures Against the Pandemic?
In recent months a lively debate is taking place on the effectiveness of the various measures taken by national governments to contain the pandemic. Many have raised questions on the possible side effects of the use of masks in public places, especially in schools, of the side effects of vaccination, and so on. Groups of our fellow citizens are protesting about the extended use of masks and the compulsory nature of vaccination, for example, voicing their opinions in numerous ways. Others are going a step further, urging people towards adopting a stance akin to a (supposed) type of civil disobedience [1]. This category includes some parents who, especially on social networking sites, urge other parents not to send their children to school wearing a mask, vaccinated or having conducted a rapid test. The legitimate question that arises is whether the relevant dialogue and action are subject to certain constitutional limits. One of the fundamental pillars of democracy is that relating to freedom of opinion. Freedom of opinion is intertwined with the right to criticize government action. This criticism can go as far as the ordinary citizen questioning government policy measures. When pandemic issues are raised by journalists in the press, however, it is crucial to ensure the accuracy of the information and to limit fake news. Everyone is free to express his or her opinion, but one must also draw a clear distinction between value judgments and facts. The creation of a climate of misinformation and panic by the media is not in keeping with the social mission of the media, and is likely to cause further problems both for the individual and for society as a whole.
This is even more so the case at this time of extreme difficulty for the population as a whole, when citizens, in a state of restraint and amidst widespread and entirely justified fear of the virus spreading, are regularly informed of developments. Nevertheless, in addition to expressing opinions, many are also taking action inciting civil disobedience. This phenomenon is not unknown: it is an expression of the timeless conflict between natural and statute law. It goes back to antiquity, when Prometheus violated Zeus’ command not to reveal the use of fire to humans. Indeed, Sophocles’s Antigone is the most brilliant example of civil disobedience, as she refuses to comply with King Creon’s order not to bury her brother, Polynices, putting forward her obligation to obey what she considers to be a superior legal system. On the other hand, in Plato’s Crito, Socrates emerges as the father of ‘civil obedience’, as he offers us a prime example of obedience to an unjust, but lawful, sentence [2]. Thoreau is considered by most to be the father of civil disobedience, being the person who introduced the term itself. Back in the mid-19th century he refused to pay taxes and was imprisoned, not because he opposed taxation in general, but because he opposed the US government’s war against Mexico, slavery and the violation of Indian rights [3]. The real father of civil disobedience, however, is John Locke, who pointed out that the existence of arbitrary authority is a prerequisite for disobedience. In this context, he recognized from 1688 the right of Greek Christians to throw off the Turkish yoke imposed on them by force [4].
In this light, the question arises as to whether one has the right not to wear a mask, not to be vaccinated and also to encourage other people to do so, too. Kant could provide us with the answer: according to him, the legal order in a democratic society is a value in itself. “There can be no justified resistance on the part of the people against the legislative authority of the state. A state governed by the rule of law is only strong when there exists universal subordination to its legislative will […]. The reason why it is the duty of people to tolerate even what is apparently the most intolerable misuse of supreme power is that it is impossible even to conceive of their resistance to the supreme legislation as being anything other than unlawful and liable to nullify the entire legal constitution”.”[5]. It is clearly contradictory, according to Kant, for a legal order to provide the ability to resist its mandates, as this essentially self-negates its supreme authority. This reasoning is only founded when the legal order in question has democratic legitimacy [6]. In a tyrannical regime, where citizens are excluded from the legislative process, there is no issue of obligation of obedience to a heteronomous legal order, and each individual has a right to resist, as well as a right to revolt against it [6]. In a democratic regime, on the other hand, one may express discontent and voice views openly, but has no right not to obey, particularly when the law concerns a fundamental right pertaining to public health. In actual fact, this is not at all an issue of conflict between natural and statute law.
Not complying with rules on hygiene is not related to natural laws. Mask and vaccine deniers are not in agreement with a certain legislative provision, which is based on research data. Let it not be lost on us that, by the same token, they could disagree with the use of masks by doctors in the operating room, the use of gloves by bakers during a pandemic, the use of protective equipment for visitor admission to an intensive care unit, and so on. Such deniers do not argue that wearing a mask and vaccination constitute discrimination against lower social strata – they are essentially projecting a disagreement they have vis-à-vis a particular scientific finding. In the case at hand, and to begin with, scientists ought to make a convincing case to people, based on substantiated arguments. Nevertheless, if a person decides not to wear a mask and does not get vaccinated, without having a medical reason for doing so, then it is wholly reasonable that he or she should be the recipient of the lawful ramifications of the prohibition of entry to the specified area. Therefore, a pupil will be justly denied entry to a classroom, as will a customer to an indoor cinema theatre, a citizen to a public service, to a shop and, even more to the point, to a hospital. Indeed, this is the case as the person in question is unable to support this based on scientific disagreement. Furthermore, if a person is inciting the public to collective disobedience against the use of masks and vaccination, it would be reasonable that he or she should face relevant legal consequences. At this point, it should not be overlooked that any battle of arguments does not place in a vacuum but in the context of a reality which, if ignored, may lead us to very unpleasant surprises [7]. The defiant violation of the use of masks and vaccination is not, at the end of the day, an act of civil disobedience, but rather a manifestation of anti-social autonomy [8].
For the above to become more intelligible, the following conclusions may be drawn: a) The position “I consider the use of the mask and the enforcement of vaccination in public places problematic: people will not comply and, therefore, this will create more problems” is a constitutionally permissible expression of opinion. b) The position “I find the use of masks and the imposition of vaccination to be unconstitutional measures” is also a constitutionally permissible expression of opinion. c) The position of “Don’t wear a mask and don’t get vaccinated” constitutes incitement to disobedience against a specific provision of the law which – especially in the period of the pandemic – goes beyond the permissible limits of freedom of speech. d) The non-use of masks and the refusal to get vaccinated during a pandemic, where this is required by law, does not constitute civil disobedience in the sense of what has been set out above: it represents illegal and, mainly, anti-social behavior.
Novel Use of GnRH agonist as Neoadjuvant Treatment for Giant Endometrial Polyps
Introduction
Endometrial polyp is one of the most common structural causes of abnormal uterine bleeding in the reproductive age group. It arises from endometrial overgrowth brought about by a hyper-estrogenic state. Polyps are usually around 2cm in size, and those greater than 4cm are labeled as giant polyps. The cases presented are women in the reproductive age group with fertility problems, having endometrial polyps as large as 10cm occupying the whole uterine cavity, even prolapsing out of the endocervical canal. Conservative management was recommended but due to their size, immediate hysteroscopic removal may not be attainable due to expected difficulty in distending the uterine cavity and possible morbidities like fluid overload and uterine perforation. Although with limited studies, GnRH agonists have been proposed as a neoadjuvant treatment prior to hysteroscopic removal of giant polyps. Given the same mechanism applied with GnRH agonist’s use with myomas, it induces a hypoestrogenic environment at the same time decreasing the vascularity of the endometrial lining that will help significantly decrease the size of the giant polyps, making hysteroscopic removal feasible
Case Report
Case 1
This is a case of Abnormal Uterine Bleeding (AUB) in a 29-yearold, single, nulligravid from Laguna. The patient has unremarkable past medical and family history. She is living in with her 3-year partner and is desirous of pregnancy. Ever since menarche, patient has been experiencing heavy menstrual bleeding soaking 2-3 baby diapers per day, lasting 7-14 days, with no associated symptoms. She was hospitalized at the age of 16 for blood transfusion due to chronic blood loss brought about by heavy menstrual bleeding. Blood dyscrasia was ruled out. At the age of 20, she consulted a government hospital still for persistent heavy menstrual bleeding now associated with dyspareunia and post-coital vaginal bleeding. She was assessed with a cervical mass probably polyp and underwent fractional curettage and polypectomy, which on biopsy revealed polyp. Patient continue to have occasional heavy menstrual bleeding however few months prior to consult in our institution, she had continuous profuse vaginal bleeding, this time associated with an enlarging abdomino-pelvic mass. She was assessed with cervical cancer due to a finding of irregularly shaped cervical mass. A cervical punch biopsy was done which only revealed granulation tissue. She was then referred to our institution for further work up and management. When we first saw the patient, she was pale but with stable vital signs. Speculum examination revealed a polypoid fleshy mass occupying the upper half of the vaginal canal. On internal examination, patient had a polypoid fleshy mass measuring 8cm x 10cm x 10cm occupying the upper vaginal canal and the cervix was difficult to palpate. The corpus was enlarged to 18-20 weeks size. She was initially diagnosed as a case of to consider cervical cancer and was admitted for blood transfusion and work up. Cervical punch biopsy was repeated and it revealed necrotic and hemorrhagic polypoid lesion. Transvaginal ultrasound done noted an aggregate of polyps at the cervix that arise from the endometrial cavity with attachment at the fundus. Impression was endometrial mass, to consider endometrial pathology with extension to less than 50% of the myometrium, endocervical canal, and lower third of vagina (See Appendix 1, Figure 1). Current working diagnosis was changed to AUB secondary to endometrial mass probably endometrial polyp. Patient was referred to our section for possible hysteroscopic polypectomy. But due to the size of the mass and expected technical difficulty for hysteroscopic removal, we advised pre-treatment with Gonadotropin-Releasing Hormone (GnRH) agonist to be given for 3 to 6 doses every 28 days prior to surgery.
Apendix 1 Figure 1: Endometrial mass and prolapsing cervical mass arising from the endometrium prior to GnRH agonist.
After three doses of GnRH, repeat internal examination showed that the polypoid mass within the vaginal canal disintegrated and was easily removed from its attachment. Patient noted minimal vaginal bleeding with passage of meat like material, probably fragments of the polyp. The corpus size also decreased to 14 to 16 weeks size, from the initial 18-20 weeks size. Additional 3 doses of GnRH agonist were suggested to further decrease the size of the mass and make the hysteroscopy easier. After 6 doses of GnRH agonists with a corpus size of 10-12 weeks, the patient then underwent hysteroscopic polypectomy. Intraoperatively, the polypoid mass was soft and hemorrhagic, but was not friable and non-necrotic, with an aggregate diameter of 17 cm (See Appendix 1, Figures 2 & 3). Cut section revealed multiple cystic spaces all throughout the mass. Final biopsy report showed mixed endocervical-endometrial polyp. Three months post-surgery, there was no recurrence of heavy menstrual bleeding and repeat ultrasound revealed normal uterus with thin endometrium (See Appendix 1, Figure 4). Currently, the patient is already 1 year post op with no recurrence of the heavy menstrual bleeding and is currently for infertility management.
Apendix 1 Figure 2: Endometrial mass and prolapsing cervical mass arising from the endometrium prior to GnRH agonist.
Apendix 1 Figure 3: Endometrial mass and prolapsing cervical mass arising from the endometrium prior to GnRH agonist.
Apendix 1 Figure 4: Post operative ultrasound of patient 3 months after.
Case 2
This is another case of AUB in a 30-year-old, Gravida 2 Para 0 (0020), married, from Mindoro. She has no co-morbids and had 2 previous spontaneous abortions at 12 weeks AOG. She is currently living with her husband of 10 years and is desirous of a successful pregnancy. Four years prior to consult in our institution, patient experienced heavy menstrual bleeding for 7 days, soaking 3 baby diapers per day with blood clots. She was assessed with AUB secondary to thickened endometrium and was admitted for blood transfusion. After 2 years, patient again had recurrence of heavy menstrual bleeding, this time associated with abdominal enlargement. Ultrasound was done and showed myoma uteri. She was again transfused with blood products and advised hysterectomy but patient refused due to financial constraints and desire of future fertility. 3 months prior to consult in our institution, patient again experienced continuous vaginal bleeding and pain with pallor and fatigue. She was rushed again to the local hospital and on assessment, there was a polypoid mass occupying the vaginal canal and was sampled for biopsy. The histopathology result revealed atypical polypoid adenomyoma so the patient was referred to our institution. On our initial examination, the patient was pale but with stable vital signs. Pelvic examination revealed a hemorrhagic polypoid fleshy mass occupying the whole vaginal canal that easily bleeds in manipulation measuring 6cm x 6cm (See Appendix 2, Figure 1). The cervix was difficult to assess and the corpus was enlarged to 20-22 weeks size. Rectovaginal examination was unremarkable. Transvaginal ultrasound was done which showed an echogenic mass within the endometrial, endocervical and vaginal canal measuring 12.8 x 12.2 x 8.1 cm with multiple irregular cystic spaces, invading >50% of the posterior myometrium (See Appendix 2, Figure 2). The impression was endocervical and endometrial masses consider atypical polyp with >50% myometrial invasion. Repeat biopsy of the prolapsed endometrial mass was done which revealed endometrial polyp. Patient was also referred to our section for possible hysteroscopic polypectomy. But again, due to the size of the mass and expected technical difficulty for hysteroscopic removal, pre-treatment with GnRH agonist prior to surgery was advised. After 2 doses of GnRH, there was significant improvement of patient’s symptoms, but with minimal vaginal bleeding, and passage of meat-like materials. On internal examination, the prolapsing endometrial mass decreased to 2x2cm (See Appendix 2, Figure 3) and the corpus size decreased to 16-18 weeks from the initial 20-22 weeks size. Repeat ultrasound also noted a decrease in the size of the endometrial mass to 10.7 x 11.8 x 5.0 cm (See Appendix 2, Figure 4). After the 3rd dose of the GnRH, the patient will be re-assessed if additional GnRH is needed or if already amenable to hysteroscopic polypectomy.
Apendix 2 Figure 1: Speculum examination of the patient prior to GnRH agonist.
Apendix 2 Figure 2: Ultrasound of the endocervical and endometrial masses prior to GnRH agonist.
Apendix 2 Figure 3: Speculum examination of the patient after 2 doses of GnRH agonist.
Apendix 2 Figure 4: Repeat ultrasound of the patient after 2 doses of GnRH.
Case 3
The last case is a 36-year-old, nulligravid who came in due to abdominal enlargement and inter-menstrual bleeding. Patient has no comorbid but is unable to conceive for 9 years with her husband. 1 year prior to consult, she began to develop intermenstrual bleeding, soaking 3 pads per day lasting 1-2 days associated with abdominal enlargement. On pelvic examination, there is a 3x3cm polypoid mass protruding out the endocervical canal, which seems to be coming from the endometrial cavity and the corpus is enlarged to 18-20 weeks size. Ultrasound showed an endometrial mass measuring 11.0 x 8.2 x 3.2cm with irregular cystic spaces and seems to be contiguous with the endocervical mass (See Appendix 3, Figure 1). Endometrial biopsy was done to rule out malignancy, and the result was endometrial polyp, hyperplastic type. Management was again GnRH for 3 doses and reasses if amenable for hysteroscopy. After her 1st dose of GnRH, the size of the corpus significantly decreased to 14 to 16 weeks size. Patient also reported fragments passage of meat-like material with minimal vaginal bleeding. Repeat ultrasound was done and the size also significantly decreased to 7.5 x 6.5 x 6.1cm (See Appendix 3, Figure 2). Patient is still for completion of 2 more doses of GnRH prior to re-assessment.
Apendix 3 Figure 1: Ultrasound of the endocervical and endometrial masses prior to GnRH agonist.
Apendix 3 Figure 2: Repeat ultrasound of the patient after 1 dose of GnRH.
Discussion
Endometrial polyp is one of the most common structural causes of AUB among the reproductive age group. It could present as intermenstrual or heavy menstrual bleeding and the amount of bleeding is usually proportional to the size of the endometrial polyp: the larger the size, the more debilitating the symptoms. Aside from bleeding, it is also associated with infertility just as the cases presented. Endometrial polyps are formed from localized overgrowths of endometrial tissue composed of variable amount of glands, stroma, and blood vessels covered by epithelium. The stroma of a polyp is composed of fibroblast like spindle cells and large blood vessels with thick walls. Commonly, the size of a polyp is less than 2cm, however, polyps greater than 4 cm are called giant polyps, as shown in the cases above, whose sizes range from 10 to 12 cm. The development of endometrial polyps has been explained by a number of molecular mechanisms such as monoclonal endometrial hyperplasia, over-expression of endometrial aromatase and gene mutations [1]. It usually arises because of estrogen hypersensitivity in some areas of the endometrium, probably caused by hyperactivation of the beta or the alpha estrogen receptor during the first phase of the cycle. Furthermore, they do not shed with menstruation because the estrogen related inflammation block the apoptosis via bcl-2 gene expression. Giant polyps, on the other hand are known to occur due to unbalanced estrogen levels. This estrogen related polyp growth occurs due to angiogenic growth factors’ deregulation, produced under hormone control inside the polyp, within a short time and few cycles [2]. Histopathological examination must be performed on all resected polyps to rule out endometrial polyps (0.5%–3%) with malignant foci. Lasmar BP reported that endometrial polyps larger than 15 mm are associated with hyperplasia and Wang J et al. identified that polyps measuring more than 10 mm are associated with malignancy [3]. The 3 cases of giant polyps presented all underwent endometrial biopsy to rule out the possibility of malignancy prior to choosing conservative treatment, which was advocated since all 3 cases have issues with infertility. For the management of endometrial polyps, hysteroscopic resection is the preferred method [4]. However, in some instances like in giant polyps, immediate hysteroscopic removal may not be feasible. This could be due that giant polyps occupy the entire uterine cavity that distending the cavity during hysteroscopy for visualization of the polyp’s attachment may not be done. Aside from failed removal of the polyp, morbidities like fluid overload and uterine perforation can be encountered. Although there is limited evidence with the use of GnRH agonist in endometrial polyps, it’s use was suggested as it may significantly decrease the size of the polyps to make the hysteroscopic resection achievable. GnRH agonists has revolutionized the management of many conditions in gynecology based on the discovery that when administered in a non-pulsatile fashion, they down regulate pituitary GnRH receptors, and therefore decrease the production of FSH and LH. It has been widely used for submucus myomas to decrease its size and make its hysteroscopic removal manageable with less morbidity. It used as a neo-adjuvant therapy prior to hysteroscopy to decrease bulk of the myoma and induce a state of hypoestrogenism. Pretreatment with GnRH agonists improves the hemoglobin level, reduces blood loss during surgery, and reduces uterine and leiomyoma volumes in as much as 40-50%, with most of the reduction occurs in the first 12 weeks [5]. This is especially helpful in infertile patients because this prevents destruction of the surrounding endometrial tissue [6]. Given the same concept for myomas, GnRH can then be used as pre-treatment for giant polyps since they have characteristic cytogenetic rearrangements similar to uterine leiomyoma [2]. As said previously, polyps contain estrogen as well as progesterone receptors, and the concentrations of these receptors are significantly higher in the glandular epithelium of endometrial polyps than those in the normal endometrium [7]. Hormonal inhibition of the endometrium can induce mucosal thinning and decreased bleeding. The effect of GnRH agonist can extend up to 1 month from the last dose and this could be due to persistent hypoestrogenism and consequent inhibition of regeneration of viable endometrial cells [5]. In the cases presented, GnRH agonist has significantly decreased the size of giant polyps even after 1 dose. All of the patients have reported vaginal bleeding along with passage of meat-like materials, which were believed to be fragments of the polyp spontaneously sloughing off from its attachment due to devascularizing effect of the GnRH agonist. None of the cases developed anemia or needed blood transfusion despite the said vaginal bleeding. The 1st case even successfully underwent hysteroscopic polypectomy after 6 doses of GnRH with no morbidity encountered and no residuals after, given the initial size of her polyp. With this in mind, there is room for GnRH agonists in treating endometrial polyps, specifically the giant polyps, where immediate hysteroscopic removal may tend to be difficult or may lead to failure, more so, morbidity. The cases have shown the effect of GnRh agonists in significantly decreasing the size of the polyps probably by inducing a hypoestrogenic state and at the same time deceasing the vascularization of the polyps causing it to spontaneusly slough off from its base. This will facilitate complete hysteroscopic removal of the giant polyp at the same time decreasing chances of morbidity. Although further studies are needed to strengthen its use in endometrial polyps, this may open an area for more research work.
Conclusion
Endometrial polyps, specifically the giant polyps, can be an incapacitating cause of abnormal uterine bleeding, which are often associated with infertility. In such cases, conservative management in the form of hysteroscopic removal is encouraged. However, given the size of a giant polyp, there will be technical difficulty in doing its resection. Use of GnRH agonist as neoadjuvant treatment for giant polyps can be advised. Using the same concept of GnRH agonist in shrinking myomas, it can induce a hypoestrogenic state causing devascularization of the endometrial lining. This will help significantly decrease the size of polyp, allowing complete hysteroscopic removal. However, further research studies are still suggested to strengthen its neoadjuvant use with giant endometrial polyps.
Whole Exome Sequencing or Pan-Myeloid NGS Gene Panel to Assess Leukemic Evolution of Myelodysplastic Syndromes. Advantages and Disadvantages
Introduction
Myeloid Neoplasms (MN) encompass a group of clonal diseases clinically and biologically heterogeneous characterized by the dysregulation of hematopoiesis, as a consequence of Hematopoietic Stem Cells (HSC) excessive proliferation and abnormal myeloid linage cells differentiation. They comprise different hematological entities such as Acute Myeloid Leukemia (AML), Myelodysplastic Syndrome (MDS) and Myeloproliferative Neoplasm (MPN). As a result of the genetic heterogeneity of MN, recent studies have highlighted the im-portance of genomic testing (rather than individual gene testing) to comprehend the pathogenesis of MN [1,2]. Due to its wide scope Massive parallel Sequencing (also known as Next Generation Sequencing, NGS) is becoming the technique of choice for genomic characterization of clinical samples, being not just a crucial tool for the discovery of new gene mutations, but also as a regular technique used in molecular laboratories to improve patient diagnosis, prognosis and treatment based on identified tumor variants. Regarding the number of targeted genes, there are different types of NGS DNA sequencing. Those NGS strategies designed to interrogate a few genes frequently mutated in a given disease are the so-called NGS gene panels. Another NGS strategy is Whole Exome Sequencing (WES), exons are thought to encompass ~2.5% of the total human genome, and WES allows the identification of variations in the protein-coding regions of any gene, rather than only in a selected list of genes [3]. In this study we aim to determine the variant calling efficiency of both NGS techniques (WES and a custom NGS gene panel) in MN of different infiltration levels, addressing their advantages and disadvantages.
Materials and Methods
Sample Collection
We collected 24 samples corresponding to 8 patients with MDS that transformed to AML: 16 bone marrow (BM) and 8 T cells CD3+ sorted from peripheral blood.
Genomic DNA
QIAamp DNA Blood Mini Kit (Qiagen, Hilden, Germany), was used to extract genomic DNA from all samples. The extracted DNA was then quantified using Qubit dsDNA BR Assay Kit on a Qubit 3.0 Fluorometer (Life Technologies, Carlsbad, CA, USA), and the DNA quality was assessed by DNA genomic kit on a Tape Station 4100 (Agilent Technologies, Santa Clara, CA, USA). Patients’ personal information and samples included in this study were provided by the Biobank of the University of Navarra (UN) and were processed following standard operating procedures approved by the CEI (Comité de Ética de la Investigación) of UN. All patients provided informed written consent to use data from their medical records (age, gender, and diagnosis…) for research purposes, once patient’s data had been fully anonymized.
Pan Myeloid-Panel (PMP)
Library Preparation: Our custom NGS panel targets 48 genes [4]. NGS libraries were constructed following manufacturer’s instructions (SOPHiA GENETICS, Saint Sulpice, Switzerland). The quality of the final NGS libraries was assessed using DNA D1000 kit, and visualized on Agilent 4100 Tape Station (Agilent Technologies, Santa Clara, CA, USA), and then quantified using Qubit dsDNA HS Assay Kit in a Qubit 3.0 Fluorometer (Life Technologies, Carlsbad, CA, USA). According to the manufacturer’s instructions, 8 libraries were pooled at a final concentration of 10.5pM, and pair-end sequenced on a MiSeq (Illumina, San Diego, CA, USA) with 251 × 2 cycles using the Reagent Kit V3 600 cycles cartridge.
Variant Data Analysis: Sequencing raw data were obtained from the MiSeq instrument, and then uploaded onto SOPHiA GENETICS DDM platform (SOPHiA GENETICS, Saint Sulpice, Switzerland). This software performed read alignment, variant calling of Single Nucleotide Variants (SNV), insertions and deletions (indels), and also variant annotation. Two geneticists with expertise in hematological malignancies firstly filtered out variants that were intronic, intergenic, and synonyms, and then classified the remaining filtered-in variants according to the Spanish Group of Myelodysplastic Syndromes [5] and the American College of Medical Genetics and Genomics (ACMG) guidelines [6]. Moreover, the presence of the filtered-in variants was manually confirmed within the Integrative Genomics Viewer (IGV) software (Broad Institute) [7].
Variant Data Analysis: Sequencing raw data were obtained from the MiSeq instrument, and then uploaded onto SOPHiA GENETICS DDM platform (SOPHiA GENETICS, Saint Sulpice, Switzerland). This software performed read alignment, variant calling of Single Nucleotide Variants (SNV), insertions and deletions (indels), and also variant annotation. Two geneticists with expertise in hematological malignancies firstly filtered out variants that were intronic, intergenic, and synonyms, and then classified the remaining filtered-in variants according to the Spanish Group of Myelodysplastic Syndromes [5] and the American College of Medical Genetics and Genomics (ACMG) guidelines [6]. Moreover, the presence of the filtered-in variants was manually confirmed within the Integrative Genomics Viewer (IGV) software (Broad Institute) [7].
Whole Exome Sequencing (WES)
Library Preparation: Extracted DNA was sent to Macrogen Korea, where they carried out library preparation using Sure Select Human all exons V6+UTR (Agilent Technologies, Santa Clara, CA, USA), that is based on hybridization capture technology and counts on a total genomic footprint of 35.7 Mb. Tumor samples were pooled aiming for a higher depth (200X) than that desired for the constitutional samples (60X). Libraries were pair-end sequenced on a HiSeq 2500 (Il-lumina, San Diego, CA, USA) with 201 x2 cycles using the Reagent Kit V4 250 cycles cartridge, according to manufacturer’s instructions.
Variant Data Analysis: Whole Exome Sequencing raw data was directly obtained from the HiSeq 2500. To obtain bam files, alignment was performed using BWA Aligner, Samtools SORT performed sort, and duplicates were marked with PicardTools. To obtain the variant calling files, bam files analysis was performed using VarScan version 2.3.9, with strand bias filters and setting minimum read to 5. Annotation of the variants was performed with ANNOVAR software.
Results
Depth of Coverage
Depth of coverage is the average number of mapped reads at a given locus. Low coverage in a given genomic location would limit the ability to confidently call a variant present in such location, especially if the variant is present at low allele frequency, hence the importance of a good depth of coverage. The mean depth of coverage for each technique is shown in Figure 1: 4500X for PMP and 250X for WES; a mean coverage of 1000X allows detection of clones present at 0.1% VAF (cut-off value of 10 reads, assuming there is no strand-bias).
Figure 1: Variants read depth comparison between PMP and WES. The average of coverage was 4500x for PMP and 250x for WES. PMP=Pan-Myeloid Panel; WES= Whole Exome Sequencing.
Variant Analysis
We performed an analysis of all variant VAFs called by PMP and WES in the genes included in PMP design (Table 1 & Figure 2). The results showed that PMP called a total of 59 clinically relevant variants and WES called 211 variants, 44 of them in genes included in PMP panel design. On the one hand, after careful assessment of all variants by visualization with IGV, we noted that, out of the 15 variants not called by WES, 7 were characterized by presenting a VAF<5% with PMP; and additional 7 variants were not called because they were detected in T cells CD3+ at a VAF~50%, meaning that these 7 variants are of germline nature. In both types of scenarios, the 14 variants were filtered out by the bioinformatics pipeline. Of note, the 15th WES-missed variant in UPN5 was a 115bp insertion in TP53 p.Ala84Valfs*6 at a VAF of 75%, that was called by PMP but not by WES, because it was either not captured during library preparation, or it was not correctly aligned against the genome hg19. On the other hand, PMP test only missed 1 variant in GNAS p.Arg844Cys that was called by WES, because the gene was not included in panel design.
Figure 2: Correlation analysis of the Variant Allele Frequencies (VAFs) detected by the panel (PMP) and by WES. The VAF’s correlation was high for the variants detected by both techniques (R2= 0,925).
Table 1: Detailed description of variants called by PMP and WES in the 8 patients with MDS that progress to AML.
As genomic technologies continue to improve, NGS-based tests might become stand-alone in the short term. Therefore, since clinicians are ultimately responsible for communicating test results to patients, it is crucial for them to understand the differences and difficulties, in terms of the NGS technologies, test interpretation and clinical significance. In order to address the distinct advantages and disadvantages of the two technologies at study, we sequenced 24 samples (16 BM and 8 T cells CD3+) corresponding to 8 patients with MDS that transformed to AML. All 24 samples were tested by WES, and all 16 BM samples were tested by our custom panel PMP. Gene panels minimize the chance of secondary findings, due their targeted nature, but require periodic design revisions in order to be updated by incorporating new gene discoveries, while WES offers the advantage of a wider scope in terms of number of genes analyzed, enabling the identification of variants at loci not considered at point of ordering, and providing data for genes not yet associated with the disease at study [8]. UPN4 is a good example of this: only WES called the pathogenic variant GNAS p.Arg844Cys; GNAS is a gene related to MN, but it was not included in PMP design (it has been included in later versions of the panel). Besides, WES data offers the possibility of being analyzed only for the genes of interest at a given time point and, later on, being re-analyzed when new genes related to the pathology are discovered, and in that way yielding relevant genetic information not identified at the time of initial assessment.
Even though WES offers greater breadth of coverage, it comes with some compromise in read depth [9]. Therefore, variants with low VAF might scape to WES analysis. Indeed, our data showed that WES missed several variants with low VAF that had been called by PMP (1 in CMML, 3 in MDS and 5 in AML). This is especially important in those cases where PMP called small clones with pathogenic variants IDH1 p.Arg132His, FLT3 p.Asp835Tyr and NRAS p.Gly60Val at a VAF≤3% in the premalignant samples (UPN4, UPN5 and UPN7), because these findings directly affect MDS IPSS risk, preventing the patients to get a more suitable treatment and disease follow up. Therefore, if those cases had exclusively been assessed using WES, they would have missed the opportunity of benefitting from those available treatments. Besides, targeted panels usually are conceived together with a software that greatly facilitates data analysis, whereas WES presents the challenge of interpreting large volumes of data with a higher chance of identifying variants in genes of unknown significance to the disease at study [10]. Consequently, analysis of WES sequencing data usually needs the labor of an expert bioinformatician together with an expert geneticist. Also, WES comes with the requisite of sequencing germline tissue alongside the sequencing of the tumor sample, in order to discard polymorphisms; otherwise, the volume of data would be simply impossible to be interpreted even by the best experts in both fields. These requirements make WES more expensive and laborious than panels.
Our data showed 7 variants called by PMP that were not called by WES, precisely because they were present in T cells CD3+ at a VAF~50%, meaning that these 7 variants might be of germline nature. Interestingly, one was the well-known pathogenic JAK2 p.Val617Phe (UPN2). Indeed, the necessity of sequencing a nontumoral tissue in order to be able to discriminate the nature of the variants has been reported in several studies, due to its potential impact in genetic counselling [11-13]. NGS gene panels and WES are limited in their capacity to detect specific DNA abnormalities, such as CNVs, long indels, and variants in repetitive regions. Surprisingly, our results showed that WES missed a 115 bp insertion in TP53 p.Ala84Valfs*6 (UPN5) that was called by PMP at a VAF of 75%. Because it was not in the BAM file of the sample, the variant was not in the VCF, therefore the cause was either failure in exome capture during library preparation, or maybe the raw sequencing data was not correctly aligned against the genome hg19 [14]. Therefore, the use of additional sequencing techniques to improve the number of reads, are necessary to minimize false negative results due to the low coverage of certain genomic regions [15,16].
Conclusion
Although it was not the main goal of the study, our data highlight the importance of sequencing germline tissue, since distinguishing the nature of the variant has a direct impact in genetic counselling. It should be noted that inherited variants conferring predisposition to develop a neoplasm are becoming highly important in all cancers, including MN. Therefore, this issue also needs to be considered when analyzing WES data, since WES pipeline filters out all germline variants. Regarding WES vs NGS gene panels, we conclude that both techniques are clinically valuable: WES is advantageous for the discovery of new variants, and NGS gene panels are essential for the detection of emerging clones. Therefore, they complement each other, and together they provide a more accurate image of the clonal heterogeneity of the tumor.
Computer Navigated Reverse Total Shoulder Arthroplasty for a Chronic Glenohumeral Dislocation: A Case Report
Introduction
Chronic glenohumeral dislocation is a characteristic affection, considered an important cause of shoulder arthropathy [1]. Multiple factors can be involved in the establishment of this condition. Usually, patients refer a history of an initial injury as a combination of abduction and external rotation. Most of the times patients are elderly with concomitant pathologies, poor bone quality and rotator cuff tears [2]. In these cases, shoulder arthroplasty is usually necessary and reverse shoulder arthroplasty has yielded satisfactory outcomes in patients with cuff tear arthropathy and other degenerative changes of the shoulder joint. The concept of this implant theoretically allows a good stabilization, but sometimes excessive bone-loss and deformation of the glenoid produce a malposition of the implant [3,4]. In this case, in order to place the implant correctly, we opted for a computer-navigated treatment, because of the severe condition of the glenoid. However, literature is still poor about the use of computer-navigated systems in this kind of condition [5].
Case Report
In January 2021, during the third wave of the COVID-19 pandemic, a 78-year-old woman came to hospital “Poliambulanza” of Brescia because of long-lasting persistent pain and a complete right shoulder dysfunction, following an acute trauma. X-rays showed a glenohumeral anterior-inferior dislocation of the right, dominant, upper arm. Subsequently a TC exam was obtained to classify the glenoid’s erosion, resulting in an “E4” stage according to Favard’s classification (Figure 1). Moreover, TC showed a complete rotator cuff tear with associated Bankart’s and Hill-Sachs’ lesions. Concomitant pathologies included atrial fibrillation in anticoagulant therapy and hypertension. Pre-operative evaluation included DASH questionnaire (score: 107), ASES questionnaire (score: 22) and CONSTANT score (score: 31).A deltoid-pectoral approach was performed.
Exactech’s navigation system (ExactechGPS®) assisted the surgeon for the placement of the baseplate Equinoxe RS posterior augment 8°. An Equinoxe RS 38mm glenosphere and a Equinoxe humeral stem press-fit 11mm completed the implant (Figure 2). Post-operative follow-up after two months highlighted a satisfactory range of motion, with active elevation and abduction of 70 degree without pain. Intrarotation and extrarotation still resulted limited to few degrees.
Figure 1: Pre-operative RX and TC.
Figure 2: Pre-operative RX.
Discussion
Reverse shoulder arthroplasty has gradually gained several indications in the last decades, including chronic GH dislocations [6]. However, few studies described long-term follow-up and they are all represented by small case series. Even less studies described the use of computer-navigated systems in this specific condition and how it can help the surgeon, especially considering severely deformed glenoids, where a correct placement of the baseplate turns out to be difficult [7,8]. Since the COVID-19 pandemic made it difficult for the patients to access to healthcare, some of these particular chronic conditions could be more prevalent in the near future [9]. More studies are needed to assess the best way of treatment for this particular condition and the benefits of the computer-navigated systems in severely deformed joints.In the end, ExactechGPS® allowed us to implant the inverse prosthesis in the best bone stock considering the anterior bone loss of the glenoid.The system made it possible to study through a CT image with support and accurate planning with dedicated engineers to implant the baseplate in the best possible position, as programmed with the prepared planning.


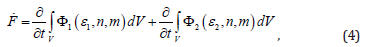
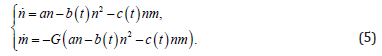
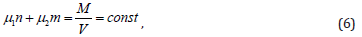

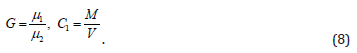
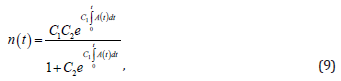

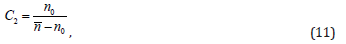

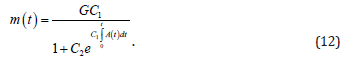
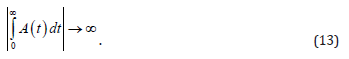
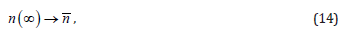


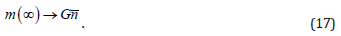
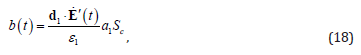
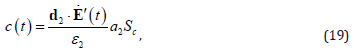

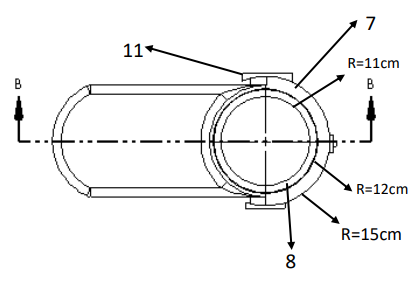
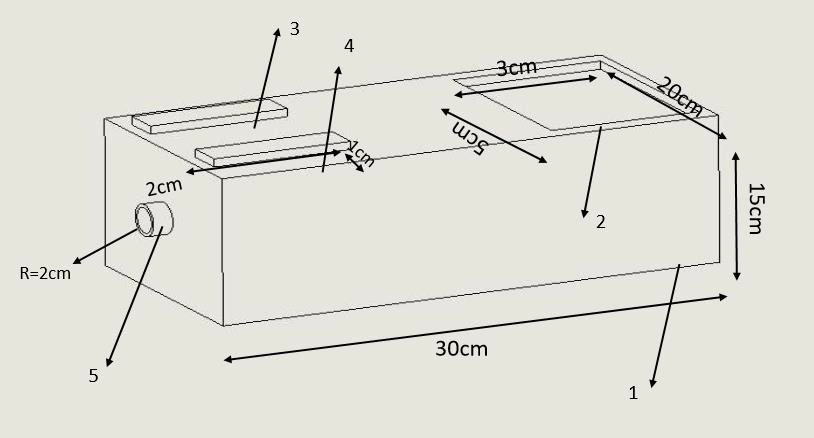
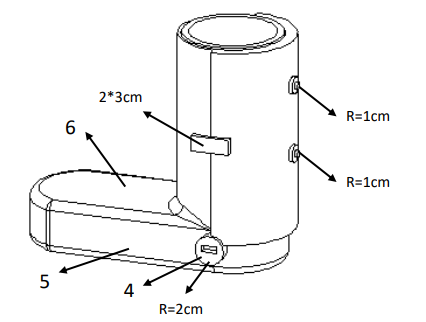
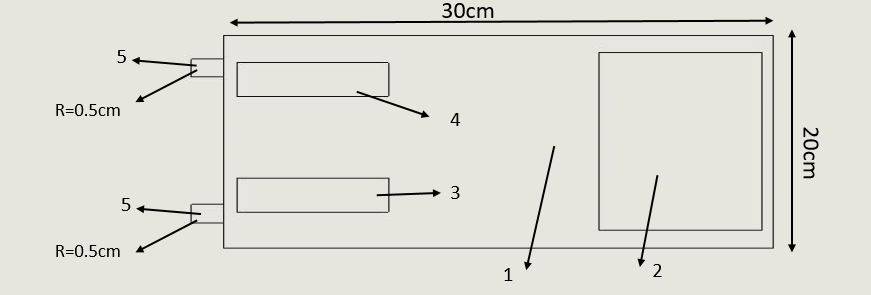
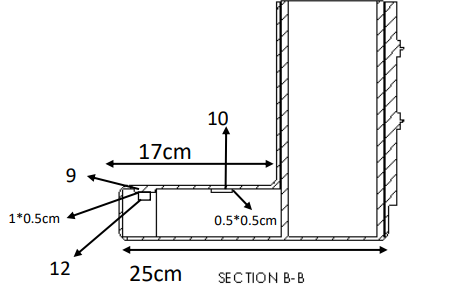
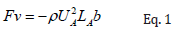
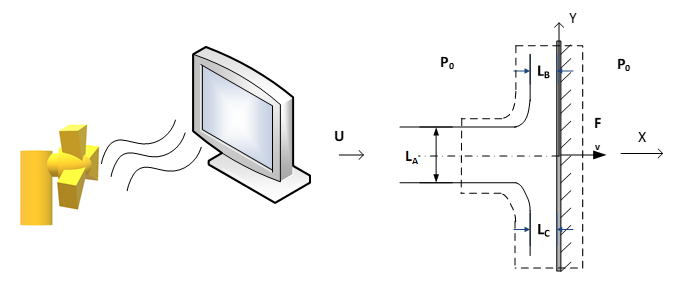
 Therefore,
  viruses can be fitted in an area of the tip of a fingerprint (A=10-4 m2). By assuming that, the whole area covered by n number of viruses, the momentum impact on each virus was calculated by:
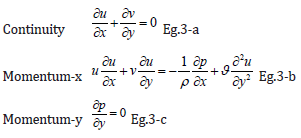
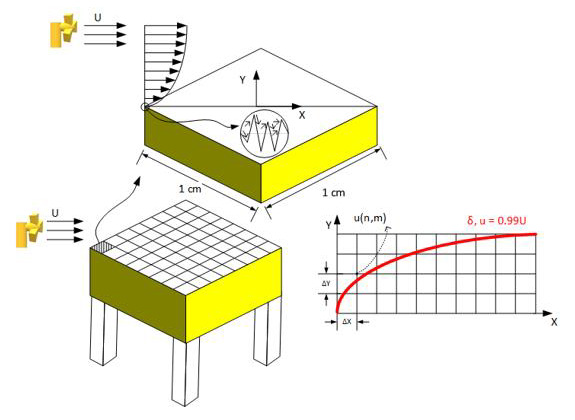
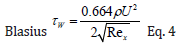
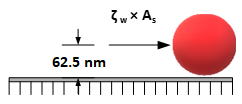
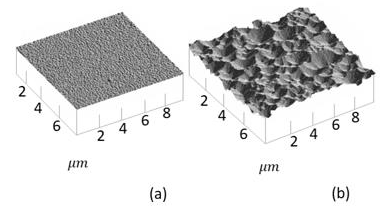
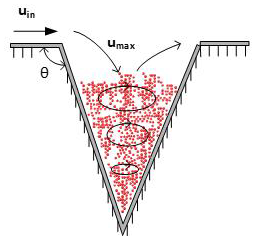
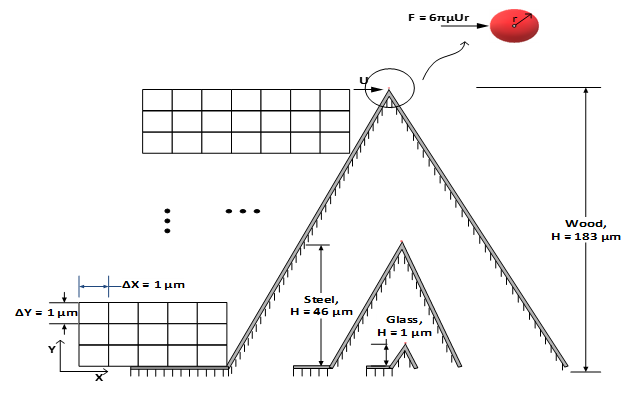
 is as the following:
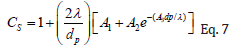
 of the different air flows pass the cylinder with applied velocities of U∞ = {0.1, 0.5, 1, 5, 10} ms-1, at T = 20°C (ν = 1.516×10⁻⁵ m2s-1), are far less than the critical Reynolds number, ReD,C = 250,000, which guaranties the laminar flow regime around the cylinder. The Hiemenz’s polynomial velocity distribution [46] was considered for calculating the boundary layer with finite difference method.
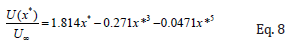
 while
while 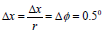 and Δy=1 μm. Higher freestream velocities result in smaller thickness of boundary layers; therefore, the domain of 0 ≤ y ≤ 25 mm was considered for U∞=0.1,0.5 ms- 1,while 0 ≤ y ≤ 2.5 mm was taken for U∞=1,5 and 10 ms-1. The two-dimensional, steady, laminar, incompressible boundary layer equations at constant temperature and pressure are the same as Eq. 3-a and 3-b. The boundary conditions of the system were as the following: