Biomedical Journal of Scientific & Technical Research (BJSTR) is a multidisciplinary, scholarly Open Access publisher focused on Genetic, Biomedical and Remedial missions in relation with Technical Knowledge as well.
Occult Lung Cancer with Acrometastatic Presentation: A Case Report
Introduction
Digit tumors of the hand are uncommon clinical conditions. Differential diagnosis of these lesions can cross over more common conditions, like infection or swelling and always requires histological examination. [1-15] The first clinical examination often occurs in emergency room (ER), since pain, swelling and functional impairment are common symptoms [2,11]. In this report we describe a case of a rare acrometastasis that turned out to be of pulmonary origin. Metastasis at hands and fingers is a rare entity, but even rarer is their presentation as the first sign of a cancer [1,3]. Dominant hand is slightly predilected and the distal phalanx of the thumb is the most frequently involved location [1]. The prognosis is unfavorable, the average survival from the time of diagnosis is about 7 ± 7 months, although extremely rare cases of longer survival are described [4,8,14].
Clinical Case
A 61-year-old man came to our emergency room because of worsening pain and swelling in his left thumb started one week before. The patient did not present fever and symptoms did not regress after empirical treatment with a broad-spectrum antibiotic prescribed by his general practitioner. He reported to be a smoker (20 cigarettes a day) and denied recent trauma or other comorbidities. Under local anesthesia, the lesion was incised, but no serous or purulent secretion came off. However, the dermis layer appeared particularly thick, therefore a lozenge of tissue was taken for histological examination. The X-ray of the hand (Figure 1a) showed an area with erosive features and cortical osteolysis of the distal phalanx of the first finger. Blood chemistry tests showed an increase in ESR (59 mm/h) and CRP (31.4 mg /L) Chest X-ray (Figure 1b) reported. “Good lung expansion with isolated dystelectatic streak in the right upper peri-hilar area. No active pleural-parenchymal lesions. Hila of vascular type. Heart’s dimensions within the normal limits. Aorta with isolated, thin parietal calcification at the arch. Moderate segmental swelling of the dorsal soft tissues at the upper 3rd – middle 3rd passage of the thoracic cage.”
21 days after accessing the emergency room, the patient found a painless wooden swelling in the left periscapular region on self-examination. 25 days after accessing the emergency room, the histological examination report described a suspicion between cutaneous primary malignant primitive adnexal neoplasm (adenocarcinoma not further specified) and a metastasis from adenocarcinoma of clinically unknown primitivity. The immunohistochemical survey was positive for CKAE1-3, CK7, EMA, CEA, Calretinin. Negative for TTF-1, Pax-8, S100, Napsin-A, p63, p40, D240, CDX2, PSA, Desmina, SMA. The patient was therefore hospitalized. A total body CT exam was performed, that found out a neoplastic disease with multiple locations suspected for metastases at the cervical nodes (Figure 2a) at the dorsal spine (Figure 2b) and at the liver (Figure 2c). The dorsal lesion was removed and sent to histological examination whose report was comparable to the first histological examination performed on the digit lesion, describing a lesion whose suspect was between skin adnexal malignant neoplasm and a localization of a poorly differentiated tumor not further specified. However, the immunohistochemical negativity for TTF-1 did not exclude a possible pulmonary primitivity, which appeared more likely in the light of the instrumental findings.
Figure 1.
Moreover, the patient underwent a gastroscopy with biopsies of the gastric muscle to exclude a gastrointestinal origin. The examination was negative for neoplastic pathologies. (Figure 2d). During the total body PET examination with fluorideoxyglucose, intense accumulation of the tracer was detected at the sites identified bythe CT, in the Barety’s space and in the pulmonary hilar area (Figure 2e). Therefore, a neoplastic disease with probable right lung primitiveness was identified.54 days after accessing the emergency room, the thumb appeared swollen with uncontrolled pain and skin ulceration (Figure 2f). Therefore, the patient was treated with a surgical digital amputation through the proximal phalanx in order to manage local complications; the histological examination was comparable to the previous ones. Follow-up PETCT examination was performed 2 months after surgery. Aggravation of the neoplastic disease was reported, with appearance of new skeletal and splanchnic localizations. Three months after surgery occurred hemoptysis and frank progression of the pulmonary neoplastic disease (Figure 2g). The patient died at 7 months from the first access to the emergency room.
Figure 2.
Discussion
Acrometastases are rare with an incidence of 0.1% among all metastases, men are more likely to be affected than woman and the primary sites involved are lung, kidney, breast and gastrointestinal tract [1,5,12]. Acrometastases can become symptomatic before the primary tumor is identified in a percentage between 10% and 30% [1,6,9,15]. They are generally painful, can appear as an infected swelling, can ulcerate and bleed and often affect the thumb (Figure 2h). Generally, those of pulmonary origin are aggressive. Moreover, joint space is commonly preserved [7]. In our case, biopsy was essential to differentiate it from osteomyelitis or other infectious disease, but it was not diriment about the primitivity of the lesion (Figure 2i). In this context, the radiological studies were crucial to orient towards a pulmonary primitivity. The choice of a surgical treatment was therefore purely palliative. It is interesting that the suspect of an oncological condition occurred since the first visit at emergency room, despite the higher incidence of other conditions and their similarities. Probably incising the lesion turned out to be a good decision, since the absence of secretion, associated to the clinical history of the patient, oriented toward a not infectious condition [16].
Conclusion
The prognosis of an occult lung cancer with metastatic presentation in the fingers is poor. Chemotherapy and local radiotherapy can relieve the pain and regress the mass, but finger amputation may be necessary for very aggressive neoplastic diseases. Although there are not studies measuring directly the improvement of the quality of life after surgery, it is agreed that this procedure is the best way to control the pain [6,10,13]. It is important that the orthopedist and the emergency doctor has knowledge of these rare disease, in order to start a differential diagnosis and perform the right procedures.
Review of Conducting Oxides Semiconductors in Thin Solid Films
Introduction
Most optically transparent and electrically conducting oxides (TCO) are binary or ternary compounds, containing one or two metallic elements. Their resistivity could be as low as 10-4 Wcm, and their extinction coefficient k in the optical visible range (VIS) could be lower than 0.0001, owing to their wide optical band gap (Eg) that could be greater than 3 eV. This remarkable combination of conductivity and transparency is usually impossible in intrinsic stoichiometric oxides; however, it is achieved by producing them with a non-stoichiometric composition or by introducing appropriate dopants. Badeker (1907) discovered that thin CdO films possess such characteristics [1]. Later, it was recognized that thin solid films of ZnO, SnO2, In2O3 and their alloys were also TCOs [2]. Doping these oxides resulted in improved electrical conductivity without degrading their optical transmission. Al doped ZnO (AZO), tin doped In2O3, (ITO) and antimony or fluorine doped SnO2 (ATO and FTO), are among the most utilized TCO thin solid films in modern technology. In particular, ITO is used extensively. The actual and potential applications of TCO thin solid films include:
(1) Transparent electrodes for flat panel displays
(2) Transparent electrodes for photovoltaic cells,
(3) Low emissivity windows,
(4) Window defrosters,
(5) Transparent thin solid films transistors,
(6) Light emitting diodes, and
(7) Semiconductor lasers.
As the usefulness of TCO thin solid films depends on both their optical and electrical properties, both parameters should be considered together with environmental stability, abrasion resistance, electron work function, and compatibility with substrate and other components of a given device, as appropriate for the application. The availability of the raw materials and the economics of the deposition method are also significant factors in choosing the most appropriate TCO material. The selection decision is generally made by maximizing the functioning of the TCO thin film by considering all relevant parameters and minimizing the expenses. TCO material selection only based on maximizing the conductivity and the transparency can be faulty.
Recently, the scarcity and high price of Indium needed for ITO, the most popular TCO, as spurred R&D aimed at finding a substitute. Its electrical resistivity (ρ) should be ~10-4Wcm or less, with an absorption coefficient (α) smaller than 104 cm-1 in the near- UV and VIS range, and with an optical band gap >3eV. A 100 nm thick film TCO film with these values for α and ρ will have optical transmission (T) 90% and a sheet resistance (RS) 10Ω At present, AZO and ZnO:Ga (GZO) semiconductors are promising alternatives to ITO for thin-film transparent electrode applications. The best candidates is AZO, which can have a low resistivity, e.g. on the order of 10−4 Wcm [3], and its source materials are inexpensive and nontoxic. However, the development of large area, high-rate deposition techniques is needed.
Another objective of the recent effort to develop novel TCO materials is to deposit p-type TCO films. Most of the TCO materials are n-type semiconductors, but p-type TCO materials are required for the development of solid lasers. Such p-type TCOs include: ZnO:Mg, ZnO:N, ZnO:In, NiO, NiO:Li, CuAlO2, Cu2SrO2, and CuGaO2 thin solid films. These materials have not yet found a place in actual applications. Published reviews on TCOs reported exhaustively on the deposition and diagnostic techniques, on film characteristics, and expected applications [4-6]. The present paper has three objectives:
(1) To review the theoretical and experimental efforts to explore novel TCO materials intended to improve the TCO performance,
(2) To explain the intrinsic physical limitations that affect the development of an alternative TCO with properties equivalent to those of ITO, and
(3) To review the practical and industrial applications of existing TCO thin solid films.
Electrical Conductivity
TCOs are wide band gap (Eg) semiconducting oxides, with conductivity σ in the range 102 – 1.2×10⁶ (S). The conductivity is due to doping either by oxygen vacancies or by extrinsic dopants. In the absence of doping, these oxides become very good insulators, with ρ > 1010 Ω-cm. Most of the TCOs are n-type semiconductors. The electrical conductivity of n-type TCO thin solid films depends on the electron density in the conduction band and on their mobility: σ=mne, where μ is the electron mobility, n is its density, and e is the electron charge. The mobility is given by:
where τ is the mean time between collisions, and m* is the effective electron mass. However, as n and τ are negatively correlated, the magnitude of μ is limited. Due to the large energy gap (Eg > 3 eV) separating the valence band from the conducting band, the conduction band cannot be thermally populated at room temperature (kT~0.03 eV, where k is Boltzmann’s constant), hence, stoichiometric crystalline TCOs are good insulators [7]. To explain the TCO characteristics, various population mechanisms and several models describing the electron mobility were proposed. Some characteristics of the mobility and the processes by which the conduction band is populated with electrons were shown to be interconnected by electronic structure studies [8] e.g., that the mobility is proportional to the magnitude of the band gap.
In the case of intrinsic materials, the density of conducting electrons has often been attributed to the presence of unintentionally introduced donor centers, usually identified as metallic interstitials or oxygen vacancies that produced shallow donor or impurity states located close to the conduction band. The excess or donor electrons are thermally ionized at room temperature and move into the host conduction band. However, experiments have been inconclusive as to which of the possible dopants was the predominant donor [9]. Extrinsic dopants have an important role in populating the conduction band, and some of them have been unintentionally introduce. Thus, it has been conjectured in the case of ZnO that interstitial hydrogen, in the H+ donor state, could be responsible for the presence of carrier electrons [10]. In the case of SnO2, the important role of interstitial Sn in populating the conducting band, in addition to that of oxygen vacancies, was conclusively supported by first-principle calculations of Kiliç and Zunger [11].
They showed that Sn interstitials and O vacancies, which dominated the defect structure of SnO2 due to the multivalence of Sn, explained the natural nonstoichiometry of this material and produced shallow donor levels, turning the material into an intrinsic n-type semiconductor [10]. The electrons released by these defects were not compensated because acceptor-like intrinsic defects consisting of Sn voids and O interstitials did not form spontaneously. Furthermore, the released electrons did not make direct optical transitions in the visible range due to the large gap between the Fermi level and the energy level of the first unoccupied states. Thus, SnO2 could have a carrier density with minor effects on its transparency [10]. The conductivity σ is intrinsically limited for two reasons. First, n and μ cannot be independently increased for practical TCOs with relatively high carrier concentrations. At high conducting electron density, carrier transport is limited primarily by ionized impurity scattering, i.e., the Coulomb interactions between electrons and the dopants.
Higher doping concentration reduces carrier mobility to a degree that the conductivity is not increased, and it decreases the optical transmission at the near-infrared edge. With increasing dopant concentration, the resistivity reaches a lower limit, and does not decrease beyond it, whereas the optical window becomes narrower. Bellingham et al. were the first to report that the mobility and hence the resistivity of transparent conductive oxides (ITO, SnO2, ZnO) are limited by ionized impurity scattering for carrier concentrations above 1020cm-3. Ellmer also showed that in ZnO films deposited by various methods, the resistivity and mobility were nearly independent of the deposition method and limited to about 2×10⁻⁴ Wcm and 50 cm2/Vs, respectively [12,13]. In ITO films, the maximum carrier concentration was about 1.5 ×1021 cm-3, and the same conductivity and mobility limits also held [14]. This phenomenon is a universal property of other semiconductors. Scattering by the ionized dopant atoms that are homogeneously distributed in the semiconductor is only one of the possible effects that reduces the mobility [15,16].
The all recently developed TCO materials, including doped and undoped binary, ternary, and quaternary compounds, also suffer from the same limitations. Only some exceptional samples had a resistivity of ≤1×10⁻⁴Wcm. In addition to the above-mentioned effects that limit the conductivity, high dopant concentration could lead to clustering of the dopant ions [17], which increases significantly the scattering rate, and it could also produce nonparabolicity of the conduction band, which has to be taken into account for degenerately doped semiconductors with filled conduction bands [18].
Optical Properties
As mentioned above, besides high conductivity (~106 S), effective TCO thin solid films should have a very low absorption coefficient in the near UV-VIS-NIR region. The transmission in the near UV is limited by Eg, as photons with energy larger than Eg are absorbed. A second transmission edge exists at the NIR region, mainly due to reflection at the plasma frequency. Ideally, a wide band gap TCO should not absorb photons in the transmission “window” in the UV-VIS-NIR region. However, there are no “ideal” TCOs thin solid films, and even if such films could be deposited, reflection and interference would also affect the transmission. Hence, 100% transparency over a wide region cannot be obtained.
The optical properties of TCOs transmission T, reflection R, and absorption A, are determined by its refraction index n, extinction coefficient k, band gap Eg, and geometry. Geometry includes film thickness, thickness uniformity, and film surface roughness. T, R and A are intrinsic, depending on the chemical composition and solid structure of the material, whereas the geometry is extrinsic. There is a negative correlation between the carrier density and the position of the IR absorption edge, but positive correlation between the carrier density and the UV absorption edge, as Eg increases at larger carrier density (Moss-Burstein effect). As a result, the TCO transmission boundaries and conductivity are interconnected.
The width of the VIS transmission window of a TCO film with thickness deposited on a transparent substrate is affected not only by the optical parameters of the TCO film but also by the optical properties of the substrate. The refractive index nsub of the most common substrates are ~1.45 for fused silica and ~1.6 for various glasses. The extinction coefficient of the substrate (ksub) is generally < 10-7, hence any light absorption would take place in the film, where generally kfilm> ksub. For films thicker than 100 nm, several interference bands could be formed, producing maximal and minimal values of T when either the wavelength or thickness is varied. When kfilm ≈ 0, the peak transmission (Tmax) is equal to the transmission of the substrate [19]. Hence, assuming that the sample is in air, Tmax = 90% and 93% for films deposited on glass and fused silica, respectively. The minimum sample transmission (Tmin) in air is expressed by:
As most TCO films have values of n in the VIS in the range 1.8 – 2.8, Tmin will be in the range 0.8 – 0.52. Tmin is closely approximated by the relation: Tmin = 0.051n2-0.545n+1.654. As n in the VIS decreases with wavelength, Tmin increases with wavelength, but will not exceed ~0.8. When the film extinction coefficient is not negligible and affects the transmission, Tmax < Tsub, and Tmin also decreases. By decreasing the TCO film thickness, T is increased but the sheet resistance decreases. Combining together the optical and electrical properties of the film, the fraction of the flux absorbed in a film (A) is given by the expression:
Figure 1: Fraction of absorbed power as function of TCO conductivity.
Figure 1 presents plots of the fraction of the absorbed power at wavelength of 400nm and k ~0.02 as a function of the conductivity for three representative values of RS. For a given σ, low values of RS necessitate using thick films, and lower conductivity requires the use of even thicker films, resulting in an increase in the loss of radiative power. The dependence of film thickness on the conductivity for three values of Rs is presented in Figure 2. Using the same film conductivity, applications requiring the lowest RS will be thicker and, and the absorbed fraction will be higher. At present, only high-quality ITO is compatible at present with the condition that the absorbed power fraction be lower than 10% and RS = 10Ω At lower extinction coefficient (k) films with lower conductivities can be used, e.g., when k = 0.002 instead of 0.02, the absorbed power A is lower by a factor of ~8 and allows the use of thicker films. The combination of film thickness, conductivity, and extinction coefficient determine the absorption of the radiation flux. However, when the total transmission T is considered, reflection and interference must be considered, which depend on the refractive indices of the substrate and the film, and the film thickness. A general formula for T and R was given by Cisneros [20].
Figure 2: TCO film thickness as function of film conductivity.
Trends in the Development of TCO Materials
While the development of new TCO materials is mostly dictated by the requirements of specific applications, low resistivity and low optical absorption are always significant pre-requisites. There are basically two strategies in managing the task of developing advanced TCOs that could satisfy the requirements. The main strategy dopes known binary TCOs with other elements, which can increase the density of conducting electrons. As shown in Table 1, more than 20 different doped binary TCOs were produced and characterized [21], of which ITO was preferred, while AZO and GZO come close to it in their electrical and optical performance. Doping with low metallic ion concentration generates shallow donor levels, forming a carrier population at room temperature. Doping In2O3 with Sn to form ITO substantially increased conductivity. It is believed that substituting Sn4+ for In3+ provides carrier electrons, as Sn4+ is supposed to act as a one-electron donor [22]. Similarly, aluminum is often used for intentional n-type doping of ZnO, but other group III impurities, such as Ga and In, and group IV, such as Sn and Ge, also work.
Table 1: TCO Compounds and Dopants.
Doping by Al produced the relatively high conductivity AZO.3 Doping with non-metallic elements is also common, e.g., ZnO:Ge (GZO), SnO2:F (FTO) and SnO2:Sb (ATO) [23,24]. Recently, AZO films with resistivity r~8.5.10-5 Wcm was reported by Agura, et al. [25]. An even lower resistivity was reported for GZO, ~8.1. 10-5 Wcm [26]. This ρ is very close to the lowest resistivity of ITO [27] of 7.7·10-5 Wcm, with a free carrier density of 2.5.1021 cm-3. The above-described metallic dopant ions should have appropriate valency to be an effective donor when replacing the native metallic ion. However, when an O2- ion is replaced with a F- ion, a donor level is again produced. Thus, doping SnO2 by F increased the carrier electron mobility by a factor of ~2 and their concentration also by a factor of 2, reducing the resistivity by a factor of 4 [28]. The concentration of F- dopant ions should not exceed an upper limit, as an increase in carrier scattering by F ions led to a decrease in the conductivity [29]. Doping SnO2 with Sb initially introduces Sb5+ ions that act as donors. When the doping concentration was increased beyond a certain level, however, Sb3+ ions began to replace the Sn4+ ions.
The introduction of Sb3+ ions generates an acceptor level that compensates the donors and increases the resistivity [30- 34]. This effort to increase the conductivity without degrading the transparency was paralleled by a more elaborate strategy in which phase-segregated two-binary and ternary TCOs were synthesized and characterized. The phase-segregated two-binary systems include ZnO-SnO2, CdO-SnO2, and ZnO-In2O3. In spite of the expectations, the electrical and optical properties of the twobinary TCOs were much inferior to those of ITO. The phase diagram of the ternary TCOs could be schematically presented by a threedimensional or four-dimensional phase combination of the most common ternary TCO materials [20,30] based on known binary TCO compounds. Accordingly, the ternary TCO compounds could be formed by combining ZnO, CdO, SnO2, InO1.5 and GaO1.5 to obtain Zn2SnO4, ZnSnO3, CdSnO4, ZnGa2O4, GaInO3, Zn2In2O5, Zn3In2O6, and Zn4In2O7. However, as Cd and its compounds are highly toxic, the utilization of these TCOs is limited, though they have adequate electrical and optical properties.
Other binary TCOs were synthesized from known binary TCOs and also from non-TCO compounds, such as In6WO12 and the p-type CuAlO2. The first-principle model of Kiliç and Zunger,10 showed the importance of the composition in turning an insulating oxide into a TCO. However, structural considerations should also be included. Hosono et al [31]. investigated the conditions for depositing widegap amorphous oxides with high electron mobility. They indicated that since the mobility is proportional to the width of the conduction bands, a large overlap between relevant orbitals is required. In addition, the magnitude of the overlap needs to be insensitive to the structural randomness that is intrinsic to the amorphous state. They assumed that since the spatial spreading of the ns orbital is large and the overlap between these ns orbitals with spherical symmetry is large and insensitive to any angular variations in the M-O-M bonds (where M is a metal cation) compared with p-p or d-p orbitals having high anisotropy in geometry.
Oxides composed of metal cations with an electronic configuration (n-l)d10ns0 would satisfy these requirements, as the lowest part of the conduction band in these oxides is primarily composed of ns orbitals [32]. Hosono et al. also conjectured that because of this, ternary oxides are preferred to binary oxides for the formation of amorphous TCO thin solid films. Scanning the periodic table, they identified 105 combinations of elements as promising ternary oxide candidates. As indicated by Mizoguchi and Woodward,7 not only do binary n-type TCO materials contain a metal with (n -1)d10ns0 electronic configuration, but also the ternary and quaternary complex TCOs. In a study of CdSnO3, Cd2SnO4, and CdIn2O4, Shannon et al. conjectured that the formation of a transparent conductor could result from edge sharing of Cd2+, In3+, and Sn4+ octahedra [33]. Nearly all of the complex TCOs found to date possess cations in octahedral coordination, as do most binary TCOs, with the exception of ZnO (wurtzite structure) and β-Ga2O3.
These and other studies show that similar complex oxides may be a rich source of new TCO materials [34-37]. Mizoguchi and Woodward concluded, however, that based on their research the only necessary condition for an oxide, binary or complex, to be a transparent conductor was to have a structure causing the lowest energy band to be dispersed and split off from the rest of the conduction band, whereas continuous edge sharing of the structural octahedra is only accidental [7]. The lowest energy band in the conduction band of an effective transparent conductor should be wide so that carriers introduced upon doping will be highly mobile. This condition is met when the anion coordination environment is fairly symmetric, as is the case in binary TCOs. This is a necessary but not sufficient condition for transparent conductivity. The second condition for a good TCO material is that it must be possible to effectively populate the conduction (or valence) band by doping, and that the doping should not seriously degrade the carrier mobility or the optical transmission [7,22].
Considering the ternary TCO compound (AxMyOz), where A is a lower valency cation and M is a main group ion with higher valency, if the valance of the A-O and M-O interactions were not too different, as they would be when the A-cation has an (n-1)d10ns0 electron configuration, the oxygen bonding was likely to remain reasonably symmetric and a disperse conduction band would result, in agreement with the necessary condition specified above. The dispersion of the conduction band energy in such compounds may not be as large as in a binary oxide, yet there could be extra freedom to manipulate the composition and structure of such oxides, facilitating the adaptation of the electronic energy levels for applications with specific needs [7]. All of the TCOs discussed above are n-type semiconductors. In addition, p-type doped TCOs were also developed and could find interesting future applications, in particular in the new optoelectronic field of “transparent electronics” [38]. Fabricating undoped or doped p-type TCOs was found to be more difficult than the n-type.
The first p-type TCO was made from CuAlO2 by Kawazoe in 1997 [39]. Prior to this, however, in 1993 Sato et al. reported on a semi-transparent p-type TCO with ~40% visible transmission [40]. It has been reported that is possible to form acceptor levels in ZnO, doping with N, P and As. The difficulty in producing p-type oxide was hypothesized to result from the strong localization of holes at oxygen 2p levels or due to the ionicity of the metallic atoms. O 2p levels are far lower lying than the valence orbit of metallic atoms, leading to the formation of a deep acceptor level with the holes. Hence, these holes are localized and require sufficiently high energy to overcome a large barrier height in order to migrate within the crystal lattice, resulting in poor hole-mobility and conductivity [41,42]. Following this hypothesis, an effort was made to grow p-type TCO based on “Chemical Modulation of the Valence Band (CMVB)”, where the oxide composition and structure were expected to delocalize the holes in the valence band.
The recent detailed report of Benerjee and Chattopadhyay [35] lists several groups of such synthesized p-type TCOs, e.g., CuMiiiO2, AgMiiiO2 where Miii is a trivalent ion. Compared with the n-type TCOs, these TCO have relatively lower conductivities, of the order of 1 S/cm, and lower transmission, < 80%. Growing p-ZnO was an important milestone in ‘‘Transparent Electronics’’, allowing fabrication of wide band gap p-n homo-junctions, which is a key structure in this field. It was anticipated that higher conductivity and optical transmission could be obtained by doping ZnO with N, F, P, Sb, and As, however, it was also shown that such doping had some serious limitations [43,44]. Based on first principle calculations, Yamamoto and Yoshida [45] proposed that co-doping of donoracceptor dopants (e.g. Ga and N, respectively) in ZnO might lead to p-type ZnO. Joseph et al. applied this principle to simultaneously dope ZnO with an acceptor (N) and a donor (Ga), where the acceptor concentration was twice that of the donor.
The optical transmission was greater than 85%, but the conductivity was low, ~1 S/cm [46]. p-type ZnO:Sb was deposited with a filtered vacuum arc equipped with a Zn cathode doped by Sb [47]. The conductivity was ~0.5 S/cm, the mobility 9-20cm2/ Vs and the hole density ~4·1016 cm-3, with transmission of ~85%. It is evident that the challenge to grow p-type TCO with ρ ~ 10-3 Ω.cm, or better, still exists. The need to produce n-type TCOs with higher conductivity and better transmission, without relying on In, inspired research and development effort to discover and study some unconventional TCOs. Novel transparent conductors were proposed using oxides with s2 electron configurations. Oxides of Mg, Ca, Sc and Al also exhibited the desired optical and electronic features; however, they have not been considered as candidates for achieving good electrical conductivity because of the challenge of efficiently generating carriers in these wide band gap materials. The approach suggested was to increase the mobility rather than the carrier density.
If this goal could be achieved, the optical properties would not deteriorate at lower resistivity. Recently, mobility with more than twice that of commercial ITO was observed in Mo-doped In2O3 (IMO), and it was shown that the conductivity can be significantly increased with no changes in the spectral transmittance upon doping with Mo [48,49], Electronic band structure investigations of IMO by Medvedeva revealed that the magnetic interactions which had never been considered to play a role in combining optical transparency with electrical conductivity ensure both high carrier mobility and low optical absorption in the visible range [50]. Recently, new thin film geometries were also explored in search of TCO films with higher conductivity. Dingle, et al [51]. showed that higher conductivity could be obtained by doping modulation, which spatially separates the conduction electrons and their parent impurity atoms (ions) and thereby reduced the effect of ionized and impurity scattering on the electron motion.
Rauf [52] used a zone confining process to deposit ITO with ρ = 4.4·10-5 Ω.cm and μ= 103 cm2/Vs. The highly and lowly doped regions were laterally arranged in the films, rather than vertically as in superlattice structures. A theoretical outline of a method to engineer high mobility TCOs was presented by Robbins and Wolden [53], based on the high mobility transistor structure discovered accidentally by Tuttle, et al. [54]. The film should consist of alternating thin layers of two semiconductors. One layer provides a high density of carriers, while the second is a high mobility material. Electrons are supplied by the former and transported in the latter, mitigating the limitations of ionized impurity scattering [50]. The model of Robbins and Wolden assumes that the electrons move into the high mobility material in response to differences in electron affinity.50 However, the success of the proposed TCO design depends upon controlling the layer thickness at nano dimensions, (e.g. ~5 nm).
In addition, this approach depends on having materials of excellent quality and compatible crystal structure in order to avoid problems related to interface defects. TCO materials with magnetic properties, which are ferromagnetic semiconductors with a Curie temperature well above room temperature, have also been explored recently, as they could be used for second generation spin electronics and as transparent ferromagnets. reported that Co doped ZnO thin film (Zn1-xCoxO) with x = 0.05 – 0.25, had a large magnetic moment of 1.8μB per Co ion for x = 0.05. High-temperature ferromagnetism was subsequently found by other groups, with varying magnetic moments.
Industrial Application of TCOs
TCO’s have diverse industrial applications – some of the more important ones will be described in this section. TCO coatings are applied to transparent materials used for work surfaces and closet doors, particularly in clean rooms used for electronics assembly, in order to prevent harmful static charge buildup. In this application relatively high surface resistances (e.g. kΩ/) can be tolerated. Transparent heating elements may be constructed from TCO coatings. These are applied as defrosters in aircraft and vehicular windshields. Their advantage over traditional hot air blowers is that they can have a much shorter effective defrosting time, and work uniformly over large areas. This application requires either the use of very low surface resistance coatings (e.g. ~1 Ω/)), or a high voltage power source. The application of TCO coatings to passenger vehicles has proven to be technically successful but a commercial failure, due to the high cost of a supplemental alternator to deliver the requisite high voltage. If the automobile industry will adopt a higher bus voltage, as has been widely discussed, then this application may prove to be more commercially feasible in the future.
TCO coatings may be used as shielding to decrease electromagnetic radiation interference (EMI) from providing visual access. This may be to either to keep radiation from escaping an enclosure, to avoid interfering with nearby devices, or detection, or from entering an enclosure to prevent external radiation sources from interfering with electronic devices within. One potential example is the window of domestic microwave ovens, which today use a perforated metal screen, which obscures clear visual observation, to reduce microwave leakage. Radiation leakage must be minimized to prevent harm to the users, as well as interference to proliferating wireless devices which use the unlicensed spectral band at 2.45 GHz. While transparent conducting films were proposed 50 years ago, an attempt to introduce microwave windows with TCO coatings into the market was not successful about a decade ago, due to the high cost. Low-cost designs are currently being developed.
The three largest applications of transparent conductive oxide thin solid films, in terms of the surface area covered, and their total value, are flat panel displays, solar cells, and coatings on architectural glass. In general, transparent electrodes are needed for a large variety of electro-optical devices, of which flat panel displays and solar cells are the most important examples. In liquid crystal displays (LCDs), TCO films are needed for both electrodes, in order to allow backlighting to pass through the liquid crystal film while applying voltage to the various pixels. Generally, these electrodes are in the form of a pattern of lines, with the alignment of the lines on the two electrodes perpendicular to each other. This allows addressing individual pixels by applying a voltage to the two lines which intersect at a given pixel. Thus, patterning the films is required. ITO is the TCO of choice in this application, both because of its electro-optical properties, and the relative ease of acid etching.
The best LCDs utilize an active matrix comprising one amorphous silicon transistor which occupies a corner of each pixel, and because the silicon is opaque, has reduced light transmission. Recently transparent field effect transistors (FETs) have been developed based on the zinc oxide but using a Cr gate. These zinc oxide FETs have been incorporated into small 220X280 10μm pixel active-matrix LCDs. Small and medium LCDs are a 25 B$/yr market which is growing by about 5%/yr, while large area LCDs have a similar market size and a much higher growth. The explosive growth for demand of ITO coatings for this specific application has generated widespread concern about Indium scarcity in the near future. Most solar cells use TCO films as a transparent electrode. Major considerations in the choice of the TCO for this application, besides the conductivity and transparency, are electronic compatibility with adjacent layers in the cell, processing requirements, and stability under environmental conditions.
Often tin oxide-based films are chosen for this application, in as much as patterning is not required, but environmental stability is. TCO films are commonly applied to architectural glass, often as part of multi-layer stacks. In window glass applications, usually the conductivity per se is irrelevant, but rather the concurrent high infra-red reflectivity is exploited, in order to obtain good light transmission in the visible range, while minimizing heat transmission. This feature is used to minimize air conditioning costs in the summer, and heating costs in the winter, in buildings equipped with appropriately coated windows. Approximately 25% of flat glass is coated, and energy conserving coatings are now mandated in various regions. Most commonly the coatings are applied by two techniques.
(1) Very enduring and inexpensive, but simple, coatings are produced with atmospheric pressure chemical vapor deposition (APCVD), in line with the float glass production process. This insures a fresh surface and exploits the high temperature of the glass during its production. However, APCVD is not very flexible and there are only limited options available for the coating architecture.
(2) A more flexible, but also more costly, process is magnetron sputtering. Commonly multiple (e.g. 20-60) rotary targets are mounted in long modular vacuum systems (e.g. 40-160 m length), and multilayer stacks are deposited as the glass panels pass beneath the various cathodes, traveling at velocities of ~1 m/s. Typically these systems operate continuously for 2 weeks, after which expended targets are replaced and other maintenance is performed.
Commercial Availability of TCO Thin Solid Films
The coating industry is segmented into “captive shops” which provide coating service within a given company for their products, and “job shops” which provide contract coating services for external companies. It is difficult to gather information about the former, since companies have no need to advertise their captive shops, and often prefer to guard their processes as trade secrets. More information is available concerning TCO availability from job shops, who often advertise their capabilities via the internet. A survey of these companies revealed that about ¾ of them indicated that they provide ITO coatings; most of the remainder did not specify the coating composition, but most probably they also deposit ITO as their TCO of choice. Only one company advertised supplying FTO films, and another also advertised IZO and AZO. Surface resistances ranged from 5 to 500Ω/. It should also be noted that float glass online coated by APCVD with FTO is readily available as an inexpensive commodity.
Conclusion
The expanding use of TCO materials, especially for the production of transparent electrodes for optoelectronic device applications, has developed into a worldwide multi-billion $US economy that in general depends on the availability of ITO. This economy is endangered by the scarcity and high price of In. The situation drives the search for alternative TCO materials to replace ITO and motivates an intensive investigation of the physics and chemistry of TCO materials. The main significant progress in the research and development of TCO thin solid films has been made in understanding the physics of TCO semiconductors. The physical processes that make possible the coexistence of electrical conductivity and optical transparency are well clarified and understood. In particular, the role of oxygen vacancies and various dopants in the formation of shallow donor levels is well established. In addition to binary TCOs, progress has also been made in developing new TCO compounds, consisting of combined segregated-binaries, ternary and quaternary oxides.
However, the objective of developing new TCOs with conductivity similar or even higher than that of ITO has not been realized. The conductivity of the recently developed ternary, quaternary, and binary-combination TCOs is lower than that of ITO. It is now appreciated that the attainment of higher conductivity is limited by the negative correlation between carrier density and electron mobility. It is now realized that the development of TCOs with higher conductivity does not necessarily depend on higher dopant concentration that provides higher carrier density but could also be achieved by maintaining moderate carrier density with increased mobility. Spatial separation of the conduction electrons and their parent impurity atoms (ions) should significantly reduce carriers scattering and increase their mobility. Using this principle, the conductivity of ITO was successfully increased, however, it has not yet been applied to other TCOs. The effort to produce TCOs with higher mobility based on using the oxides with ns2 electron configuration, instead of the ns0 electron configurations found in typical TCOs, was only partially successful.
These wide band gap oxides exhibited the desired optical and electronic features; however, their conduction was low due to too low. p-type TCOs were obtained by doping ZnO with N, F, P, Sb, and As, however, it was also shown that such doping had some serious limitations, and the conductivity was lower than n-type ZnO. In summary, AZO, GZO and FTO are at present the only TCOs with electrical conductivity close to that of ITO, and with appropriate high optical transmission in the near-UV, VIS and NIR. The objective of producing TCO materials with optical and electrical characteristics equivalent to those of ITO has not yet been achieved.
Comparative Analysis of Pattern of Dermatological Disorders Treated During 2019 and 2020 at Benazir Bhutto Hospital Rawalpindi and Hospital Statistics: A Rapid Review of Effect of Covid-19
Introduction
About 1.9% billion of our global population is suffering from diverse skin problems [1]. Skin problems constitute the fourth commonest etiology of human ailments; about one third of global illness is attributed to dermatological diseases [2]. Apart from ethnicity and genetics, occurrence of skin disorders in any region are also attributed to dietary habits, hygienic practices, social class and climate [3]. COVID-19 has led to a very critical scenario across the globe due to confrontation with grave consequences. Apart from clinical symptoms suggestive of respiratory syndrome, SARS-CoV-2 also contributed to the development of depression and anxiety among our people [4]. Moreover, cutaneous lesions or changes have also determined now as one of the COVID related clinical presentations [5]. Pre-existing skin diseases like eczema and dermatitis among some patients got intensified due to COVID-19 [6]. A systematic review by Jamshidi et al revealed that presence of only dermatological lesions does not guarantee the severity of COVID-19 and patients with urticaria like manifestations had approximately 2.2% mortality rate [7].
The highest Disability Adjusted Life Years (DALY) rate for skin and subcutaneous infections was determined in New York; however, the difference in frequency of various dermatological problems between various American states was insignificant [8]. According to the results of screening program run among Germany inhabitants during 2019, about 64.5% of the populates had skin disorders; the commonest among them was actinic keratosis (26.6%) followed by rosacea (25.5%) and eczema (11.7%). Skin diseases were found to be more prevalent among elderly males [9]. The present study is intended to analyze the variations in frequency of skin problems by comparing the record of Dermatology department at BBH during 2019 and 2020. This will not only enable us to determine the differences in frequency of skin problems among our population during pre-COVID (2019) and COVID pandemic (2020); but will also facilitate us to comprehend the impact of COVID-19 on skin related ailments. This research will sufficiently guide our strategic planners towards taking necessary steps in order to combat COVID-19 associated skin disorders.
Materials and Methods
A cross-sectional hospital record-based study was done by comparing the dermatological problems managed at BBH during 2019 and 2020. The data was collected pertinent to age, gender, number of patients visiting OPD, number of patients admitted and type of skin disorders among admitted. Data was analyzed by Microsoft Excel 2010. Bed Occupancy Rate (BOR) was also computed. However, statistically significant gender-based variations in Average Length of Stay (ALOS) of the patients in hospital during 2019 and 2020 were determined by Independent sample t-test. P-value <0.05 was taken as significant. 95% CI was also measured.
Results
A total of 63,649 and 75,280 patients with diverse dermatological problems visited Benazir Bhutto Hospital (BBH) Rawalpindi during 2019 and 2020 respectively. Mean age of the patients visiting the dermatology department both during 2019 & 2020 was determined to be 39 ± 7.2 years. Gender-wise distribution of these patients is reflected below in Figure 1. Most of the patients presenting with skin diseases at BBH during 2019 and 2020 were 15-49 years old as illustrated below in Table 1. About 185 and 138 patients with dermatological problems were admitted in Dermatology ward of BBH through OPD and Accident & Emergency department during 2019 and 2020 respectively. Gender based distribution of admitted patients is revealed below in Figure 2. Maximum number of patients 23 were admitted during July 2019 while least frequency of dermatological patients was reported in October 2019.
Figure 1: Gender based distribution of the patients with skin problems during 2019 and 2020.
Figure 2: Gender wise differences in frequency of admissions during 2019 & 2020.
Table 1: Age distribution of patients with skin problems.
On the other hand, highest number of admissions during 2020 was in the month of January and there was closure of Dermatology ward in April, May, June and July due to COVID pandemic as portrayed in Figure 3. The most commonly seen skin problem was erythroderma (22.5%) among our patients followed by pemphigus vulgaris (17.5%) and eczema (15.6%). Top ten dermatological problems prevailing among our patients during 2019 and 2020 are depicted below in Figure 4. Bed Occupancy Rate was determined to be 49%. Mean differences in ALOS of male and female dermatological patients was determined to be statistically insignificant as elucidated below in Table 2.
Figure 3: Trend of admissions in Dermatology ward during 2019 and 2020 at BBH.
Figure 4: Top 10 dermatological problems reported at BBH during 2019 & 2020.
Table 2: Statistical significance of gender-based variations in ALOS of admitted patients during 2019 (n = 185).
Discussion
Skin diseases are frequently transmitted from infected individuals to the surrounding population. Comprehensive understanding of the global disease burden attributable to skin disorders is of paramount significance to mitigate cutaneous infections [10]. Skin problems can adequately be avoided by proper washing of hands, avoidance of contact with irritants and consultation with specialist in particular for chronic diseases [11].The present study revealed the maximum occurrence of skin problems among 15-49 years old females. The highest frequency (76%) was among females who presented to Dermatology OPD of BBH during 2020 (Table 1). Although Dermatology department of Benazir Bhutto Hospital remained closed from April – July 2020, still patients visiting BBH were more (75,280) than those (63,649) who came to BBH with skin problems during 2019. This shows the confrontation of the population more with skin problems amidst COVID pandemic than during pre-pandemic era.
However, type of skin diseases remained same during both calendar years. A similar study carried out among dermatological patients attending primary healthcare facility of Karachi illustrated the mean age of the patients about 25 years; however, 87% of them were females. Approximately 43% had chronic skin ailments while 36.4% presented with infectious disorders. Life style factors that were significantly associated with onset of skin problems were sharing of fomites and contact with pet animals [12]. Role of lifestyle factors towards inception of skin problems should further be justified by doing systematic reviews. In ours study, erythroderma constituted the greatest magnitude of skin diseases both during 2019 and 2020 followed by pemphigus vulgaris, eczema and cellulitis. A similar cross-sectional study carried out in Tanzania revealed that eczema was the most frequent dermatological problem followed by papulosquamous disorders, fungal infections and tumors [13]. Likewise, a research among general public attending the Dermatology OPD of a tertiary healthcare facility of Lahore disclosed that most of the patients were 20-40 years old and eczema constituted the greatest magnitude (31.07%) of dermatological illnesses. In addition, pigmented ailments were observed to be 3.82%, psoriasis 3.80% and bullous disorders were 1.6% [14].
Skin problems among the residents of any geographical region vary from those residing in other territories; moreover, these differences also exist among people belonging to unlike age groups. In addition, the incidence of mortality from various skin disorders reflect much variation among developed and resource constrained countries [15]. A study by Huang K et al explored skin common diseases among Chinese inhabitants as both malignant and benign tumors, erythema papule scale, bullous, allergic and connective tissue problems that were brought to the attention of stakeholders by artificial intelligence [16]. Another similar multi-center study by Yong et al among populates of Singapore concluded that eczema was the most persistent skin disease (54.2%) followed by tenia infection (20%), cellulitis (11.4%) and bullous pemphigoid (8.6%) [17].
Identification of modifiable risk factors leading to rise in dermatological problems in our society are of paramount significance to our strategic planners in rational decision making for lessening the incidence of these cutaneous diseases. In our study, about 185 patients with diverse dermatological presentation got admitted in Dermatology ward during 2019 while admissions were diminished to total 138 during 2020. Males outnumbered females during 2019 while relatively less males were admitted during 2020 (Figure 2). Likewise, in a retrospective data analysis done by Sen a et al based on 2011 – 2014 record of admissions in Dermatology ward, males were comparatively more than females [18].
Many of the skin damaging and irritating effects nowadays are substantially attributed to ultraviolet radiations, oxides and particulate matter [19]. No doubt, exposure to environmental pollutants is also posing our population to the risk of developing skin diseases. Strategic planning to reduce Air Quality Index (AQI) by mitigating the proportion of pollutants is the need of hour in order to lower the occurrences of skin related issues globally. In present study, Average Length of Stay (ALOS) among our male and female patients during 2019 was 8.25 ± 2.45 days and 48.7 ± 15.63 respectively. Bed Occupancy rate during 2019 was 49%. These Hospital statistics for 2020 were not computed due to closure of Dermatology department from April-July 2020. Bed Occupancy rate (BOR) of any healthcare facility is likely to exceed 100% in case of disaster or disease outbreak [20]. However, our study does not reflect any significant impact of COVID-19 on proportion of dermatological cases than those reported during 2019 (pre- COVID era). Studies on dermatological statistics of other healthcare settings can facilitate us to great extent in situational analysis.
Conclusion and Recommendations
Erythroderma constituted the most prevalent skin disease of our community followed by pemphigus vulgaris and eczema; however, the frequency of these dermatological problems was not substantially influenced by COVID-19. The true picture in response to COVID pandemic can better be appraised by multi-center study.
Denoised VEGFR2 Expression Relates to Sunitinib Efficacy in Advanced Clear Cell Renal Cell Carcinoma
Introduction
Renal cell carcinoma (RCC) corresponds to 85% of all kidney cancer, with clear cell renal cell carcinoma (ccRCC) being the most frequent subtype accounting up to 80% of all RCC [1]. The molecular characterization of sporadic ccRCC is highly specific, with the Von Hippel-Lindau (VHL) gene being altered or epigenetically silenced in more than 90% of the cases [2,3]. The loss of VHL leads to the stabilization of hypoxia inducible factors (HIF-1α and HIF- 2α), stimulating the production of oncogenic and pro-angiogenic agents such as VEGF and PDGF [4,5] that drive the majority of ccRCC and is efficiently targeted using antiangiogenics. CcRCC often remains asymptomatic for several years and more than half of ccRCC are diagnosed incidentally [6], typically at an advanced stage. The management of advanced and metastatic ccRCC mostly relies on systemic treatments according to a risk stratification that split patients into good-, intermediate- and poor-prognosis groups following International Metastatic RCC Database Consortium (IMDC criteria) [7,8]. In the past few months, clinical practice guidelines drastically evolved to propose as the preferred first-line regimen PD-1 inhibitor (pembrolizumab or nivolumab) for all riskgroups patients, combined or not with an antiangiogenic (axitinib) or CTLA-4 inhibitor (ipilimumab). Though, sunitinib and pazopanib– both antiangiogenic multikinases – still represent recommended therapeutic alternative options for first-line systemic treatment, for example for patients ineligible or unwilling to receive immune-checkpoint blockers (NCCN Guidelines for Kidney Cancer, version 1.2021 – July 15, 2020). Some pivotal trials demonstrated the clinical superiority of immune-checkpoint inhibitors used in combination over monotherapies of anti-angiogenics in first-line setting in unselected patients [9,10]. However, several studies suggested that some patients might benefit more from a monotherapy of antiangiogenic in first line than from immune-checkpoint blockers, combined or not with antiangiogenics, based on their tumoral molecular profiling. For example, Liu, et al. [11] reported that PBRM1 lossof- function – which is found in 40% of ccRCC 3 – was associated with an upregulated angiogenesis and a less immunogenic microenvironment, and therefore patients with PBRM1-mutated ccRCC were more likely to benefit from first-line sunitinib than an immune-checkpoint blocker [11]. These findings were consistent with the results of the prospective IMmotion150 trial that reported improved survival outcomes following sunitinib compared to atezolizumab (anti-PDL1) with or without bevacizumab in molecularly selected patients, based on a gene expression signature of 7 VEGF-inducible angiogenesis-associated genes [12]. However, the correlation between expression of VEGF or VEGFrelated proteins and response to sunitinib remains unclear and conflicting data limit its application in the clinic [13-18]. In this study, we explored the clinical performance of a method to denoise the analysis of VEGFR2 expression in ccRCC Formalin-Fixed Paraffin-Embedded (FFPE) samples, based on a 37 gene-expression signature from the tumor and normal kidney cells. We evaluated if VEGFR2 scores could predict objective responses and outcomes of patients with advanced or metastatic ccRCC treated with sunitinib in first-line, second-line or third-line.
Materials and Methods
Data Collection and Patient Selection
Patients were retrospectively retrieved from the UroCCR project (French research network on kidney Cancer – NCT03293563). Eligible patients were 18 years of age or older, had a primary or recurrent ccRCC treated with sunitinib in any treatment line setting, with available material from surgical resection of the primary tumor prior to sunitinib treatment. Patients were excluded from the analysis in case of missing clinical data or RNA Integrity Number (RIN) below 7. Outcomes collected were the RECIST V1.1 best response: complete or partial response (CR or PR, respectively), stable disease (SD) or progressive disease (PD); PFS in months (calculated as the time from the first intake of sunitinib to the date of first documented progression or death); OS in months (calculated as the time from the first intake of sunitinib to the date of death from any cause); duration of follow-up; number and type of previous treatment lines. Objective response rate (ORR) was defined as the proportion of patients with CR or PR under sunitinib [19]. Additional clinical characteristics available comprised age at diagnosis, gender, African phenotype ethnicity (yes/no), number and type of previous lines of treatment and the type of surgery (cytoreductive of complete nephrectomy).
Study Objectives
The primary objective was to evaluate the relation between PREDMED® VEGFR2-scores and the effect of sunitinib, represented by ORR and PFS, for patients with advanced or metastatic ccRCC. The secondary objective was to evaluate the relation between PREDMED® VEGFR2-scores and OS. Performance estimation relied on sensitivity, specificity and Receiver Operating Characteristic Area under the Curve (AUC), as specified by the STARD 2015 guidelines [20].
PREDMED Medical Device
Rationale: PREDMED® is an in vitro diagnostic multivariate index assay (IVDMIA) that normalizes the RNA expression of 37 selected genes from tumor samples on a bank of normal tissues and cells’ gene expressions. The algortihm provides a score for each gene, ranked from 0 to 1000, that reflects their relative dysregulations compared to normal values, as previously described [21]. The provisional limited panel of 37 genes was selected based on current knowledge of mainly targetable biological mechanisms implicated in ccRCC, comprising the tumor cells, stromal cells, vessels and immune cells (Figure 1). For the current study we prospectively choosed to use the VEGFR2-score only. Samples and Biological Methods: CcRCC FFPE samples (CRB-K – CHU Bordeaux) were all processed in a centralized laboratory in Strasbourg, France (INSERM U1119, BMNST Lab, University of Strasbourg, Labex Medalis, Fédération de Médecine Translationnelle). Blocks were stored at -20°C and RNA samples were stored at -80°C following extraction. Total RNA was extracted with TRI Reagent® solution (Molecular Research Center; #TR118), quantified, assessed for quality (RIN) and reverse transcribed (Applied Biosystems; #4368814). The obtained cDNA was diluted to get a final concentration of 1 μg /100 μL. RT-qPCR was performed using TaqMan Gene expression Master Mix (Applied Biosystems; #4369016). Experiments were conducted using customized microplates specially designed for this project by Applied Biosystems (Custom TaqMan Array Plates; #4391526) to contain human specific TaqMan® probes at 1X and primers at 1X (list provided in (Supplementary Figure 1).
Supplementary Figure 1: List of the targeted genes evaluated by RT-qPCR to enrich the algorithm and corresponding primer.
Analytical Methods / PREDMED® Algorithm: PREDMED® normalization method has been previously described 21. Briefly, the reference panel gene expressions were assessed using a cocktail of non-tumoral kidney tissues which comprised: whole normal kidney total RNA (#AM7976), medullary kidney RNA (CRB-K – CHU Bordeaux), cortical kidney RNA (CRB-K – CHU Bordeaux), human renal glomerular endothelial cell total RNA (#4005-SC), human renal proximal tubular epithelial cell total RNA (#4105-SC), human renal cortical epithelial cell total RNA (#4115-SC), human renal epithelial cell total RNA (# 4125-SC), human renal mesangial cell total RNA (#4205-SC), and a low grade carcinoma of kidney total RNA (# CR559126). Then, to reduce inter individual variability and allow the normalization process on the reference panel, gene expressions were first normalized on the mean expression of two housekeeping genes (18S ribosomal RNA and Glyceraldehyde 3-phosphate dehydrogenase GAPDH), as follow: ΔCt (gene) = Ct (gene) – mean Ct (housekeeping genes). 2-ΔCt (gene). Following similar normalization steps run multiple times, the resulting score ranged from 0 to 1000 for each gene: 1000 corresponding to the highest relative upregulation from normal. PREDMED® is protected by International Application patent PCT/EP2016/078353.
Statistical Analysis
All recorded variables were described by using position and dispersion statistics, such as mean, median and 95% confidence interval (95%CI). The assumption of normality (defined by the Gaussian distribution) was tested by the Shapiro Wilk test on each quantitative variable distribution. To compare survival distributions, we used the log-rank Mantel-Cox test, and described the results with the Hazard Ratio, 95%CI ratio and associated p-value. All statistical tests were two-tailed and a p-value < 0.05 was considered as statistically significant. All analyses were performed using R software under its version 3.1 and JAGS for the MCMc estimations in Bayesian models [22]. Except for ROC curves generated using R, all graphs were created using GraphPad Prism® V8.0.2.
Ethics
The trial was conducted in accordance with the local Good Clinical Practice guidelines (CNIL number declaration 2005853 v 0, DC-2017-3040). The biobank biological resource center number associated with this study is BB-0033-00036. The UroCCR project (NCT03293563) obtained the authorization number DR-2013-206 from the national information science and liberties commission (CNIL) and all patients included consented to the use of their personal and genetic data.
Results
Patients’ Characteristics
We retrospectively collected 46 FFPE tumor samples from patients addressed for advanced or metastatic ccRCC between December 2006 and February 2016 (Figure 1). Among these 46 patients, 5 patients were excluded from the analysis: 2 patients received sunitinib before surgical resection, 1 patient never received sunitinib and 2 patients had missing clinical data. Gene expressions were assessed by RT-qPCR and led to the exclusion of 7 patients due to poor RNA quality. Altogether, 34 patients remained (Figure 2). The median age was 66 years old and the sex ratio approximately 3 males for 1 woman (Table 1). The majority of patients (N=30, 88.2%) had a ccRCC at a metastatic stage at the time of study and 31 (91.2%) patients received sunitinib as first-line systemic treatment. In our cohort, sunitinib treatment was associated with an overall objective response rate of 20.6%, including 1 complete response (2.9%) and 6 partial responses (17.6%). Nine patients (26.5%) progressed and 18 patients (52.9%) harbored stable disease as best response. After a median follow-up of 24.7 months, median PFS was 7.8 months and median OS was 20.2 months, which is similar to data from pivotal trials that evaluated sunitinib in the first-line setting [9,10]. At the time of end of study, 5 patients were still alive, 2 of them still under sunitinib treatment.
Table 1: Baseline patient characteristics and clinical outcomes of all patients treated with sunitinib and included in the gene expression analysis (N=34).
Figure 1: Summary of PREDMED method. PREDMED normalizes the RNA expression of 37 genes from tumor samples on a bank of normal tissues and cells’ gene expressions. The algorithm provides a score for each gene, ranked from 0 to 1000, that reflects their relative dysregulations compared to normal values.
Figure 2: Flowchart of the study.
VEGFR2-Score and Response to Sunitinib
Figure 3: VEGFR2 and response to sunitinib. A. A, VEGFR2-score and response to sunitinib: ROC curve displaying the prediction performances of the VEGFR2-score computed using the PREDMED® signature algorithm. Area under the curve (AUC), 95% confidence interval and associated p-value are indicated. B. B, Contingency table depicting the number of partial and complete responses (PR/CR) and stable and progressive diseases (SD/PD) accurately predicted using the VEGFR2-score with a cut-off at 637. C. C, VEGFR2 raw expression and response to sunitinib: ROC curve displaying the prediction performances of the VEGFR2 mRNA expression alone after normalization on housekeeping genes. Area under the curve (AUC), 95% confidence interval and associated p-value are indicated. D. D, Contingency table depicting the number of partial and complete responses (PR/CR) and stable and progressive diseases (SD/PD) accurately predicted using the VEGFR2 mRNA expression with a cut-off at 0.79.
VEGFR2-scores ranged between 2.0 and 1000.0, with a mean of 504.3. Six out of 7 patients with PR or CR had high VEGFR2-score, and 18 out of 27 patients with PD or SD had low VEGFR2-score. It resulted in a sensitivity of 86%, a specificity of 67%, an AUC of 72.5% (95%CI [50.1 – 94.9]; p=0.04) (Figures 3A & 3B). On the ten patients with the highest VEGFR2-scores, 1 had a complete response, 3 had partial responses and 6 had stable diseases. Conversely, low VEGFR2-scores had a negative predictive value of 94.7%. Raw VEGFR2 expression had poorer relation to response to sunitinib compared to PREDMED® VEGFR2-scores, with an AUC of 48.4% (95%CI [25.2 – 71.6]; p=0.32), a sensitivity of 71% and a specificity of 56% (Figures 3C & 3D).
VEGFR2-Scores and Outcome Under Sunitinib
Figure 4: VEGFR2-scores and outcome under sunitinib. A,B, Kaplan-Meier analysis of progression-free survival (A) and overall survival (B) of patients with a high VEGFR2-score (> 637, dotted line) versus patients with a low VEGFR-score (< 637, full line). Hazard ratio (logrank), 95% confidence interval and associated p-value are indicated.
We observed that PFS was significantly longer in patients with higher VEGFR2-scores (HR: 0.465, 95%CI [0.221–0.978], p=0.0311) (Figure 4A). OS was also significantly longer in patients with higher VEGFR2-scores (HR: 0.400, 95%CI [0.192–0.834], p=0.0134) (Figure 4B). The 5 patients who were still alive at the date of end of study – more than 77.2 months after the initiation of sunitinib – had very high VEGFR2-score (4 with 1000, 1 with 749). Among them, 2 patients with higest scores were still under sunitinib treatment, 81.4 and 92.9 months after initiation. Conversely, raw VEGFR2 mRNA expression was not significantly related to PFS and OS (for PFS, HR = 0.682, 95%CI [0.323-1.438], p=0.28; and for OS, HR = 0.705, 95%CI [0.338-1.470], p=0.33) (Supplementary Figure 2).
Supplementary Figure 2: A,B, Kaplan-Meier analysis of progression-free survival (A) and overall survival (B) of patients displaying a high VEGFR2 mRNA expression (> 0.79, dotted line) versus patients displaying a low VEGFR2 mRNA expression (< 0.79, full line). Hazard ratio (logrank), 95% confidence interval and associated p-value are indicated.
Discussion
PREDMED® denoised the tumor expression of VEGFR2 by analyzing the tumor and normal kidney tissues and cell types of 37 gene expressions selected for their biological and therapeutic roles. For 34 patients with advanced of metastatic ccRCC who received sunitinib, VEGFR2-scores related to overall response rate, progression-free survival and overall survival. Six out of 7 patients who responded to sunitinib had a high VEGFR2-score (sensitivity 86%), 18 out of 27 patients with stable or progressive disease displayed a low VEGFR2-score (specificity 67%). In addition, wrong negative prediction only occurred with one patient who showed partial response while displaying a low VEGFR2-score (negative predictive value 94.7%). It included patient in various treatment lines with sunitinib, independently from the prognosis-risk groups. Previous studies suggested that high VEGFR2 expression may reflect favorable outcome on sunitinib in patients with ccRCC, and therefore could be used as a predictive biomarker of response [13-17]. In our cohort, the raw VEGFR2 expression assessed by RT-qPCR failed to relate to the above-mentioned outcomes. Our study suggest that conventional gene expression analysis to drive targeted treatment relies may be limited by inherent noise. Noise may come from biological sampling, inter-individual variation, or technical variation, among other factors. Denoising expression data from internal and/or external factors is not a usual approach. One of the few clinical evaluation of such hypothesis has been performed in the WINTHER study [23] (NCT01856296). WINTHER proposed transcriptomic analysis from tumor biospsies, which were normalized on normal surrounding tissue of various cancer types. Although the study did not meet its pre-specified primary end-point, it yielded promising outcome results in heavily pretreated patients and confirmed that assessing the expression profile of tumor to guide treatment is feasible and do not delay therapeutic care. Our tool differs from the WINTHER algorithm through its iterative multi-normalization process and a large number of reference normal tissue gene expressions. It does not require the biopsy of healthy tissue from the patients to compute the score. The present study is limited by its retrospective nature; thus, a prospective validation of our findings is planned through a non-interventional study on advanced ccRCC patients receiving sunitinib,. We also consider evaluating this strategy for other ccRCCapproved antiangiogenics, in particular to define whether another antiangiogenic, such as pazopanib or axitinib, should be preferred over sunitinib or should be avoid as well in case of low VEGFR2- scoring. Another limitation of the study is the scarce clinical characteristics available in the database. We could not calculate the standard prognosis IMDC scores to investigate PREDMED® predictions within each risk-group of patients. Nevertheless, our approach shows that gene expression assessment from surgical samples can relate to outcome under sunitinib treatment when sophisticated normalization is performed. Finally, in the current study, we did not take into consideration the scores associated with other genes targeted by sunitinib, such as PDGFR or RET. Future multivariate development of the algorithm could allow more specific multi-kinase predictions. Given the gene panel used and its potential versatility, PREDMED® test can address various therapeutic options, including targeted therapies and immunotherapies, in various tumor types. In this pilot study, the highest priority was given to advanced and metastatic ccRCC, as it remains one of the tumor types with the largest approved treatment options with no validated biomarker available. An additional attractive perspective concerns combinatorial strategies involving immune-checkpoint blockers with or without antiangiogenics in first-line setting, particularly in intermediate and high-risk patients. It is conceivable that a small – and yet unidentified – proportion of patients may benefit from an antiangiogenic added to the anti- PD(L)1 drug, and conversely, some patients may more benefit from a doublet of immune-checkpoint blockers. Importantly, some patients may also benefit from a monotherapy of antiangiogenic and be primarily resistant to immune-checkpoint blockers [11,12]. Biomarkers are urgently needed to identify such a population; hence, to ease personalized decision-making and to optimize therapeutic care for advanced and metastatic cancer patients.
Acknowledgment
The authors thank the members of the UroCCR biological resources center (CRB-K) at Bordeaux, France. The authors are gratefull to Laurence Albiges for her advices and support for this work. The authors would like to thank Justine Fritz, Mathilde Baranger and Coralie Gianesini for their contribution to the data generation.
Conflict of Interest
LV, DM, MS, LT, BL and DB report personal fees from Adaptherapy related to the submitted work. LV reports grants from Bristol-Myers Squibb, non-personal fees from Servier and Pierre-Fabre, outside of the submitted work. LV, as part of the Drug Development Department (DITEP): Principal/sub-Investigator of Clinical Trials for Abbvie, Adaptimmune, Aduro Biotech, Agios Pharmaceuticals, Amgen, Argen-X Bvba, Arno Therapeutics, Astex Pharmaceuticals, Astra Zeneca Ab, Aveo, Basilea Pharmaceutica International Ltd, Bayer Healthcare Ag, Bbb Technologies Bv, Beigene, Blueprint Medicines, Boehringer Ingelheim, Boston Pharmaceuticals, Bristol Myers Squibb, Ca, Celgene Corporation, Chugai Pharmaceutical Co, Clovis Oncology, Cullinan-Apollo, Daiichi Sankyo, Debiopharm, Eisai, Eisai Limited, Eli Lilly, Exelixis, Faron Pharmaceuticals Ltd, Forma Tharapeutics, Gamamabs, Genentech, Glaxosmithkline, H3 Biomedicine, Hoffmann La Roche Ag, Imcheck Therapeutics, Innate Pharma, Institut De Recherche Pierre Fabre, Iris Servier, Janssen Cilag, Janssen Research Foundation, Kura Oncology, Kyowa Kirin Pharm. Dev, Lilly France, Loxo Oncology, Lytix Biopharma As, Medimmune, Menarini Ricerche, Merck Sharp & Dohme Chibret, Merrimack Pharmaceuticals, Merus, Millennium Pharmaceuticals, Molecular Partners Ag, Nanobiotix, Nektar Therapeutics, Novartis Pharma, Octimet Oncology Nv, Oncoethix, Oncopeptides, Orion Pharma, Ose Pharma, Pfizer, Pharma Mar, Pierre Fabre, Medicament, Roche, Sanofi Aventis, Seattle Genetics, Sotio A.S, Syros Pharmaceuticals, Taiho Pharma, Tesaro, Xencor. Research Grants from Astrazeneca, BMS, Boehringer Ingelheim, Janssen Cilag, Merck, Novartis, Onxeo, Pfizer, Roche, Sanofi. Nonfinancial support (drug supplied) from Astrazeneca, Bayer, BMS, Boringher Ingelheim, Medimmune, Merck, NH TherAGuiX, Onxeo, Pfizer, Roche. The other authors have no conflict of interest to declare.
Endo-Parasitic Infestation in Captive and Free-Living Rhesus Macaques (Macaca mulatta) in Bangladesh
Introduction
Primates are noticed to be one of the severely threatened animals in the world, with approximately 50% of species currently at risk of extinction (IUCN [43]). More than 70% of primates are classified on the IUCN Red List as critically endangered, which in the near future they could disappear forever from Asia (IUNC [44]). Therefore, there is a growing recognition that it is very significant to better understand infectious disease dynamics in wild primate populations (Chapman, et al. [1,2]). Parasites play a significant role in the ecosystems, influencing the ecology and evolution of species interactions, host population growth and regulation (Hudson, et al. [3,4]) and even community biodiversity (Hudson [5]). Parasites and infectious diseases can trigger or accelerate population declines and have become a big alarm in conservation biology (Altizer, et al. [6]). Primates are susceptible to various protozoa and helminth parasites (Wanert, et al. [7]). Thus, parasites are an integral part of the natural history of mammals and are always of interest.
Natural infections of gastrointestinal protozoa and helminths have been exhibited in a variety of species of monkeys. Gastrointestinal parasitism in the colonies of non-human primates (NHPs) is often addressed as a research topic (Sano, et al. [8-10]). Strongyloides sp., Oesophagostomum sp., and Trichuris trichiura were previously considered among the most common pathogens causing poor development, anemia, and diarrhoea in macaques and other NHPs (Honjo, et al. [11-13]). Recently, captive NHPs were resulted pathogenic for their hosts and found that they can be frequently affected by several species of intestinal protozoans (Lee, et al. [14- 17]). Several studies have demonstrated that non-human primates may be carriers of human gastrointestinal parasites. Moreover, most parasites noted in NHPs represent a high zoonotic risk for researchers and caretakers in breeding centers (Loomis [18]).
Thus, people living in close proximity of such animals or individuals involved in game parks, animal orphanages or research stations may be at risk of acquiring pathogens from infected animals. Moreover, non-human primates are often valuable in studies of either human diseases processes or vaccine and drug development. It is therefore important that animals used in such studies should not harbour parasites since results obtained using parasitized animals may not reveal the true picture. Additionally, these animals play an important role in natural ecosystems; hence heavy parasite loads may have a negative impact on their population sizes. The rhesus macaque is well known to science due to its relatively easy upkeep in captivity, wide availability and closeness to humans anatomically and physiologically. It has been used extensively in medical and biological research on human and animal health-related topics. However, no previous works on endoparasitic infections of rhesus monkeys in Bangladesh were found in the literature. This article, therefore, highlights the exploratory and descriptive study on the different types of gastrointestinal parasites that affect populations of both wild and captive monkeys.
Materials and Methods
Sample Collection and Preparation
A total of 190 fecal samples were collected randomly from two study areas, the Shadhana Awshadhalaya factory area, Gandaria, Dhaka and the National Zoo of Bangladesh, Mirpur, Dhaka between March 2014 to February 2016. The monthly sampling covered the seasons of summer (March to June), fall (July to October) and winter (November to February). The samples of free-living monkeys were collected from Gandaria region and captive monkeys from Zoo with the permission of the authority. Only fresh, non-dry samples were collected and, whenever possible, when defecation was observed. As far as possible faecal samples were usually collected in the morning and then brought to the Parasitology laboratory of the Department of Zoology, University of Dhaka for microscopic examination.
Formalin-Ethyl Acetate Sedimentation Technique: Preserved faecal samples were processed using the formalin-ethyl acetate sedimentation technique (Cheesbrough [19]). Samples were collected into sealable, plastic bags immediately after defecation is observed. Within 8 h of collection, the collective sum of 2 g taken from each sample was transferred to 2-ml plastic tubes containing 0.75 ml 10% buffered formalin solution. Fixed faecal samples of Rhesus macaques were later transported to the Parasitological laboratory of the Department of Zoology, University of Dhaka, Bangladesh. All faecal samples were examined via a modified formalin–ether sedimentation protocol, substituting ethyl acetate for ether, as the former is less volatile (Hernandez, et al. [20]). Approximately 1 g of formalized faeces was diluted in 5 ml formalin, and centrifuged at 1,500 rpm for 3 min. The supernatant was then discarded, and the concentrated pellet was weighed (Muller-Graf, et al. [21]). To identify and quantify parasitic infection, an aliquot was removed from the homogenous suspension, placed in the chamber of a McMaster slide, and examined at 100x magnifications. It was counted all helminthes eggs and larvae were observed within the chamber’s 0.15-ml grid to calculate the number of eggs per gram of feces (EPG) from each sample.
Epidemiological Parameters: For each parasite, the prevalence and mean intensity were recorded. Prevalence was counted as the number of infected macaques per sampled subset of the population (Margolis, et al. [22-25]). Mean intensity was defined as the average number of infective stages (Table 1), among the infected members of each population.
Taxonomic Identification of the Parasites: Eggs of various gastrointestinal parasites were identified and the references and published articles such as Yamaguti [46-49], Cheng, et al. [26,27], other references, etc. were consulted. Representatives of each parasite were photographed by a digital camera.
Table 1: Average prevalence, intensity and EPG (egg/cyst/larva per gram) of parasites by location from March 2014 to February 2016.
Statistical Analysis: All statistical tests were carried out using SPSS (Version 22) and R software (Version 3.1.3). A nonparametric repeated-measures analysis of variance (ANOVA) was conducted. The variance ratio with the p-value was used to compare the dispersion of parasites between the Gandaria and Zoo samples. For each case, it was considered the parametric (Welch) and nonparametric (Wilcoxon) tests to study if the two population means for each of the parasites was the same for the two study areas. It was also found the 95% confidence interval of the differences between the two population means for each of the parasites.
Results
This paper aims to determine the parasite community of the host rhesus monkeys (Macaca mulatta), to estimate the prevalence and intensity of rhesus macaques in two study areas, the National Zoo (captive) and Shadhana Awshadhalaya factory area (freeranging) Dhaka, and to study the seasonal prevalence of helminth and protozoan parasitic infestation. Eggs, cysts and larva of parasites were identified based on their taxonomy, morphology and characteristics. Parasites belonging to 30 species were identified, 6 species of protozoa (Entamoeba coli, Eimeria sp., Isospora sp., Toxoplasma gondii, Chilomastix mesnili and Gregarina sp.), 5 species of cestodes (Taenia sp., Moniezia sp., Reillietina sp., Bertiella sp. and Amoebataenia sp.), 11 species of nematodes (Ascaris lumbricoides, Toxocara sp., Trichuris trichiura, Strongyloides sp., Ancylostoma sp., Ascarops sp., Gongylonema sp., Gnathostoma sp., Subulura sp., Enterobius sp. and Capillaria sp.), 7 species of trematodes (Neoglyphe sp., Watsonius watsoni, Schistosoma mansoni, Paragonimus sp., Clonorchis sinensis, Brachylaemus sp. and Gastrothylax sp.). The pentastomida (Linguatula sp.), was the first record in Bangladesh on the species of gastrointestinal parasites affecting monkeys in both captivity and the wild. This article compares the prevalence and intensity of parasites from two study areas which covered two study periods- the first study period (2014-2015) and the last study period (2015-2016).
Overall Estimate of Parasites Prevalence, Intensity and EPG (Egg/Cyst/Larva Per Gram): In the present study, from March 2014 to February 2016, the average prevalence and EPG of parasites were higher in Zoo than that in Gandaria. The average prevalence and EPG of parasites in Zoo were 46.42% and 358.89 respectively. The overall estimates of EPG prevalence and intensity of parasites for free-ranging and captive areas were averaged over the two study periods in both cases. It was observed that on average the number of eggs per gram of Gandaria samples was 306.67 and for that of Zoo, samples were 3888.89. While the average intensity of parasites was estimated to be around 35% in both the areas, the overall prevalence of parasites in Zoo (46.42%) was significantly higher (P-value <0.1) than Gandaria (39.76%) (Table 1).
Estimated Prevalence, Mean Intensity and EPG (Egg/Cyst/ Larva Per Gram) of Parasite Groups by Location and Study Year: In the present study, it is evident that nematoda was the most dominant parasite. In both, the study areas, the prevalence of nematoda among others was the maximum during 2014-2015 and 2015-2016. In 2014-2015 samples showed the prevalence of nematoda was 77.78% in Gandaria and 80% in Zoo. In 2015-2016, the prevalence of nematoda in Gandaria and Zoo were 72% and 74% respectively. Unlike a very low prevalence (around 2%) of pentastomida was observed in Zoo (2014-2015). The study did not find any parasites of pentastomida in Gandaria. (Table 1, Figure 1). The study further observed the mean intensity of parasite groups among the two study periods and study areas. the estimated mean intensity of protozoa was maximum (76.06) in Zoo (2015-16). On the other hand, the mean intensity of pentastomida was absent in Zoo for both study years.
Figure 1: Estimated prevalence of parasite groups by location and study year.
In Gandaria, the mean intensity of nematoda was 65.41 in 2014-2015 and that was 66.17 in Zoo at that time. In 2015-2016, the intensity of nematoda in both Gandaria and Zoo were 66.76 and 67.51 respectively. However, the mean intensity of trematoda and cestode (35.85) was found in Gandaria, Dhaka (2015-16) samples. (Table 1, Figure 2). The estimated EPG was the highest for nematoda in both study areas and both study periods. In 2014-2015, the EPG of Gandaria and Zoo were 879.17 and 791.67 respectively. Moreover, in 2015-2016 those were 970.83 and 937.50 accordingly. On the contrary, in 2014-15, the estimated EPG of trematoda was higher in Gandaria than that of Zoo and the opposite situation was seen in 2015-16. In the first study year, the EPG of cestoda in Gandaria was 50 and that was 138.89 in Zoo. On the other hand, in 2015-2016 those were 95.83 and 250 in Gandaria and Zoo respectively (Figure 3).
Box plots for the prevalence of parasites in the Gandaria samples (2 years data).
Figure 2: Mean intensity of parasite groups by location and study year.
Using the combined data of Gandaria the Box plot for each of the parasites demonstrate that the prevalence of Entamoeba sp. was centered higher than all other parasites in the protozoa group. Both the Entamoeba sp. and Toxoplasma sp. showed higher spread and positive infections.The prevalence of Ascaris sp. was centered higher than other nematode parasites. Most of the parasites in this group were highly spread out. Four parasites in protozoa and five in nematoda group had very negligible prevalence (Figure 4a). The prevalence of most of the parasites of trematoda, cestoda and pentastomida were centered near zero. All most all the parasites occurred with less than 50% of prevalence in Gandaria. Only the Taenia sp. among the cestoda group had few non zero observations (Figure 4b).
Figure 3: Estimated EPG of parasite groups by location and study year.
Figure 4:
a. Box plots for the prevalence of parasites (protozoa & nematoda) in the Ganderia samples (2 years data).
b. Box plots for the prevalence of parasites (trematoda, cestoda & pentastomida) in the Gandaria samples (2 years data).
Using the combined Zoo data, the Box plots indicate that the prevalence of Entamoeba sp. was centered the highest followed by Toxoplasma sp. among the protozoa group. The Entamoeba sp. prevalence was negatively skewed while that of Toxoplasma sp. was positively skewed. The spread of Toxoplasma sp. prevalence was higher than other protozoan parasites. On the other hand, the prevalence of Ancylostoma sp. was centered the highest among the nematoda parasites. Most of the parasites in this group were highly spread out in terms of prevalence (Figure 5a).
Figure 5:
a. Box plots for the prevalence of parasites (protozoa & nematoda) in the Zoo samples (2 years data).
b. Box plots for the prevalence of parasites (trematoda, cestoda & pentastomida) in the Zoo samples (2 years data).
Discussion
The present analyses reveal significant richness and diversity of gastrointestinal parasites in the rhesus monkeys in Gandaria and Zoo. Parasites belonging to 30 species were identified, 6 species of protozoa (Entamoiba coli, Eimeria sp., Isospora sp., Toxoplasma gondii, Chilomastix mesnili and Gregarina sp.), 5 species of cestodes (Taenia sp., Moniezia sp., Reillietina sp., Bertiella sp. and Amoebataenia sp.), 11 species of nematodes (Ascaris lumbricoides, Toxocara sp., Trichuris trichiura, Strongyloides sp., Ancylostoma sp., Ascarops sp., Gongylonema sp., Gnathostoma sp., Subulura sp., Enterobius sp. and Capillaria sp.), 7 species of trematodes (Neoglyphe sp., Watsonius watsoni, Schistosoma mansoni, Paragonimus sp., Clonorchis sinensis, Brachylaemus sp. and Gastrothylax sp.) and 1 species of pentastomida (Linguatula sp.). This was the first record in Bangladesh on the species of gastrointestinal parasites affecting monkeys in both captivity and wild; and also their prevalence.
By comparison, 21 gastrointestinal parasites were identified in Kenya’s Tana River mangabey (Mbora, et al. [28]) and 14 parasite species were identified in monkeys of Uganda’s Kibale Forest (Gillespie, et al. [29]). Thirteen parasite species were found in Mahale National Park of Tanzania (Kooriyama, et al. [30]). Total 14 species were found in Rubondo Island National Park of Tanzania (Petrzelkova, et al. [45]) and a total of 23 gastrointestinal parasites were recorded in the Taï monkeys, African nonhuman primates (Kouassi, et al. [32]); recorded 23 gastrointestinal parasites with relatively high prevalence. However, no cestode species were recovered. According to the present work a total of 30 parasites with 5 species of cestodes were recorded. Jha, et al. [33] a prevalence survey of gastrointestinal parasites of Rhesus Monkeys was conducted in three temples Pashupatinath, Swyombhunath and Tripureshwor of Kathmandu. Total 121 fresh faecal samples, were collected randomly from these areas, and three species of protozoa and ten species of helminths were detected by microscopical examination of faecal samples.
A total of 30 gastrointestinal parasites were recorded in the present observation which represents the greatest parasite richness documented to date for Rhesus monkeys. Therefore, the diversity indices demonstrate considerable species diversity and equitable distribution of gastrointestinal parasites in monkeys. Faecal samples of monkeys (captive and free-living) were collected from the Shadhana Awshadhalaya factory area, Gandaria and the National Zoo of Bangladesh, Mirpur. Primates living in complex habitats are infected by a greater intensity and diversity of parasites (Poulin, et al. [34]; Nunn,et al. [35]; Nunn and Altizer [36]). Poor quality habitat and disturbed habitats are much more likely to harbor a greater intensity and diversity of parasites relative to host populations in optimum habitats (Poulin, et al. [34]; Nunn, et al. [35]; Nunn and Altizer [36]). In parasites with multi-stage life cycles, or with infective stages transmitted through the environment, the habitat of the host-parasite interaction plays a more direct role in the transmission of that parasite (Altizer [36]; Combes, et al. [38] and Grutter [39]).
Thus, the environmental conditions and management practices in the study areas (captive and free-living), such as food, cleanliness, overcrowding and deworming among others may influence the prevalence of parasitic infections and are responsible for the parasite richness in rhesus monkeys. In the present study, nematoda was the most dominant parasite in both study areas (captive and free-ranging). In contrast, the majority of the enteric parasites of captive non-human primates are protozoans, (Lane, et al. [40]; Ye,et al. [41]; da Silva Barbosa, et al. [10]). In this study, the average prevalence and EPG of parasites were higher in Zoo (captive) monkeys than that in Gandaria (free-living) monkeys. According to Kouassi, et al. [32], captive non-human primates are frequently infected with parasites having a direct life cycle and show a lower number of parasitic species in comparison with wild NHPs. Therefore, the environmental conditions of zoo and the life cycle pattern of parasites might be the reason for the higher prevalence of parasitic infections in Zoo than in Ganderia. According to Altizer, et al. [42], seasonality affects free-living stages of parasites through changes in temperature, humidity and rainfall, and host susceptibility and exposure through variations in physiology and behavior. Thus, environmental factors such as temperature, humidity and rainfall may influence the seasonal variation of parasites in Macaca mulatta.
Conclusion
This is the first report on endo-parasitic infection of the rhesus monkey in captive and free-ranging populations. The prevalence, EPG and intensity of helminth and protozoan parasites of the gastrointestinal tract in populations of free-ranging and captive monkeys were noted which provides baseline data on the gastrointestinal parasites in both study areas. The average prevalence of parasites was higher in captive monkeys than that in free-ranging monkeys. Seasonal fluctuation of parasitic infection was found from the captive and free-ranging monkeys which suggests environmental factors may affect the seasonal variation of parasites in monkeys. Rhesus macaques (Macaca mulatta) constitute an integral part of biodiversity and a cognizable link between humans and nature. Therefore, the findings of this study will serve as a guide to establish the necessary preventive measures to favor the conservation of this species.
Radiotherapy Wedge Filter AAA Model 18 Mev- Dose Delivery 3D Simulations with Several Software Systems for Medical Physics Applications
Introduction
Radiation Therapy has been during recent decades among the most important/frequent clinical methods/treatments for cancer cure, remission, palliative care, lifetime elongation, methastasis treatment, and optimization of oncological therapy for patient lifequality. However, the current tumor treatment trends have evolved/ changed in recent years. Chemotherapy, Inmunotherapy, and new Nanoinmunotherapy have emerged as the most powerful methods to eliminate the tumor, obtain a longer patient lifetime, and in many cases, get complete cure/retardation-usually combined one another with/without radiotherapy. In parallel, and spite of these frontline medical advances, radiation therapy has experienced also excellent innovations for oncological treatments. Among them, IMRT, IMPT, Carbon-Ion Therapy with their variants have got outstanding advances for tumor growth-control/cure, terminal patients, methastasis treatment, and side-effects reduction [1-8].
Grosso modo, the progresses in cancer therapy can be classified into two groups—which are synergic, complementary and interactive each other. First one is the science-strictly physics, chemistry, bio/molecular-chemistry, pharmacology, and biology group. Second is the computational, imaging, and software framework that is integrated in oncology to optimize, speed up and make efficient all the advances of the first one— for instance, the incorporation of the Artificial Intelligence for radiotherapy treatment planning optimization/selection, TPO. All these improvements are reduced for the increasing difficulty to control the rising incidence/prevalence of almost all tumor types due to multiple factors apart from lifetime elongation. As a prehypothesis that has been explained in previous contributions [1- 7], Radiation Therapy will remain in clinical future to complete the primary attack to eliminate the most tumor volume and open the field for subsequent Chemo-Inmuno Therapy stages. Complementary, Preventive Medicine has a significant role for cancer incidence reduction and early-stage diagnosis. In a series of previous contributions [1-7], Radiation classical photon therapy AAA model developed by Ulmer and Harder, [1-11], was improved/ complemented.
The studies group along 2008-present [1-7], proved a series of geometrical improvements for WF dose delivery with AAA model. These are geometrical Omega Factor, exact path through WF and limit angle for photon-beam through WF [1-7,9-21]. These mathematical formulation developments are based on analytic geometry, integral equations calculus and programming methods [1-8]. Superposition-convolution photon models constitute the base for analytical proton beamlet model for proton therapy dosimetry [12]. This article is focused on 3D computational simulations for WF 18 Mev beam photon-dosimetry with AAA model. The aim is to demonstrate the efficacy/utility of the presented simulations for treatment planning optimization. Software method was done with three different programming systems. Namely, Matlab, GNUOctave and Freemat. Results comprise a series of 3D imaging and numerical simulations with beam intensity factor I(z) and beamfluence corrections.
Additionally, a comparative assessment of these computational systems for 3D image processing is shown. Consequently, the novelty of this study comprises several strands. The most important is to prove the utility of the 3D planning optimization/ simulation with imaging processing methods. The second is to demonstrate that this utility is efficacious and can be achieved with a number of computational systems available today. Third is the implementation in 3D model simulations of I(z) factor corrections [9]. Complementary, the research shows the usage of these methods for investigation, planning system improvements, and hospital oncology services medical-treatment advances. Therefore, the contribution to medical physics literature can be obtained from these presented results. In summary, this study reports a software programming series of methods to carry out 3D radiotherapy simulations for dose delivery with AAA model and 18 Mev photon spectrum. A number of approximations were applied, but the main objective to prove the utility of 3D dose graphical simulation was reached. The second aim is to show how this can be performed with different computational systems. Namely, Matlab, GNUOctave and Freemat. Medical Physics applications both for clinical radiotherapy treatment planning optimization and radiotherapy physics modelling research come from all the article results.
Mathematical and Computational Methods
Section is divided into two sub-sections. First the AAA model mathematical framework is presented. Secondly, the algorithms computational software and program implementation is explained.
Mathematical and Algorithmic Development
Along a series of papers, [1-11], the equations of the AAA original model photon-dose with WF were calculated. AAA model was named Superposition-Convolution for its mathematical formulation. That is, the term ‘Superposition’ comes from the sum of three Gaussians into the integral. The term ‘Convolution’ describes the mathematical transformation carried out into the Dose-Deposition Kernel at the Integral. Based on this number of previous articles, [1-7,16-29], the WF dose delivery in water without tissue-attenuation corrections is,
where I(z) is the area integral of the dose over a plane perpendicular to the z-axis at depth z, normalized to one incident electron, σ(z) is the depth-dependent mean square radial displacement, x, y, z are the coordinates of the dose-delivery point at beam-output coordinates system, u, v, z, are the coordinates of photon-fluence at depth z, a, b, are the field-size magnitudes at depth z, CK are optimization parameters resulting for a triple Gaussian function setting, ΦW is the photon fluence modified for WF, a’(z) =a(l + z/F), b’(z) =b(1 + z/F) are the halfside lengths projected into depth z, with F as the source-surface distance (SSD). All these parameters are defined in [30,31].
The modified fluence factor (FF) for WF reads,
with Φw (u,v,z)as WF modified fluence. (2)
where C is the distance in z-coordinate from source to WF surface, L is half-length of WF for y coordinate, and ΦU = Φ0 / (1 + z/F)2 according to [30,31]. The source fluence is modified primarily for the dose-delivery depth z and secondly by the WF parameters [1- 11, 20,21]. That is, WF modifies the photon-beam energy spectrum. This model of WF was proven be not totally exact [1-7], because the exact path through WF was calculated approximately [1-7]. Then, in [1-11,20,21], the demonstration of the approximate path and exact path was presented. It was determined an Omega correction Factor (OF) for the Equation 2 [1-7] as follows,
• Proposition 1 [Casesnoves, 2014, 1-7]. – Geometrical Omega Factor, namely, [Ω]F, can be expressed, [my refs] in multiple geometrical-algebraic forms, and one suitable for integration is,
where Φ1 and Φ2 are the geometrical angles for computation defined in Figure 1 and [1-7]. Calculation and programming of these angle ranges is laborious [1-7]. Proof: Complete mathematical development at [1-7]. The extent geometrical elaboration of Omega Factor is shown in Figure 1, presented in previous contributions [1-7].
Figure 1: From [refs ], the geometrical exact Omega Factor development. Analytical geometry calculations are rather laborious, [1-7,16-23]. This image is included from previous studies because it shows clearly the Omega Factor geometrical analytic method.
The integral equation for AAA in water with 3D AEF Omega Factor [Ω]F is as follows,
where parameter A is defined for WF [30,31] as,
A = exp[-μW L x (sinα/ (cos (α + φ)) ) ]. Parameters μW (WF material parameter), α (WF angle) and φ (photon-beam divergence angle) are defined at [1-11,20,21]. Development of Equations 1-4 are extensively presented in [1-7]. Finally, the solution, exact, complete, geometrically corrected with Omega Factor, and analytical of this integral equation [Casesnoves, 2015, April, Philadelphia], reads,
Software-Programming Method
The computational method is based on previous software works [1-8,16-23]. This integral equation complete analytical solution, Eq. 5 will be correctly simulated in dosimetry-matrices from 100 x 100 dimensions to 1500 x 1500 dimensions in the following sections and compared with simulations of equations [11-15] of classical AEF [1-7] in AAA model foundations. Further development of Equations 1-5 is extensively presented in [1-7,16-23]. Table 1 shows numerical values implemented for algorithms programming. Table 1 shows the main numerical data for the 3D simulation graphics. The magnitude of Omega factor is about 1.12, for a WF of 15 degrees, and increases with the WF angle till 45° [1-7,16-23]. Note that this apparently small value of Omega Factor becomes propagated by multiplication other constants in formulation and the result is a change of 3D dose delivery magnitude as shown in imaging simulations.
The structure of the program comprises the summatory of every part of Eq. 5. Firstly, these parts of erf functions are set independently one by one. Secondly all of them are summed. Finally, the resulting numerical values are set in the imaging subroutine. These individual erf parts are proven in Table 2. In this study, they can be implemented in Matlab, GNU-Octave, or Freemat. Every system requires an specific modification of the main program to obtain correct simulations. Imaging processing tools and subroutines/options vary in every system. Table 1 shows all the implementation data with corrections from Section 3. Table 2 shows the new model functions [ based in erf function parts for WF] adjusted/improved for setting the new functional software.
Table 1: AAA model main parameters for 3D Graphical simulations [1-7, 9,10,11, 54, 55].
Note: Data from AAA algorithm foundation in water, [9,54,55], whose numerical computational software used for constants and parameters optimization was Monte Carlo Code EGS-4 and curve fitting MAAFS from CERN (European Union Center for Nuclear Research).
Table 2: Program software parts numerically calculated for Eq. 5 with new corrections [1-7,9,10,11,16-23,54,55]. The data from Section 2, Table 3, was implemented.
I(z) Corrections for AAA Model
After the AAA model foundation, several I(z) important corrections were developed by Ulmer and Harder [9]. Additionally, during 2008-15, a series of geometrical improvements for WF were published [Casesnoves, 1-7,16-23]. These are Omega Factor, Eq. 3, exact path through WF and limit angle for photon-beam through WF [1-7,16-23]. Omega Factor extent calculations and analytical geometry are shown in (Figures 1 & 2). The I(z) corrections were numerically important as I(z) magnitude varied in one magnitude order less. Namely, from 10-11 till 10-12. The corrections were mathematically done, [9], by an exponential-fit in the function I(z) as follows,
Figure 2: From [1-7], geometrical difference/error-path when using 2D approximation compared to 3D determination. If we take always the AEF approximation of Eq.2, in the sagittal plane, there is an error for less magnitude (blue brackett) in the pathdistance through the wedge. The geometrical exact Omega Factor development. Analytical geometry calculations are rather laborious, [1-7,16-23]. This image is taken from previous publications for paper understanding clarity.
where parameters A, B, a, b, are graphically shown in [9] related to depth-parameter z. Function constants σk(z) were found with no significant numerical differences in photon spectrum [9]. As a result, from this numerical modification, it was found that l(z) changes by up to 0.7 % in the I(z) maximum and up to 5 % at large depth. Table 3 shows these corrections implementation for the 3D simulation study here, with one magnitude order difference [1- 7,9,16-23]. In these simulations fluence [10,11] is set as (particles number/cm2 /Gy). Hence, the numerical modification for fluence factor (FF) magnitude, according to Eqs. 1-5, (Tables 1 & 2), is significant [10,11]. That is, FF ϵ [ 4.16 x 10⁹, 2.82 x 10¹⁰], and it is taken the average. Just remark that the objective of the research is to demonstrate utility and efficacy for clinical/research 3D Graphical Optimization with several systems, not a dose-delivery extremely precise calculation [32-55]. However, acceptable numerical dose delivery data were obtained, (Figures 3-12).
Figure 3: Matlab simulation 3D image for 18Mev photon-beam at 15 cm depth-dose with Omega Factor and I(z) corrected. Fluence magnitude according to Section 3. Matrices for Image Processing have about 103 elements. Imaging Processing Method 1.
Figure 4: Matlab simulation 3D image for 18Mev photon-beam at 15 cm depth-dose with Omega Factor and I(z) corrected. Fluence magnitude according to Section 3. Matrices for Image Processing have more than 103 elements. Imaging Processing Method 2.
Table 3: I (z) and Fluence numerical corrections [1997,9] related to [54,55,1995-6]. Note the one magnitude order significant difference. This factor has significant influence in photon-dose delivery with/without beam modification devices.
Figure 5: Matlab simulation 3D image for 18Mev photon-beam at 15 cm depth-dose with Omega Factor and I(z) corrected. Numerical data that can be obtained, pictured inset, with image processing method. Relative dose in one-percent, at Z axis, X coordinate at WF, Y coordinate at WF, and program part relative dose. Fluence magnitude according to Section 3. Matrices for Image Processing have about 103 elements. Imaging Processing Method 1.
Figure 6: Matlab simulation 3D image for 18Mev photon-beam at 15 cm depth-dose with Omega Factor and I(z) corrected. Numerical data that can be obtained in simulation comprises four dimensions. Namely, relative dose in one-percent, X coordinate at WF, Y coordinate at WF, and program part relative dose. Fluence magnitude according to Section 3. Matrices for Image Processing have about 103 elements. Imaging Processing Method 1.
Figure 7: From [1-7], comparative Matlab simulations 3D image for 18Mev photon-beam at 15 cm depth-dose with/without Omega Factor. Matrices for Image Processing have 106 elements. Computational-Graphical simulation-proof of virtual dose error caused by 2D approximated integral equation solution. This simulation is important, because it proves sharply the virtual dose error that is given by the AAA algorithm when using AEF in 2D. That is, the planner system calculates a higher dose compared to the true dose, and this error causes under-dosage on the tumor. On the opposite, 3D planning with Omega Factor results in more precise dose for radiotherapy optimization -with the significant mention that all these calculations and simulations are carried out in water with the foundation AAA model. The simulation is done in the thick part of the wedge, because recent advances have been useful to find a difference in the sign of angle φ1 for the thin half of the WF –this extent analytical-geometry calculation will be explained and simulated in next contributions. The most important objective of this article was to demonstrate the correct approximations and mathematical development together with the computational proof that validates the difference of magnitude between 2D AAA in water and 3D with Omega Factor dosimetry in the same conditions. Note that this picture belongs to former publications without numerical Section 3 corrections.
Figure 8: GNU Octave simulation 3D image for 18Mev photon-beam at 15 cm depth-dose with Omega Factor and I(z) corrected. Fluence magnitude according to Section 3. Matrices for Image Processing have more than 103 elements. Imaging Processing Method 1. Image has suitable quality. Running time is longer [ ≈ 20 s ] than Matlab. Software design is very similar.
Figure 9: GNU Octave simulation 3D image for 18Mev photon-beam at 15 cm depth-dose with Omega Factor and I(z) corrected. Fluence magnitude according to Section 3. Matrices for Image Processing have more than 103 elements. Imaging Processing Method 2. Image has suitable quality. Running time is longer [ ≈ 30 s ] than Matlab. With Method 2, the program setting for labels are different.
Figure 10: From ref [54], it is sketched a graphical composition from its Figure 5 [Ulmer and Harder 1996]. In this 2D simulation, with non-corrected I (z) function, the dose for WF,18 Mev, at z=20.3 cm (deeper than 15 cm) is around 50% of maximum dose. Numerical 3D Graphical simulations for this study show a dose of about 20% related to maximum dose with I(z) adjustments. In addition, when field size increases, as it is here [ 12 x 12 cm], compared to [-3 , 3], the relative dose generally decreases. Therefore, it is straightforward to guess that approximations of the numerical and imaging software/model are acceptable. Important remark: the very good image/simulation from Ulmer and Harder [54] has a numerical inconsistency at coordinate x=0. That is, the dose at center through WF of different angles cannot be exactly equal. The probable reason is that in the graphical sketch the points at around (-3) and (+3) were matched with curves. That caused quality of dose for different angle WF at x=0 and along D axis.
Figure 11: Freemat simulation 3D image for 18Mev photon-beam at 15 cm depth-dose with Omega Factor and I(z) corrected. Fluence magnitude according to Section 3. Matrices for Image Processing have more than 103 elements. Imaging Processing Method 2 [the unique possible in Freemat]. Image is good but slow to obtain, 102 scale factor at Z axis was necessary to get a visible 3D image—that is, expressing dose in percentage. Running time is longer [ ≈ 40 s ] than Matlab and GNU-Octave. With Method 2, the program setting for labels are different. The imaging processing tools are much slower/difficult than Matlab and GNU-Octave. Color and program parts definition are worse than Matlab and GNU-Octave. Relative dose is not higher than 20% maximum dose.
Figure 12: Different view from Fig 11, for showing program parts. Freemat simulation 3D image for 18Mev photon-beam at 15 cm depth-dose with Omega Factor and I(z) corrected. Fluence magnitude according to Section 3. Matrices for Image Processing have more than 103 elements. Imaging Processing Method 2 [the unique possible in Freemat]. Image is good but slow to obtain, 102 scale factor at Z axis was necessary to get a visible 3D image—that is, expressing dose in percentage. Running time is longer [ ≈ 40 s ] than Matlab and GNU-Octave. With Method 2, the program setting for labels are different. The imaging processing tools are much slower/difficult than Matlab and GNU-Octave. Color and program parts definition are worse than Matlab and GNU-Octave.
The model that is implemented in simulations is the original AAA one with Omega Factor [Casesnoves, 2015, 1-7,16-23] WF geometrical correction for water. This model is the base for further developments carried out in foundations [9,54,55]. Besides and later on, superposition-convolution analytical models for proton therapy emerged from this AAA mathematical framework [12]. Among them, tissue inhomogeneities, scatter radiation, or contaminating electrons [9-11]. That is, primary photons and extra-focal photons, scattered in the flattening filter or the beam collimator, flattering filters, jaws, blocks, multi-leaf collimator, and the group of direct dose delivery beam modificators, such as WF, satellite filters, shielding blocks, rectangular satellite filters, etc [14,8-11]. According to all these physical constraints, in practical clinical medical physics treatment planning implementation dose is calculated,
3D MATLAB WF Simulations Results
This section shows the Matlab results for 3D Treatment planning Optimization images and numerical data, (Figures 3-7) with two software methods. (Figure 7) is a comparative sketch to clarify the difference of dose between classical AAA equations and equations modified by Omega Factor [1-7]. The fourth dimension of photon dose is explained in (Figure 6).
3D Gnu-Octave WF Simulations Results
This section shows the GNU-Octave results for 3D Treatment planning Optimization images and numerical data, (Figures 8-10) demonstrates and explains the numerical results acceptable precision. Two software methods are shown. Figure 10 is a comparative sketch with [55] to clarify the small difference of dose between classical AAA WF simulations equations and these 3D imaging simulation results.
3D Freemat WF Simulations Results
This section shows the Freemat results for 3D Treatment planning Optimization images and numerical data, (Figures 11 & 12). For these imaging simulations, Freemat is not as much suitable than Matlab abd GNU-Octave.
Comparative Evaluation
Table 4 shows a comparative assessment for the applied systems. In terms of practical visualization, all systems can be considered acceptable. However, MATLAB makes the best and fast images with data adquisition facilities. The lowest is Freemat, and for this system it is necessary to scale the axes magnitudes to display suitable images. The factor of personal preferences of the programmer for system choice can be considered also. Freemat has exclusively one subroutine imaging option for this 3D simulations.
Clinical Medical Physics Applications
Table 5 shows a resume of principal applications of the results and software methods. Extrapolated applications, e. g. IMRT or IMPT, can also be guessed for future clinical/research radiotherapy developments.
Table 4: Assessment of the selected systems for 3D imaging simulations.
Table 5: Radiotherapy Medical Physics study applications.
Discussion and Conclusion
This study has shown advantages/inconvenients for 3D computational simulations of WF dose delivery with a 18 Mev photon beam at 15cm depth-dose with three computational software-systems. These 3D simulations are corrected in approxitions for several reasons. I(z) important corrections were set in software codes [9]. Fluence has also been modified for better [10,11]. Others are Omega Factor, Eq. 3, exact path through WF and limit angle for photon-beam through WF [1-7,12-19]. In terms of practical visualization, all systems can be considered acceptable. However, Matlab makes the best and fast images with data adquisition facilities. The lowest is Freemat, and for this system it is necessary to scale the axes magnitudes to display suitable images. MATLAB provides with good-quality images, and is considered the best system for these type 3D simulations.
GNU-Octave visualization and 3D plots for photon-dose delivery is good also, while Freemat can be considered a bit more difficult and slower. However, in general, all systems studied are considered acceptable. The selection of any of them depends on computational facilities, programming skills, and image-quality/ vision processing requirements. Tissue inhomogeneities, scatter radiation, or contaminating electrons modifications for 3D graphics have not been applied. The study has proven that there are multiple computational systems to simulate 3D WF conventional photon dose delivery with AAA model—and extrapolation to other models, included IMRT and IMPT. Matlab, GNU-Octave, and Freemat are suitable systems in order of acceptable functionality. High-quality 3D imaging processing methods were proven. 4D image settings constitute an innovation compared to previous contributions [1-7,12-19]. For simulations of dose delivery without beammodification devices, the method is also useful/efficacious.
MATLAB and GNU-Octave shows 2 types of imaging subroutines, while Freemat only one. Medical Physics applications are theoretical and clinical-practical. Theoretical ones involve research in TPO, simulations, implementation in software planning systems, LINAC calibration improvements, photon-dose theoretical-experimental fitting, development/comparison of new optimization methods, and several others. Clinical-practical comprise TPO routine work, clinical medical physics improvements for service functionality, training in delivery simulations, etc. In summary, this imaging radiation therapy WF study shows modern systems for 3D photondose simulation. Imaging processing and computer vision methods are demonstrated. Multiple applications in Clinical and theoretical Medical Physics and Bioengineering emerge from the results.
Scientic Ethics Standards
This contribution is based on Graphical Visualization and Software Optimization methods for radiotherapy modelling improved from previous articles [1-7,12-19]. Graphical- Optimization Methods were created by Francisco Casesnoves in December 2016. The image processing and computer vision tools programs and special software to obtain new dosimetry images positioning, panoramic vision, enhancement of selected WF dose-deposition parts, or imaging tiles optimization was originally developed by author in Matlab, GNU-Octave and Freemat. This advanced article has a few previous paper formulation information, [1-7,12-19], whose inclusion is essential to make the contribution understandable. (Figures 1, 2 & 7) were taken for essential understanding from [1-7,12-19]. This study was carried out, and their contents are done according to the European Union Technology and Science Ethics. Reference, ‘European Textbook on Ethics in Research’. European Commission, Directorate-General for Research. Unit L3. Governance and Ethics. European Research Area. Science and Society. EUR 24452 EN. Also based on The European Code of Conduct for Research Integrity. Revised Edition. ALLEA. 2017. Revised Edition. ALLEA [27,28].
The applications section has some mandatory words from previous contributions. This research was completely done by the author, the software, calculations, images, mathematical propositions and statements, reference citations, and text is original for the author. When a mathematical statement, proposition or theorem is presented, demonstration is always included. The Omega Factor demonstration is not included as it is rather large and can be found at [1-7]. The primary Omega Factor calculations were obtained during MSc Thesis in 1999. The article is exclusively scientific, without any commercial, institutional, academic, political, religious, or economic influence. When anything is taken from a source or previous contribution, it is adequately recognized [29-59].
Frequency of Blood Glucose Monitoring in Relation to Glycemic Control in Patients with Type-2 Diabetes
Introduction
Diabetes is among the principal sources of morbidity and mortality around the World. Diabetes prevalence has been increased from 108 million cases in 1980 to 422 million cases of diabetes in 2014, and this trend of increasing burden has been speculated to raise from 425 to 629 million diabetic people from 2017 to 2045 [1]. Diabetes is among the major health problems facing the human population around the world today. It also poses economic problem because it is estimated that 10% of National Health Service (NHS) expenditure is spent on diabetes which is equal to £1 million per hour. Presently, 2.3 million people have been reported with diabetes and above 500,000 people with type-2 diabetes are not aware of their diabetic status. It is expected that more than 4 million people will have diabetic till 2025 and probably a large number those will have type-2 diabetes, leading to an increase in aged, overweight and obese individuals. It is alarming that growing unhealthy lifestyle has been a key reason of type-2 diabetes, once observed only in the over-40s, being diagnosed in a increasing number of younger people and even children [2]. Diabetes is manifested when blood glucose concentration reaches the higher level than normal blood sugar level. Blood sugar is a main source of energy found in foods which we eat. Insulin is hormone which is made by the pancreas which facilitates glucose from food get into cells for its use as energy. At times body doesn’t make sufficient or any insulin or doesn’t use insulin properly, then glucose remains unused in blood and doesn’t enter cells.
Three types of diabetes are commonly found as type-1, type-2 and gestational diabetes. In type-1 diabetes the body doesn’t make insulin and the patient immune system attacks and damages those cells in pancreas which are responsible for making insulin. Type-1 diabetes is typically detected in children and young adults, though it can appear in every age. Individuals in type-1 diabetes need to take insulin every day for his/her survival. In type-2 diabetes, which is most common type of diabetes the body doesn’t produce or use insulin properly. Type-2 diabetes can start at any age, even during childhood. However, this type of diabetes takes place mostly in middle-aged and older people. Gestational diabetes is caused in certain women when they are pregnant. Most of the times, this form of diabetes goes away after the birth of baby. There are some other less common types of diabetes including monogenic diabetes, which is an inherited form of diabetes, and type of diabetes associated with cystic fibrosis [3]. Type-2 diabetes has a number of causes but most important are known as genetics and lifestyle, but the combination of both factors can create insulin resistance, when body doesn’t use insulin as it should. Insulin resistance mostly causes type-2 diabetes. Genes do play important role in type-2 diabetes, but lifestyle also play important role. Lifestyle choices that affect the development of type-2 diabetes includes lack of exercise, unhealthy meal planning choices, overweight or obesity [4]. Some risk factors of diabetes include being overweight or obese, hypertension (high blood pressure), and low level of “good” cholesterol (HDL), elevated level of triglycerides in blood, sedentary lifestyle and family history of diabetes. Symptoms of diabetes include increase urination, excessive thirst, weight loss or gain, hunger, fatigue, skin problem, blurred vision, nausea, vomiting etc. Diabetes can cause microvascular (damaged to small vessels) and macrovascular (damaged to large vessels) diseases [5].
Self-monitoring of blood glucose (SMBG) refers to check blood glucose of diabetic patient at home. SMBG is an important modern therapy of diabetic patients. It is used to attain a specific level of glycemic control and to avoid hypoglycemia. The aim of SMBG is to gather detailed information about blood glucose concentration at various times. SMBG can be used to help in the fixing of a therapeutic regimen in response to blood glucose values and to assist individuals in adjusting their dietary intake, physical activity, and insulin dosages to improve glycemic control on a daily basis [6]. SMBG can be measured by strips or by glucometer before meal (fasting blood sugar, FBS) or anytime (random plasma sugar, RBS). Hba1c refers to glycated hemoglobin is actually the protein in the RBCs carrying oxygen all over the body joins with glucose and become glycated. Through measuring hba1c we are able to get the whole status of average blood glucose level over a period of weeks/ months. The normal Hba1c is below 42mmol/mol or below 6.0%. Prediabetics have 42-47mmol/mol or 6.0%-6.4% and diabetic have 48mmol/mol or over and/or 6.5% or over. There is a difference between hba1c and blood glucose level. In hba1c we know about the how high sugar level has been over a period of time, it provides a longer-term trend. While blood glucose, is the concentration of glucose in blood at a single point in time. It is measured as FBS and RBS [7]. Study reported that that SMBG concentration is linked with improved glycaemic control in patients and rise in rate of SMBG with growing HbA1c value was proportional to the higher ratio of insulin- treated patients in higher HbA1c categories [8,9]. Also, the better quality of metabolic control demonstrating self-monitoring of blood glucose improved glycemic control in the majority of non– insulin-treated and also insulin treated type-2 diabetic patients [10-12]. Studies have reported that substantial numbers of diabetic patients have poor glycaemic control and older age, duration of diabetes, poor dietary habits, rural lifestyle, poor medication and low education are the eliciting elements of poor glycaemic control [13-15]. Inadequate glycaemic control prevailed in the majority of aged Pakistani diabetic subjects. SMBG levels have been reported to be associated with clinically and statistically improved glycaemic control irrespective of diabetes types or therapies. Eliciting factors of poor glycaemic control and increase awareness on the significance of SMBG and strongly promote this practice among diabetic patients should be taken seriously by the healthcare authorities in targeting multidimensional interventions to accomplish good glycaemic control [8,9]. In the year 2017, about 6.9% (7,474,000 individuals) of the Pakistani population were suffering from diabetes and the country was on 10th position (projected to be on 8th position in 2045) among high burden diabetes countries all over the world [1]. Numerous studies on SMBG have been done in different countries and also in Pakistan but there is no such study conducted in Mardan district of Khyber Pakhtunkhwa province (KP) in Pakistan [8,9]. Therefore, the present study is aimed at investigating the association between blood glucose, measured as Hba1c and frequency of SMBG in diabetic patients from Mardan Pakistan [16].
Materials and Methods
Study area: This study was conducted in District Mardan of Khyber Pakhtunkhwa. Data were obtained from patients with diabetes from District Mardan. The Mardan city is on 23rd position in the list of big cities of Pakistan and the second largest city of Khyber Pakhtunkhwa with human population size of 331,837. Mardan is located in the southwest of the district at 34°12’0N 72°1’60E and at altitude of 283 metres (928 ft). An economic zone is planned as a part of the multi-billion-dollar China-Pakistan Economic Corridor (CPEC) near Rashakai. Mardan features a hot semi-arid climate. The average temperature in Mardan is 22.2°C, while the annual rainfall averages 559 mm. (https://en.wikipedia.org/wiki/Mardan).
Study Population
The data were collected from 100 diabetic patients of Mardan including male, female and children related to different age groups. These patients were suffering from type-2 diabetes. Data collection: Data were collected from the patients of diabetes diagnosed in Mardan Medical Complex, private clinics and private hospitals in District Mardan. during January 2019 to March 2019 through convenience survey. Information was obtained by structured questionnaires on diabetes therapy and blood glucose self-monitoring. All the participants were briefed about the study and then their written consent was obtained. All the subjects were subjected to interview for filling the questionnaire proforma regarding the study. Data regarding glycemic values, socio demographic and clinical characteristics of the patients were recorded. All those subjects with severe illness, having accidental physical disabilities, unable to comprehend this study, those having life threatening diseases and those suffering from cholera, dengue or malaria.
The Questionnaire Proforma Encompassed the Following Parameters
General Information: Patient name, age, gender, weight, ethnicity, type of diabetes, duration of diabetes, diabetes therapy, fasting plasma glucose, random plasma glucose, Hba1c.
Additional Information: Family history, additional disease with diabetes, allergies, hypoglycemic episodes, education, income and employment.
Study Variables: These variables included glycemic control parameters including FPG, RPG and HbA1c. Socio-demographic and clinical features, depression, cognitive status, physical status, weakness, nutritional status, pain and level of self-care were independent variables. The target value for HbA1c was <7%, FPG was 80–130 mg/dL and RPG was <180 mg/dL [17]. Subjects having HbA1c, FPG, and RPG levels above the upper threshold of the target levels were declared as having poor glycemic control.
Statistical Analysis: SPSS version 21.0 was used for statistical analyses of collected data. Descriptive statistics and bivariate correlation were applied. Mean and standard deviation were computed for quantitative variables. Qualitative variables were subjected to frequencies and percentage analyses.
Results and Discussion
Descriptive analysis showed that age of subjects was between 15-81 years with mean ± SD as 47.2±15.7. almost equal number of subjects belonged to urban (52%) and rural (48%) areas. Most were females (60%) subjects, and 82% subjects were suffering from years. Overall, 44% of the patients used to check their diabetes less than twice a week and 22% check their diabetes once daily. Stratification for frequency and percent of patients who test their FBS and RBS was 82% and 89% among which some people couldn’t test either FBS or RBS. The recorded FBS value was 53-345mg/dl with mean ± SD of 164.6±58.4 and of RBS was 50-560mg/dl with mean ± SD of 263.7±97.2. The frequency of hba1c was 80 with recorded value of 4.20-16.90% and mean ± SD was 10.9±23.8. Most of the people (67%) used medications along with insulin from years. Maximum of the (52%) people were not following diet to control it. Majority of the patients (78%) had high blood sugar. Weight of the patients was between 30-115kg with average between 60-70kg. Most (67%) subjects were not doing regular exercise. Maximum of the patients (73%) were consuming tea 42% showed no family history of diabetes while 40% subjects had one parent affected and 18% had both parents affected. Most of the patients (98%) had other problems like vision problem, nausea, numbness etc. Sixty percent subjects were literate with majority of unemployed, and 55% were middle class (Table 1). By using bivariate correlation, we performed Pearson correlation coefficient. The values p˃0.05 and p˃0.01 show significant linear relationship. From this correlation analysis a linear relationship between age and weight was determined as well as between gender and SMBG, insulin, diet and weight. There was no correlation between SMBG and Hba1c (Table 2).
Table 1: Descriptive Statistics of factors associated with diabetes.
Table 2: Bivariate correlation among the study variables.
In past few decades, huge rises in diabetes prevalence have been confirmed in almost all areas of the world, with 415 million people worldwide now living with diabetes [17]. Diabetes is among the metabolic disorders characterized by elevated blood sugar levels for a long time period. Diabetes afflicts various complications like diabetic ketoacidosis, hyperosmolar hyperglycemic state, or death. Other severe complications can be cardiovascular disease, stroke, chronic kidney disease, foot ulcers, and eyes damage. (https:// en.wikipedia.org/wiki/Diabete). In 2000 the global prevalence of diabetes was estimated to be 151 million by International Diabetes Federation (IDF). In 2003 the number reached to 194 million, in 2006 the number increase to 246 million, in 2009 it reached to 285 million, in 2011 it increased to 366 million, in 2013 it reached to 382 million, in 2015 it reached to 415 million. In recent study it was estimated that in 2017 about 425 million cases of Diabetes in age group 20-79 years throughout the globe, If the age range is increased to 18-99 the estimated case of diabetes rises to 451 million, the number of diabetes cases are increased day by day and reached to 629 million people for age range 20-79 years [17].
According to a recent study in Pakistan, 11.77% prevalence of type-2 diabetes mellitus has been recorded. Males were more affected (11.20%) than females (9.19%). Likewise, this trend was reported in 3 provinces of Pakistan as well reporting 16.2%, 12.14% and 13.3% prevalence in males as compared to females as 11.70 %, 9.83% and 8.9% respectively in Sindh, Punjab and Baluchistan province respectively. While in Khyber Pakhtunkhwa (KP) Province, females (11.60%) were more affected than males (9.2%). This prevalence was higher in urban areas (14.81%) as compared to that reported from rural areas of Pakistan (10.34%) [18]. In our study we focused on the frequency of blood glucose monitoring in relation to glycemic control in patients with type- 2 Diabetes. This kind of study was first reported from Scotland by Evans et al. [10] to investigate patterns of self-monitoring of blood glucose concentration in diabetic patients and to determine whether frequency of self-monitoring is related to glycaemic control. Further studies are conducted in different countries. In Pakistan similar study has been reported from Agha Khan University Karachi by Khowaja, et al. [8], to explore the association between selfmonitoring of blood glucose (SMBG) levels and improved glycaemic control (HbA1c level) among type-2 diabetic patients.
Our study revealed that 89% subjects were suffering from type- 2 diabetes, 5% from type 1 diabetes, 1% from gestational and 5 from other types of diabetes. Out of 100 cases 40% were male and 60% were female. Stratification for frequency of normal blood glucose in patients suffering with diabetes mellitus with regards to duration of diabetes mellitus was recorded which shows that out of 100 cases 82 subjects have diabetes from years, 15 have from months and 3 subjects have diabetes from days. Overall, 52% belonged to urban areas and 48% from rural. Frequency of Hba1c was 80%. Seventy nine percent did not develop any types of allergies. The normal blood glucose in patients suffering with diabetes with regards to financial status shows that out of 100 cases 10% were of lower class (10,000-20,000), 60% were of middle class (20,000- 40,000) and 30% were from upper class (> 40,000). Frequency of control of blood glucose in patients suffering with diabetes mellitus with regards to educational status showed that 60% patients were literate, and 43% were employed. By using bivariate correlation, we performed Pearson correlation coefficient. Basically, this was performed the extent to which two variables are linearly related. The value p˃0.05 and p˃0.01 show significance. From this correlation we found that there is significance association between age and weight. There is also significance link between gender and SMBG, insulin, diet and weight. According to frequency of and time of doing SMBG, the results of the participants who did SMBG were above or below the target for glycemic control. This means that doing SMBG is not currently associated with better glycemic control. There is no liner relationship between self-monitoring blood glucose and Hba1c.
Evans et al. [10], have reported a direct relationship of haemoglobin A1c level with the number of strips collected during previous 6 months in diabetic patients. They have not found any association of HbA1c level and SMBG in diabetic patients using insulin. It may be due to the fact that SMBG is more effective in true insulin deficiency unlike the insulin resistant state. Or diabetic patients might have no aware of insulin use, more worried about the risks of hypoglycaemia, and hence less likely to act on the results of tests. Our study is similar to Harris [11] who evaluated the association of SMBG and HbA1c. They reported no such association between the frequency of SMBG and HbA1c level of those diabetic patients treated with insulin, oral agents, or diet alone. More educated, having a diabetes patient education class, and frequent visitor to physician were found frequently practicing self-monitoring. However, SMBG was not associated with higher economic status or to having health insurance. Our study was quite contradictory to the study of Khowaja and Waheed [9] because they examined that self-monitoring of blood glucose concentration is associated with improved glycaemic control, which prevents complications resulting from diabetes. Their study indicated that there was a significant association of self-monitoring of blood with glycaemic control. It was contradictory may be because their sample size was 5 times higher in number than our study samples. Davis, et al. [15] also determined, like our study that both cross-sectional and longitudinal Fremantle Diabetes Study (FDS) data revealed that Hba1C was not statistically different between SMBG users and nonusers. This study is also similar to Alzahrani, et al. [18] establishing that the results of the patients who followed SMBG were beyond the target for glycemic control which reveals that SMBG is not linked with improved glycemic control. In our study we do not support the association of SMBG to glycemic control. The results of our study reveal that SMBG is important, but it also indicates that majority of subjects were checking their blood sugar occasionally. It was also observed that participants doing SMBG, were managing their diabetes well and self-monitoring may be recommended particularly in those patients who are the most difficult to control.
It is established that education and economic status are also the possible effect modifiers for controlling the blood glucose levels. Besides regular checking of blood glucose, lifestyle reform also needed to be done in diabetic patients including diet and regular exercise. The results of this study may be handy for creating awareness of blood glucose control during diabetes ultimately reducing the morbidity level in due to diabetes [19].
Conclusion
According to the result of our study, regular self-monitoring in patients with diabetes is uncommon and the self-monitoring of blood glucose is not associated to glycemic control among type- 2 diabetes. There is a lack of knowledge about SMBG and Hba1c testing and control in public.
Premature Mortality due to Breast Cancer in a Mountainous Province of Vietnam from 2005 to 2018
Abstract
Objectives: To describe the time trend of esophageal cancer (EC) mortality that occurred in Nghe An province during 2005-2014.
Methods: Mortality due to EC and all causes were annually collected from the A6 death register system using the “Validated mortality registration forms” from 2005 to 2014. There was a mandatory monthly active mortality registration by 480 state health stations following the A6 death register system. Age-standardized rates (ASR) of mortality and mortality rate ratio and 95% confidence interval (MRR (95%CI)) by time-period were estimated.
Results: Among 140,670 reported deaths, 639 were due to EC (Men 527, women 112). The mortality rate (WHO-ASR) per 100,000 was 4.70 in men and 0.77 in women, giving the men to women ratio was 6.1. Mortality from EC was significantly increased during the 10 years, 2013-2014 vs. 2005-2006, MRR (95%CI): 2.79 (1.95, 3.99), p for trend < 0.05.
Conclusion: We observed an increased time trend of mortality due to EC; men are responsible for over 80% of this fatal disease, therefore, a program of primary and secondary prevention against EC focused on men is highly needed in the Nghe An province.
Abbreviations: EC: Esophageal Cancer; HDI: Human Development Index; SHS: State Health Stations; ALDH2: Aldehyde Dehydrogenase 2; MRR: Mortality Rates Ratio; CI: Confidence Interval
Introduction
Breast cancer has been worldwide recognized to have a high mortality rate among women despite wide variations in ethnicity, culture, and economics. It was reported that breast cancer is the most commonly diagnosed cancer among women in 140 of 184 countries worldwide [1]. More than one million new cases of female breast cancer are diagnosed each year. Approximately one in 4 of all new cancer cases diagnosed in women worldwide are breast cancer, followed by 6.6% of cancer death in 2018 [2]. The breast cancer mortality rate has been substantially increasing in the world during the past 25 years [3]. According to the American Cancer Society, the overall breast cancer incidence rates increased among Asian/ Pacific Islander (1.7% per year), non-Hispanic back (0.4% per year), and Hispanic (0.3% per year) [4]. In China, mortality from breast cancer rose progressively during the past three decades in both rural and urban areas [5]. An estimated 268 600 women were diagnosed and 69 500 died of breast cancer in 2015, accounting for 15.1% of all new cancer cases and 6.9% of all cancer deaths in Chinese women, respectively [6].
Vietnam, situated in Southeast Asia, is a developing country with a GNP per capita of USD 2,540 in 2019. Social health insurance is voluntary of approximately US$20.00 per annum, which is paid by individuals and their households. In Vietnam, breast cancer is reported to be the most common cancer in Vietnamese women [7]. There were 15,229 cases of breast cancer were diagnosed in 2018, accounting for 5.3% of all cancer deaths [2]. In response to this situation, the Vietnamese government has introduced nationwide breast self–examination education as the method for early detection [8]. Moreover, the usage of mammography and hormone therapy for patients with estrogen-receptor-positive breast cancers has been improved the life expectancy of patients with breast cancer [9]. However, lacking population-based studies about this fatal disease hindered the establishment of focused primary prevention strategies. The mortality rate is a basic and critical indicator for the development of appropriate and effective intervention programs and monitoring the health of patients with breast cancer. Lang Son is a mountainous province in the Northeast region with a natural area of 8,187.25 km2, bordering Guangxi province in China.
The population of the province in 2019 is 782,811 people, mainly living in rural areas (accounting for 80.7%). Lang has a high proportion of ethnic minorities (84.74% of the province’s population). Currently, there are 30,583 poor households, accounting for 15.83%; 21,267 near-poor households, accounting for 11.01% [10]. Having these geographic economic conditions, Lang Son province is considered as the representative of mountainous provinces in Vietnam where the citizens have a limited chance to approach high-quality health care services. In this context, this study was conducted to clarify the status of breast cancer mortality in Lang Son province from January 2005 to December 2018 to provide an updated and comprehensive understanding of recent trends of breast cancer mortality in this province.
Material and Methods
Study Design and Data Source
This is a population-based study of the time series of deaths from breast cancer of women living in Lang Son province. The data was collected in two steps. At first, the mortality information was recorded in an official book referred to by The Ministry of Health’s death recording systems (A6) managed by the Lang Son CDC. The A6 mortality systems were validated and presented to be a reliable and feasible system for mortality recording [11]. These unique systems were introduced to be used nationwide in Vietnam in 1992. All deaths occurring in the communities were registered at the state commune health stations. The data from the A6 was collated and determined monthly by the head of the state commune health stations who in turn forward the information every year to the Lang Son CDC from 2005 to date to develop a database of mortality there. Five indicators included the case’s ID, age, sex, date – place – cause of death, and ICD-10 coding. To prevent duplicate records, the head of the commune health station, trained medical workers, followed carefully the medical care for each morbidity case for each resident for at least 6 months until the outcome was identified. By this follow–up process, all deaths in the list have described the cause of death based on medical records. Besides, data on population was collected with careful cross-check with several independent information sources such as the departments for provincial statistics, the department of Population – Family – Children, the Committee of Family and Planning. We included all cases that were dead of breast cancer from January 2005 to December 2018, ICD-10: C50 for the present study. The Lang Son population-based mortality registration covered over 226 state commune health stations of 11 cities/districts of the province. The average resident number of each state commune health station was annually collected by the Lang Son CDC.
Data Analysis
Data was reviewed and cross-checked between information sources, cleaned, encoded, and reported by Excel software, analyzed by STATA 15.0. For the calculation of the mortality rates of breast cancer, the ratio was determined between the number of deaths from breast cancer in women and the female population in that year, multiplied by 100,000. The world population structure and the Segi’s world population standard were used to estimate agestandardized mortality rates per 100,000 (ASR). Mortality rates ratio and 95% confidence interval adjusted for age groups (0-9, 10- 19, 20-29, 30-39, 40-49, 50-59, 60-69, 70-79, 80+) was estimated to observe time trend from 2005 to 2018.
Ethical Approval
This is a population-based study about mortality rate with no interfere with no physical intervention. This information to identify patients including name, personal address, date of birth, would be not published. Moreover, due to the database purpose, which is to provide accessible data to help improve the mortality of breast cancer in the community, the public interest is considered to outweigh personal interests in privacy or autonomy that would otherwise be protected by consent mechanisms. The research protocol was approved by the Hanoi Medical University Review Board in Bio-Medical Research # 61/HMURB, dated 25 November 2008 and by the Board of Ethics in Bio-Medical Research at University of Medicine and Pharmacy at Ho Chi Minh City #106/ UMP-BOARD, dated 20 March 2019.
Results
From January 2005 to December 2018 (missing data for 2009- 2010), there were 210 deaths out of 17,990 women diagnosed with breast cancer in Lang Son province. Table 1 showed the crude mortality rate and the age-standardized mortality rates from breast cancer at all ages between 2005 and 2018. The crude mortality rate of breast cancer was 4.7. After adjusting using the World Health Organization standard population for 2000 – 2025 and the Segi World standard population (in the 1960s), the ASR was 5.2 and 4.7, respectively. Over four-fifths of death cases died under the age of 70 (81.5%). In Table 2, the crude rate and the ASR rate were annually calculated. The lowest ASR per 100,000 person-year was found in 2006 (3.2). The value of 7.0 was the highest ASR that occurred in 2012. When the first two-year 2005-2006 was the reference group, the mortality rate ratio for 2018 was increased, but not statistically significant, age-adjusted MRR, 95%CI: 1.36, 0.78, 2.35, p for trend=0.209, (Table 3). Figure 1 presented the age-specific mortality rate per 100,000 person-years during the study period. The mortality rate was found to be at a low and stable level from the age group 0-9 to the age group 20-29. There was, on the other hand, a rapid rate of increase at the reproductive age, especially at the age group 40 – 59, and slow down after that. The highest specific cancer mortality rates per 100,000 were seen for the age group 60-69. The curve thereafter was seen to be declined (Figure 2).
Figure 2: Age-specific mortality rate per 100,000 person-years in women during 2005-2018 (missing data for 2009-2010) due to breast cancer
Table 1: Mortality due to breast cancer in women during 2005-2018 in Lang Son province & Crude rate per 100,000 person-years; @ Age-standardized rate per 100,000 person-years using the World Health Organization standard population for 2000-2025; # Proportion of death cases aged under 70 year-olds. @ Age-standardized rate per 100,000 person-years using SEGI World standard population (in the 1960s). Missing data for 2009-2010.
Table 2: Mortality due to breast cancer in women by year from 2005 to 2018 in Lang Son province. The estimated proportion of deaths due to breast cancer was 1.17% (210 cases of breast cancer vs. 17,990 total cases) in women. & Crude rate per 100,000 personyears; $ Age-standardized rate per 100,000 person-years using the World Health Organization standard population for 2000-2025; # Proportion of death cases aged under 70 year-olds. Missing data for 2009-2010.
Table 3: Mortality rates ratio and 95% confidence interval by years from 2005 to 2018 in Lang Son province.
Note: ## adjusted for age groups (0-9, 10-19, 20-29, 30-39, 40-49, 50-59, 60-69, 70-79, 80+). Missing data for 2009-2010.
Discussion
We observed a serious prelature breast cancer mortality in the Lang Son province, remote mountainous areas. Female breast cancer has presented at young age women and the proportion of premature death was very high, over four-fifth of total death cases. The result has highlighted the importance of public health policies for better prevention and management of breast cancer screening to reduce premature death in the study population. Moreover, financial support policies should be implemented to promote access to appropriate diagnosis and treatment for women living in disadvantaged areas. After adjusting with the World Health Organization standard population, 2000-2025, the ASR of breast cancer in Lang Son province is 5.2/100,000 during study time from 2005 to 2018. In consistence, the studies in Chinese women living in rural areas, the ASR in 2013 and 2014 of breast cancer were 5.59/100 000 and 5.79/100 000, respectively [6,12]. The ASR of breast cancer of our study is lower compared to one among women living in Ha Noi – the capital of Vietnam in the period from 1996- 2005 and the ASR of breast cancer in Vietnam in 2012, which were as high as 13 and 9.9, respectively [13,14]. Hanoi City is the highest urbanization that can be explained why the breast cancer in this city was higher than in the Lang Son province.
To reduce young age death from breast cancer, the National Cancer Control Programs increasing the awareness of early detection of breast cancer and providing free screening for breast cancer and cervical cancer has been conducted in Vietnam since 2008. There were other several programs such as the “Early detection of breast cancer and cervical cancer in women” program implemented from 2012, the “We care for her” happening in 2013–2014. The Vietnam Women’s Union has representatives at every commune has been also running programs to educate how to do breast self–examination [8]. Moreover, treatment for breast cancer in Vietnam has been remarkably improved recently. Bettertolerated therapies have been replacing ablative surgery and aggressive chemotherapy. Tamoxifen or other hormonal therapies, cytotoxic, and targeted therapies, shown to significantly reduce breast cancer recurrence and mortality in breast cancer patients [15,16], are all available in Vietnam [8]. In addition, the population variation of our study comparing the previous studies might be likely the inducement. Nationwide, Vietnam has many cities in the progress of “modernization”, where women are at increasingly high risk of breast cancer such as decreased parity, delayed childbirth, less breastfeeding which was demonstrated to be risk factors of breast cancer in low–income countries as well as in Vietnam [17,18]. However, these programs have been piloted at the areas of urbanization of the Hanoi and Ho Chi Minh Cities, but that might not be ready in the Lang Son province.
In terms of the trend mortality rates during the study period, there was a non-increasing trend during 2005-2018 but it is suggested to be increasing soon due to many environmental factors and lifestyles of an unhealthy diet, tobacco smoking, harmful usage of alcohol, and lack of physical activities. This result is consistent with previous studies showing the rise of breast cancer mortality in other territories. For instance, according to a global analysis, there was a significant increase in breast cancer mortality rates in all super regions. For total world countries, the mean breast cancer mortality rate was 13.77 per 100,000 in 1990 and the overall increasing slope of the mortality rate was 0.7 per 100,000 from 1990 to 2015 [3]. Another study presented a tendency of increased deaths from breast cancer in Brazilian women, particularly in young women from 1996 to 2013 [19]. In China, the standardized mortality rate of breast cancer was similarly shown to have an upward trend [20]. To improve cancer prevention for Vietnamese women, it is important to establish better public health policies and management of breast cancer, especially in remotes areas. It was reported that the majority of breast cancer patients in Vietnam are detected at the advanced stages [21], which was revealed to be the result of poor knowledge and awareness among the general public [22].
In a study conducted in the mountainous area in Northern Vietnam, the level of knowledge and practice about breast selfexamination, clinical breast examination, breast ultrasound, and mammography were still adverse. Approximately 17% of women mentioned clinical breast examination, and only 13.8% reported practicing breast self-examination [23]. Among women living in one rural district, more than half of all the participants, including both younger (69.5%) and older (53.3%) women, believed that they would not get breast cancer if they took good care of themselves [24]. In central cities such as Hanoi and Ho Chi Minh City, the prevalence of sufficient knowledge and practice breast self–examination among female textile workers were only 22.7% and 15.8% [25]. In this context, increasing awareness about the importance of breast cancer screening and developing early detection strategies for breast cancer is essential. Community education programs and low-cost screening approaches such as clinical breast examination should be conducted widely to ensure the accessibility of all Vietnamese women, especially ones residing in remotes areas. The mammography screening should be suggested in high-risk women according to the age-specific mortality rate results.
Furthermore, the long treatment course of breast cancer has been causing a significant financial burden to the patients, especially the patients without health insurance. A recent study conducted in South East Asia, including Vietnam, showed that 48% of cancer patients incurred financial catastrophe within one year after the diagnosis [26]. It was estimated that the annual medical expenses for breast cancer treatment amounted to 18% of gross national income (GNI) per capita in Vietnam in 2010 ($195 vs. $1,100) [27]. These facts again emphasize the role of breast cancer screening in Vietnamese women since the diagnosis at the early stage can reduce significantly the cost of initial treatment. Besides, the financial burden of the treatment course could be a barrier to seeking care and to appropriate treatment compliance, which may contribute to the higher mortality of breast cancer. Therefore, establishing a policy of universal health insurance coverage along with other financial supports would improve access to medical care and the prognosis of breast cancer patients in Vietnam. The government should give financial support to breast cancer patients whose cost of illness exceeds their ability to pay. Furthermore, a network of primary health care such as home care and community care should be promoted to provide health care services to breast cancer women throughout the country. These settings may improve compliance with treatment and reduce costs for patients in Vietnam, where access to health facilities for cancer treatment has been limited. This combination would encourage the patients to comply with their long-term treatment and thus contribute to reducing deaths from cancers, including breast cancer.
Moreover, the current vertical and central organization of health care services in Vietnam may limit the accessibility of medical treatment for breast cancer patients living in mountainous areas. The lack of surgical oncologists, medical and radiation oncologists, anesthetists, and pathologists at the low level of the health system also has a significant effect on providing comprehensive treatment to breast cancer patients. Authorizing and supporting district and commune health stations with the appropriate health infrastructure and trained healthcare workforce could have a positive impact in terms of reducing in-direct costs for women with low – income to encourage them not to bypass them in favor of seeking suitable treatment as well as in reducing overcrowding in central and provincial hospitals. Breast cancer deaths in our study mostly occurred in reproductive-aged women, increasing rapidly from 40 years old, reaching a peak at the ages of 60-69, and then falling. This result is logical according to one study showing that the breast cancer incidence in Vietnamese women was highest at the age of 50 [21]. Meanwhile, the overall survival rate for breast cancer patients was 85.01 ± 1.61 months [28]. Similarly, according to a study investigating the breast cancer mortality rate in China during 1991 – 2011 showing that breast cancer usually occurs post-puberty, and its incidence increases slowly from 30 years old, reaching a peak at the ages of 40-60, and the first death peak occurring at 55 to 65 years [20]. In this sense, the clinical protocols and public policies that encourage early detection for breast cancer, and the key population should be among women between ages 40 to 65. Breast cancer screening using clinical breast examination for women aged 40 to 55 years was identified to be very costeffective in Vietnam according to the World Health Organization criteria [29]. Another study demonstrated offering the first round of mammography screening to Vietnamese women aged 50-59 years was cost-effective, with the given threshold of three times the Vietnamese GDP per capita [30]. Therefore, breast cancer screening programs need to be provided to women aged 40-65 in the combination of clinical breast cancer and mammography to improve the life expectancy for breast cancer patients as well as reduce the public economic burden.
Several limitations should be noted in this study. Firstly, it was done in only one mountainous province in the North of Vietnam, so the findings may not be generalized to all Vietnamese women. Second, there was a deficit of the information system concerning factors associated with mortality from breast cancer that is restricted in the death record. This study, however, is the first investigation of the mortality rate of breast cancer in the province at a continuous long-term period. The findings presented here were similar to and different from those reported elsewhere. Overall, the results of this study will increase our understanding and guide interventions to improve early screening for breast cancer strategies specifically for Vietnamese women, especially in remote areas, with adverse socioeconomic status. Cancer mortality rates estimated in this study are reliable because there were no duplicate records. At each commune, the head of the commune Health station followed up carefully all fatal cases occurring at his commune while giving medical care and household visiting until the result as neighborhood relationship as well as a duty of the appointed medical worker position. Despite these limitations, the present findings had highlighted the public health problem of premature breast cancer in the low-medium economic countries that warrant global action plans against this preventable disease.
Time Trend of Mortality from Esophagus Cancer During 2005-2014 in the Nghe An Province, Viet Nam
Introduction
Esophageal cancer (EC) is the seventh most common malignancy with 572,034 (3.2%) new cases in 2018. EC ranked sixth in mortality with 505,585 cases in 2018, accounting for 5.3% of total cancer deaths. According to GLOBOCAN 2018, more than 75% of death from EC occurred in Asia, mainly in developing countries [1,2]. The prognosis of EC is poor with the 5-year relative survival rate ranging from 4-40% depending on the stages of cancer. The five-year survival rate was less than 20% [3]. Although the incidence and mortality rate of EC did not increase significantly in the past, EC is expected to be a global burden in the future. The main reasons are the transition of age structure and the increasing proportion of people with harmful alcohol consumption, smoking, obesity, and low fruit and vegetable intake [4,5]. Viet Nam has an average human development index (HDI) and is facing a double burden of both communicable and non-communicable diseases. In Viet Nam, non-communicable diseases are responsible for about 68% of the disease burden and are the leading cause of death (accounting for 77% of total deaths) [6,7]. According to GLOBOCAN 2018, Viet Nam reported 2,411 new cases and 2,222 deaths from EC (accounting for 1.9% of all cancer deaths) [8]. Data in Viet Nam on mortality from all cancers combined and from EC were limited. We conducted this study to describe the time trend of EC mortality in Nghe An province from 2005 to 2014.
Methods
Nghe An province has a total area of 16,493.7 km² and is located in the North Central Region. Nghe An is bordered to the East by the sea, to the West by Laos, to the North by Thanh Hoa province, and to the South by Ha Tinh province (Figure 1). Nghe An has 21 districts, cities, towns, and 480 state health stations with a population of 3,215,179 in 2009. The descriptive epidemiological method was used to conduct the study. Mortality due to EC and all causes were annually collected from the A6 death register system using the “Validated mortality registration forms” from 2005 to 2014. There was a mandatory monthly active mortality registration by 480 state health stations (SHS) following the A6 death register system. Deaths recorded in the family register management system of Nghe An (regardless of location) from January 1, 2005, to December 31, 2014, were indexed in the A6 records of 480 SHS in 21 districts/town/cities. We excluded deaths that occurred in the study area but were not recorded in the family registry of Nghe An. For each reported death, the investigators annually collected the patient’s information (name, age, gender, date of death, and cause of death assigned by ICD-10 code) and filled in the printed form of “Validated mortality registration forms”. During the 10 years, our study collected 140,670 deaths, of which 639 were deaths from EC. In 2014, the list of deaths from the A6 death register system was validated by the Verbal Autopsy instrument. The quality of mortality from cancer in general and EC, in particular, was very good regarding accuracy and completeness. The data were checked, cleaned, encrypted, and then entered using Excel software. Deaths from EC (C15) were selected. We used STATA 10 analysis software to calculate the age-standardized mortality rate per 100,000 persons by using 3 standard populations: Segi World Standard; European standard; WHO World Standard (2000-2025).
Figure 1: Location of Nghe An province in Viet Nam.
We used the following equation to calculate the agestandardized mortality rate:
di: number of deaths in the ith age group, wi: population in the ith age group of the standard population, Yi: person-years in the ith age group [9,10].
Mortality rates ratio and 95% confidence interval (MRR, 95% CI) was estimated by performing logistic regression analysis to examine time trends and risk of deaths due to EC, adjusted for sex, age, the proportion of unknown underlying cause of death, and allcause mortality rates by time. For time trends during 2005-2014, we divided into five periods of 2005-2006 (the reference group), 2007-2008, 2009-2010, 2011-2012, and 2013-2014. The research protocol was approved by the Ethics Committee of Hanoi Medical University on Nov. 25, 2008. The study was conducted under the approval of local authorities and health authorities in the study area. The collected information was completely confidential and only used for scientific purposes.
Results
The total number of deaths from EC in Nghe An from 2005 to 2014 was 639 out of 140,670 reported deaths; 527 were men (82.47%) and 112 were women (17.53%). The rates of death from EC in men increased steadily over the years (Table 1). The standardized mortality rates that used WHO and EU standard populations were higher than the Segi standard. The age-standardized mortality rate (WHO World Standard) in 2013-2014 was 6.32/100,000 which is 2 times higher than in 2005-2006 (3.29/100,000). From 2005 to 2014, the mortality rates in women with EC were always less than 1.00/100,000 (Segi and WHO standards) and increased slowly, regardless of standard populations. (Figure 2) showed that the mortality rates of people with EC had a steady increase. The mortality rates in men were always higher than in women. In 2013-2014, the mortality rate in women was 0.89/100,000; the rate in men was 6.32/100,000, 7.1 times higher than in women. Compared to the period of 2005-2006, the risk of death from EC was significantly increased in 2013-2014, mortality rate ratio – MRR (95% CI) was 2.79 (1.95, 3.99), p for trend 0.001, (Table 2). The age-specific rates of EC had an upward trend. The rates were low in age groups under 40 (<1.00) and increased considerably from 40 years old in all periods. Patients aged 70 or older had the highest mortality rate, increasing from 11.33 in 2005-2006 to 15.37 in 2013-2014; the highest was in 2011-2013 with a rate of 18.01 (Figure 3).
Figure 2: Age-standardized mortality rate per 100,000 by sex and time (WHO world standard).
Figure 3: Age-specific mortality rate per 100,000 from the esophagus by time.
Table 1: Mortality from esophagus during 2005-2014 by sex.
Note: # Percent against total deaths; ASR: Segi (“world”) standard; EU: Scandinavian (“European”) standard; WHO: WHO World Standard.
Discussion
We conducted this study in Nghe An province for 10 years to describe the trend of deaths from EC. The results showed that from 2005 to 2014, Nghe An had a total of 639 deaths from EC. With this relatively long time and a large study population, we found a significant increasing trend of EC mortality during the 10 years and over 80% of EC occurred in men. This study used three standard populations including Segi, WHO, and the EU to calculate the age-standardized mortality rates of EC for further comparison of the present study findings with other populations worldwide. The results showed that the mortality rates calculated by using 3 standard populations were different. In all periods, agespecific rates calculated by using the EU standard were the highest compared to Segi and WHO standards. [10]. The mortality rate in 2011-2012 (WHO standard) of Nghe An (3.1/100,000) was higher than the estimated mortality rate of Viet Nam by GLOBOCAN-2012 in the same period (2012) which was 2.9/100,000; however, the rate of Nghe An in 10 years (2.31/100,000) was lower [11]. From 2005-2014, the age-standardized mortality rate of EC in Nghe An province increased from 1.75/100,000 (2005-2006) to 3.34/100,000 (2013-2014).
Data from GLOBOCAN 2008 and 2012 showed that the mortality rate of EC in Asia declined from 5.8/100,000 to 5.00/100,000. However, more than 75% of deaths from EC were Asian and occurred mostly in developing countries [1,12,13]. This may be due to some recognized risk factors that induce EC: smoking, alcohol consumption, obesity, low intake of vegetables and fruits, and inefficient facilities to implement cancer control programs by annual screening for EC [4,5,11,14]. Furthermore, 36% of Asians also had an alcohol flushing reaction, which is caused by a deficiency of aldehyde dehydrogenase 2 (ALDH2). People who had ALDH2 heterozygotes and were heavy drinkers had an increased risk of EC [15]. The 5-year relative survival rate of EC is low, ranging from 4 to 40% depending on the stages of cancer at the time of diagnosis. The 5-year survival rate was below 20%, suggesting the importance of cancer prevention. However, in Viet Nam, the national screening programs for EC in particular and gastrointestinal cancers, in general, were rarely conducted [3]. In addition, the Vietnamese population is shifting from a young population structure to an aging population and the reporting system of the preventive healthcare system is improving. All of these reasons could partially explain the increased mortality rate of EC in Nghe An province during the study time. Mortality from EC was related to age with the highest rate being in the elderly group. In Nghe An, deaths from EC started to increase rapidly in people aged 40 and higher.
The age group over-70 had the highest mortality rate (Figure 2). This result is similar to other studies in the world. Mortality rates of EC in the UK started to increase rapidly in the age group 45-49 and the highest mortality rate was reported in the age group 89-90 [16]; in the United States, the results were 50-55 years old and 70-80 years old, respectively [17,18]. In this study, 82.47% of EC deaths were men. This result is similar to WHO estimation of Viet Nam’s mortality from EC in 2012: 88% were men and 12% were women [11]. In Nghe An, the age-standardized mortality rates in men were higher than in women. The results were similar to data from GLOBOCAN 2008 and 2012. Rates of death from EC were higher in men than in women and increased in both sexes in four years: men increased from 8.6/100,000 to 9.9/100,000, women increased from 3.4/100,000 to 3.8/100,000 [12,13]. Our results also showed that in women, during the 10 years, the rate increased slightly and was less than 1/100,000 (Table 2). In men, the rate doubled from 2005 to 2014 (Table 1). This result is similar to the estimated age-standardized mortality rate of Viet Nam in 2012 which reported the rate in men was 5.5 and in women was 0.6 [11]. In 2012, the mortality rate of men with EC in Nghe An was lower than the data of Asia (9.9/100,000) but higher than Southeast Asia (3.3/100,000) [1,11]. The main reason could be the higher rates of alcohol consumption and smoking among men compared to women [19,20].
Table 2: Mortality from esophagus during 2005-2014.
Note: $ Adjusted for sex, age, the proportion of unknown underlying cause of death and all-cause mortality rates.
Alcohol and tobacco were shown to be risk factors of EC [21,22]. In Viet Nam, the alcohol consumption per capita per year was estimated to increase from 4.7 liters in 2010 to 8.3 liters in 2016. Alcohol consumption in men was 7 times higher than in women [19,23]. The rate of people with harmful alcohol consumption in men (44.2%) was 40 times higher than in women (1.2%) [19]. According to GATS 2015, the proportion of men smokers in Viet Nam was 45.3% but only 1.1% in women [20]. The higher risk of death from EC in men than in women could be explained partially due to a high prevalence of men smokers in Viet Nam. From January 1, 2020, the Government’s Decree No. 100/2019/ND-CP on administrative penalties for road traffic and rail transport violations, and the Law on Prevention and Control of the harms of alcohol and beer abuse took effect which may contribute to reducing alcohol and beer consumption of Vietnamese people in the future, therefore, EC mortality in men will be decreased. Longitudinal studies are needed to evaluate the impacts on alcohol-related cancer cases including EC cases in Viet Nam [24,25].
Conclusion
Mortality from EC in Nghe An increased significantly over the years with MRR (95% CI) being 2.79 (1.95, 3.99). In 2013-2014, the rate was 6.32/100,000 which was doubled from 2005-2006 (3.29/100,000). The mortality rate began to rise rapidly at the age of 40 with the highest in the age group over 70. Men had higher mortality rates than women. An annual screening program for EC in men from 40 years old for the high-risk group to detect early EC for treatment at the early stage is highly recommended.
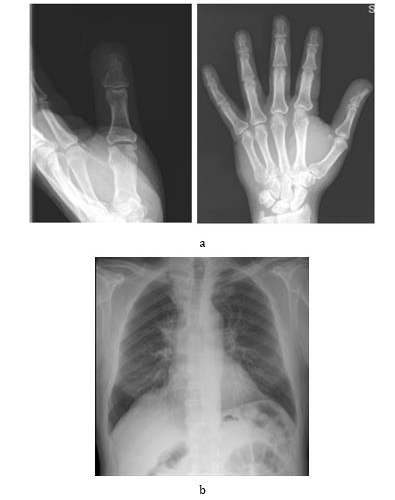
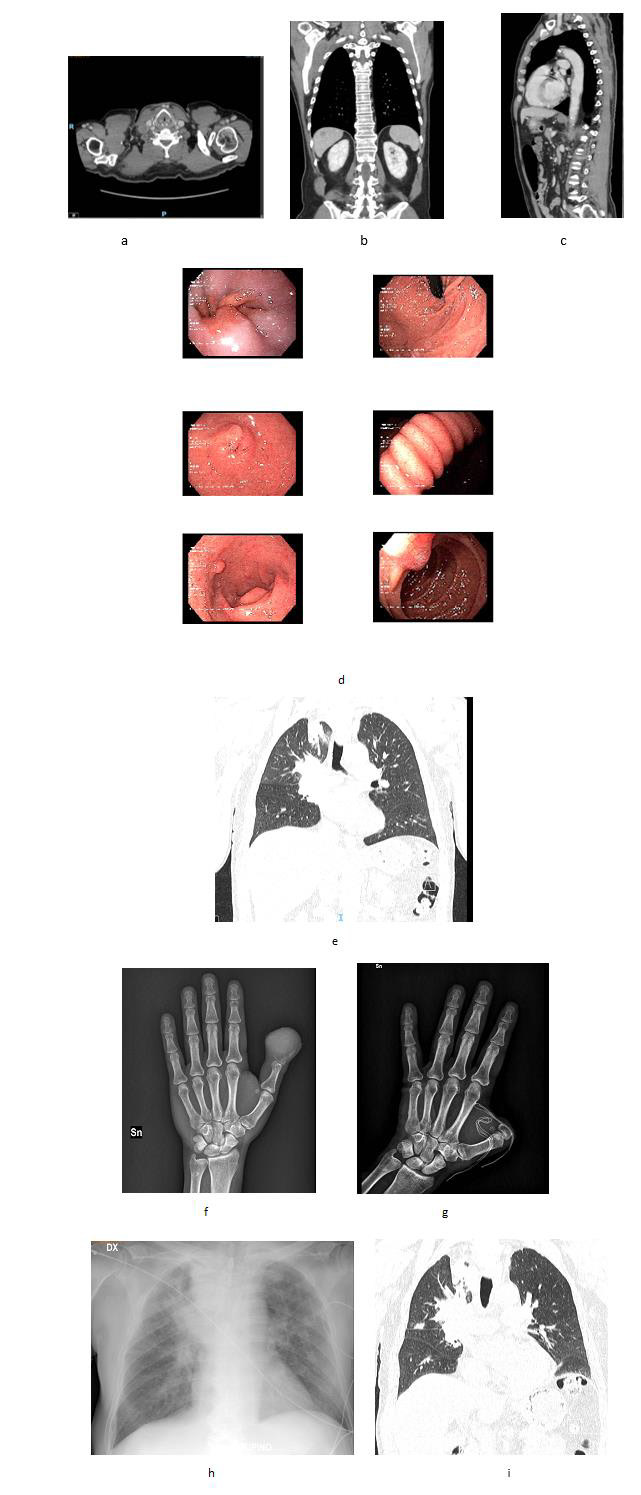

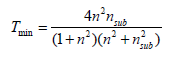
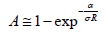
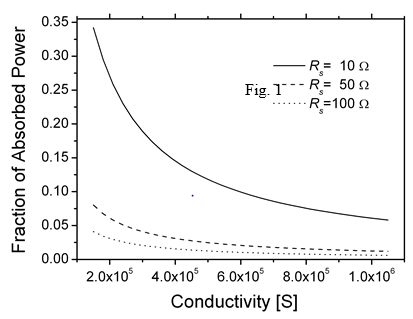
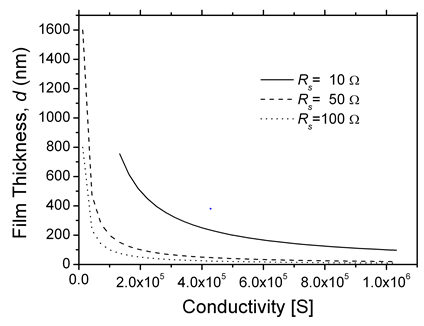
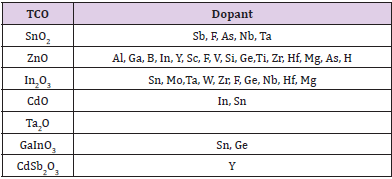
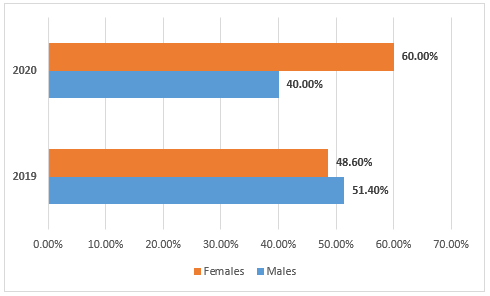
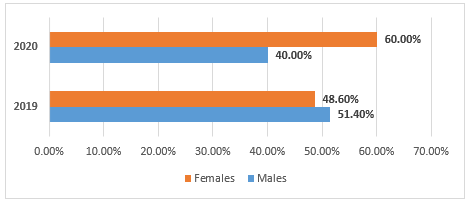
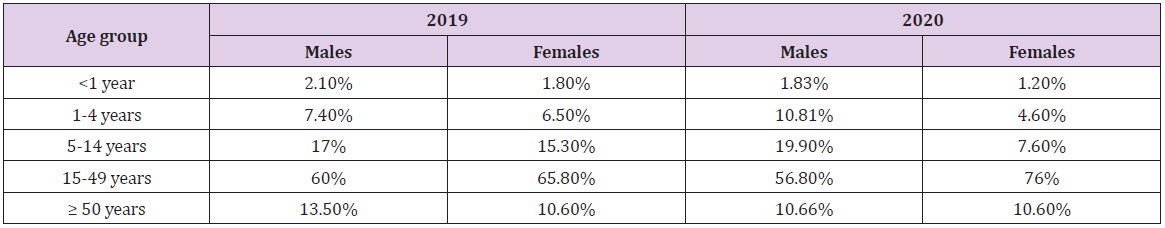
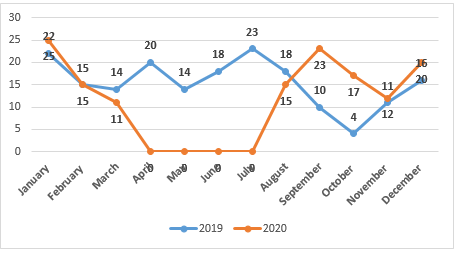
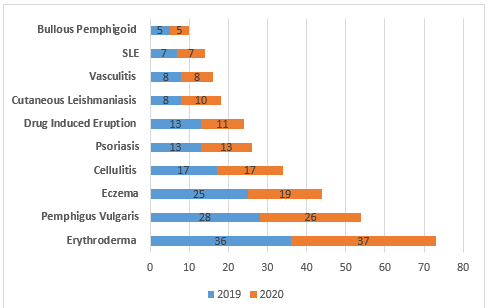

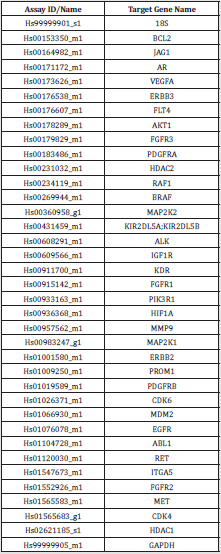
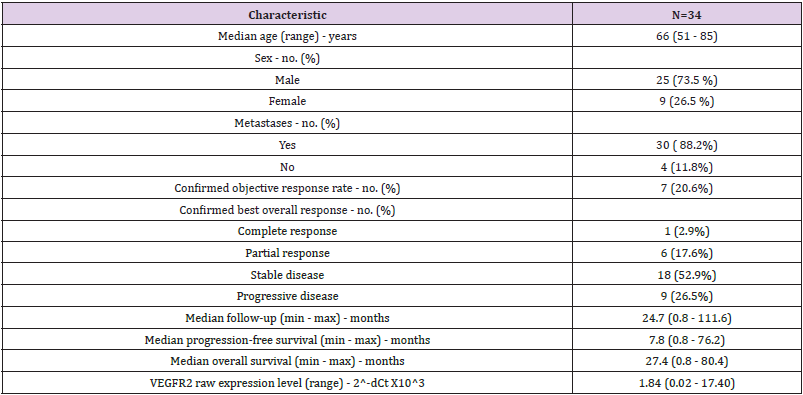
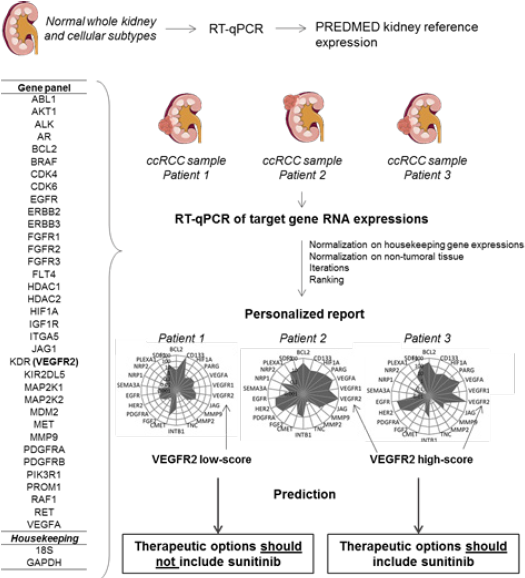
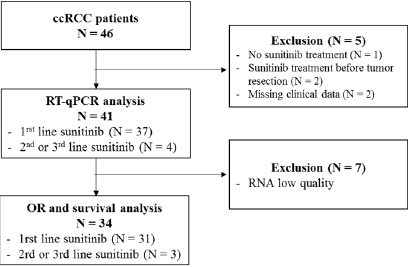
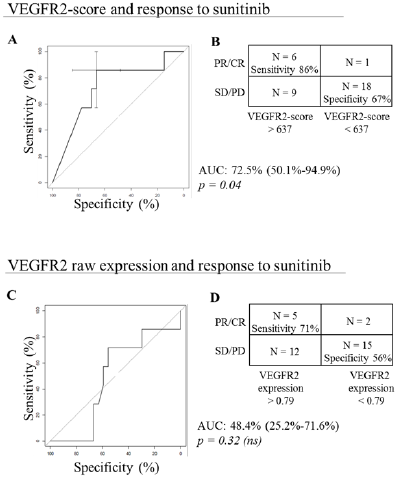
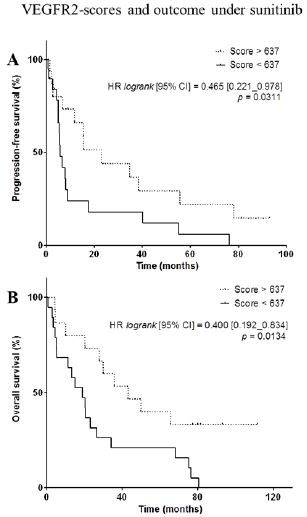

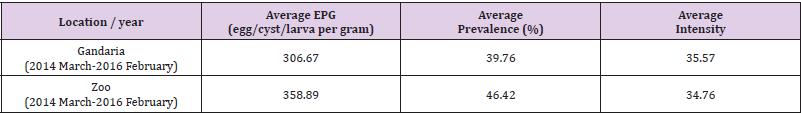
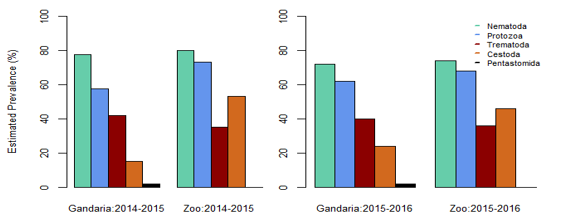
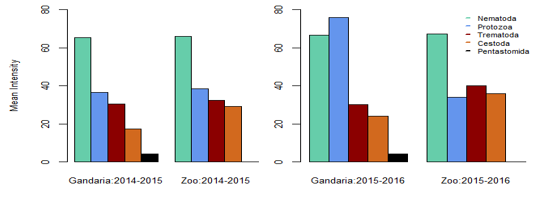
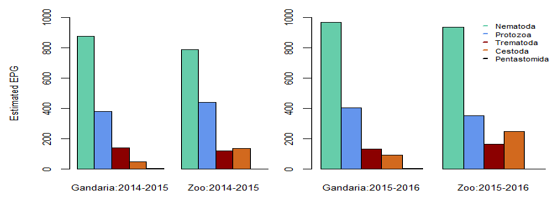
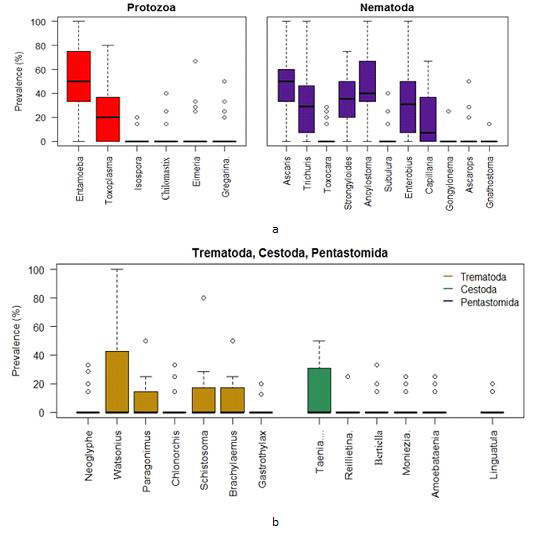
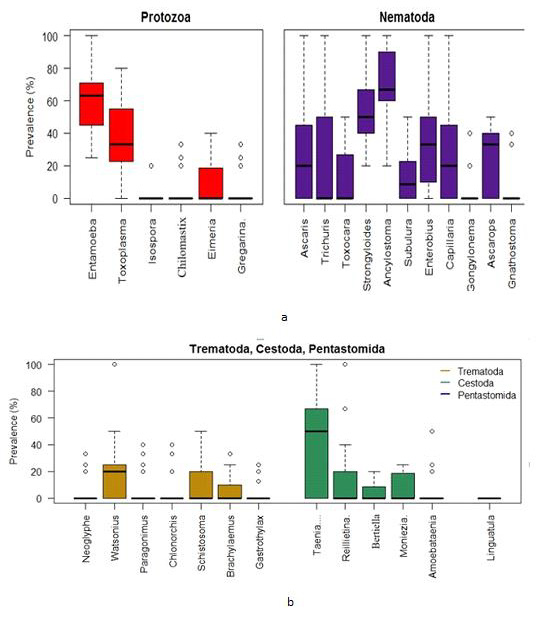
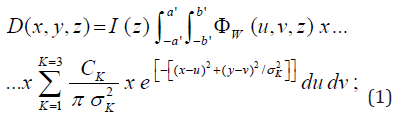
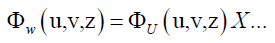
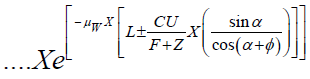 with Φw (u,v,z)as WF modified fluence. (2)
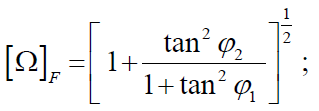
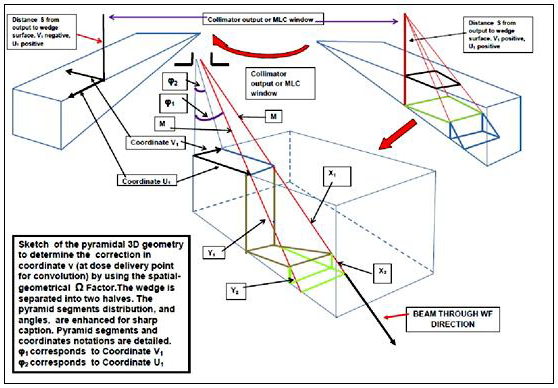
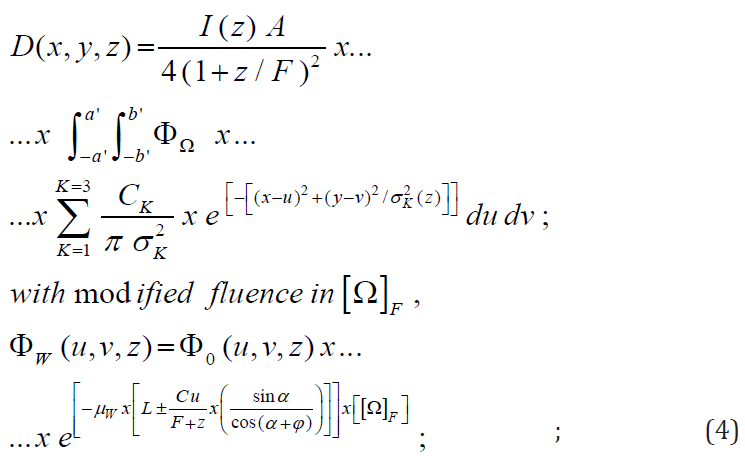
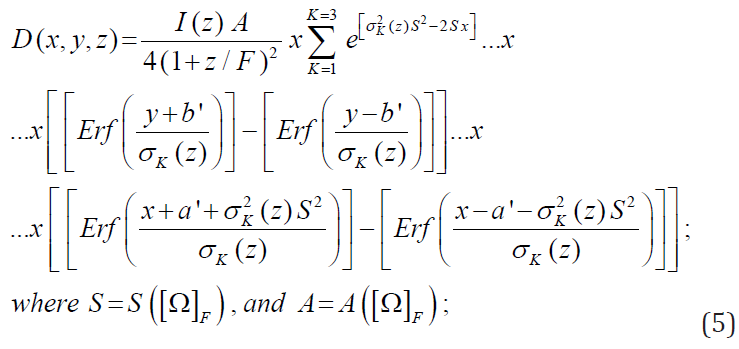
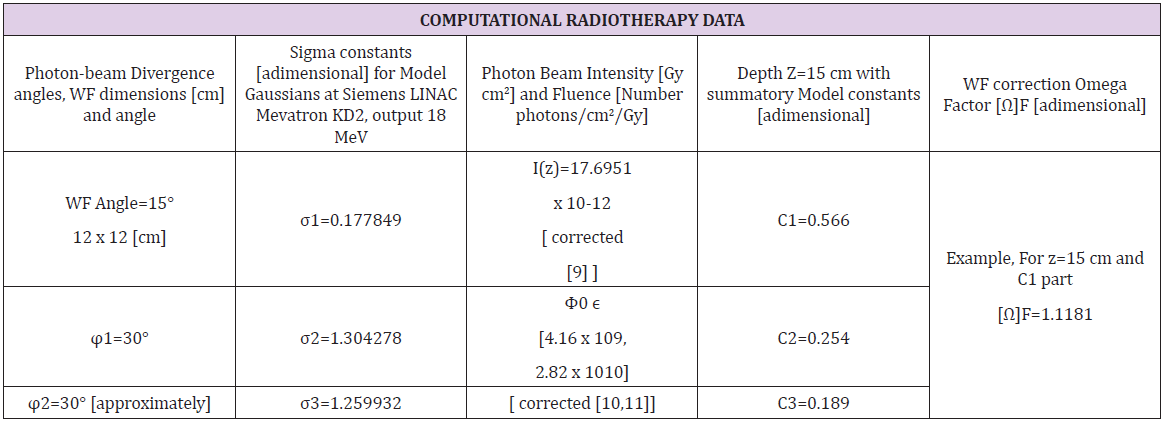
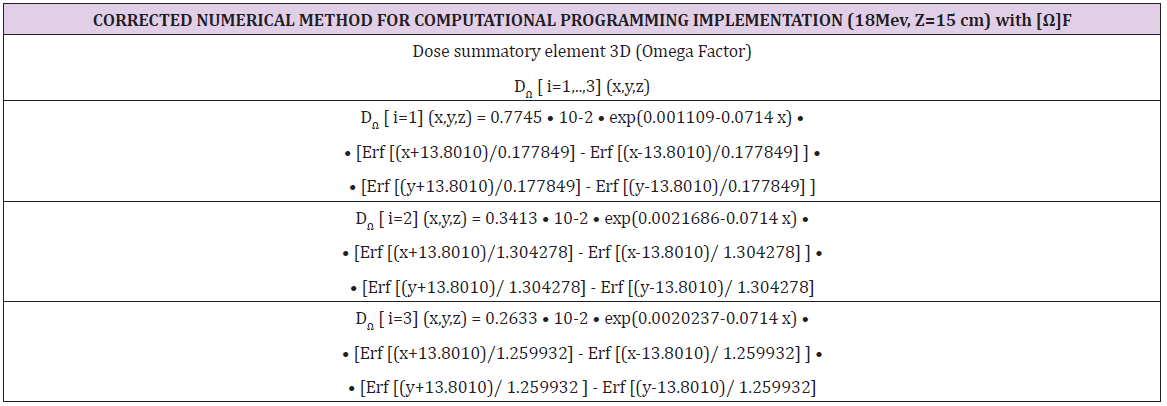

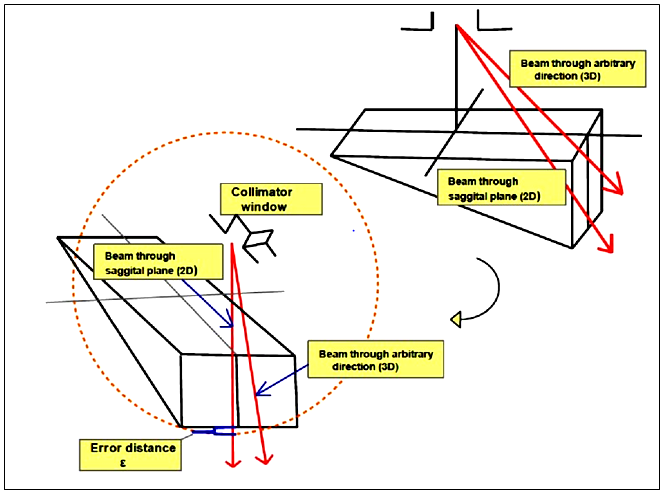
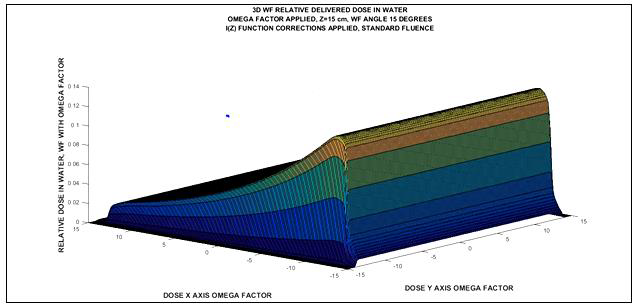
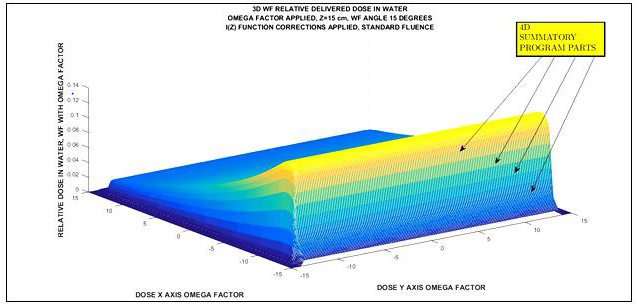
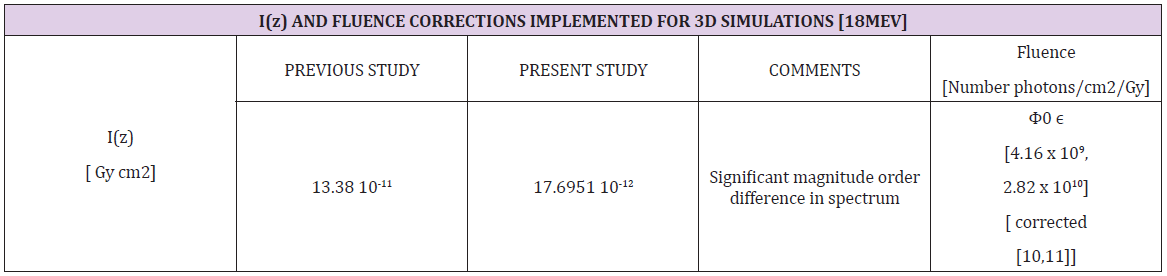
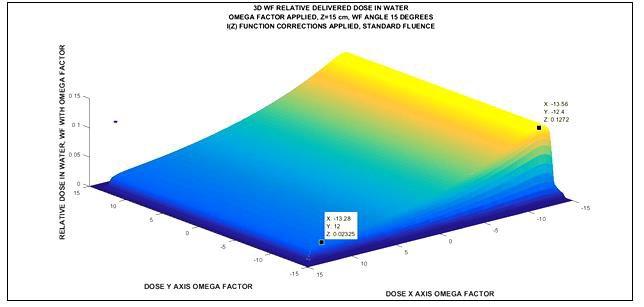
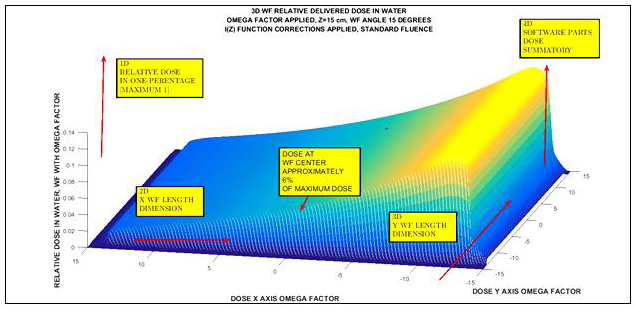
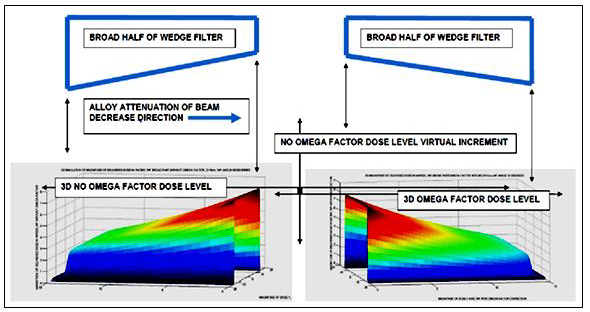
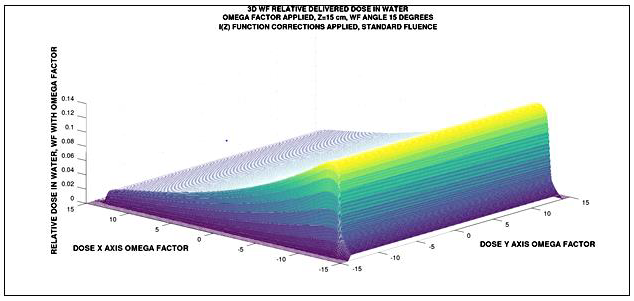
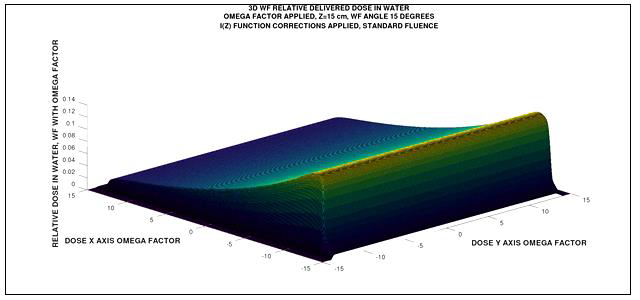
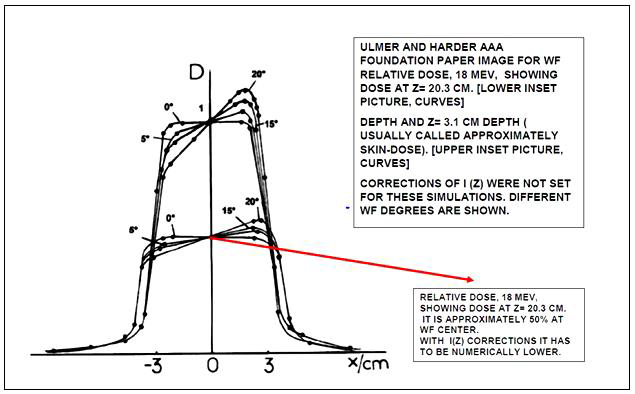
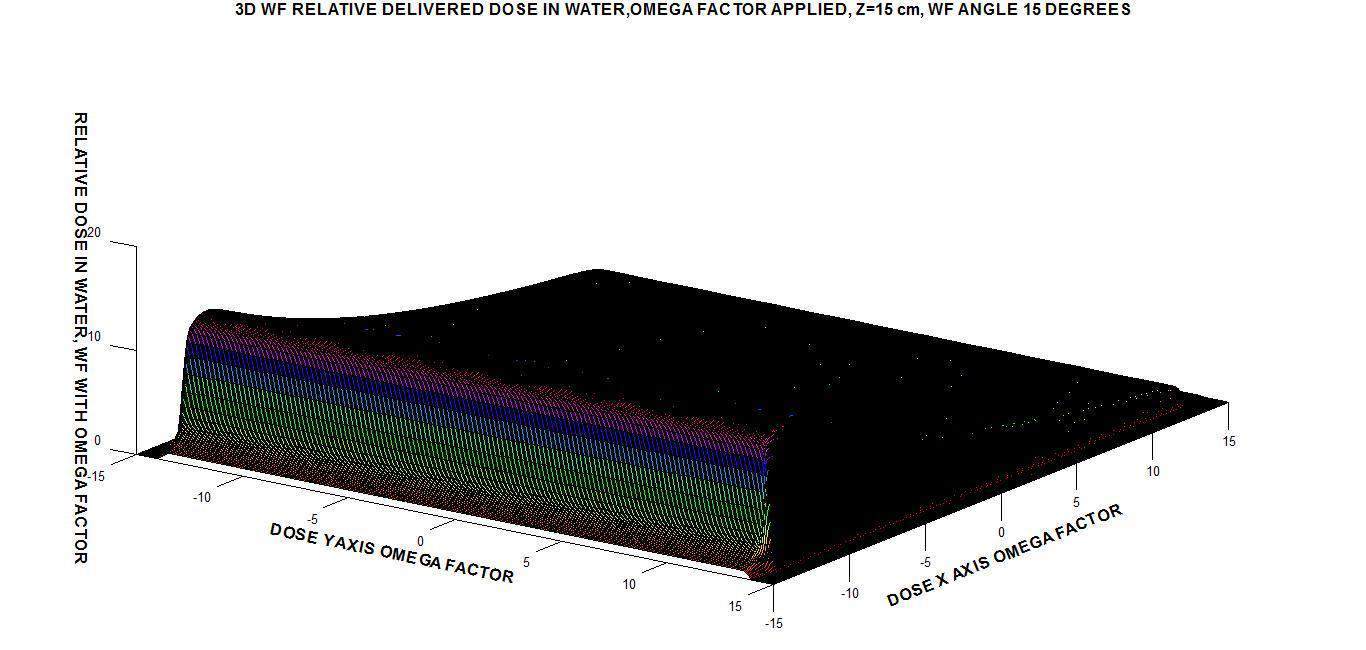
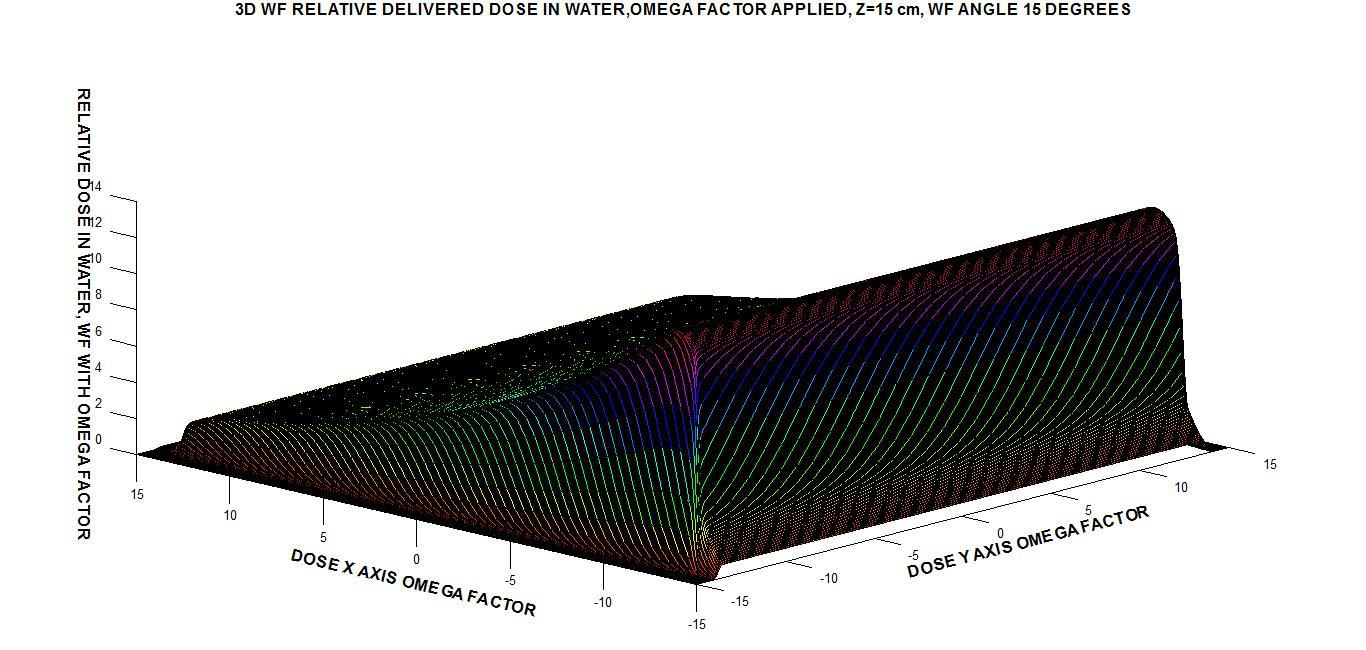

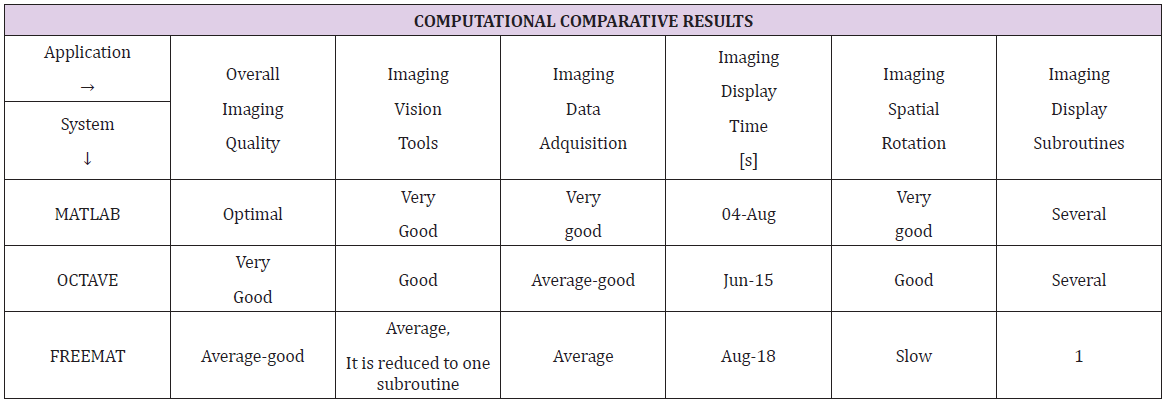
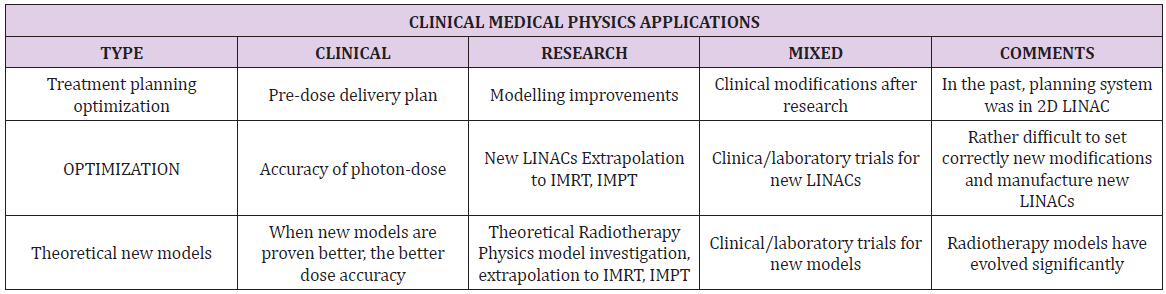
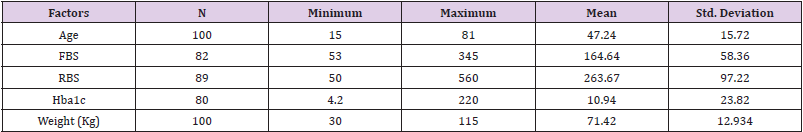
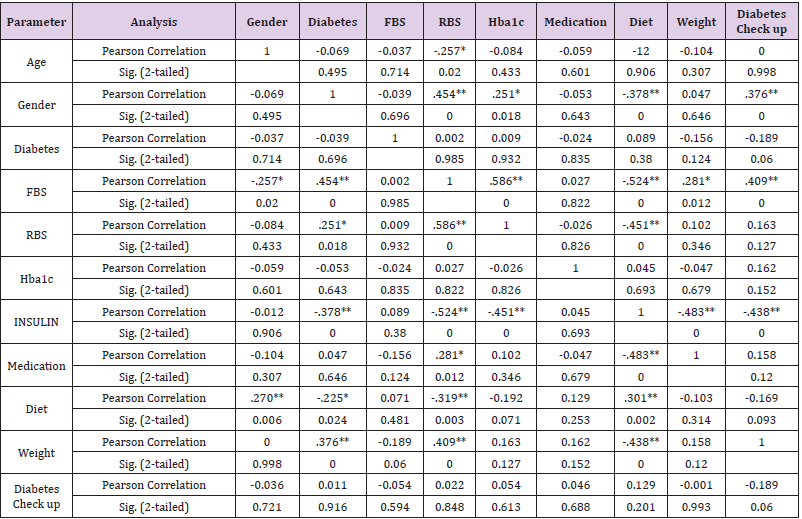
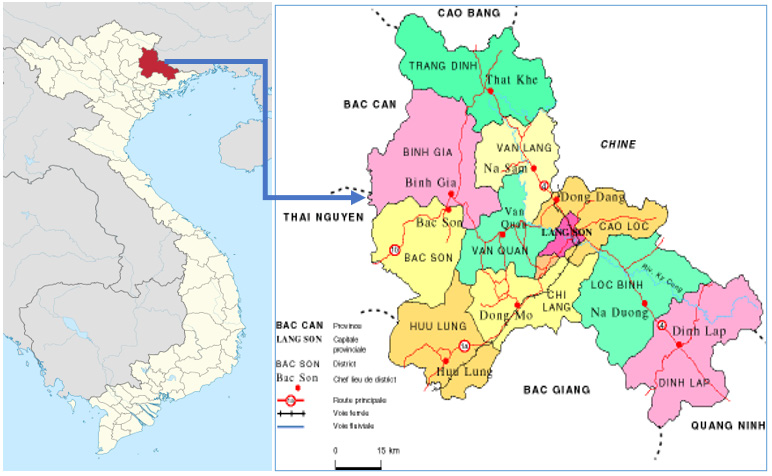
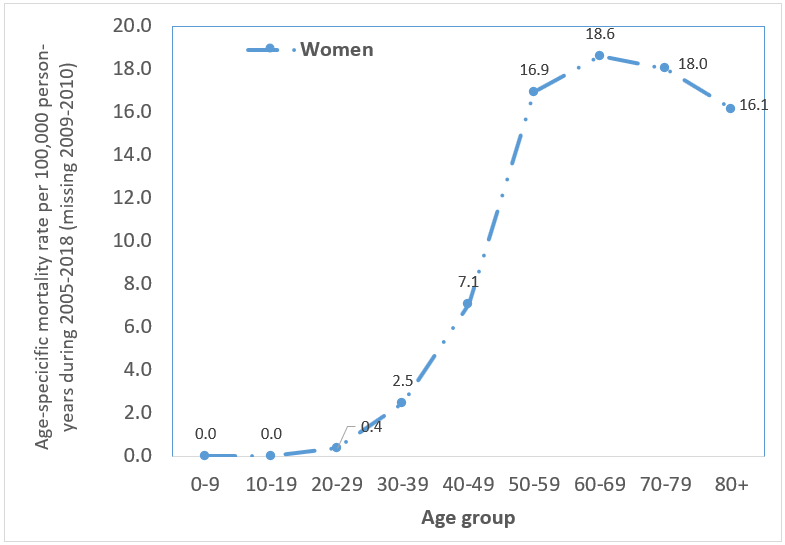

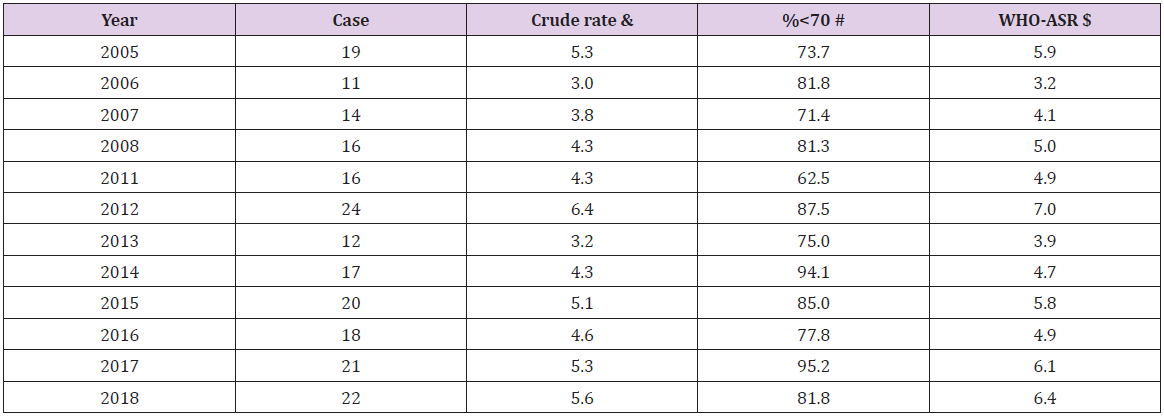
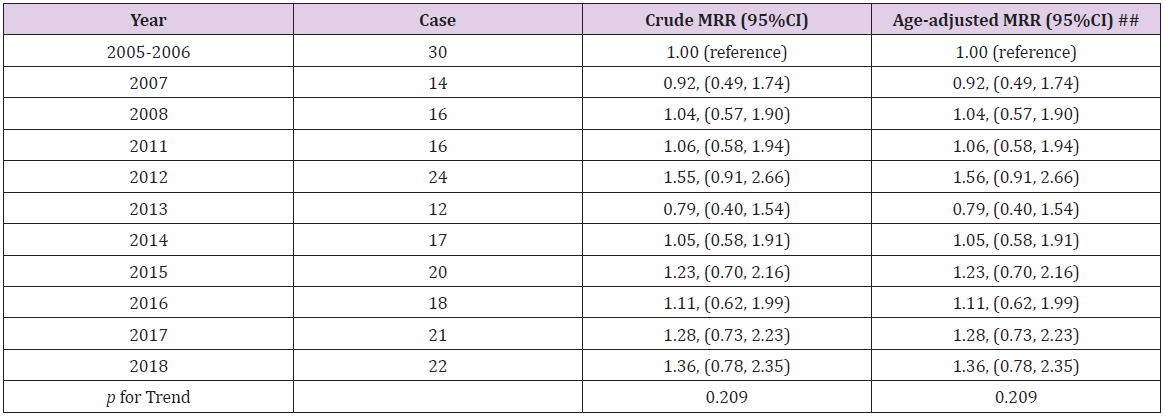
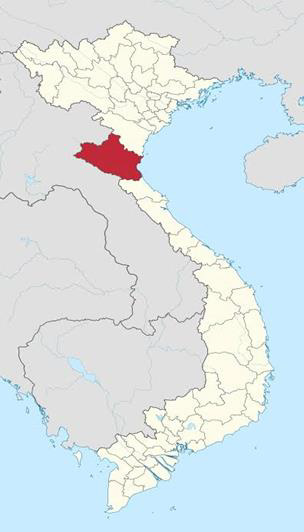

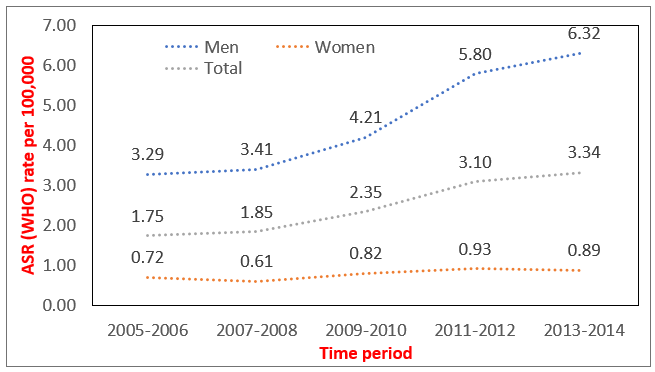
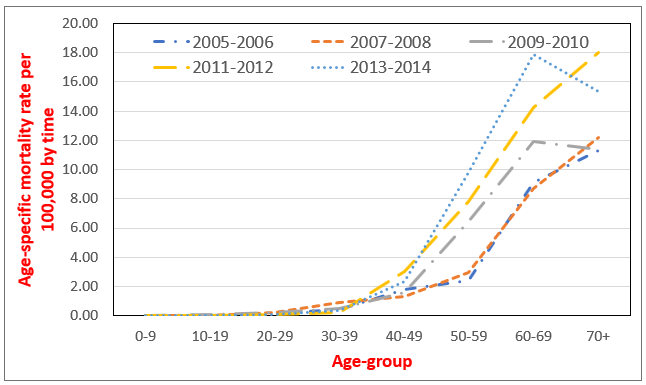
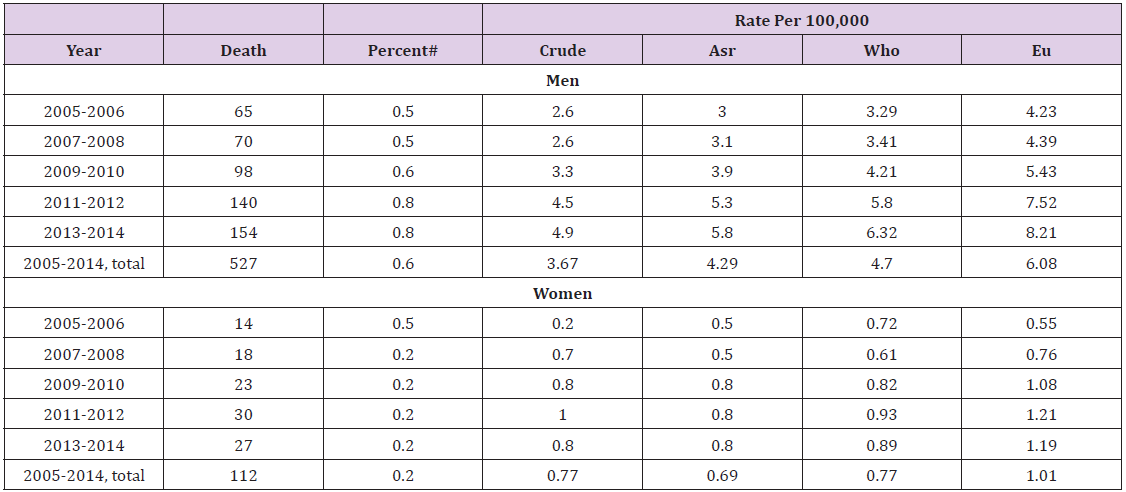
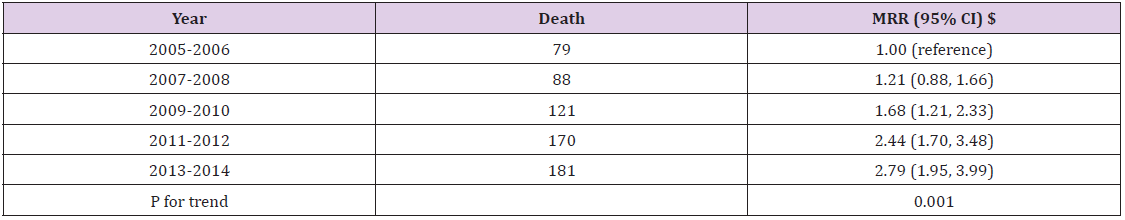
