Open Access Journals on Medical Research

Effective Continuing Professional Learning and Development: The Case of Mathematics Teachers in Malta

Introduction

Education in Malta falls under the responsibility of the Ministry for Education and Employment (MEDE) and is compulsory between the ages of 5 to 16 years. At present, students aged between 11 to 16 years can attend one of the 22 church secondary schools, 11 independent secondary schools and 23 state middle and secondary schools. The last two decades have been characterised by several successive reforms in the Maltese education system. The National Minimum Curriculum (NMC), based on fifteen curricular principles was introduced in 1999. Next followed the National Curriculum Framework (NCF) introduced in 2012, as a result of a review of the NMC, which aimed to take into consideration new realities in the education system such as the use of new technologies and the drive towards inclusion, differentiated and mixed-ability teaching.

The latest education framework, the Framework for the Education Strategy for Malta 2014-2024, proposes a more “equitable quality education and promoting lifelong learning opportunities for all” MEDE [1]. The teaching of mathematics in Malta is compulsory in all school cycles. Guidelines proposed by the Directorate for Quality and Standards in Education (DQSE) for the teaching, learning and assessment of mathematics in Malta state that due to the nature of mathematics, “there is no single best way to teach mathematics” and proposes “that educators use a variety of teaching approaches in order to cater for [all] aspects”, such as “teaching through exposition”, “teaching through discovery” and/ or “teaching through exploration” DQSE [2]. In Maltese middle and secondary schools, on average, mathematics is allocated 5 fortyminute lessons per week, usually one lesson per day.

Defining Professional Development

Literature provides various definitions of professional development (PD) for teachers. In a broad sense, PD can be defined as the development of a teacher’s professional role, and occurs as “a combination of personal and professional events that teachers experience during their time at work and [which act] as a key to reforms in teaching and learning” Maskit [3]. PD activities can include formal experiences, such as attending workshops and in-service courses, or less formal experiences such as reading professional literature and discussions with colleagues. Hunzicker [4] states that PD is “anything that engages teachers in learning activities that are supportive, job-embedded, instructionally focused, collaborative, and ongoing”. Such form of professional learning is likely to help inspire teachers and keep them engaged. More importantly, PD helps them innovate the way they teach as they learn about different methods and best practices utilised by colleagues, and helps support teachers to be better prepared for changes in policy and in curriculum Fullan [5]. PD activities should “seek to update, develop and broaden the knowledge teachers acquired during initial teacher education and/or [to] provide them with new skills and professional understanding” OECD [6] throughout their career.

Professional Development of and for Mathematics Teachers

Many mathematics teachers teach through practices based heavily on fact memorisation without trying to generate a deeper understanding of the subject and without utilising problem-solving techniques Darling-Hammond, et al. [7]. Teachers’ prior knowledge and learning experiences affect the way they teach Beswick [8] and, according to Cohen [9], only when pre-conceptions of knowledge as facts, teaching as telling and learning as memorising are dispelled, can teachers teach for understanding. The main focus of teacher learning activities, especially for mathematics teachers, should be on mathematical content and pedagogy and analysis of teachers’ work with students that include learning about “specific teaching practices [to] increase teachers’ use of those practices in the classroom” Desimone [10]. Argue that PD focused on specific mathematical content and on the ways how students learn is especially beneficial particularly for instruction designed to improve students’ understanding of concepts.

Buhagiar [11] provides a number of insights with regards to PD for mathematics teachers. He states that PD should serve to create spaces where teachers’ prior knowledge and experiences interact with reform initiatives and learning opportunities. In addition, Buhagiar [11] argues that it helps that the school culture is conducive to change, and teachers benefit most from PD when they form part of a professional learning community. Garet [12] suggest a number of structures that can characterise a mathematics PD program so that it may bring about teacher learning. Sustained and intensive PD activities, ideally spread over a span of time, aligned to national standards and assessment procedures, and focused on improving the teachers’ mathematical content and teaching pedagogy, are mentioned as important features.

PD is not a “one-size-fits-all” issue Loucks-Horsley [13] and a program that is successful for one school may fail when replicated in another school. Putnam [14] list various approaches that can be utilised as learning experiences for mathematics teachers in schools. In-class observation of mathematical activities and subsequent sharing of insights about students’ mathematical understanding with teachers can be one such approach, where teachers learn from actual teaching experiences, thus making learning more pragmatic. Another approach is to have teachers share experiences and issues encountered while teaching along with students’ work to serve as a basis for discussion. A third approach can be teachers learning about theoretical and research-based ideas during which teachers create learning activities for their students which are then actually tried out and tested in class. These sessions provide opportunities for teachers to “develop different conceptions of mathematics and deeper understandings of mathematical learning and teaching, and to incorporate strategies such as group problem solving, use of manipulatives, and non-routine problems into their mathematics instruction” Putnam [14]. [14] suggest that a mix of approaches situated in diverse contexts might offer a promising approach to providing worthy teacher learning experiences.

Teacher Perceived Effectiveness of Professional Development

Effectiveness of PD is very difficult to define, particularly since what makes PD effective is likely to be perceived differently by teachers. Numerous studies have been conducted, with various researchers providing particular “characteristics of professional development that teachers … value and [which teachers] believe help improve their practice” Quick [15]. A study conducted by Porter [16] based on the Eisenhower Program supporting highquality professional development in mathematics and science, specifies six main features of effective PD. These features are classified into two categories: core and structural Porter, et al. [16]. Core features include a focus on content, where the PD aim is about “what students are expected to learn (content knowledge) and how students learn the subject matter (pedagogical knowledge)” Quick, et al. [15] active learning where teachers need to “become actively engaged in the meaningful analysis of teaching and learning” Porter, et al. [16] by being given feedback on their teaching Calleja [17] and coherence, where PD activities are connected to school or national goals and to other learning opportunities to create a comprehensive teaching program. Structural features include the form of the PD activity, that is whether the PD activity is focused on a small group or a large group; the duration of the activity and whether the sessions are spread over a span of time; and whether the level of teacher collaborative participation is across participants from the same school or across colleges and schools Porter, et al. [15-17].

In the case study conducted by Buhagiar [11], where the story of a Maltese mathematics teacher is presented, Buhagiar [11] states that to be effective, a professional learning program needs to instil a sense of change in the learner. Teachers’ prior beliefs and experiences, “inherited through patterns of instruction” Cohen [9] and their “resistance to adventurous instruction” (p. 34) affect what teachers learn. Thus, “teacher education programmes … are more likely to have an impact on teacher learning should they present learning as situated, with theory and practice constantly feeding into and developing each other” Buhagiar [11]. In his report about a small group of Maltese secondary school mathematics teachers participating in a PD program aiming to support teachers to teach mathematics through inquiry, Calleja [17] concludes that for a PD program to be effective, teachers need to participate in learning actively, be immersed in practice-based understandings and form part of a community of practice. Calleja [17] suggests that PD providers “no longer conceive teacher professional development as an isolated venture of off-site workshop training disconnected from practice, [but] rather … an ongoing collaborative on-site experience of practice-oriented development and learning” Calleja [17].

Professional Learning Communities

Many mathematics teachers tend to work in isolation Krainer [18]. In recent years, with the introduction of various educational reforms, schools are being encouraged to provide opportunities for greater interaction amongst teachers. Thus, the introduction of the professional learning communities (PLCs) in or across schools, where teachers meet, discuss and learn from each other is encouraged Ministry of Education [19] [NMC]; MEDE, [20] [NCF]). Through PLCs, teachers are both inquirers and learners, sharing their mastery and know-how and learning with and from colleagues Fullan [21]. PLCs offer a useful approach for “informing and improving the professional practice of [an] entire team” DuFour [22], where teachers focus on learning rather than teaching, working together collaboratively while all the time holding themselves accountable for their students’ results, thus aiming at finding the best teaching practices for their students to gain an optimal result DuFour [23]. McLaughlin [24] state that to be successful in constructing new methodologies, teachers need to participate in a PLC “that discusses new teacher materials and strategies, and that supports the risk taking and struggle entailed in transforming practice”. The concept of schools as PLCs also requires individual schools to build strong networks and relations with other teachers and schools, to be able to share experiences and resources and to learn from others facing similar or different challenges OECD [6].

Conclusion

Teachers are agents in their own professional learning Ball [25] and use PD opportunities to satisfy a variety of wants and needs. The ultimate aim of PD is to better address teacher professional growth, to broaden teachers’ thinking and to facilitate change Liljedahl [26]. Various definitions of PD were provided in an attempt to arrive to an understanding of how teachers perceive PD. Teachers’ perceived effectiveness of PD was explored, and the importance of PLCs in schools and the kind of support teachers need were also investigated.

Methodology

This study attempts to understand and give meanings to the experiences of mathematics teachers’ with regards to PD based upon their views and their specific work contexts so as to obtain a richer understanding of the phenomenon and to “generate or inductively develop a theory or pattern of meaning”. Creswell [27]. Thus, an inductive constructivist grounded theory approach was adopted, where the exploration “examines the ways in which events, realities, meanings, experiences … are the effects of a range of discourses operating within society” Braun [28] and theories are built according to the interpretations.

Participants

The study targeted mathematics teachers teaching in state and non-state schools, hailing from all secondary school sectors in Malta and Gozo. To obtain a representative sample of the population, a probability sample approach was employed in this research to “keep the sampling error to a minimum” Bryman [29]. A population of 360 teachers were invited to participate in the quantitative part of the study. 261 teachers working in 21 Church, 3 Independent and 22 State middle and secondary schools took part in the questionnaire, attaining an overall total participation rate of 72.5% of the mathematics teachers, with responses gathered from 76.2%, 32.5% and 78.3% of the teachers respectively teaching in Church, Independent and State middle and/or secondary schools. These figures guarantee a maximum margin of error of 3.19%, assuming a 95% confidence interval. This helps determine the “interval or range in which … [the] population score would likely fall” Creswell [30] and which is most likely to contain the population mean, thus helping to validate the conclusions formulated through the study. The sampling of the qualitative part of the study was composed of 13 teachers taking part in three different focus groups, with Focus Group 1, 2 and 3 having 6, 4 and 3 participants respectively.

Approach

A mixed method approach was utilised for this study. This method allowed the gathering of substantial amount of data, which then was merged, integrated, linked and embedded into themes Creswell [31]. Piloting is considered an important instrument to test the procedures and concepts in a study Schutt [32]. Hence, both the questionnaire and the focus group questions were piloted and valid suggestions were taken into consideration to obtain clearer questions. In this study, quantitative data was gathered by administering a questionnaire at the beginning of the study. Planned out questions helped address the following research questions: What type of CPD activities do mathematics teachers participate in?; What encourages and hinders teachers’ participation in PD?; and Which PD opportunities do teachers perceive as most effective and why? The questionnaire helped to get an initial ‘feel’ of the data about teachers’ perceptions with regards to PD and related issues, and to construct statistical models in an attempt to explain the experiences of mathematics teachers.

biomedres-openaccess-journal-bjstr

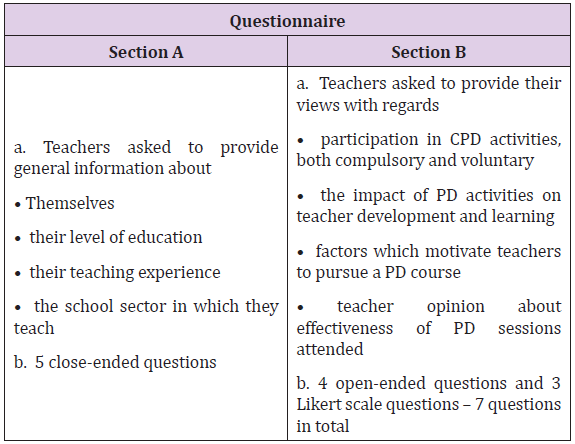
Table 1: Table showing information about the teacher questionnaire structure.

Table 1 below provides information about the questionnaire. With regards to qualitative data, three focus group interviews were conducted. The questions used were based on results obtained from the analysis of data gathered through the questionnaire. The qualitative data was analysed and cross-referenced with the quantitative data gathered and with the research literature. This helped provide a better understanding of Maltese mathematics teachers’ professional learning experiences. The questions focused on: their career journey; how teachers view CPD; what PD should focus on to motivate teachers; the importance of teacher collaboration to engage in PD activities; what is an ideal and effective PD; impacts of having compulsory or voluntary CPD sessions; and any other comments the participants wanted to add.

Analysis

The quantitative data was analysed by using descriptive statistics and IBM SPSS Statistics 25 software. Two tests were used, the Chi-Square test and the Friedman test. The Chi-Square test is “a non-parametric tool designed to analyse group differences when the dependent variable is measured at a nominal level” McHugh [33]. Two questions were analysed using this test: the relation between the respondents’ participation in particular PD activities and the impact of this PD experience on the teachers’ development; and the relation between participation in voluntary PD activities and teachers’ preference to participate in such activities. The Friedman test was used to compare mean rating scores provided to a number of related statements. The “method tests the hypothesis that the values of the variate corresponding to each subdivision by one of the factors is homogeneous, i.e., from the same universe” Friedman [34]. This test was used to analyse the extent to which the participants feel that the statements provided are a motivator towards their PD. Thematic analysis was used as a method for qualitative data analysis, defined by Braun [28] as “a method for identifying, analysing and reporting patterns [themes] within data.” The data was analysed repeatedly and inductively generating in vivo codes until data saturation was reached. In order to facilitate better readability of the text, any quotes in Maltese were translated into English, and the English version was used.

Ethical Implications

Official approval from the Faculty of Education Research Ethics Committee (FREC), the University of Malta Research Ethics Committee (UREC), the Ministry of Education and Employment (MEDE), from the Secretariat for Catholic Education, and from the Head of Schools (HoSs) of all Church, Independent and State schools in Malta and Gozo, were sought and obtained. During every stage of the study, all necessary precautions were taken so that the study was not harmful to any participant involved, both during the research and afterwards. Hence, before conducting the questionnaires and the focus group interviews, the participants were reminded that participation was voluntary and that they could discontinue at any time. With regards to the focus group interviews, the participants were asked to sign a consent form. Participants were assured that they were free not to answer any of the prompts utilised for the interview and could terminate the interview at any time. Participants were also granted the possibility of going ‘off the record’ at any time. With the participants authorisation, the discussion was audio recorded. A transcription of the discussion was given to them for member checking Koelsch [35]. Concurring with Schutt [32], pseudonyms were utilised for storing and reporting all data throughout the study.

Findings

Five key themes emerged from the data analysis: teachers’ beliefs with regards PD; those learning activities, both compulsory and voluntary, that teachers report to have participated in; motivating reasons that encourage teachers to attend PD; number of barriers that hinder teachers from pursuing PD; and evaluation of the PD opportunities based on the teachers’ expectations and proposed improvements.

Teachers’ Perceptions of Professional Development

Mathematics teachers are very conscious that PD is a salient and integral feature in their job. This was particularly evident in the focus group discussions as teachers continually linked changes in pedagogical practices and learning of new skills to PD support. Teachers, almost unanimously agreed about the importance of attending PD, also stating that this is a must. Data from the questionnaire sheds light on how mathematics teachers view PD. PD is an ongoing process of acquiring knowledge and training throughout an educator’s professional career. PD is a lifelong process of learning. It enhances your knowledge in the subject that you are teaching. It also helps you to reflect on your method of teaching and learn new skills for effective teaching. Although initial teacher education (ITE) is essential for a prospective teacher to develop necessary professional knowledge and gain a good theoretical and practical foundation on which to build one’s profession, teachers stated that learning following ITE is equally important. Some teachers declared that certain issues are learnt through first-hand experience but also by learning with and from colleagues through the sharing of experiences. The following excerpts illustrate some teachers’ positions: As you go along and encounter certain new experiences, you realise how much training you need in certain areas. Initial teacher training done at university, with mine occurring quite some time ago, still does not prepare you enough! You are unprepared for certain issues encountered in class.

Engagement in Professional Development Activities

Participants mentioned attending a variety of learning activities. For some, attendance is mandatory and mostly held during working hours, while other activities are voluntary and held within school hours, or self-sought and held after school hours. Teachers reported that they were either currently attending or have had the opportunity to attend at least one PD activity during the last two years. Participants frequently expressed the need to liaise and collaborate actively with colleagues from their own school or from other schools. Reasons stated were to “ensure a better end product” as inputs from various sources help in the fine tuning of lesson plans, activities, tests and/or resources, and also help reduce the workload. One can really learn from teaching peers by planning together and sharing ideas, resources and good teaching practices. Working in teams helps us achieve more. Subject meetings are important to plan, discuss and prepare lessons and handouts with other mathematics teachers.

Teachers also mentioned other learning opportunities occurring within a classroom setting, such as co-teaching and peer assessment. Co-teaching involves teachers working together with groups of students, sharing planning, teaching and assessing to provide differentiated instruction Friend [36]. During peer observation, teachers observe each other teaching to develop their own classroom practice. I have been co-teaching with another teacher for three years. I have recently started teaching a new subject, and I have learnt how to tackle certain issues by observing my colleague, and through practice. Observing peers and co-teaching are excellent learning experiences. Although apparently limited, such close collaborations seem to occur with teachers who embrace certain qualities such as being willing to share their knowledge and expertise, are trustworthy, are “at ease in each other’s company” and respect each other. According to these teachers, while these collaboration practices should be encouraged, they cannot be imposed. Some teachers also mentioned that they sought their own PD opportunities. These activities are done in their own free time and in certain instances, without the constraints of a formal setting. A vast and diverse number of courses are available every year, and attending such a course, either physically or by distance learning, is a route that one can take.

Reading mathematics related articles also helps teachers gain valuable insights in new areas of mathematics education and may benefit from ideas and insights that can be incorporated in one’s teaching Broemmel [37]. As a participant stated, Reading articles and professional literature can help you enhance your knowledge on the subject.

Reasons Motivating Teachers to seek Professional Development

Teachers frequently expressed their need to be prepared to face diverse situations encountered in their daily teaching, thus citing a variety of reasons motivating them to seek PD. Data from the questionnaire showed that teachers’ primary reason for attending PD is to “improve my day-to-day teaching and classroom practice”. Several participants stated that PD offers opportunities for “improving one’s pedagogy” by “trying out new ways of teaching” and “reflecting on new concepts”. Reasons explaining why enhancing one’s teaching skills is important were “to be equipped to do the job better”, “to keep up to standard”, and “to be more effective in one’s teaching”, amongst others. A participant also stated that attending PD can be an opportunity to “rectify one’s weakness”.

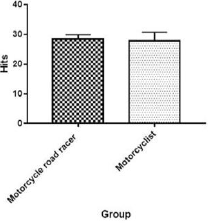
Some participants felt that PD should provide them with an opportunity to develop professionally by “improving the mathematical content” or by “gaining new insights about the subject”, although as one focus group participant stated, With regards to the teaching of mathematics, help is not really needed to learn more about the content but more about other issues, such as different methods of teaching. Other teachers stated that they chose to attend PD for their own personal self-growth, aiming at improving their present level of knowledge with aspirations to master new areas directly or indirectly related to their profession. Few participants stated that they sought PD targeting specific areas, to become “more successful and advance in their career” and to “get a better pay”. Data from the questionnaire indicated that these motivators scored relatively low mean rating scores (Figure 1), thus implying that few participants deem these motivators as crucial for seeking PD. As a participant stated: With regards to eventually better my pay, we don’t have many chances of increasing our pay; even if it does increase, it is not by much. More motivation can be achieved if teachers are paid like other professionals.

biomedres-openaccess-journal-bjstr

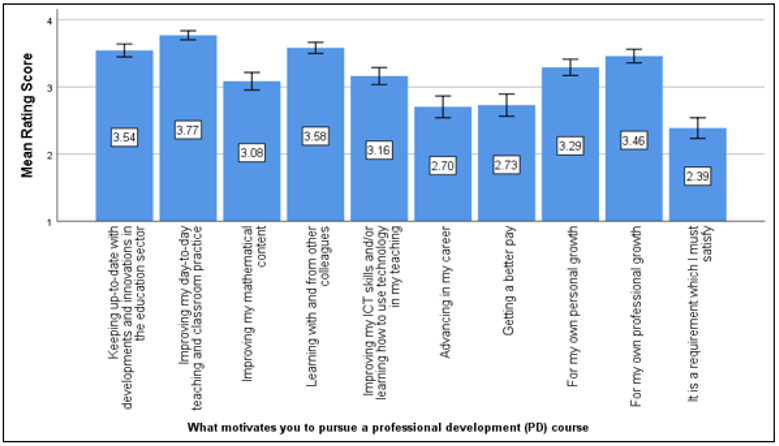
Figure 1: Bar chart displaying mean rating scores with 95% confidence intervals for statements showing motivators for teachers to pursue a PD course.

However, as stated by a focus group participant, while discussing short or long term courses, “if a teacher wishes to take on a different role, such courses are useful for one’s PD as they are necessary for a career change or for career progression”. Hence, it appears that there are also teachers who view PD as a means for future career advancement. In summary, participants mentioned that their PD is strongly related to a teachers’ own specific intrinsic needs or to continue providing the best learning opportunities for their students. As a participant stated, “teaching comes from the soul. If you are not happy teaching, all PD sessions are in vain.”

Barriers to Teacher Professional Learning

Participants identified a number of barriers that are hindering their professional learning. The barrier most frequently cited, especially with regards self-sought PD opportunities, is lack of time. Amongst reasons stated, personal responsibilities and family duties such as taking care of young children, feature frequently. Even though it is important to seek PD, time after work hours is limited. Attending courses after school hours, and seeking out my own PD opportunities are interesting options, but I have family responsibilities and have so many other things to do after work. Participants identified a number of barriers that are hindering their professional learning. The barrier most frequently cited, especially with regards self-sought PD opportunities, is lack of time. Amongst reasons stated, personal responsibilities and family duties such as taking care of young children, feature frequently. Even though it is important to seek PD, time after work hours is limited. Attending courses after school hours, and seeking out my own PD opportunities are interesting options, but I have family responsibilities and have so many other things to do after work.

Teachers’ Preference and Expectations with regards Professional Development Opportunities

Teachers participating in PD are more likely to engage in particular learning activities if they see them as relevant to their personal and professional lives. Teachers see PD opportunities as “relevant” and “effective” when these meet their expectations and needs. Teacher PD is greatly needed, and if planned well, PD activities give the teachers a boost in their job. I feel recharged after attending an effective and informative PD. Teachers think that PD should be planned in such a way as to offer them opportunities where they can work with others to produce mathematics activities, lesson plans, handouts and/or resources for their students. Discussions and the sharing of ideas are regarded as means to help ameliorate lessons, generate new and innovative ideas, and increase student learning and achievement, as this participant stated: An outsider’s perspective and ideas can change your own in a positive way. It may help a teacher plan out new material and be innovative in one’s lessons.

Data show that teachers value active participation during PD sessions. In addition, they believe that working on hands-on activities is relevant and stimulating. Teachers expect to be given opportunities for discussion and interaction with peers, where sharing of experiences and good practices and creation of resources is possible. Teachers in this study mentioned that, in planning for PD, time needs to be allocated for interaction – for teachers to discuss issues and to challenge critically each other’s work and ideas. Such opportunities serve to stimulate their reflection on practice. Teachers also recommend incorporating workshops for lesson preparation. According to teachers, the selection of the speaker is also an important feature of an effective PD activity.

According to teachers, PD needs to be dynamic and individualised, targeting the teachers’ diverse needs and motivations. PD needs to target those specific concerns of particular individuals, so that teachers feel that their interests are taken into consideration. Moreover, they suggested to be consulted beforehand, and be given more choices and a greater say towards their PD. This section focused on the main themes emerging from the data gathered in this study. It has reviewed patterns of participation in PD activities; reasons motivating teachers to seek PD; barriers to professional learning; and the extent to which teachers perceive that certain PD activities have left an impact on them and are meeting their professional needs.

Discussion and Conclusion

This study sought to explore key issues about PD for secondary mathematics teachers in Malta and Gozo.

Type of CPD Activities Mathematics Teachers Participate in

All teachers surveyed in this study stated that they value PD and that they view PD as an integral ingredient to remain effective in their job. Teachers feel that PD provides opportunities to continuously learn new material and to update their skills and pedagogical practices. They stated that learning is a career-long commitment for them, particularly given the diverse and dynamic situations encountered in the growing and ever-changing field of education. Although labelled as important, not all teachers agree upon the amount of time they should invest in PD. Out of an average of 4.38 different PD activities attended per scholastic year by mathematics teachers, nearly all include activities held within school hours (1.90 compulsory PD activities with an additional 1.76 voluntary PD activities) with the rest, 0.72, being self-sought PD activities. Similar findings were reported in Sammut [38] and Attard Tonna and Calleja’s [17] studies, with few teachers being reported to seek self-sought PD activities other than the obligatory PD sessions held within school hours.

Analysing the participation rates for different PD opportunities for mathematics teachers, it is evident that with regards to activities held within school hours, teachers favour activities which involve dialogue with colleagues (84.7% and 92.3% respectively for formal and informal dialogue) and collaborative preparation of teaching materials (74.3%). Obligatory activities organised by the school and consultation meetings with teachers also hold relatively high participation rates, with similar participation rates found in research about PD of secondary school teachers conducted by Zammit [39]. With regards to participation in self-sought opportunities, teachers seem to prefer PD opportunities that can be done at home. The internet is used mainly to search for ideas to improve teaching rather than to participate in online discussions and courses (83.5%, 26.8% and 14.6% respectively).

PD Opportunities Teachers Perceive as Most Effective

Data shows that teachers view PD as effective if it enhances their current personal and professional skills or facilitates learning of new skills. This finding resonates with other studies see Darling-Hammond [23,40] which show that PD courses that enhance the quality of teaching and student learning are critical for teachers. While the term ‘effectiveness’ is subjective, data shows that alignment of PD activities with personal and school-based objectives is important. According to Steward [41], embedding such PD principles in teacher learning is likely to offer more meaningful experiences. Data from this research suggests that mathematics teachers find PD activities effective when these go beyond a one-off meeting or session. Several teachers find that sessions organised by the school, and consultation meetings and professional learning sessions provided by MEDE have a moderate to high impact on their PD (60.6%, 58.3% and 58.2% respectively). Attending seminars specifically aimed for mathematics teachers is also positively looked upon (79.6%).

What Encourages and Hinders Teachers’ Participation in PD?

Findings show that teachers are motivated to attend PD when their needs are considered, their expertise is valued, and their classroom practices and initiatives are integrated within the professional learning experience. As Attard [42] states, “just as teachers need to motivate students for learning to occur, so must teachers be motivated to learn”. Over 95% of the participants rated three specific statements about their motivations for attending PD as crucial – they feel motivated to pursue a PD activity to improve their teaching and classroom practice, to keep up-to-date with developments in the education sector, and because PD provides opportunities to learn with and from their colleagues. Results from qualitative data show that mathematics teachers are motivated to attend those PD activities which helped them support students with diverse social problems and learning disabilities, which provided practical help with regards teaching in a mixed-ability setting and which helped them enhance student motivation and enthusiasm towards the subject. Teachers stated that they often felt that PD can be a means of support, with others welcoming PD targeting their well-being and providing them with ways of dealing with stressful situations. Teachers also mentioned certain barriers that hinder their participation to attend PD, with time playing a major role for PD occurring both during and after school hours. In addition, mathematics teachers see family commitments and other personal responsibilities as hindrances towards attending PD after school hours, and that they often utilise after school hours to catch up with work related to lesson planning and correction of students’ work.

Limitations

The findings need to be viewed from the perspective that currently Malta is passing through new educational policies and reforms. Albeit a highly representative sample of the population was achieved, more thorough and extensive insights of the situation would have been obtained if more Independent schools had accepted the invitation to participate in the study. While this study contributes to the vast amount of international literature about the topic, still one could argue that it is about professional development for Maltese teachers, and specifically for those teaching mathematics.

Implications

Quality teaching is critical for supporting and improving student learning. Improving mathematics teaching has to do with enabling a teacher’s own learning and subsequent changes in the pedagogical approaches utilised, rather than in simply introducing reforms and policies Stigler [43]. Hence, decisions taken and choices made with regards to PD provision need to ensure that these stimulate teacher learning in such a way that teaching methods, and consequently student learning, are improved. Data emerging from this study show that the majority of PD sessions occurring in schools in Malta are traditional stand-alone activities provided either nationwide by MEDE officials or organised by the schools, and mostly delivered to large groups. Studies show that single workshops are rather ineffective in changing teachers’ classroom practices, even though they can be quite helpful in broadening their knowledge Ball [25]. Porter, et al. [16] suggest that to be more effective, PD sessions should be spread over a longer period of time and conducted with smaller groups of teachers. Kennedy [44] also suggests that the type of PD activities provided for teachers need to be varied, offering a means for supporting professional autonomy and transformative practice while developing different forms of knowledge. Thus, combining various PD models, both on short-term and long-term basis, may provide a more effective means of professional growth for teachers.

DuFour [45] states that collaboration at school level is highly beneficial for teachers because it increases motivation and communication amongst teachers and offers opportunities for mutual support. Postholm [46] states that teachers “want to cooperate and reflect upon practice with colleagues to change and develop their teaching”. From this study, it is clear that Maltese secondary mathematics teachers prefer collaborative forms of PD. They feel that such practices offer a more effective means of development because learning is grounded both in practice and in context and is actively supported by colleagues. Collaboration positively impacts teacher morale by decreasing isolation and stress Punch [45,47]. Furthermore, teachers collectively preparing to implement changes introduced through new policies are likely to feel more confident. Thus, teacher collaboration may indirectly bring about improved teacher practice and performance through innovation, better lesson material and a higher degree of teacher decision making power Vangrieken [48].

It is also quite evident that mathematics teachers’ views and say with regards PD choices and content is generally unregarded. This might have several implications. The first implication is that PD organisers and SLT rarely consult teachers with regards their PD needs, but only provide PD opportunities they deem necessary and important at that moment. With such an undertaking, a critical question arises about whose needs the PD is addressing. Hence, PD leaders need to recognise that knowledge and learning can be co-created by and with the teachers themselves Guskey [49- 51]. Working alongside teachers and involving teachers in the decision-making process is critical because it is teachers who would eventually need to bring about the ‘desired’ changes in their classroom. As Bubb [52] suggest, high quality PD needs to be based on teachers’ needs. This is likely to imply a need for a change in the “culture” of how PD leaders do things. While this is likely to take time, a move away from top-down approaches to PD is needed. Second, it seems that only a minority of teachers seek further opportunities for PD other than those they are obliged to attend. This resonates with findings in Attard Tonna and Calleja’s [17] report but contrasts with Zammit’s [39] findings. Recognising that, at times, teachers face constraints to pursue self-sought PD courses, there are nowadays numerous other PD options available on the internet or through distance learning which one can participate in.

Recommendations

Teachers’ PD is a very important issue and needs to be addressed strategically. Well-thought and intentionally planned PD could enhance the quality of teachers’ learning Desimone, et al. [10]. The ultimate beneficiaries would be the students, who would greatly benefit from a varied and well-planned educational experience Meissel [53]. The study acknowledges that some recommendations require the involvement of persons holding senior positions, like policymakers and government entities. Activities prepared by teachers promoting good practices and innovative teaching ideas should be encouraged and supported. Also, financial support could also be provided for those teachers wishing to attend conferences or seminars both locally and abroad. This study recommends that new policies should be minimised, to allow time for teachers to gradually learn about and implement the required changes. If a new policy is needed, information and PD sessions should be provided well-ahead of the introduction of the new policy to help teachers acquire/update any required skills over a reasonable amount of time.

Sergiovanni [54] states that “one characteristic of successful schools is their ability to organise around and to effectively use collaborative cultures”, where leadership and learning are brought together for continuous improvement. Unfortunately, in many schools, teaching is often an individual practice Attard Tonna [55], but evidence in all areas of life shows that many times, a collective effort can produce better results Darling-Hammond [40]. Thus, SLT should encourage and sustain a climate of collaboration in schools by promoting and supporting collaborative initiatives such as PLCs, peer observation and co-teaching. However, concurring with James [56] SLT members should be sufficiently trained to provide teachers with on-the-job support, guidance and feedback, and to positively influence teacher practice and motivation.

Even though whole school initiatives are essential, schools should focus more on subject or topic-based PD initiatives built on teachers’ needs. This would make PD opportunities more meaningful for teacher growth, tailored to meet the teachers’ needs and interests Bezzina [57]. [51] suggest different methodologies which are useful for mathematics teachers, such as the setting up of teacher-led Communities of Inquiry, where critical analysis of practice and of other issues central to teachers’ work and lives can be discussed. Participation in Lesson Study, a PD model specifically focused on improving the teaching of mathematics through teacher group discussions, can be effective in bringing about such changes Huang [58]. This would allow teachers to make connections between research and practice, which can also be helpful for mathematics teachers Lewis [59].

Concluding Reflections

Teachers work in a fluid and complex environment, where a major source of job satisfaction is the act of teaching itself Lortie [60,61]. Many teachers engage in PD initiatives to improve their teaching in order to provide the best quality teaching possible for the benefit of their students Darling-Hammond [40]. Teachers need to be involved both as learners and teachers in their own development. Inquiry can be a means of raising individual and collective capacity by challenging teachers to reflect on and revise their practice, while simultaneously promoting teacher empowerment by enabling them to develop ideas outside of their usual boundaries Wall [62]. Real and sustained educational change for teachers can occur where inquiry is central to any form of PD, and where “a much more proactive and conscious approach [to change]” Kennedy [44] is utilised.

This study showed that teacher inquiry and collaborative practices can stimulate new ways of thinking and new ways of working. This study attempted to provide an overview of the current PD opportunities for mathematics teachers in Malta based on the reality perceived by the teachers themselves, a topic much in need of research in the local sphere. The findings indicate that while there are quite several PD opportunities available, many are provided by policy makers or planned by schools with minimal input from the teachers. Whereas all PD opportunities are essential, a critical issue must never be overlooked – that of deepening teachers’ content knowledge and developing their teaching practices for them to provide quality teaching and consequently, increase student learning. A change in approach, from one where teachers are at the receiving end to one where they actively seek and/or actually lead PD, is much needed. More opportunities which focus on the teachers themselves, and which target their needs and concerns, are required. Teachers need to take more control of their own learning. This calls for a change in how teachers are involved in the decision-making process with regards PD, starting with policy makers and SLT, but most importantly the teachers themselves. A move away from top-down approaches to PD towards more teacher autonomy with regards their learning is necessary to ensure greater commitment and teacher buy-in.

For More Articles: Biomedical Journal Impact Factor: https://biomedres.us

Open Access Journals on Microbiology Research

Development of a Semi-Quantitative Food Frequency Questionnaire Based on a Household Nutritional Survey in Communities in North Viet Nam

Introduction

Viet Nam is located in Southeast Asia and had a population of 96.48 million in 2019, an estimated life expectancy at birth of 76 for both genders (Men 71 and women 80) in 2012 [1]. Noncommunicable disease (NCD) caused 379,000 deaths (men 203,300 and women 175,700) or 73% of 520,000 occurred deaths nationwide. About haft of NCD deaths (54.3% in men and 46.1% in women) were under 70-year-old [2]. Non-communicable disease appeared to be the major health challenge to national development in the 21st century in the country. Four types of NCD were cardiovascular diseases, cancers, diabetes, and chronic respiratory diseases and their four main modifiable risk factors were tobacco use, unhealthy diets, physical inactivity, and the harmful use of alcohol. The World Health Organization (WHO) has pointed out in 2014 that unhealthy diets caused about 1.7 million NCD deaths globally in 2009 [3]. An unhealthy diet was to be one of the major risk factors and etiologies for developing NCD [3], including cardiovascular diseases, cancer, diabetes, and other chronic diseases. Specific recommendations for a healthy diet included eating more fruit, vegetables, legumes, nuts, and grains; cutting down on salt, sugar, and fats.

It is also advisable to choose unsaturated fats, instead of saturated fats and elimination of trans-fatty acids in our foods/ recipes. To understand the underlying cause of unhealthy diets related to the development of NCD and to address the benefits of nutrients contributed by fruits, vegetables, legumes, nuts, and grains in the prevention of diseases, dietary research is essential to conduct observational studies to the prevention of cancer and NCD in each country and global. The relation of diet to cancer and NCD has been reported in 1914 as far as we have documents [4]. In addition, later in 1947, the scientist has recommended that dietary history as a tool in dietary research [5]. A dietary history provided by study participants in using a semi-quantitative food frequency questionnaire (SQFFQ) to obtain detailed information on individual long-term dietary intake of foods/recipes and nutrients was one of the best methods of dietary research [6]. To collect the dietary history, investigators will interview participants about the average use of foods during the last year, of each specified food. That is, in the prospective Health Professionals Follow-up Study and the Nurses’ Health Study in the U.S. [7-9], participants provided information about frequencies of intake (i.e. never or less than once per month, 1-3 per month; 1 per week, 2-4 per week; 5-6 per week, 1 per day, 2-3 per day, 4-5 per day, and 6+ per day).

In the other study in Japan [10], investigators have to classify into seven categories of frequencies of intake (i.e. never or seldom, 1-3 per month; 1-2 per week, 3-4 per week; 5-6 per week, 1 per day, 2 per day, and 3+ per day). We assumed that participants have three meals a day (breakfast, lunch, and dinner); the lowest frequency of intake was 24 times per year (average of 1-3 per month) or 2.2% of 1,095 (365 days x 3) meals per year. To design an SQFFQ, the development of the database and selection of foods/recipes items reflected participants’ long-term dietary intake was the primary concern. Investigators have identified foods by nutrient contribution and stepwise multiple regression analyses in developing SQFFQ [6,10-12]. This combined analysis of both nutrient contribution and stepwise multiple regression analyses were just computing work, the selected foods based on these approaches might be included some foods with a low frequency or seldom intake (less than 1-3 times per month). To overcome this limitation we proposed to present frequencies of intake by participants for each selected food item in the database to develop a feasible SQFFQ. We conducted a household nutritional survey in communities of three provinces in North Viet Nam to select foods/recipes in developing a database of SQFFQ in collecting information on individual long-term dietary intake from participants of our prospective cohort and case-control studies in Viet Nam.

Methods

Conduction of a Cross-Sectional Nutritional Survey

We conducted a cross-sectional nutritional survey, householdbased using the designed questionnaire of 24-hour recall food records. Study sites were in three communes (clusters) represented three provinces located in the Red Delta River in the North Viet Nam, named Hung Yen, Ha Nam, and Bac Ninh (in proximity to the Hanoi city). Study time was in the 4th quarter of 2017.

The Designed Questionnaire of 24-Hour Recall Food Records

Part 1, family member registration: We collected information of each family member (Name, age, sex) and registered daily for breakfast (main=1/addition=2); lunch (main=3/addition=4); dinner (main=5/addition=6); and places of intake (at home or outside) [13]. Part 2, collection of 24-hour recall food records: We reported data and information for
i) Food name and recipes including information on food/recipe name, processing, and cooking methods.
ii) Weight before eating included name of measuring unit (MU), number of MU, the weight of one MU (in gram), and wasted proportion parts.
iii) Transfer for the next meal included information of food leftover, raw/ cook, name of measuring unit (MU), number of MU, the weight of one MU (in gram), remain in gram, clean-raw equivalence.
iv) Food coded following the list of available foods/recipes in Viet Nam. The designed 24-hour recall food records included these data and information to address Vietnamese diet customs. That is, household members eat together and share dishes for breakfast, lunch, and dinner at home. The interviewers attended the trained course in both class and pilot field practices in households for completeness of registered foods/recipes items and the accuracy of collected data and information presented in the designed questionnaire of 24- hour recall food records.

Conducted 24-hour Recall Food Records

biomedres-openaccess-journal-bjstr

Figure 1: Flow-chart of the household nutritional survey in communities in the North Viet Nam.

A household survey of 24-hour recall food records was conducted in 3 consecutive working days for 300 households (Figure 1) in Hung Yen (100 households), Ha Nam (100 households), and Bac Ninh (100 households) provinces by using the designed questionnaire of 24-hour recall food records from the National Nutrition Institute and its guidelines [13]. We randomly recruited the first household in each cluster, and then recruited the next household based on the door-to-door, until achieved 100 households from each cluster. Finally, we excluded two households in Hung Yen province due to some missing data and errors and there were 298 households to be eligible for the final data analyses in total. Interviews collected dietary information by a face-to-face interview in the households by the two-trained interviewers from the department of Nutrition of Hanoi Medical University. The investigators interviewed the household about all foods/recipes consumed by themselves at their house during the last 24 hours. All household’s members were registered for their breakfast (main=1/addition=2); lunch (main=3/addition=4); dinner (main=5/addition=6); places of intake were at home or outside.

The number of family members of 298 households was 1,327 (participated in the first day), 1,321 (second day), and 1,320 (third day). We calculated the number of home rations and weighted by age and sex for each family member, then sum up for total rations daily and three days. We assumed that the intake ratio of food of adult men aged 18-60 was to be 1.0. Then that was 0.4 for the age 1-3, 0.6 for the age 4-6, 0.8 for the age 7-10 and 61 or higher, 1.0 for the age 11-14 (for both boy (men) and girl (women)); 1.2 for boy and 1.1 for the girl for the age group 15-17; and 0.9 for girl (women) age 18-60 [13]. During three consecutive working days, 3,968 person-day were registered and the number of rations was to be 3,084.5 (Figure 1). We reported every food item in each meal with its estimated weight (in gram) and then converted it into a clean-raw weight (in gram). In total, the participated family members of 298 households consumed 257 food items for three days. In three cluster communities, farm markets provided the main foods/recipes as raw products. Before cooking, the clean-raw foods were prepared by excluding the wasted parts. For example, the proportion of wasted parts for some vegetables was 45% (Maize seeds, fresh, raw), 29% (Limnophila aromatic), 15% (Water spinach); and for some fruits was 35% (Pomelo), 25% (Orange), and 25% (Lemon) [14].

We converted into nutrients contributed by all clean-raw food items for every household, for daily, and for three days on average. Nutrients of interest: Based on the Viet Nam Standard Food Composition Tables (revision 2007 and updated in 2019) [14], the following 16 nutrients were selected: energy, protein, fat, carbohydrate, dietary fiber, vitamins (vitamin A, C, B1, B2, and carotene), minerals (sodium, potassium, magnesium, phosphorus, iron, and zinc). Quality management: when using the designed questionnaire of 24-hour recall food records in the participated households, we used the supported tools included a picture of selected foods/recipes with its portion size and weight of rice, fruits, vegetables, fishes in the condition of raw and cooked foods/ recipes. The experienced research nutritionists have to review and correct any errors for not only of completeness of registered foods but also the accuracy of collected data and information in the completed questionnaire of 24-hour recall food records, and family member registration who shared the foods/recipes at their home.

An Assumption of the Frequency of Intake During the Last Year of Each Specified Food in the Designed SQFFQ

Based on the prospective Health professionals Follow-up Study and the Nurses’ Health Study in the U.S. [7,8,9,15] and the other study in Japan [10], investigators have to classify the lowest frequency of intake as about 24 times per year (average of 1-3 per month). We assumed that participants in our study populations have three meals a day (breakfast, lunch, and dinner); the lowest frequency of intake was 24 times per year (average of 1-3 per month) or 2.2% of 1,095 (365 days x 3) meals per year. Our study populations comprised 298 households for three days, the total household days were 894. Therefore, we will present results for both select foods/recipes with at least 20 times of intake (2.2% of 894), and for foods/recipes with frequencies of intake less than 2.2% in the database of the current household nutritional survey.

Data analysis and Selection of Foods/Recipes

We estimated nutrients from the food by multiplying the foods/recipes intake (in grams) with nutrient content per gram of the food as listed in the Vietnamese Food Composition Table [14] (revision 2007 and updated in 2019 (in preparing)) in using an access programming. According to the contribution analysis and multiple regression analysis, we selected all foods/recipes with up to 90% cumulative contribution for these 16 nutrients. Afterward, all foods/recipes with up to 90% cumulative contributions and 0.90 cumulative multiple regression co-efficient were included in the SQFFQ. In addition, we estimated frequencies of intake (%) for each of the foods/recipes against a total of 894 household-day.

Results

Study participants comprised of 3,968 person-day (1,947 men and 2,021 women). Over 50% of person-day aged 18-<61 in both men and women. The aged 61 or older was 11.4% (men 10.2% and women 12.6%). Enfant (Aged 1-<4) included 343 (8.6% of total person-day), children were 298 (7.5%) (Aged 4-<7), 269 (6.8%) (Aged 7-<11), 232 (5.8%) (Aged 11-<15. The estimated number of rations was 3,084.5, (Table 1). Overall, macronutrients intake by 894 household-day (mean ± standard deviation (S.D.)) was for energy (1,878 ± 432.1 kcal), protein (82.0 ± 23.5 grams), animal protein (41.2 ± 21.2 grams), vegetable oil (12.4 ± 11.6 grams), fat (41.7 ± 22.1 grams), and carbohydrate (297.5 ± 73.2 grams). The estimated median intake was 1,824.4 kcal, a minimum of 826.1 kcal, and a maximum of 3,377.2 kcal. By provinces, the mean energy intake ranked between 1,824.2 to 1,908.3 kcal. The median energy intake ranked between 1,809.2 to 1,862.6 kcal, (Table 2).

biomedres-openaccess-journal-bjstr

Table 1: Characteristics of study participants (in person-day) by age group and gender.

Note: By the age groups, the intake ratio of food of adult men aged 18-60 assumed 1.0. Then that was 0.4 for the age 1-3, 0.6 for the age 4-6, 0.8 for the age 7-10 and 61 or higher, 1.0 for the age 11-14 (for both boy (men) and girl (women)); 1.2 for boy and 1.1 for the girl for the age group 15-17; and 0.9 for girl (women) age 18-60. During three consecutive working days, 3,968 person-day were registered and the number of rations was 3,084.5. #Children less than 1-year-old not included in the study population because they were not shared foods/recipes with other members in households.

biomedres-openaccess-journal-bjstr

Table 2: Macronutrients intake by participants in three provinces for one intake ration.

Note: S.D: Standard Deviation, P25: 25th percentile, P75: 75th percentile.

For energy contribution, there were 27 foods/recipes that contributed up to 90% and the major contribution was ordinary polished rice (58%), followed by pork medium fat (5%), wheat noodles (4%), and pork lean (4%), (Table 3). The cumulative R square change was up to 0.91 and included 12 foods/recipes. The highest R square change was ordinary polished rice (0.75), followed by glutinous rice, milled (0.03), milk, dried-whole powder (0.02), and wheat noodles (0.02), (Table 4). Overall, for 16 nutrients of energy, protein, fat, carbohydrate, dietary fiber, vitamins A, C, B1, B2 and carotene, sodium, potassium, magnesium, phosphorus, iron, and zinc, the number of foods/recipes contributed up to about 90% was 27, 30, 24, 7, 31, 13, 18, 22, 38, 28, 24, 33, 37, 35, 38, and 19, respectively. For those 16 nutrients, the number of foods/recipes with the cumulative R square up to about 90% was 12, 22, 18, 2, 24, 5, 4, 4, 17, 8, 3, 20, 25, 20, 27, and 11, respectively, (Table 5).

biomedres-openaccess-journal-bjstr

Table 3: Energy contribution and cumulative percent contribution up to about 90%.

biomedres-openaccess-journal-bjstr

Table 4: Cumulative R square for energy.

biomedres-openaccess-journal-bjstr

Table 5: Number of food contributing with up to 90% cumulative contribution and 0.90 R square by the participants for each nutrient.

In total, 97 foods/recipes were selected and they included 73 items with the frequency of intake of 20 or higher times (2.2% of 894 household-day) and the remained 24 items with the frequency of intake less than 20 times in total 894 household-day. The highest frequencies of intake were the ordinary polished rice, raw with 891 times (99.7% of 894 household-day). The estimated mean intake was 303.4 grams per day, and the percentile (P) was 249.3 grams for P25 and 362.1 grams for P75. The lowest mean intake was one for the beef tongue (0.1% of 894 household-day). For detailed selection information of contribution to 16 nutrients of energy, protein, fat, carbohydrate, dietary fiber, vitamins A, C, B1, B2 and carotene, sodium, potassium, magnesium, phosphorus, iron, and zinc by the 97 selected foods/recipes items were presented. Among these 16 nutrients, the highest contribution for 14 nutrients was the milk, dried-whole powder; followed the next contribution for 13 nutrients were 5 items of the ordinary polished rice, raw; water spinach; chicken meat, average; pork lean; and pork medium fat. For detail selection information selection by R square up to 0.90 cumulative multiple regression co-efficient for 16 nutrients, the ordinary polished rice, raw contributed to 12, followed by the pork lean to 10, and milk, dried-whole powder, pork medium-fat to 9 nutrients. (Data not shown). In total, the database comprised of 12 groups of foods/recipes that included cereals (9 items), peanuts and beans (7) vegetables (24), fruits (10), fat and oil (3), red and white meats (22), fishes (10), eggs (4), milk and its products (3), snacks (2), salt and fish sauce (2), and alcohol or vodka (1).

Discussion

The Main Findings

In total, study participants consumed 257 foods/recipes during three consecutive weekdays by 298 households. The present main findings presented the list of foods/recipes of the database of SQFFQ for dietary research in the country with a unique Vietnamese diet custom in households with the main foods/recipes provided daily from the local farm markets. Based on the nutrient contribution up to 90% and cumulative R square up to 0.90 multiple regression co-efficient for 16 nutrients, the recommended number of foods/ recipes items was 97 (included 73 items having the frequencies of intake of about 2.2% or higher and remained 24 items less than 2.2% of all 894 household-day). We collected from three provinces border with the Hanoi city with a relatively large sample size of 298 households having 1,327 members for three consecutive days that would be currently represented the local nutritional status in developing and designing SQFFQ. We divided 97 selected food items into two groups having the estimated frequencies of intake at least 2.2% and below this cutoff level for further decision in developing a specific SQFFQ for cancer, other NCD, or focus on a specific nutrient related to consumer’s health depended on the local communities. Our results provided the updated nutritional status for the Red Delta River in North Viet Nam for the macronutrients of energy, total protein, total fat, and carbohydrate intake in three communities.

Our innovative approaches were to emphasize developing a database of SQFFQ to study the association of local diet with cancer and other NCD included metabolic disorders and diabetes. Besides, we analyzed and added information on frequencies of intake by 894 household-day in connecting with data computing outcome of cumulative up to 90% contributions and 0.90 cumulative multiple regression co-efficient [6,10,11,12] for 16 nutrients. Based on the current findings, we proposed the lowest frequency of intake was 6-11 per year for each specific food/recipe. Therefore, we proposed to classify into seven categories of intake frequencies: never or seldom, 6-11 times/year, 1-3 times/month, 1-2 times/week, 3-4 times/week, 5-6 times/week, and 1-3 times/day. The final designed SQFFQ and its validation will report in the other work. Our results of the estimated 16 nutrients of energy, protein, fat, carbohydrate, dietary fiber, vitamins A, C, B1, B2 and carotene, sodium, potassium, magnesium, phosphorus, iron, and zinc have consisted with the findings from the National Nutritional Survey for the same region of the Red Delta River in 2009-2010 [13]. For internal comparison, between three clusters, the estimated amount of intake of these 16 nutrients has also consisted. The results suggested that the present database would be represented the current dietary status of participating communities to develop an SQFFQ.

Vietnamese Dietary Patterns

The ordinary polished rice was the main food that contributed up to 58% of energy with the mean intake per adult person per day of 303.4 grams. The ordinary polished rice is also rich in non-animal protein, vitamin B1, vitamin B5, carbohydrates, and several minerals [14]. The other good diet of Vietnamese is many vegetables, about one-fourth of selected food items (24 of 97 listed items), fruits (10 of 97 listed items), and fish (10 of 97 listed items). The other good diet custom is household-based in using daily fresh farm products. Vietnamese women mainly have meals of breakfast, lunch, and dinner at home and rarely tobacco smoking and alcohol drinking [1,2]. These healthy lifestyles resulted in the positive estimated life expectancy at birth in women was as high as 80 in 2012. In addition, Vietnamese women have the lower estimated cancer incidence rate of all cancers excluding non-melanoma skin cancer (114.3 per 100,000, age-standardized rate using the Segi- World population structure, ASR) than men 173.0 per 100,000, ASR), and women in Japan (185.7 per 100,000, ASR), and women in the more developed regions (239.9 per 100,000, ASR) [16]. Using the designed current SQFFQ to clarify protective factors related to foods/recipes against cancer in Viet Nam is timely needed.

Number of Selected Foods/Recipes Included in the SQFFQ

Our findings suggest that the total listed foods/recipes were 97 items, and the database comprised 12 groups. In other countries in Asia, the number of listed foods/recipes was 102 in Japan [10], 112 in Korea [17], 163 in Singapore [12], 184 in India [18], 119-125 in China [19,20]. The number of food items of the present database of SQFFQ in the North Viet Nam (97 items) was shorter than other designed SQFFQ in these countries. To address the quality of our designed SQFFQ, we will report soon the results of its validation of feasibility, practicality, and reliability.

A Possible Limitation of the Present Study

Our current study was just to select foods/recipes in the development of a database of SQFFQ and it needs to validate. The other limitation was that the obtained foods/recipes have not weighted for each item. Despite these limitations, our findings have the first development of the database of SQFFQ to collect information on individual long-term dietary intake to understand the underlying cause of unhealthy diet-induced cancer and other NCD in the country.

For More Articles: Biomedical Journal Impact Factor: https://biomedres.us

Open Access Journals on Medical Research

Features in the Emergence and Reemergence of Infectious Diseases, Gain-of-Function Research and Geopolitices

Introduction

The application or utilization of gain-of-function, GoF or gainof- function research, GoFR in association or absence of geopolitics or geopolitical activities has created concerns in the emergence and reemergence of infectious diseases [1]. The SARS-CoV-2 or COVID-19 [1,2] Omicron (Nu or Xi) is a nascent or newfangled Variant of Concern. This designation as may be applicable to other nascent or newfangled microorganisms, such as subunit variant BA.2 of the Omicron COVID-19 genre denotes sharing of genome sequences, informing the WHO of initial cases and clusters, conducting field, laboratory investigations and assessment to explicate or elucidate efficiency, effectivity, epidemiology, public health, medical and nonpharmaceutical inputs, severity, transmissibility, clinic pathological correlates and overall impacts of these microorganisms as they pertain to the global population, especially vulnerable populations. It is imperative to resist ‘’travel apartheid’’ in a pandemic that is not an endemic situation as in the current ban on select countries due to the COVID-19 Omicron variant. In the guise of preventing COVID-19, the world must tread with caution on Emergency Use Authorization and booster doses of vaccines, especially with the advent of the subunit variant BA.2 Omicron COVID-19. Although, gain-of-function research enables testing of new scientific theories, development of novel technologies, discoveries and targets for treatment of infectious diseases, it is a territory to be treated with caution.

Global Conspectus on the Impacts of Infectious Diseases

In recent decades, there have been exacerbating outbreaks of infectious diseases with grave emergence and reemergence worldwide. These incorporate the severe acute respiratory syndrome coronaviruses [1,2], swine flu, Middle East respiratory syndrome coronavirus, the Zika virus and the Ebola virus disease disseminating across international boundaries; thus, ushering in an era of unprecedented climate, demographic and technologic spatiotemporal variations [1] in both rural and urban precincts with escalating threats to hunger/food security, environment, health and socioeconomic activities [1,3,4]. These pose grave threats which require countries with vast resources and conscionable geopolitical imperatives to contribute and enhance global health and environmental security to stem the increased risk in the emergence and reemergence of novel infectious diseases [5-7]. All nations continue facing the threats of an avalanche of emerging and reemerging infectious disease epidemics and pandemics.
These have resulted in widespread escalating global concerns due to their excruciating and debilitating effects [1,8] with the inextricable linkage of infectious diseases and geopolitical stability without an iota of consideration for international boundaries or borders. Understanding geopolitical determinants and gain-offunction research will enhance evidence and imperatives for the improvement of preventing and treating emerging and reemerging infectious diseases globally. Protagonists of international health, policy and security have perspicuously enhanced health perspectives and interventions in association with political stability and gain-of-function studies to address the disproportionate global perturbations and impact of the SARS-CoV-2 Omicron variant and other microbial variants as they reflect on strategies to balance public and medical modalities in the pandemic devoid of stigmatisation regarding the origin(s)/source(s) as in HIV/AIDS controversies [9].

Gain-of-Function Research and Geopolitical Attributes

Gain-of-Function research is capable of exposing perspicuous mutation occurring in defined viruses, permits easier community surveillance, and identification of the genesis of the mutations, contemporaneous production of compatible and veritable vaccines [6,7] and feasible treatments. Thus GoF research connotes the serial presentation of microorganisms whereby their host tropisms, immunogenicity and virulence are augmented via the inducement of specific pressure to a defined culture [10].
CRISPR, a gene editing technology is feasible coupled with selective serial passaging in the investigation of the functionality of defined genes on protein expression and roles of organisms as well as the biological mechanisms undergirding the transmission and replication of viruses [10]. Nascent SARS-CoV-2 variants having mutations in the spike glycoprotein emanated independently in numerous locales within ostensibly significant functionalities. These aggregated mutations in the 501Y, K417N and E484K were detected in the receptor-binding domain, RBD including mutations in the N-terminal domain, NTD [11]. The nascent SARS-CoV-2 or COVID-19 Omicron variant, B.1.1.529 (Nu, Xi) was detected through genomic sequencing.

Vaccines and Treatment

Exploration of vaccines and treatment modalities as well as trending strategic scenarios in the context and perspective of erstwhile epidemics and pandemics provides valuable applications for the prevention, control and treatment of emerging and reemerging infectious diseases. This means an upward review for inter alia compulsory application of face masks, practical sustained manual hygiene, social distancing, assembly in well-ventilated ambients and other pertinent non-pharmacological interventions, compliance to preventative strategies to restrict the dissemination of the newfangled variants [6,7] per gain-of-function research and geopolitical interventions. Statistical equivalence tend to indicate that vaccines have been protective against the presenting coronavirus variants. The mRNA vaccines by Moderna and Pfizer- BioNtech are more effective than the Astrazeneca variety. Animals are liable to contract SARS-CoV-2, and viral reservoirs can revert same to humans. However, the pharmaceutical industries are faced with paucity of data in the choice of viruses for immunization. A newfangled oral antiviral drug, Molnupiravir for the effective treatment of the COVID has been produced by the Merck and Ridgeback Biotherapeutics [12], and it is incumbent on developed countries with abundant resources to distribute these vaccines to poorer countries and vulnerable populations worldwide [6,7].
Due to emerging variants, the COVID-19 pandemic has placed the production of a veritable vaccine in an intricately complex situation as the pharmaceutical industries have limited data for the immunization against any particular coronavirus. It is considered that the gain-of-function research whereby there is certain genetic manipulation culminated in more deleterious delta variant of SARSCoV- 2, the etiologic agent of COVID-19 [6, 7]. Although, this remains speculative, the gain-of-function standard on the conspiracy and collaboration of China and the NIH of USA will be protracted even as the source, origin, socioeconomics, geopolitics and legal implications of SARS-CoV-2 are sustained or controverted by Gainof- function research of concern, GOFROC as a discretionary term [13]. With regard to pharmaceutical drugs, Ibuprofen, also called Advil and Motrin is a common non-steroidal anti-inflammatory anti-pyretic therapeutic agent, additionally used for pain mitigation, fever, swelling and redness [14]. It was suggested that ibuprofen was an inappropriate treatment for certain symptoms in COVID-19 patients because SARS-CoV-2 was detected to bind to target cells through ACE2 in the respiratory apparatus [15]. Thus, it was suggested that ACE2-stimulating drugs, ACE inhibitors and ibuprofen aggravate the risk in the severity of morbidity and mortality of COVID-19 [16]; and, as such, not amenable in COVID-19 suspected cases [17]. However, it has not been proven that ibuprofen is associated with symptom derangement, prolongs illness, or that resultant or concomitant inflammations mask COVID-19 severity, interfere in certain immune response or elevate the viral infection [14].
These controversies that ibuprofen and other NSAIDs are not veritable choices in the treatment of symptoms in COVID-19 patients may be related to bias of retrospective short-term studies. Armchair scientists, researchers and medical practitioners are liable to misinterpret, misrepresent, omit or mislead authentic bioinformatics and spatiotemporal variations [1,14] geopolitical activities and gain-of-function in SARS-CoV-2 or COVID-19 emerging and reemerging variants. The unpredictable and unprecedented accelerated dissemination of these nascent problems present novel challenges and opportunities for the production, formulation, administration and regulation of vaccines and other therapeutic pharmacological and non-pharmacological approaches [6,7,14,18].

Natural and Anthropogenic Factors in Infectious Disease Progression

Socioeconomic, natural, anthropogenic and other related constructed systems, such as geopolitics and gain-in-function research modalities have contributed to deleterious effects of certain microorganisms including the HIV/AIDS and COVID-19 or SARS-CoV-2 pandemic. These have impacted on the environment, social welfare, wellbeing and quality of life, biodiversity, ecological systems, governmental policy, governance [19], ecosystem cadastre [3], primary healthcare structure [20,21] with concomitant social hysteria [22] in this COVID-19 pandemic era. These are presenting expansive effects of epidemics and pandemics across domestic and international borders or boundaries of countries or regions which have altered the trajectories of emerging and reemerging infectious diseases. The eradication or mitigation of upsurge in variants of infectious diseases may discontinue ecological interference of diverse epidemics and pandemics, such as HIV/AIDS, coronavirus, Cryptosporidium, Cystoisospora, Acanthamoeba, Ebola virus, Lassa fever, and yellow fever infections and infestations [1].
Contributing factors to emerging and reemerging infectious diseases include expansive increase of human population, migration, rapid increases in internecine conflicts, hunger [23], geopolitical situations, deforestation, and abuse of pharmacological agents [24,25] as well as the complexity of interactive events of anthropogenic and natural interplay in the emergence of novel microbial agents, and reemergence of erstwhile infectious diseases presumed to have been eradicated. Natural occurrences and anthropogenic activities have expansively contributed to facilitate the emergence, reemergence and dissemination of infectious diseases both locally and globally with their extant constraints and challenges as they fit into the environmental, public health, sociological, economic, salient and latent spatiotemporal and pecuniary burdens [22] associated with developmental and geopolitical activities.

Exploring Converging Spheres of Emerging and Reemerging Infectious Diseases and Microorganisms

Researchers tend to agree that within the past four decades, there have been remarkable global perspectives in taking cognizance and responding to threats of infectious diseases and harmful microbiota, especially since the SARS outbreak of 2003 [1,26,27]. The geopolitics of the presenting COVID-19 pandemic intersects in an inextricably complex global and transboundary trajectory that challenges global governance, policy and international cooperation. The COVID-19 pandemic has exposed the inherent dangers in the frailty and fragility of international cooperation of discrete and disparate national boundaries and territorial integrities or other collective responsibilities for sharing and distributing public health supplies, deciding on local and global strategic issues, excoriating and exacerbating pressures on food security [28], vaccines [6,7], scarce resources [29,30], disruption of population density and climate change, especially in the least developed countries. These also pertain to the developed countries with the hardest hit of the COVID-19 pandemic exposed to environmental perturbations, such as poor atmospheric/air quality, public health and climate issues or challenges for coordinated response in a multidimensional strategy [31].
The immunodeficiency syndrome is a presentation of relatively inextricably-linked severe disorders due to the human immune deficiency virus, HIV1 [9]. AIDS is mainly a disorder in erstwhile healthy persons without perspicuous underlying iatrogenic etiology. Controversies have been enmeshed in the origin [32], incidence and prevalence of HIV, the social implications [9] and legal status have been extensively debated [33]. Devoid of effective and efficient vaccination, there will be incessant dissemination of the AIDS virus across international boundaries worldwide, there is no extant conclusive evidence that the AIDS virus emanated from sub-Saharan Africa, or that the progenitor virus was extant in Central Africa [9]. Even by 2030; the African region may not terminate the AIDS scourge as a public health threat because the continent continues to fall short of the pertinent 75% dimunition in nascent HIV infections and 81% 2020 dimunition in AIDSassociated mortality [34]. These are evident, although, a vast majority of persons are aware of their HIV status and treatment schedules or rates.
Nascent HIV infections and AIDS-associated mortality are not concomitantly diminishing. The African continent, and especially, the sub-Saharan Africa sub-region cannot afford to be detracted in the urgent quest and focus to curb the inequities which conduct AIDS, other epidemics and pandemics. Despite the challenges and issues, it is evident that remarkable progress has been achieved or achievable against HIV in recent decades and in the future regarding the decrement of morbidity and mortality rates in the entire continent due to ardent and strigent measures as well as consumption of antiretroviral drugs. It is imperative to employ equitable access to treatment, uninterrupted services, global sharing and solidarity which constitute essential ingredients to harness and curb HIV/AIDS, COVID-19 or SARS-CoV-2 and other emerging and reemerging deleterious microbiome. The Cryptosporidium parasite with the ensuing infection of cryptosporidiosis continues unabated to constitute both environmental and public health problems in the category of emerging and reemerging diseases globally [35,36].
The correlates of protective immunity and the parasitosis of the Cryptosporidium spp in both humans and animals have ostensibly confounded policy makers and researchers alike; and its prevention has involved configuring disparate or converging modes of research and policies which may have impacted, and continue to impact on geopolitics and gain-of-function issues not yet unravelled in the public domain. These tendencies are invariably manifest in cystoisosporiasis, erstwhile referred to as isosporiasis [37]. Globally, especially in tropical and sub-tropical ambients, the infection due to the etiologic agent, Cystoisospora belli, C. belli is common in immunocompromised persons, such as HIV-infected/AIDS patients. Cystoisosporiasis, HIV/AIDS and SARSCoV- 2 patients exhibit clinicopathological correlates pertinent to elucidate associated comorbidities and mechanisms of these disorders. Geopolitics and gain-of-function tinkering are liable to obfuscate or mask the contracting and dissemination of these diseases resulting in gross neglect of the disparate pathological influences and manifestations among vulnerable populations [37].
Cystoisoporiasis and several other protozoal infestations and infections, such as microsporidiosis exclusively or in comorbidity with AIDS [38] are emerging and reemerging infectious diseases [1] prevalent in low- and middle-income countries, LMICs than in high income countries. Amongst other protozoal infections, cystoisosporiasis patients may not be more susceptible to SARSCoV- 2/COVID-19 but the probable geopolitics and gain-offunction trajectories with resultant variants pose dimensions of concern. The epidemiology and clinicopathological features of C. belli are significant for routine surveillance of the parasite in immunosuppressed patients [37] for sustainable geopolitics and gain-of-function of concern as well as related anthropogenic interventions in gain-of-function research.
Thus, in the ocular apparatus, SARS-CoV-2, otherwise alluded to as the coronavirus 2019 or COVID-19 has precipitated health repercursions of perturbing unprecedented magnitude or dimensions [39,40] with deterioration of the ophthalmic system. It has caused susceptible individuals suffering from Acanthamoebic keratitis to seek cogent healthcare due to increased risk of COVID-19 infections via wearing of contact lenses [41]. There are stringent efforts to prioritize community capacity in the surveillance and curbing of Acanthamoeba keratitis in the environ [42] to avoid severe ophthalmic diseases, such as anterior uveitis and conjuctivitis as well as the attendant consequences of geopolitical and gain-of-function issues.

Socioeconomic Effects of Emerging and Reemerging Infectious Diseases

The alleviation or eradication of local and global poverty as well as hunger [43] with adequate health provisions, sustainable development and environment is a daunting task in the face of epidemics and pandemics of emerging and reemerging infectious diseases as depicted, for instance, in the scourges of the swine flu, HIV/AIDS, Ebola virus, SARS-CoV-2 or COVID-19. This is more so as we take into cognizance the UN’s 17 Goals in the face of constricted resources and bourgeoning human populations inhabiting Planet Earth. With current abject poverty and hunger amongst vulnerable populations in tropical and sub-tropical Africa, Asia including Latin America in contrast to ostensibly resource-endowed North America and Europe, there are greater extant socioeconomic and healthcare deprivations and diminished wealth acquisition and resource control in the COVID-19 pandemic [29,30].
The SARS-CoV-2 or COVID-19 variants have configured or undergone gain-of-function to expose local and universal geopolitics with resultant excruciating hunger [22]. Indubitably, the COVID-19 pandemic with other emerging and reemerging, and non-comparatively salient infectious diseases have exposed the non-pragmatic preparedness, conscience and justice in the imposed geopolitics of local and global institutions driven by inter alia the disruption, and dimunitive capacity of small- and medium-sized enterprises. It is pertinent to predict the impact and resurgence of epidemics and pandemics of infectious diseases and their variants of concern in order to rescue the human population and businesses from extreme dissipation.

Discussion

Gain-of-Function research (GoF research, GoFR) medically implies genetic alteration of an organism to augment the biological functionalities of gene products, such as pathogenesis, transmissibility or microbiome host range and targets to optimally predict the emergence and reemergence of infectious diseases with concomitant development or formulation of vaccines and therapeutic agents [44]. Inasmuch as diverse entities, such as policy makers and research scientists may differentially explicate Gain-of-Function research, it may contextually connote genetically as mutations which grant a gene, RNA or protein newfangled potentialities or expression in contradistinction to Loss-of-Function that depicts the resultant dimunitive capacity of a gene to access its deficiency, thereof [45]. As it presents expansive advancements in global health, gain-of-function research poses biosafety or biosecurity and governance concerns which definitely neccesitate legislative and regulatory measures regarding the emergence [46] and reemergence of infectious diseases in convergence with both domestic and international standards [47], undergirding environmental legislation and citizen participation [48] for sustainable development [49] to obviate risks, dire repercussions, intransigent, unconscionable and irresponsible research as may affect biosafety and biosecurity [47].
The epidemics and pandemics associated with emerging and reemerging infectious diseases with their superimposed geopolitics and gain-of-function issues portend far-reaching impacts on the human population both locally and globally [1]. Persons having acute and chronic health conditions are invariably at differential risks of morbidity and mortality from the sequelae of inter alia SARS-CoV-2/COVID-19 and HIV/AIDS [50]. The superimposed social distance to flatten the curve in nascent cases negatively depict the status of the economy, thus, intersecting extant health perturbations, such as HIV/PWH within vulnerable populations. The clinicopathological correlates in these diseases may contribute in unravelling or elucidating contemporaneous prevention, treatment, vaccines [51] and control of geopolitics and gain-offunction natural and anthropogenic occurrences in the emergence and reemergence of infectious diseases [1,37,52].

Conclusion

The emergence and reemergence of infectious diseases have posed expansively grave threats globally. Invariably, numerous disparate and inextricably-linked factors, such as demographic spatiotemporal variations, disruption of ecosystem cadaster, inappropriate, incomprehensible and dysfunctional health systems as well as intersecting geopolitical exhibitions, natural and anthropogenic gain-of-function presentations. Presently, of all the emerging and reemerging infectious diseases, it is pellucid that SARS-CoV-2 as the causative agent of the COVID-19 pandemic has assumed center stage in global politics and investigations, especially geopolitics and gain-of-function research with its neverending variants of concern, such as the nascent and prevailing Omicron. Even though, the Omicron variant is a recent discovery, governments, economies and health systems have responded immensely to curtail an unpredictable and unprecedented adverse dissemination of events.
The rapid global dissemination of this nascent variant may be precarious due to spatiotemporal deficient genomic sequences with probable interlaced non detection of several cases, and masking of the presence and/or effects of concomitant emergence of other variants and infectious diseases. With the simultaneous ban and restriction on foreign travels, the world economy has begun to take a plunge for the worst. Numerous economies are vulnerable to the dissemination of the adverse emergence and reemergence of infectious diseases presenting a bleak outlook and test for economic policies and governance. The invariable podcasts and calculus depict incapacitated and ignorant countries in dire need on how to cope with emerging and reemerging infectious diseases by obviating the adverse effects of geopolitics and gain-of-function research.

For More Articles: Biomedical Journal Impact Factor: https://biomedres.us

Open Access Journals on Medical Research

Determination and Profiling Of Secondary Metabolites in Aloe Vera, Aloe Arborescens and Aloe Saponaria

Aloe is a very common Liliaceae family, native to Africa, containing approximately 400 species of tropical plants. Throughout history, it has long been used for medical purposes. Meanwhile, from the 400 species of Aloe, only a few have been traditionally used as herbal medicine. In this regard, A. vera is the commonly used form of Aloe for medical purposes. Aloe contains several classes of secondary metabolites such as phenolic compounds, saponins, sterols, and several anthraquinones. Aloin and emodin are the most important anthraquinones, and they exhibit anti-bacterial, anticancer, anti-viral, and analgesic activities [1-3]. Metabolomics has been demonstrated to be an appropriate tool for the composition analysis of plants and foods [4]. Thus far, some studies have reported the use of gas chromatography mass spectrometry (GC–MS) and High Performance Liquid Chromatography (HPLC) for the analysis of Aloe species [5,6]. On the other hand, the metabolite profiles of Aloe species based on 1H-nuclear magnetic resonance (NMR) spectroscopy have not been reported. Metabolomic analysis techniques are preferable for obtaining metabolite profiles as they are rapid and reproducible; moreover, the preparation procedures of samples are simple [7,8]. A technique based on NMR can satisfy those requirements, considering that NMR has been broadly employed as a fingerprinting tool for the quality control analysis of natural and synthetic products.
The use of 1H-NMR spectroscopy for metabolite profiling and fingerprint analyses has been reported for the characterization and analysis of comparative amounts of specific herbal extracts. Recently, several metabolic profiling techniques have been reported in general, and new methods have also been reported for metabonomic [9-11] and metabolomic studies [12,13]. Metabolite fingerprinting using 1H-NMR has been extensively used for various plant-derived products such as green tea [14,15], ginseng [16,17] wine [18-20], olive oil [21], Angelica gigas [22] , and others [23-25].Carotenoids, mainly found in photosynthetic organism including plant, bacteria, and fungi, are d a diverse group of organic compounds derived from the 2-C-methyl-D-erythritol 4-phosphate pathway (Figure 1). The group contains more than approximately 600 naturally occurring pigments responsible for yellow, orange, and red colors [26] being part of various physiological processes in plants. Meanwhile, in human, several carotenoids are considered essential nutrients, and the others exhibit protective effects against some diseases. For instance, α- and β-carotene are precursors of vitamin A, which are essential for the prevention of xerophthalmia, and blindness, and premature death [27,28]. In addition, the consumption of other carotenoids has been reported to significantly decrease the risk of lung and prostate cancer [29,30], photosensitivity disease, cataract, and cardiovascular diseases [31,32]. Meanwhile, phenylpropanoids are organic compounds that are synthesized from phenylalanine in plants (Figure 1).

biomedres-openaccess-journal-bjstr

Figure 1:

A. Biosynthetic pathway of carotenoid in plants.
B. Biosynthetic pathway of phenylpropanoid in plants.

It is also widely distributed in nature and is one of the highest secondary metabolites in the plant kingdom. The biosynthesis of various secondary metabolites such as antioxidants, light protectants, coumarins, hydroxyl-cinnamic amides, salicylic acid, lignins, flavonoids and pigments has been reported to follow the phenylpropanoid pathway [33,34]. However, while previous metabolic studies for Aloe species have mainly focused on biosynthesis of anthraquinones, which is represent one class of secondary metabolites in Aloe , the biosynthesis of carotenoid and phenylpropanoid remains neglected.In this study, 1H-NMR-based metabolite profiles of Aloe species such as A. vera, A. arborescens, and A. saponaria were investigated. Their secondary metabolites such as carotenoids and phenylpropanoids were also separated and quantified by HPLC. The present study is to give insight into metabolite profiling using 1H-NMR as a reliable approach for obtaining complementary description on primary and secondary metabolites among three different species of Aloe.

Materials and Methods

Plant Materials

For chemical analysis, three species of one-year-old Aloe was supported by Jeju Aloe farm of Kim Jeong Moon Aloe (Jeju, Korea). First, the leaves of the three species of Aloe were harvested, respectively. Next, fresh samples were dipped into liquid nitrogen and stored at −80 °C in DF8510 deep-freezer (Ilshin Lab Co., Ltd., Daejeon, Korea) until further use. Finally, all the samples were freeze-dried at −80 °C for 72 h, and lyophilized samples were ground into a fine powder.

Sample Preparation for NMR Analyses

The sample preparation and NMR analysis were performed using a method reported in a previous study (Jung et al., 2013). First, Aloe powders were weighed into 100 mg. Second, 500 μL of methanol (d4) (99.8%), 400 μL of a 0.2 M phosphate buffer solution (0.2 M Na2HPO4, 0.2 M NaH2PO4 in deuterium oxide (D2O), pH 7.0), and 100 μL of 5 mM 2,2-dimethyl-2-silapentane-5-sulfonic acid (DSS, 97%) as extraction solvents were transferred to the sample powders. Third, DSS was used for the internal standard with a chemical shift (δ) of 0.0 ppm, and D2O was employed for the internal lock signal. Next, the extracts were adjusted to pH 7.0 using 1 mM HCl and NaOH solutions after sonication for 20 min and were centrifuged at room temperature at 13,000 rpm for 10 min. Finally, 600 μL of the extract was transferred to 5 mm NMR tubes (Norell, Landisville, NJ, USA) for NMR analysis.

NMR Spectroscopy

1H-NMR spectra were recorded on a VNMRS 600 MHz NMR spectrometer (Agilent Technology, Santa Clara, CA, USA) using a triple-resonance 5 mm HCN salt-tolerant cold probe (Agilent Technology). A NOESY PRESAT pulse sequence, suppressing signals of the residual water, was used to obtain the spectra. 64 K data points were acquired from 32 scans using following parameters: spectral width, 8445.9 Hz; a relaxation delay, 2.0 s; and an acquisition time, 4.0 s; and a mixing time, 100 ms. All the spectra were Fouriertransformed with a line-broadening value of 0.5 Hz line, followed by phase-adjusting and baseline correction using Chenomx NMR suite 6.0 software (Chenomx Inc., Edmonton, Canada). The signal assignments of samples were facilitated with Chenomx NMR suite 6.0, a 600 MHz (pH 6.0−8.0) NMR database and comparison with literature values [35,36].

1H-NMR Data Analysis

1H-NMR data analysis was performed using a method reported in a previous study [37]. Each NMR spectrum was bucketed by integrating regions containing an equal bin size of 0.01 ppm over a δ range of 0.8–7.70. All shifts associated with the solvent (i.e., between 3.25–3.33 and 4.73–4.92 ppm) and DSS were removed. The normalization of spectra was achieved with the standard (DSS) peak area, and the spectra was converted to the ASCII format. ASCII files were imported into MATLAB (R2006a; Mathworks, Inc., Natick, MA, USA), and all spectra were aligned using the correlation optimized warping (COW) method. For multivariate data analysis, SIMCA-P+ version 12.0 (Umetrics, Umea, Sweden) was used, and then the files were Pareto-scaled to minimize the effect of baseline noise and deviations. Principal component analysis (PCA) and partial least squares discriminant analysis (PLS-DA) were carried out to investigate the intrinsic variation in the data set and acquired an overview of variation among the groups. Variables with variable importance in projection (VIP) values > 1 in the PLS-DA model were sorted and heat map was generated from VIP values > 1 using MultiExperiment Viewer Ver. 4.9.0 (Mev, http://www.tm4.org/ mev/). The metabolites of Aloe extracts with VIP values > 1 were quantitated with the Chenomx NMR suite 6.0 software, comparing the integral of the DSS signal with the equivalent from a library of compounds including peak multiplicities and chemical shifts for all the compound resonances.

Extraction and HPLC Analysis of Carotenoids

The extraction and analysis method used for carotenoid analysis was similar to the previous studies [38, 39]. Briefly, 300 mg of powders from samples of the three species was transferred to 3 mL of 0.1% ascorbic acid/ethanol (w/v) and then vortexed for 30 s. The mixture was incubated in a water bath set at 85 °C for 5 min. Next, 120 μL of 80% potassium hydroxide (w/v) was loaded to saponify any potentially interfering oils and incubated set at 85 °C for 10 min. Subsequently, each sample was placed on ice to stop the reaction for 5 min, and then 50 μL of β-Apo-8’-carotenal (25 ppm), as an internal standard was added, Next, the sample was extracted with 1.5 mL cold distilled water and 1.5 mL of hexane (SAMCHUN Chemical, Pyeongtaek, Korea), and then centrifuged at 1,200 rpm at 4 °C to obtain supernatants. The above-mentioned procedure was performed twice more. Then, the collected extract was dried under nitrogen gas and re-suspended in 300 μL of dichloromethane/ methanol (50:50 v/v). An Agilent Technologies 1100 series (Palo Alto, CA, USA), HPLC system combined with a C30 YMC column (250 × 4.6 mm, 3 m; Waters Corporation, Milford, MA) and with a photodiode array (PDA) detector was used to separate carotenoid contents. HPLC condition was set as follows: detection wavelength, 450 nm; flow rate, 1.0 mL/min; injection volume, 20 μL. The gradient program was established: Solvent (A), methanol/water (92:8 v/v) with 10 mM ammonium acetate; Solvent (B); 0 min, 83% A; 23 min, 70% A; 29 min, 59%; 35 min, 30% A; 40 min, 30% A; 44 min, 83% A; and 55 min, 83% A. Each compound was identified and quantitated primarily compared with UV-visible spectrum data and retention times with that of standards.

Extraction and HPLC Analysis of Phenylpropanoid

Phenylpropanoid analysis was performed using a method reported in a previous study [40]. External standards, hydrochloric acid, acetic acid and methanol were purchased from Extrasynthese (Genay, France), SAMCHUN Chemical (Pyeongtaek, Korea), Sigma- Aldrich Co., Ltd. (St. Louis, MO, USA) and J.T Baker® Chemicals (Phillipsburg, NJ, USA), respectively. Firstly, 6 mL of 62.5% aqueous methanol (v/v) composed of 2 g/L tert-butylhydroquinone was injected to a total of 100 mg of sample of the three species. After the addition of 1.5 mL 6 N hydrochloric acid, each sample was incubated at 90 °C for 2 h for hydrolysis and centrifuged at 3,000 rpm for 10 min. The supernatant was diluted 2 x was filtered through a 0.22 μm PTFE syringe filters into brown vials prior to HPLC-UV anaylsis. Each phenylpropanoid was identified and quantitated on a C18 column (250 × 4.6 mm, 5 μm; RStech; Daejeon, Korea) in a HPLC system (NS-4000, Futecs Daejeon, Korea) combined with an UV−Vis detector. HPLC condition was set as follows: detection wavelength, 280 nm; oven temperature, 40 °C; flow rate, 1.0 mL/min; injection volume, 20 μL. The gradient program was established: Solvent (A), Acetic acid/methanol/water (2.5:5.0:92.5 v/v/v); Solvent (B), Acetic acid/methanol/water (2.5:95:2.5 v/v/v); 0-48 min, 0-80% B; and 0% 48-58 min (total 58 min). Each compound was quantified according to peak areas and calculated as the equivalents of representative standard compounds.

Statistical Methods

GraphPad PRISM (ver. 5.0; GraphPad Software, Inc.) for Kruskal- Wallis test was used to test the significant differences in levels of metabolite among the three species of Aloe. Mann-Whitney tests were performed to reveal pairwise differences with the critical p value set at 0.05.

Results

1H-NMR and Chemometric Data Analysis

Figure 2 indicated 1-dimensional 1H-NMR spectra of the aqueous extracts from A. arborescens, A. saponaria, and A. vera. Predominance of several metabolites such as fructose, glucose, isocitrate, malate, and sucrosewas observed. In particular, predominant signals of sugar compounds and organic acids were observed. A visual comparison revealed that signals of Aloe nin were observed along with predominant signals of sugars such as glucose and sucrose in the spectrum of A. arborescens.

biomedres-openaccess-journal-bjstr

Figure 2: Representative 1H NMR spectra of Aloe species
A. Arborescens
B. A. saponaria
C. A. vera

First, PCA score plot was employed to determine if the metabolic fingerprint of Aloe samples was unique enough to discern the difference among the three species and identify the biomarkers for each species. Each point in the score plot describes an individual sample, and the samples indicating that similar variances are clustered together. The PCA score plot exhibited a clear separation among the three species (R2 = 0.928 and Q2 = 0.865). The model parameters for the explained variation, R2, and predictive capability, Q2, were significantly high (R2, Q2 > 0.5), indicating excellent model fitting. To identify the underlying variables contributing to the differentiation, we sorted VIP values from the PLS-DA model (Figure 3A, R2X= 0.882, R2X= 0.986, and Q2 = 0.973). In particular, A. arborescens was separated from two other species along the principal component 1, indicating that A. arborescens has the most different character, such as signals of Aloe nin, in its aqueous extract.

biomedres-openaccess-journal-bjstr

Figure 3: PLS-DA score plot and heat map derived from 1H NMR spectra of Aloe species (A) PLS-DA score plot derived from 1H NMR spectra of A. arborescens, A. saponaria, and A. vera (B) Heat map of variables bucketed from 1H NMR spectra with VIP values > 1. Each value in the heat map is a colored representation of a calculated Z-score.

Variables with VIP values > 1 were represented using heat map (Figure 3B). Heat map showed different patterns among three Aloe species and each variable with VIP values > 1 were identified as malate, isocitrate, sucrose, glucose, Aloe nin, and fructose.

Quantitative Analysis of Metabolites

Concentrations of identified malate, isocitrate, sucrose, glucose, and fructose were determined using the 600 MHz library from Chenomx NMR Suite 6.0 and exhibited significant differences among three Aloe species (Figure 4). On the other hands, Aloe nin couldn’t be quantified because Aloe nin weren’t included in Chenomx library. A. vera was characterized by the highest levels of organic acid metabolites such as malate which are related to raw materials for cosmetics, health foods, and medicine, whereas A. arborescens was characterized by the lowest levels of organic acid metabolites such as isocitrate and malate. However, it was characterized by the highest levels of sugar metabolites such as sucrose and glucose. The isocitrate, malate, glucose and sucrose levels significantly differed between A. arborescens and A. saponaria. In addition, A. arborescens and A. vera showed differences in malate, glucose, and sucrose levels. A. saponaria and A. vera exhibited differing levels of isocitrate, malate, fructose, glucose, and sucrose.

biomedres-openaccess-journal-bjstr

Figure 4: Quantitative analysis of sugar and organic acid metabolites. Data are represented as means of replicates with error bars indicating standard deviations. Statistical analysis are carried out using Mann-Whitney tests and significant difference are indicated as asterisks (* p<0.05, ** p<0.01).

Carotenoid Analysis

Carotenoids from A. vera, A. arboresens, and A. saponaria were analyzed. As shown in Table 1, different patterns were observed depending on the amount of carotenoid in the three species. A total of five carotenoids (α-carotene, lutein, zeaxanthin, antheraxanthin, and β-carotene) were detected. Among the detected carotenoids in all species, the amount of lutein was the highest, while that of antheraxanthin was the lowest. Although, all Aloe species contained almost similar amounts of carotenoid compounds, the amount of zeaxanthin in A. arborescens was 2 times higher as compared with that in the other two species. Furthermore, this species contained more α-carotene (3.55 ± 0.10 μg/g) and β-carotene (55.57 ± 1.36 μg/g) compounds than in the other species: The amount of β-carotene was 1.6 times higher in A. arborescens than that in the others. The amounts of the different carotenoids in the three species were observed in the order of lutein > β-carotene > α-carotene > zeaxanthin > antheraxanthin.

biomedres-openaccess-journal-bjstr

Table 1: Content of carotenoids in the three Aloe species.

*Each values represent mean ± SD.

Phenylpropanoid Analysis

Table 2 lists the differences in the amounts of the accumulated phenylpropanoid observed in the three Aloe species. After HPLC analysis, seven phenylpropanoids (p-coumaric acid, chlorogenic acid, benzoic acid, caffeic acid, quercetin, ferulic acid, and kaempferol) were detected. A. saponaria contained the highest amount of the total phenylpropanoid compounds (461.55 ± 16.13 μg/g), while as compared to A. saponaria, A. arborescens contained more phenylpropanoids (A. arborescens – 6, A. saponaria – 5, A. vera – 4). All Aloe species contained p-coumaric acid, ferulic acid, and benzoic acid. A. vera contained marginal amounts of the total phenylpropanoid compounds (180.83 ± 5.18 μg/g) compared to the other species. The highest amount of benzoic acid was observed in A. saponaria (372.79 ± 9.91 μg/g). Meanwhile, A. vera contained higher amounts of benzoic acid (83.78 ± 2.88 μg/g) as compared to other phenylpropanoid compounds. The amount of chlorogenic acid was higher in A. vera (72.05 ± 1.00 μg/g) as compared with that in A. arborescens (42.01 ± 0.34 μg/g), while no chlorogenic acid was detected in A. saponaria. The highest amount of caffeic acid (129.25 ± 20.78 μg/g) was observed in A. arborescens, with marginal amounts observed in A. saponaria (36.95 ± 0.48 μg/g); caffeic acid was not observed in A. vera. Quercetin and kaempferol were detected only in A. arborescens and A. saponaria, respectively.

biomedres-openaccess-journal-bjstr

Table 2: Content of phenylpropanoids in the three Aloe species.

*Each values represent mean ± SD.

Discussion

Aloe is one of the most useful and widely used plants for various purposes. Typically, A. vera is the most used commercial form of Aloe in pharmaceuticals because it has been studied extensively, and several researchers have reported that it exhibits more chemical properties than the others. However, now, the other forms, A. arborescens and A. saponaria, are also attracting attention caused by their different chemical characteristics and medicinal uses. In particular, A. saponaria and A. arborescens not only have similar, but also a higher content of, metabolites as compared with A. vera. HPLC was conducted to analyze secondary metabolite in the three Aloe species.
Unfortunately, studies with respect to carotenoids in Aloe are very limited [41]. have reported that the accumulation of rhodoxanthin (red keto-carotenoid) in A. arborescens was induced under strong sunlight and its combination with drought environment. As shown in Figure 4, five carotenoids were present in the Aloe species, with lutein being present in the highest amount, which is a well-known carotenoid used as maintenance of eye health and eye-related diseases. Several studies have also described that the reduction in the risk for eye diseases was attributed to an increase in macular pigmentation [44,43]. Meanwhile, α, β-Carotene, being the most common precursors for vitamin A carotenoid, was abundant in A. arborescens (Table 2).
Phenylalanine is a precursor of phenylpropanoid, which is an extensively used compound. Based on the observed results, phenylalanine was not detected in A. arborescens. In this study, only seven compounds were analyzed. However, it may contain many other phenylpropanoids besides these seven compounds. Nicolson [44] has reported that phenylalanine is not detected from the nectar of A. arborescens, which is supported by the results of this study. All Aloe species have similar secondary metabolites, albeit differing in various amounts and patterns. In our results, the three species of Aloe had different phenylpropanoids. In particular, quercetin and kaempferol were specifically observed in A. arborescens and A. saponaria, respectively. A. greatheadii var. davyana extracts [45] A. ferox [46] contained pyrimidine, ketone, aldehyde, alkane, dicarboxylic acid, organic acid, alcohol, fatty acid, phenolic acid, indole, phytosterol, alkaloid, and phytosterol by GC–MS analysis. Because of its phytochemical composition, it shows promise in alleviating symptoms related to the prevention of cancer, diabetes, neurodegeneration, and cardiovascular diseases.
By LC–MS analysis, chlorogenic acid, caffeic acid, 5-p-coumaroylquinic acid, caffeoylshikimic acid, 5-p-cis coumaroylquinic acid, p-coumaric acid, and ferulic acid as well as apigenin, quercetin, luteolin, isovitexin, kaempferol, saponarin, isoorientin, and lutonarin have been identified in the flowers of A. vera [47]. Further investigation of metabolic analysis and profiling could reveal the chemical properties of the Aloe species, and clinical trials would be necessary regarding the claims before accurate conclusions can be made.

Conclusion

In this study, the metabolic differences of three different Aloe species, A. vera, A. arborescens, and A. saponaria, were investigated by 1H-NMR-based metabolite profiling. The PCA derived from the 1H-NMR spectra indicated a clear discrimination among the Aloe species, providing high predictability and good fitness of the PCA model (R2 = 0.928 and Q2 = 865). As observed in the PLS-DA score plot, discrimination was observed in the Aloe species with respect to primary metabolites including sugar and organic acid and secondary metabolites such as phenylpropanoids and carotenoids. A. vera was characterized by high levels of malate, whereas A. arborescens was characterized by higher levels of Aloe nin and sugar metabolites such as sucrose and glucose. Furthermore, the secondary metabolites were quantitatively analyzed by HPLC, and the amounts of carotenoids including zeaxanthin, α- and β-carotene, and phenylpropanoids in A. arborescens were found to be significantly higher than those in the other Aloe species. It is demonstrated that 1H-NMR-based metabolomics with chemometric analysis can be used for the facile discrimination of Aloe species.

For More Articles: Biomedical Journal Impact Factor: https://biomedres.us

Open Access Journals on Microbiology Research

Some Reproductive Problems in Friesian Cows Raised in Yemen (2- Retained Placenta)

Reproductive problems have an essential effect on the productivity of dairy cows by reducing reproductive efficiency and shortening the length of productive life by increasing exclusion and reducing milk production [1]. There is a positive genetic relationship between reproductive problems in cows and the level of productivity and longevity. Thus, achieving maximum improvement Hereditary depends on the existence of an effective program to treat reproductive problems in the herd. Unlike this program, reproductive issues may lead to the loss of cows and increase the length of a generation, which leads to a decrease in the amount of genetic improvement achieved in a certain period [2]. The bovine placenta is classified as Cotyledonary Placenta and consists of Uterine Caruncles on the maternal and Fetal Cotyledons. From the side of the fetus and together, they form the placenames [3]. The primary function of the placenta is the exchange of nutrients from the mother with the excretory products of the developing fetus. In addition to that, it acts on the secretion of estrogen and several secondary steroids and their receptors [2].
The placenta or “fetal membrane” is a significant organ for nutritional and oxygen supply from the dam to the fetus in the uterine [3]. The placenta is complex hormones, and they begin to separate from the mother before birth and shortly after birth through a hormonal process. The exit of the placenta from the uterus (up to 12 hours) for any reason. This condition is called the retained placenta. Usually, part of the placenta is retained in the uterus, resulting in no estrus. In this case, the corpus luteum may be affected, and the mother will be calving stillbirth and secrete the hormone progesterone, which prevents the occurrence of estrus [2]. The causes of placental retention vary, including genetic and non-genetic. Also, among the reasons for placental retention is a lack of mineral salts, vitamin B, A, and selenium, as well as miscarriage [2,4] in addition to germs and diseases that result from these reasons, the shortage of the productive herd and the low productivity of the births and milk yield [5].
Twin births and prolonged pregnancy are also influences that cause placental retention (183 and disease problems that lead to retention of the placenta [6]. And since the future of the cattle herds depends mainly on choosing the right way to raise and raise wheels and strong-bodied cows to replace the excluded cows, this is one of the essential foundations. Because this reproductive problem represents a significant obstacle to most cattle breeding farms and due to the lack of studies in Yemen that have been subjected to placenta retention as a reproductive problem in dairy cows (Friesian) raised in Yemen, this study aimed to study placental retention in Friesian cows raised in Al-Bun farm in Amran governorate. It also aims to study the effect of some environmental factors on the occurrence of this reproductive problem.

Materials and Working Methods

Management and Reproduction

The study was carried out on a herd of Friesian cows raised in the Al-Bun farm of the Agricultural Cooperative Union located in the bottom of Al-Bun, Amran Governorate, approximately 50 km (northwest of Sana’a). The farm was established in 1993 with 40 heads of cows obtained from the Rasbbah farm in Dhamar governorate and fifty heads. (50 from the Netherlands, and the number of the herd at the time of the study was 505 cows. Estrus is monitored and detected in the barns by veterinary monitors and workers on the farm during the day and night, and estrus is monitored in the farm. In the case of the detection of estrus, the cows are naturally inseminated in the barns. The first insemination process is carried out depending on age and weight, so they are vaccinated at the age of 18 months with a weight of not less than 400 kg. If the weight is less, the vaccination process is delayed until they reach the appropriate weight. There is a health and preventive program as all farm animals are vaccinated against FMD twice a year, and the cows are examined periodically for investigation. On brucellosis and weaning vaccinations against Brucella after weaning (the feeding program was discussed in the first part of the research).

How To Deal with the Retention of the Placenta in the Farm

The appearance of retention of the placenta is more common in the case of twin deliveries and cases of miscarriage after 12 hours of birth, and in the case of delaying the descent of the placenta, a veterinary intervention is performed to remove it, so retention of the placenta is dealt with according to the following steps:
1. Removal of the placenta by specialists and veterinarians’ healthy way.
2. Putting uterine capsules into the uterus is an antibiotic.
3. Do a uterine massage to expel dirt.
4. Washing the uterus with iodine solution.
5. Injecting the cow that was exposed to the retention of the placenta with appropriate short-acting antibiotics, and the antibiotic may be re-used if signs of inflammation appear in the uterus.

Statistical Analysis

According to a mathematical model, the birth records of 1008 observations of placental retention were analyzed using the General Linear Model method. The analysis was done on the basis that the studied trait is a binary trait (yes or no) according to [7] did and [8] according to the following model.
Yijklmn = μ + Ri + Sj + Tk + Vi + Xm + Zn + Yo + Eijklmn
• Yijklmn= The studied characteristic (placental retention rate), where they gave a symbol (0) for cows that did not experience placenta retention and a sign [9] for cows that were exposed to placental retention.
• μ=the general average of the studied trait.
• Ri=effect of parity of calving [9- 12,13,6,4,8,14].
• Si=effect of the season of calving (winter, spring, summer, autumn).
• Tk=the effect of the calving year, and it contained 11 years (from 1997 to 2007).
• Vi=the effect of the type of calving (single – twin).
• Xm= the influence of sex of calving (male-female).
• Zn= the effect of Dystocia (cows with calving dystocia – cows without calving dystocia).
• Yo= effect the stillbirth (cows whose births were stillbirth – cows that not still their births).
• Eijklmno= The effect of random error, which assumes an independent normal distribution with a mean of 0 e σ2.

Results

Some of the Factors Affecting Placental Retention

The general mean ± standard error of placental retention was 20.63 ± 0.0121%. (Table 1), and that the increase in this rate on the farm reflects a defect in management. That placental retention is affected by nutritional factors [2], environmental, genetic, and physiological, and the effect of maternal births, abortions, and length of pregnancy [15].

biomedres-openaccess-journal-bjstr

Table 1: Continued the mean of least squares ± standard error of factors affecting placental retention in Friesian cows(%).

Parity of Calving

The results of the current study showed that the effect of the birth sequence was highly significant (P<0.01) on the Incidence of placental retention (Table 2), as it is evident from (Figure 1) that placental retention increases with successive births, as the highest rate of birth cows in the eighth sequence was 40.90%) The lowest rate of birth cows in the first sequence (11.63%). This high rate of placental retention as cow’s age is due to increased maternal births that have a short gestation period, leading to cows being exposed to placental retention [15].

biomedres-openaccess-journal-bjstr

Figure 1: Stage of Retained Placenta.

Season of Calving

A significant effect (p<0.01) of the calving of the season was reported on the Incidence of placental retention, (Table 2), as the cows born in the summer season were more prone to placental retention (26.21%) compared to the cows bred in the winter season (15.39%). The seasonal variation is due to the difference in the degree of heat, humidity and its implications for the quantity and quality of feeds [16], as placental retention is affected by dietary factors such as a lack of mineral salts, vitamins E and B, selenium, and a deficiency of vitamin E in the feed (food), which is included in the composition of the epithelial layer of the placenta, which prevents Attachment of the placenta to the wall of the uterus during calving and prevention of retention [16].

Year of Calving

The results of the current study show that there was a highly significant effect (P<0.01) for the calving year on placenta retention, (Table 2), which was above (29.21%) for lactating cows in 2001, while the lowest rate for placenta retention was (6.45%) for birthing cows in 1998. The significant effect of placental retention is the annual differences in temperature, humidity and amount of rainfall, and the change in management systems and the quantity and quality of available fodder (Figure 2).

biomedres-openaccess-journal-bjstr

Table 2: Analysis of variance of factors affecting placental retention and abortion in Friesian cows.

Note: N.S is not significant- (P<0.05) *(P<0.01) **

biomedres-openaccess-journal-bjstr

Figure 2: The effect of parity of calving on the rate of the retained placenta (%).

Sex of Calving

The results of the statistical analysis found that cows whose calving’s were males were significantly higher (p<0.01) in the rate of placenta retention (23.12%) compared to cows whose calving’s were females (17.86%). The significant effect can be attributed to most of the calving’s in which the type of the calvings was born. Males are greater in size than calving’s that were taken females, which leads to the occurrence of Dystocia and thus leads to retention of the placenta [16].

Type of Calving

The current study results indicate that the type of calving has a highly significant effect (p<0.01) on placental retention. Table 2. explain that type of calving shows that twin calving has a short pregnancy period [4], which leads to retention of the placenta due to incomplete physiological growth. As the present study indicated affecting of type of calving on the occurrence of retention of the placenta was disagreed to what finding 19.

Dystocia

Although there was no significant effect (P <0.05) of Dystocia on placenta retention (Table 2), the results of the present study showed that the rate of placental retention in Dystocia is higher (22.56%) compared to the speed of retention of placenta among cows without Dystocia (20.34%).

Stillbirth

The results of the statistical analysis of the current study found that stillbirth had a significant effect (P <0.05) on the rate of placental retention.

Discussion

(Table 1) The rate of placental retention obtained in this study is comparable to what [16] found in Egypt (19.1%) and less than placental retention found by 17 in Spain. (22.1%) However, the rate of placental retention is much higher than the range (3.0- 12.5) that several researchers [17,18] found in Spain. The results study of affecting parity of calving on the occurrence placental retention significant effect and it were identical to investigated by many researchers [1,9]. The affecting of season of calving on the exposure to placental retention results in this study was agreed to a significant effect, to what reported by [19,10]. In this investigation, having a significant effect of calving year on the rate of retention of the placenta was supported by [15,16]. This result agreed in terms of the presence of a significant effect of the sex of born on retention of the placenta with [20,15]and contradict [21,4]. As the present study indicated affecting of type of calving on the occurrence of retention of the placenta was disagreed to what mentioned in findings 19. The results of this study in terms of lack of significant effect of Dystocia on placental retention were consistent with that found by 5. These results were contradictory to that of [22,10]. (Table 1) the significant effect of stillbirth on placental retention may be attributed to the fact that deceased births are often from Dystocia, leading to the occurrence of retention of the placenta in mothers [15,23-29].

Conclusion

Parity of Calving was Affected High Significantly in Incidence retained placenta, Parturned Cows in the eight Parity High retained placenta, Calving Season had Significant Effect on the retained placenta, the Highest and Lowes Incidence of Dystocia. Among Summer– and winter– born Calves. Year of Calving was Affected High Significantly in Incidence retained placenta. Retained Placenta among Single and Twins Calves and Males and Females, the Effects of Dystocia on Retained Placenta Lacked Significance. Stillbirth was affected significantly in the retained placenta.

For More Articles: Biomedical Journal Impact Factor: https://biomedres.us

Open Access Journals on Microbiology Research

The Anthropocene and Its Relationship to Planetary Health

In recent decades, man has become a geological force, competing with natural forces in the impact and modification of the Earth system. The term Anthropocene was proposed by scientists Paul Crutzen and Eugene F. Stoemer, in 2000, to describe this new time and emphasize the preponderant role of man in geology and ecology. There is no doubt that man has unequivocally and in some cases irreversibly changed the Planet, and that Holocene concepts can no longer be used to describe trends in chemical and biological variables and the future of the Earth system as a whole. Tomorrow depends, to a great extent, on actions to optimize the relationship between man and the environment. This, then, is the moment we find ourselves in today: the Epoch of Humans. The one in which Homo sapiens finds that civilization has become a force of planetary reach and of geological duration and scope. We are billions of people in the world and we continue to multiply. From a biological point of view, it is a growth equivalent to that of a colony of bacteria: an extremely explosive pace, in a very short period of time. We have become planetary: today there is not a single region that is not directly or indirectly affected by the whole of human activity. By releasing smoke from automobiles, chimneys and fires, humanity changed the composition of carbon in the atmosphere, causing a temperature increase of 1°C, glaciers melting and sea level rise by, so far, 20 centimeters. Not to mention how humanity physically altered the planet, with concrete and steel.
A clear example is the rivers: in the last decades, we have transformed the river courses of all the hydrographic basins of the world by building 40 thousand dams. If the reservoirs of all these dams were placed side by side, we would have a flooded area equivalent to the State of Bahia. In an article published in the bulletin of the International Geosphere-Biosphere Program, Crutzen defended his thesis by saying that the rate of urbanization has increased tenfold in the last century and that, in a few generations, humanity will extinguish the fossil fuels generated over the last hundreds of millions of years. The text had an almost immediate repercussion among geologists. Scientist Andrew Gale of the University of Portsmouth, a member of the Geological Society of London, told The Times newspaper that he agrees with the argument of the chemist and his fellow geologists. According to him, human activities have become the main force behind the great changes in topography and climate. According to him, you cannot have 6.5 billion people living on a planet the size of ours and exploit every possible resource without causing gigantic changes in the physical, chemical and biological environments, which will be dramatically reflected in our geological record.

For More Articles: Biomedical Journal Impact Factor: https://biomedres.us

Open Access Journals on Medical Research

Tuberculosis in South Asia

Introduction

Tuberculosis (TB) is a potentially serious infectious disease that mainly affects the lungs though it can spread to other parts of the body one’s brain or spine. The bacteria are spread when an infected person coughs or sneezes. It can also spread through saliva (by kissing or sharing drinks etc.). A type of bacteria called Mycobacterium tuberculosis is the cause of the disease. Tuberculosis (TB) remains formidable threat to global health despite concerted efforts during past decades by the global health community. From 1990 to 2015 the death rate has decreased by 47 percent [1]. Among 22 countries which had high TB burden, 16 countries have achieved millennium development goals for TB. A target has been set by the Global Health Community for the post 2015, ENO-TB strategy of reduction of 25 percent in occurrence and a reduction of 75 percent in mortality between 2015 and 2025 and a mortality reduction of 95 percent and 90 percent reduction in occurrence by the year 2035 [1]. As per the news item published in the daily, “The Times of India” dated 16th February 2020, The Health Minister of India, Dr. Harsh Vardhan informed that the country has even more ambitious target of eliminating the disease from the country by the year, 2025 and said that the mission Indradhanush is already operational for the purpose.
Although the elimination of a disease like TB is a very complex problem but by the time our understanding and knowledge about infectious diseases, global connections, resources and range of intercession have also increased. In order to increase the rate of TB elimination we must increase the research to maximum level in high burden countries like India, Pakistan, Nepal, Bangladesh, Afghanistan, Maldives, Bhutan and Sri Lanka. The WHO South-East Asia (SEA) is habitat for 26% of the world’s population with 44% heavy load of TB. An estimated 4.4 million community got sick with TB and estimated 6,38,000 passed away due to the disease which is over half of the global TB deaths [2]. The coming into view of rifampicin resistant or multidrug resistant tuberculosis (MDR) is one of the most important challenges to the control of tuberculosis pandemic. The main reason for drug resistant tuberculosis is either the transmission of already resistant strain of Mycobacterium tuberculosis or the suboptimal cure of susceptible strains. It is no surprise therefore that having such a high burden of TB disease, this region has an estimated number of 184336 MDR cases among the total recorded TB cases which brings it on third position in the list of Global MDR burden region [2]. Most of the MDR cases in this field remain untouched due to considerable gap between the agreement and useful putting into effect [3]. As such, there is an imperative need to improve and strengthen research capacity in these high burden countries.

Treatment

In our fight against drug resistant TB, a great achievement is the recent licensing of bedaquiline and delamanid [4-5]. Effective treatment depends upon accurate diagnosis. In the region, the Gene X port scale up has significantly increased detection of MDR TB [6]. Until there is an improvement in molecular drug susceptibility testing for drugs other than rifampicin, phenotype drug susceptibility testing will remain essential to treat MDR TB cases properly. Although the population is very large (1.8 billion), the ratio of DST laboratories to population remains as low as 0.2 labs per 5M population. It is estimated that the cost of treatment of a single MDR patient is about 500 times the cost of a drug susceptible patient. Therefore investment in strong MDR TB control is very cost effective if it successfully checks MDR transmission. Apart from this, the new shorter MDR TB treatment regimen from Bangladesh is now adopted and recommended by WHO and it should also be implemented region wide.

Infection Control and their Prevention

The huge number of latently infected individuals throughout the world presents an extensive challenge to eradication efforts. Various models created for control strategies suggested that TB suppression is not possible without get to grips with latent TB. A rough estimate was that about 1/3rd of the world population was suffering from latent TB. But according to a recent study the risk of infection per year estimates around one fourth of the total world population which counts near 1.7B [7]. In the last decade, Isoniazid preventive therapy (IPT) in endemic countries has received serious consideration. Shorter regimens must be developed for its large scale feasibility also the regimens appropriate in the area of high isoniazid resistance. The 12 doses given 3 months rifapentine isoniazid regimine is a step in the right direction but more must be done to value carefully worked designs for IPT scaleup beyond those currently being undertaken in people living with HIV. South Asia is also vulnerable to natural disasters and political un stability. Contingency measures are to be kept in place for prevention of decease spread in case a disaster visits. The 2015 earthquake in Nepal and lack of proper delivery system of healthcare measures is a grim reminder in this regard.

Research Priorities

The discovery of an effective vaccine to treat TB seems an unachievable goal in the near future. While efforts must be kept on for finding a vaccine, we should find a way to eradicate TB without using any vaccine. In large urban cities and remote rural areas of south Asian region research priorities must aim at packaged intrusions. Research capacity should be increased by broadening the network of good clinical practice (GCP) compliant, clinical trial sites to spread up novel regimen evaluations, improving laboratory capacity for bacterial culture and testing of drug susceptibility. Networking research wideness the region to share and scale up best experiences, enthralling governments and fund providers in research plans to make certain move and political promise to keep giving money (Figure 1).

biomedres-openaccess-journal-bjstr

Figure 1: Isoniazid.

Conclusion

There is an golden chance for the scientific fraternity to embark on a path of new research to find real cure for the huge majority of TB afflicted population in the South Asian region. South Asia has patients with a large number of innovative scientists who can enable it to seize the opportunity and lead global TB eradication programs by representing feasibility in cities with high population density and remotest reaches of the Himalayas. Political will and leadership with a vision are the two attributes which are essential to facilitate the loftily programme of TB elimination. The malady cannot be overcome by a single intervention, instead continuous innovations are required. This is the time that researchers in the region join hands, work with cohesion, develop an unified agendum to ensure successful research for TB eradication. The sooner, the better.

For More Articles: Biomedical Journal Impact Factor: https://biomedres.us

Open Access Journals on Medical Research

Pfizer/Biontech Post Vaccine Acute St-Elevation Myocardial Infarction: A Case

Introduction

Corona-type viruses have been known for years. In the 2019/2020 period, a new type of SARS-Corona virus-2 (SARS-CoV- 2=COVID-19) started to spread all over the world. Several vaccines have been approved against COVID-19. Each of these sought to respond to the pandemic by providing individual protection against COVID-19. One of these vaccines is the messenger ribonucleic acid (mRNA) COVID-19 (Pfizer/BioNTech) vaccine that is based on new gene-based technology. It was recommended that the vaccine be administered in two doses, with a 21-day interval between them. Based on current knowledge, COVID-19 mRNA vaccines have a high efficacy rate of approximately 95%. Current research data indicate that the odds of contracting COVID-19 infection are approximately 95% lower in fully vaccinated persons than in unvaccinated persons. Its effectiveness in preventing severe COVID-19 disease (for example, hospitalization) is about 85%. It is not yet known how long the protection of this vaccine will last. The Pfizer/BioNTech vaccine is approved for people 12 years of age and older. However, some unexpected side effects may occur after vaccinations for COVID-19 infection, the future of which is still unknown. After one of the mRNA vaccines, local and general reactions can be seen as a result of the interaction of the vaccine with the body. These reactions are generally expected to disappear within 2 days after vaccination [1].
Although rare cases of myocarditis and pericarditis have been reported among cardiac side effects after the mRNA covid-19 vaccine, no significant heart attack was observed in vaccinated patients. It is thought that other medical conditions that develop during or after vaccination may not always be related to the vaccine, since large-scale vaccination is performed [2]. Diagnosing postvaccine Acute Myocardial İnfarction (AMI) can be difficult. Because muscle pain at the injection site may cause ischemic symptoms to be overlooked and delayed admission. As far as we can search the literature, we know of two cases of acute myocardial infarction in the United States that started less than 24 hours after the first dose of the COVID-19 vaccine [3]. In our case, we aimed to emphasize acute myocardial infarction and other possible side effects that developed within hours after the second dose of Pfizer/BioNTech COVID-19 vaccine, in the light of the literature.

Case Report

A 39-year-old male patient said he had shoulder, arm, and chest pain lasting more than three days after receiving the first dose of the Pfizer/BioNTech COVID-19 vaccine. There was a relief after taking paracetamol and nonsteroidal anti-inflammatory tablets for his pain. He attributed all these pains to possible post-vaccine reasons. After 21 days, the patient applied to the emergency service with complaints of discomfort and tightness in the chest, which started 1.5-2 hours after the second dose of vaccine, continued for more than 10 minutes. Also, the patient could not describe the nature of the pain exactly. He stated that the pain was not like in the first dose, but was suppressive, restless, starting from the scaphoid and spreading to the jaw and neck. The patient had both vaccines done on the left arm. The patient did not have the fever or respiratory distress at the time of admission and did not report any drug-vaccine allergy. There was no cardiac history in his own and first-degree relatives. In his examination; general condition was good. Vital signs are blood pressure; arterial 130/70mmHg, temperature: 36.5 °C, oxygen saturation parameter (SpO2): 99%, heart rate: 70/minute. When the heart was listened to, there was no additional sound and no murmur. Peripheral pulses were palpable. Other system examinations were normal. Electrocardiography (ECG), complete blood count, biochemistry, and cardiac biomarkers were requested from the patient. Polymerase Chain Reaction (PCR) was requested for COVID-19 in the nasopharyngeal aspirate in the emergency department, the test result was negative.
In the ECG taken in the fifth minute of the patient’s admission to the emergency department; ST-segment elevation in inferior leads (II, III, and aVF) and reciprocal ST-segment depression in I and aVL were detected (Figure 1). The patient’s cardiac troponin T value at admission; 8.83pg/dl (range: 0-14pg/ml), 5097pg/dl at the 6th hour and 2689pg/dl at the 24th hour. ECG monitoring, 300 mg acetylsalicylic acid, 300 mg clopidogrel orally, 5000 IU heparin intravenously were administered to the patient with the diagnosis of acute inferior myocardial infarction. Emergency coronary angiography showed globular thrombus and occluded proximal segment of the Right Coronary Artery (RCA) with TIMI 0 flow (Figure 2). RCA emergency Percutaneous Coronary İntervention (PCI) was performed. Dilated with balloon and stent placed. After coronary angiography, a good outcome was detected with the TIMI III flow (Figures 3 & 4). The patient did not have chest pain after percutaneous coronary intervention. On the fifth day of hospitalization, the patient had minimal hypokinesia of the right inferior wall and was discharged with a cured left ventricular ejection fraction of 60-65%.

biomedres-openaccess-journal-bjstr

Figure 1: ST elevation in lead II, III and AVF (blue arrow) and ST depression in I and AVL (red arrow).

biomedres-openaccess-journal-bjstr

Figure 2: Critical stenosis of middle segment of RCA-black arrow.

biomedres-openaccess-journal-bjstr

Figure 3: Balloon and stent inserted to middle segment of right coronary artery-black arrow.

biomedres-openaccess-journal-bjstr

Figure 4: Balloon and stent inserted to middle segment of right coronary artery-black arrow.

Discussion

Although vaccines dedicated to COVID-19 disease have been approved as safe, both the disease and the vaccine are relatively new [4-6]. This requires that even very rare events be widely shared and discussed with the medical community. We report a case of AMI occurring within two hours of the second dose of the COVID-19 vaccine. The angiographic features of the case suggested acute thrombotic events as the underlying mechanism. Although it is not possible to establish a causal relationship between vaccination and cardiac events, it is important to remember that the mechanisms of thrombotic events in COVID-19 are still not fully understood [7]. Vaccines are considered the most effective drugs in public health. Side effects may also occur due to some reactions after vaccination. It is often difficult to say whether the reactions are caused by the vaccine itself or by other factors causing AMI. Excipients used in vaccines; it is used to improve stability, increase solubility and improve absorption. However, these substances contribute significantly to the development of IgE-mediated anaphylactic reactions during vaccination [8].
Kounis syndrome is an allergic reaction to various substances, including excipients, resulting in acute coronary syndrome [9]. This could be a possible explanation for the AMI clinic post- COVID-19 vaccine. It may also occur through prothrombotic immune thrombocytopenia, which is similar to heparin-induced thrombocytopenia, leads to vaccine-induced thrombotic events [10]. Although there is limited data on the risk of thrombotic events with vaccines currently in use in the United States, there have been recent reports of thrombotic events after COVID-19 vaccines in Europe. No acute myocardial infarction was reported in the original study of vaccines used in Covid-19. They also did not present a significant difference in thrombotic events between the vaccinated and placebo groups. However, cases have started to be presented after these vaccines, rarely. Boivin et al. reported a 96-year-old female case who had AMI one hour after the Moderna COVID-19 vaccine, and one case of AMI in a 63-year-old healthy man two days after the AstraZeneca COVID-19 vaccine [11]. Maadarani AstraZeneca presented a case of AMI after the COVID-19 vaccine [12]. Tajstra on the other hand, reported an 86-year-old male case of AMI after Pfizer/BioNTech Covid-19 vaccine [13]. Finally, Jonathan presented two cases of AMI, one male, and one female, after the Moderna vaccine [3]. Our case can be seen as the second case in the literature after Pfizer/BioNTech Covid-19 vaccine. The Vaccine Adverse Event Reporting System (VAERS) [14], the National Vaccine Safety passive monitoring system, reported that side effects occurred after receiving the second dose of 76% of mRNA vaccines made so far. According to the Centers for Disease Control and Prevention (CDC) case definitions, The median interval from vaccination to symptom onset was 2 days (range = 0-40 days). Some of the symptoms were seen within 7 days of vaccination in 92% of patients. Acute clinical courses were generally mild [15]. About 78% of Suspected Adverse Events (AEs) were reported in individuals younger than 60 years of age. In clinical trials of mRNA vaccines, it has been noted that people younger than 60 years tend to experience more reactogenic AEs than those aged 60 and over. In general, younger individuals have more active immune responses and may experience more AEs to vaccines. This is part of the body’s natural response to build immunity to COVID-19 infection. Approximately 66% of AEs have been reported in women.
Of the 7.5 million doses of Pfizer-BioNTech and Moderna mRNA vaccine administered in total, 0.12% were reported as suspicious and 0.005% as severe AEs. The most commonly reported serious side effects are anaphylaxis and other serious allergic reactions. Also asthma exacerbation, difficulty breathing, fast heart rate, increase or decrease in blood pressure, chest discomfort and pain, pericarditis or myocarditis, syncope, numbness of limb, weakness or pain, vision changes, increase in liver enzymes, thyroid gland dysfunction, muscle injury, joint pain, seizures, tinnitus, infections, and blood clots. Most individuals who develop severe AE are reported to have recovered. A higher incidence of heart attacks and strokes was not observed in locally vaccinated persons. It’s also important to note that heart attacks and strokes can occur naturally, regardless of whether people are vaccinated or not. It is argued that the benefits of COVID-19 vaccines continue to outweigh the known risks in the pandemic [2].

Conclusion

As the COVID-19 vaccine campaign moves into a new phase worldwide and vaccines become available to the general public, there will be more data on safety and potential side effects. Further data on nationwide myocardial infarction or other thrombotic events before and after vaccination initiation should be carefully considered and interpreted before commenting on any possible causal relationship.

For More Articles: Biomedical Journal Impact Factor: https://biomedres.us

Journals on Microbiology Research

Comparison of the Reaction Time Between Motorcycle Road Racer and Motorcyclists

Introduction

Motorbike speed is one of the most popular sports in the world, which requires excellent physical and mental performance from the racers. However, the importance of applying the Theory of Sports Training in the sport is little explored, especially in the amateur categories. The lack of information occurs due to the little involvement of Sports Medicine and Sports Sciences in the different categories of motorbike [1]. It is recognized that this sport is extremely challenging and dangerous [2,3]. The motorbike racers is exposed to extreme conditions and high physical demands, on the other hand, in motorsports, the victories depend, not only on the individual physical capacity of the athlete but on a set of factors, such as riding technique, mental effort, equipment efficiency and resistance, race strategy and team competence [4].
Even though physical fitness is not the main determinant for win in Motor Sports, it is still observed that training and racing require athletic skills and physical demands from the driver, similar to athletes in other sports [5]. In this sense, Ebben, et al. [6] point out that the aerobic resistance of racer drivers is similar to that of boxing, basketball, football, athletics, among others. Reaction Time (RT) is the time interval between the generation of visual, audible or tactile stimuli and motor action. This time revolves around values that correspond to milliseconds and depends on factors such as age, physical conditioning, cognitive level, emotional state and gender [7]. Although Reaction Time is related to genetic conditions, it is a sensory quality that can be trained. High-performance athletes can achieve a decrease of approximately 15% in reaction time due to years of training [8]. For the athlete to react to a stimulus, there is a latency period (just before muscle contraction begins), which is shorter or slower due to the quality of the processing of the reference by the central nervous system [7]. It is observed that the RT of elite athletes, is faster when compared to beginners or untrained [9].
According to Tønnessen, et al. [10], in a study comparing the reaction time of 1,319 world champions in the 100-meter dash category, it was observed that the RT of male athletes (0.166 ± 0.030 seconds) was significantly lower than that of female athletes (0.176 ± 0.034 seconds). There was no relationship between RT and height. The best RT was obtained in the age group between 26 and 29 years old in males (0.150 ± 0.017 seconds) and athletes over 30 years old (0.153 ± 0.020 seconds). According to Sparrow, et al. [11], the type of training, testing and the modality practiced by the athlete can influence RT. Gélat, et al. [12] point out that the emotional and attention state interferes with RT, which can be faster, in motivating conditions and/or when the individual remains more attentive and slower, in situations of demotivation or depression. The neurosensory response is extremely important for Motor Sports racers, such as motorcycle race. Being that during races the racers receives different visual, auditory, tactile stimuli and the respective reception, transfer, processing and transfer of this information, in the shortest possible time, are essential for the performance during the competitions.

Objective

To compare reaction time of Track Day racers with motorcyclists.

Method

Sample Characteristics

The accessibility sample consisted of 10 volunteers, who were divided into two groups with five individuals each: G1) Amateur Track Day racers 29.4 + 2.6 years old and G2) Motorcyclists, without experience in motorcycle competitions, with an average age of 22 + 1.4 years.

Inclusion Criteria

• Motorbike racers: participation in at least six Track Day races between 2018 and 2019; male; physically active; age over 18 years; signing the Free and Informed Consent Form (ICF).
• Motorcyclists: National Driver’s License Category A; use of the motorcycle as a means of transportation at least four times a week between the years 2018 and 2019; male; physically active; age over 18 years; signing the Free and Informed Consent Form (ICF).

Exclusion Criteria

Any type of injury that makes bodily movements impossible. Consumption of substances with caffeine two hours from the tests. Do not accept to participate in the research.

Ethical Procedures

The research project was submitted to and approved by the Research Ethics Committee of the School of Physical Education of Jundiaí (Jundiaí, São Paulo/Brazil) Protocol Number 3.401.727 and all volunteers signed the IC to participate in the study.

Experimental Procedures

To evaluate the Reaction Time, FITLIGHT® system was used, a device that allows the random activation of up to eight LEDs, wirelessly, according to the programming of the respective lighting time and activation time determined by the researcher, with the registration of the number of hits and reaction time in milliseconds. The equipment allows identifying, besides the Reaction Time, other variables such as several correct answers in the tasks as well as the total activity time. The equipment’s different schedules have the potential to quantify Reaction Time, as well as to develop specific exercises or activities that simulate real movements during the specific movement of various sports.
The study volunteers underwent two tests performed sequentially to identify the Reaction Time: T1) specific test performed on a Honda CBR 600cc motorcycle, supported on a specific easel, where each rider and motorcyclist remained in the riding position responding to luminous signs of the LEDs that were positioned laterally (left and right side) at the height of the volunteer’s eyes and two others on the ground beside the front tire, during the test the objective of turning the handlebar left or right or directing the left hand or right as the LEDs are being turned on randomly; T2) non-specific test, with the led’s positioned in front of each individual on a bench, the objective being to direct the right or left hand to each random lighting of the led for the respective Reaction Time record. In the two tests, the respective positions of the subjects were standardized. Each test has a total of 30 random LEDs, with an estimated time to complete each task of around thirty-five seconds. The variables obtained in each task were: average Reaction Time (in milliseconds), the number of hits and errors, that is, if the volunteer was able to respond to the stimulus in the time that the LEDs remained on (0.500 ms), as well as the total test run time.

Data Analysis

For comparison between moments, Student’s t-test paired for variables with normal distribution was used, with Bonferroni’s post-test adopting a 5% significance level for all analyzes. Using the Graph Pad software. The data were also presented descriptively in graphical and tabular form.

Results

biomedres-openaccess-journal-bjstr

Figure 1: Comparison of Reaction Time in the specific test.

biomedres-openaccess-journal-bjstr

Figure 2: Comparison of Reaction Time in the general test.

Graphs 1-6 show the results obtained in the present study. It can be seen that in the specific test the Track Day racers performed better than the motorcyclists concerning the following variables: reaction time, number of hits and total time to perform the task. However, in test 2 considered as a non-specific evaluation of the TR, there was no statistical difference in the variables studied, except in the total time to perform the task, which was significantly less in favor of the Track Day racers (Graphs 1-6).

biomedres-openaccess-journal-bjstr

Figure 3: Comparison of the number of hits in the number of hits in the specific test.

biomedres-openaccess-journal-bjstr

Figure 4: Comparison of the number of hits in the general test.

biomedres-openaccess-journal-bjstr

Figure 5: Comparison of average total time to complete the specific test.

biomedres-openaccess-journal-bjstr

Figure 6: Comparison of average total time to complete the general test.

Discussion

The identification of the reaction time levels of a sports modality must follow its characteristics and physiological influences in its execution. For Backman, et al. [13], in Motor Sports, the effect of driving the vehicle on the locomotor system and the muscular effort in its entirety during practice should be considered. In this sense, it can be inferred that in the motorbike the dynamic component of the modality is characterized by the great demand for body displacement during the practice, that is, use of the muscles of the trunk, abdomen and upper limbs for driving, acceleration, clutch control and motorcycle braking and use of the lower limbs together with the pelvic girdle muscles for positioning in curves, braking and downshifting. The static component is also observed, concerning the core and shoulder girdle muscles, and the modality is considered to have a vigorous level of physical effort, due to the high level of dehydration, above-average heart rate and high probability of falling and risk of collisions. In this sense, familiarity with the equipment during the specific test may be one of the reasons for the better performance of the racers compared to motorcyclists. However, Track Day racers did not train Reaction Time in their weekly exercise routine. Inferring that the best results obtained in the specific test are related to the practice of the sport, according to the principle of specificity [14].
Remaud, et al. [15] highlighted the demands for attention associated with postural control during Reaction Time and considered that both the focus of attention and the difficulty of a postural task are potential factors that influence RT. The authors evaluated thirteen young people in two tests that consisted of being as quiet as possible on a force platform in different postural conditions, while simultaneously performing a simple TR task. The difficulty of the postural task was handled by various combinations of three support bases (feet together, apart and single leg) and two visual conditions (eyes open and closed). Participants were instructed to focus on balance or performance on RT, depending on the test session. Participants responded more quickly in all dualtask conditions by focusing on TR performance than on balance. The modified attention allocation index indicated that the participants’ ability to modulate their allocation of attentional resources to respond positively to instruction was more pronounced in the most challenging postural condition. This can explain in our study, the better performance of Track Day racers in the task performed in the riding position and on a motorcycle of a similar model to the one that is usually used in their routines.
These results indicate that Track Day racers concerning the reactions on the motorcycle stand out from the racers, as expected due to the experience on the tracks and familiarity with the model of the motorcycle that was used as a reference for carrying out the tests. A similar result was observed in the study by Van Leeween, et al. [16], where racers drivers were better in all measures of reaction time compared to drivers. On the other hand, in the nonspecific test, the performance of the two groups of motorcyclists was equivalent, but with a noticeable difference in terms of the test execution time.

Practical Applications

For a motorcyclist to participate in the Track Day, the racers don’t need to have experience in racing tracks and/or to have taken a Riding Course and a motorcycle-specific preparation for competitions is also not necessary. Due to these facilities, many motorcyclists, even without the proper preparation to enter a racetrack, are attracted to participate in these races, in some cases with rented competition motorcycles. Our data showed that, for example, the Reaction Time of racers experienced in this type of event is higher than that of motorcyclists who, although experienced, never participated in Track Day. In this sense, the results of this study indicate that it is not enough for the rider alone have experience of daily use of motorcycles in traffic, as the specificity of the riding position seems to significantly interfere in the Reaction Time test. In this sense, it is suggested that motorcyclists who have never participated in Track Day should take courses and training before starting the practice. On the other hand, we suggest that the specific test protocol used in the present study to evaluate the Reaction Time can be used for the evaluation and/or training of motorbike racers.

Conclusion

It was observed that the Track Day racers presented the best reaction time, number of hits and time of execution of the task than the racers in the specific test. However, in the non-specific reaction time test, there was no significant difference between the volunteers studied, except in the time of the test, where the Track Day racers were faster. These data contribute to reinforce the importance of specificity in motorsports and to the establishment of benchmarks concerning the reaction time of motorbike racers.

For More Articles: Biomedical Journal Impact Factor: https://biomedres.us

Open Access Journals on Behavioral Medicine journals

Evaluation of Myocardial Infarction in Pigs by Coronary Spectral CT Angiography

Introduction

Acute Myocardial Infarction (MI) is one of the major causes of morbidity and mortality in western countries [1]. Noninvasive imaging for MI detection, patient risk stratification and treatment monitoring is needed especially when Electrocardiography (ECG) and myocardial enzyme with no clinical clue. Multidetector CT has been used for heart morphology and coronary stenosis evaluation for many decades [2,3]. However, even mild coronary stenosis could not always exclude vessel-specific myocardial ischemia [4]. In addition, additional contrast material and radiation exposure limit the use of CT perfusion to evaluate myocardium [5]. In clinical practice, comprehensive evaluation of coronary artery stenosis and myocardial perfusion in one examination is desirable [6]. The advent of dual energy spectral CT has sparked renewed interest in clinical applications for many organs [7-10]. The strength of monochromatic energy image in improving image quality at optimal keV and increasing Contrast to Noise Ratio (CNR) at high keV was outlined; [11,12] the iodine density image was highlighted for the capability to quantify Iodine Concentration (IC) [11,13]. Consequently, our study aims to evaluate the myocardial infarction by Coronary Spectral CT Angiography (S-CCTA) based on the advantages mentioned above to discuss its strength, potential and limitations. The purpose of the current study was in three folds:
1. To investigate whether S-CCTA could assess MI
2. To define the best parameters of S-CCTA for MI delineation
3. To discuss the correlation between myocardial IC and cardiomyocyte apoptosis.

Methods

Experimental Protocol

Twelve Chinese mini pigs (5 males; weight, 20.23 ±1.23 kg; age, 6.0±0.7 months) underwent Percutaneous Coronary Intervention (PCI) to produce acute ischemia/reperfusion MI model by balloon dilatation. In compliance with the NIH guidelines for the use of laboratory animal, these mini pigs received human care. After premedication with ketamine (20 mg/kg), Xylazine Hydrochloride (1.5mg/kg) and atropine (0.02mg/kg), the pigs were intubated, anesthetized and mechanically ventilated with an admixture of 2.5%-3.5% sevoflurane and 100% oxygen. Baseline heart rate, ECG, and weight of animals were acquired before modeling. Before PCI, heparin was administered at an initial dose of 10,000IU intravenously, followed by additional 4,000IU/h to maintain anticoagulation throughout the PCI procedure [14]. The angioplasty balloon was positioned in the Left Anterior Descending Artery (LAD) just distal to the first diagonal artery. Acute MI was confirmed by ECG. After 90-minutes occlusion, the angioplasty balloon was drawn back.

Spectral CT

After 4±1 days of MI model establishment, the pigs underwent S-CCTA. Induced anesthesia was the same as above during PCI. Anesthesia was maintained by intravenous disoprofol (5mg/ kg/h). Respirator was used to help and control the breathing. All pigs underwent S-CCTA on a single-source dual energy spectral CT (Discovery CT750 HD CT Freedom Edition scanner, GE Healthcare, USA). The parameters were as following: Gemstone spectral imaging mode with fast peak tube voltage switching between 80 and 140 kVp during a single rotation, axial plane with 64 × 0.625 mm collimation, 350-msec gantry rotation time, 175-msec x-ray exposure time. All pigs received 1.5 ml/kg contrast material (Ultravist 370, Bayer Schering Pharma, Germany) followed by 30 ml saline at a flow rate of 3.0ml/s. Bolus tracking with a Region of Interest (ROI) was placed in ascending aorta and was used to synchronize the arrival of contrast material to start the image acquisition (trigger threshold of 120 HU). The radiation dose was recorded.

S-CCTA Images Processing

The monochromatic S-CCTA images were reconstructed in standard short axial plane with slice thickness of 2.00 mm. The density of infarction area (referred to the myocardium in tan or white color on TTC stain mentioned later), remote myocardium (myocardium in an unaffected coronary artery territory, usually the inferior wall) and the noise were measured. Identical ROIs on S-CCTA images of different energy were adopted by adjusting monochromatic energy from 40keV to 140 keV at a 5keV interval. The optimal keV was chosen based on the CNR, signal to noise ratio (SNR) and noise.

CNR = (HUremote – HUinfarct) / noise
SNR = HUinfarct / noise.

Where H Uremote represented the mean CT value of remote myocardium, and HUinfarct indicated the mean CT value of infarction. The noise was derived from the standard deviation of CT value in the remote myocardium.
In addition, the mean CT value of infarction area, risk area (the adjacent segments of infarction) and remote myocardium was recorded respectively to observe the density change from 40keV to 140 keV at a 5keV interval (spectral curve).
The optimal keV and iodine density images of S-CCTA were reconstructed in short axis. Thereafter, the CT value and IC were measured in the infarction region, risk area and remote myocardium of each pig. To maintain the consistency of the size, shape and position of ROIs among different CT images, the ROIs were automatically copied by the software and adjusted slightly by hand if necessary. Images were assessed in consensus by two experienced readers (A and B, with 5 and 11 years of experience in CCTA, respectively). For infarction observation, the CNR and SNR were calculated as mentioned above. Finally, objects with noreflow phenomenon at late enhancement imaging were recorded. The IC in no-reflow region (persistent hypo-enhancement on late enhancement images), infarction and remote myocardium was measured on S-CCTA.

Histopathology

At the conclusion of radiologic examinations, the animals were euthanized with overdose vecuronium bromide. The hearts were sliced into short axises of about 4mm and incubated in the triphenyl tetrazolium chloride (TTC) (1mg/100ml) at a temperature of 37℃ by water bath. Remote normal myocardium was delineated as the living tissue and is colored with red, while the infarcted tissue is colored in pale tan. With consideration of S-CCTA images and gross specimen, serial cutting sections in the no-reflow region, infarction and remote myocardium were used for immunofluorescent staining. Terminal deoxynucleotidyl transferase-mediated dUTP Nick-End Labeling (TUNEL) stain of myocardium was used to observe cardiomyocyte apoptosis. The TUNEL positive nuclei were counted by image analysis system “Image-Pro Plus Version 6.0”. The mean values of positive nuclei count/area were recorded [15].

Infarcted Segment Evaluation of S-CCTA and TTC Stain

MI of all the 17 segments according to standardized myocardial segmentation was evaluated by the two points scoring systems. (15) S-CCTA image analysis was performed by using dedicate visual evaluation on optimal energy images. For S-CCTA, score 0 indicated no hypo-perfusion, score 1 represented hypo-perfusion observed. For TTC stain, myocardium in tan color was classified as infarction (score 1) and viable myocardium in red color was regard as score 0 (Figure 1) [16].

biomedres-openaccess-journal-bjstr

Figure 1: Both S-CCTA
A. TTC Stain
B. Showed myocardial infarction (the 7th and 8th segments).

Statistical Analysis

The differences among or between groups were compared by using one-way Analysis of Variance (ANOVA) and Least Significant Difference (LSD) test or t test. The spectral curve of different regions was fitted by the best regression model on curve estimation provided by PASW. Accordingly, the value of slope was derived from the preferred curve. For comparing among different regions, the value of slope underwent logarithmic transformation [17]. The categorical inter-method agreement between S-CCTA and TTC stain was calculated by using the Cohen κ [16]. Receiver Operating Characteristic (ROC) curve was used to investigate the ability of S-CCTA on differentiating infarcted myocardial segments taking the TTC stain as gold standard. The correlation between IC and cardiomyocyte apoptosis of no-reflow region, infarction and remote myocardium was tested by Pearson correlation analysis. P<0.05 was considered statistically significant.

Results

Acute MI models were performed in 12 pigs. However, 2 of them died of ventricular fibrillation soon after PCI, 1 of them died during the S-CCTA examination. Finally, 9 Chinese mini-pigs (6 females; weight, 20.17±1.35kg; age, 5.3±0.6months) were included in current study. The heart rate during S-CCTA was 87±6 per minute. The radiation dose of S-CCTA was about 18.45mGy (CTDI), 193.70- 258.27 mGy.cm (DLP).

Spectral Curve

As the monochromatic energy increase from 40keV to 140keV, the CT value steadily decreased in remote myocardium, risk area and infarction (396.08~58.01HU, 61.30~344.62HU, and 86.80~36.90HU, respectively) (Figure 2). Significant differences of CT value among three regions at 40keV were observed (ps≤0.001). The exponential regression model was optimal for the spectral curve after comparison by curve estimation.16 The logarithmic transformed slopes of remote myocardium, risk area and infarct myocardium were 5.06±0.26, 4.71±0.27 and 2.78±1.03 respectively. Significant difference was detected among them (ps<0.001) (Figure 2).

biomedres-openaccess-journal-bjstr

Figure 2: The spectral curve of the mean attenuation density in the remote myocardium, risk area and infarction myocardium.

CT Value or IC Differences

The CT value or IC difference among infarction, risk area and remote myocardium was shown in Table 1 (ps<0.05).

biomedres-openaccess-journal-bjstr

Table 1: The CT Value, IC or slope of spectral curve difference among Infarction, Risk Area and Remote Myocardium.

Optimal Kev Setting for Differentiation

The scatterplot showed that 70keV ~75keV were the optimal monochromatic energies to observe infarction region on S-CCTA with higher CNR, SNR and lower noise (Figure 3). 70keV was chosen as the optimal monochromatic energy in our study for the following measurement and comparison. The 70 keV multiplanar reconstruction images could be overlaid with iodine density images; it could provide intuitionistic observation for the location and margin of MI (Figure 4).

biomedres-openaccess-journal-bjstr

Figure 3: The CNR, SNR and noise change from 40keV to 140keV.

biomedres-openaccess-journal-bjstr

Figure 4: A 7-month female pig with acute MI. The anterior and anterior septal hypo-perfusion was demonstrated in A. High voltage B. 70keV C. Iodine density D. 70keV overlay with iodine density images. D depicted the hypo-perfusion more clearly.

Diagnostic Ability of S-CCTA to Differentiate Infarct Segments

biomedres-openaccess-journal-bjstr

Figure 5: ROC curve of CT value obtained by S-CCTA to distinguish infarct segments from normal myocardial segments confirmed by TTC stain.

Categorical inter-method agreement between S-CCTA and TTC stain was almost perfect (κ= 0.821, 95%CI=0.729~0.913, p<0.001). 53 of 153 segments (34.64%) were considered as infarction on S-CCTA, compared with 64 segments (41.83 %) that were confirmed as infarcted on TTC stain (Table 2). ROC curve showed high diagnostic accuracy of S-CCTA to differentiate myocardial infarct segments (sensitivity, 0.813; specificity, 0.989; positive predictive value, 0.981; negative predictive value, 0.880 and accuracy, 0.901, p<0.001) (Figure 5).

biomedres-openaccess-journal-bjstr

Table 2: Inter-method agreement between S-CCTA and TTC stain.

Correlation Between IC and Apoptosis

The ICs of no-reflow region, infarction and remote myocardium were (1043±282) ug/cm3, (1867±344) ug/cm3, and (3507±331) ug/cm3 respectively. There were significant differences among them (p<0.001). The mean number of apoptosis cells in no-reflow region, infarction and remote myocardium were (2661±231)/mm2, (2270±241)/mm2 and (74±41) /mm2 respectively (Figure 6). There was significant difference among them (p<0.001). A significant inverse correlation was found between IC and cardiomyocyte apoptosis (r2=0.879, p<0.001).

biomedres-openaccess-journal-bjstr

Figure 6: Fused images of TUNEL stain and DAPI stain.
A. There were few normal cells (blue cell: indicated cells with normal double-stranded DNA) but a lot of cardiomyocyte apoptosis in the no-reflow region
B. There were abundant of apoptosis cells and normal cells in the infarction area.
C. A large number of normal cells but few apoptosis cells were detected in the remote myocardium.

Discussion

S-CCTA for Myocardial Infarction Assessment

The spectral CT may improve its ability to differentiate myocardial infarction from remote myocardium. This may be due to three following factors: its high CNR of higher photon energy (70keV) images, its higher photon energy (140keV) images and its ability to alleviate of beam hardening artifacts [8,11]. Previous studies have similar results with our study no matter for the myocardial perfusion or delayed enhancement [18,19] The 70keV images was selected as optimal monochromatic image to evaluate acute myocardial infarction due to with high CNR, SNR and low noise. And previous study also confirmed that The CT value of 70keV monochromatic image was similar to those of 120kVp CT images with lower noise [12,20].

IC and Cardiomyocyte Apoptosis

TUNEL stain aims to detect apoptotic cell and necrotic cell [21,22]. Apoptosis, necrosis and, possibly, autophagy determined the ultimate number of viable cardiomyocytes following MI [23,24]. Persistent ischemia without reperfusion eventually causes cardiomyocytes to die by a necrotic pathway. While, following myocardial ischemia/reperfusion, apoptosis is one of the major pathways that lead to the process of cell death [25]. In the current study, we correlated the IC of myocardium with TUNEL stain to investigate the capability of spectral CT to assess MI. The results showed that both the IC calculated on S-CCTA and cardiomyocyte apoptosis measured by TUNEL stain could differentiate no-reflow region from infarction or remote myocardium. Furthermore, the myocardial IC on S-CCTA correlated with the TUNEL stain of apoptosis cell in acute MI mini-pig models. Cardiomyocyte is permanent cell, no cardiomyocyte apoptosis detected in the normal heart. Previous study confirmed this point [26]. However, few apoptotic cells were found in the remote myocardium in our study which is probably caused by the overall ischemia situation. Significant difference of the number of cardiomyocyte apoptosis in no-reflow region and infarction area was detected.
No-reflow phenomenon reflects severe reperfusion injury. Ischemia/reperfusion injury (no-reflow phenomenon) initiates a wide and complex array of inflammatory responses that aggravate local injury [27-29]. It explains why apoptotic and necrotic cells was much more prominent in no-reflow region compared with infarction area without no-reflow phenomenon. The IC calculated on S-CCTA images reflected the myocardial perfusion and distribution of blood flow. Following ischemia/reperfusion, the higher the myocardial perfusion, the fewer the apoptotic and necrotic cells induced. This may be responsible for that the IC had a negative correlation with the TUNEL stain of apoptosis cell in acute MI. The iodine quantification on S-CCTA may add valuable information for risk stratification in the future.

Limitations

There were some limitations in the current study. First, the number of pigs enrolled was relatively small and with similar habitus, further study is necessary to determine whether our results are applicable to patients with larger and various figures. Second, this model only investigates early hypo perfused myocardial infarctions and the results cannot be extrapolated to later time points of infarct healing. Finally, for the mandatory use of prospective triggering and high heart rate of the pigs, we did not conduct the analysis including coronary artery stenosis and stress myocardial perfusion assessment.

Conclusion

S-CCTA could assess MI by CT value on 70keV images, IC and spectral curve. In addition, IC calculated on S-CCTA may indirectly reflect myocardial damage which could potentially add valuable information for risk stratification in the future.

For More Articles: Biomedical Journal Impact Factor: https://biomedres.us