Biomedical Journal of Scientific & Technical Research (BJSTR) is a multidisciplinary, scholarly Open Access publisher focused on Genetic, Biomedical and Remedial missions in relation with Technical Knowledge as well.
What is the Level of Awareness of Novel Coronavirus (SARS-CoV-2) Among Greek Students in the Days of School Reopening?
Introduction
Severe acute respiratory syndrome due to coronavirus 2 (SARSCoV- 2) and the resultant coronavirus disease 2019 (COVID-19) has raised worldwide health concern since December 2019. As of March 11th, 2020, the World Health Organization (WHO) characterized it as a pandemic [1]. Governments all over the world have taken actions to minimize the risk of infection and the spread of the virus [2]. In the context of the social distancing strategies, schools, universities and colleges have closed, in a nationwide or local basis in 190 countries, affecting approximately 73.5% of the world’s student population [3]. Being on the same wavelength, and based on evidence and assumptions from influenza outbreaks that school closures reduce social contacts between students and therefore interrupt transmission, the Greek authorities took the decision to also implement this measure [4]. However, as Greece was highlighted among the countries with the less cases and victims from COVID-19, this measure was taken back and the schools were reopened for the last class of high school in May 4th and one week later for secondary and the rest of the classes of high school. This descriptive study aimed to determine the level of information about the COVID-19 among students of Athens, aged 13 to 18 years. More specifically, we attempted to assess the level of knowledge, as well as their preparedness and ability to react efficiently during the pandemic.
Methods
Study Design and Sample
The study was conducted in schools of Athens Area, with a total population of 3,74 million people. The study was approved by the Hospital ethics committee and executed in accordance with the Declaration of Helsinki (1989). Inclusion criteria were voluntary involvement of students living in the Attika area. Common exclusion criteria include the presence of a severe and uncorrectable cognitive, visual, or hearing impairment that would preclude a participant’s ability to complete interviews. Participants were not required to record their personal details, nor to answer all questions in the questionnaire. Data were collected from 13 through 20 March 2020. Surveys took less than 10 minutes. In total, 1200 students aged 13 to 18 years were selected, sub-divided in two groups, 13-15 years old and 16-18years old, respectively
Questionnaire
Survey items were adapted from questionnaires used to study prior outbreaks [5,6]. The questionnaire consisted of 12 items (9 dichotomous questions, and 3 multiple choice) designed to assess students’ knowledge of SARS-CoV-2 characteristics, for example: What is COVID-19? How is COVID-19 transmitted? Which are the symptoms and the protection measures? What is the quarantine? Is there a vaccine? Has there ever been a COVID-19 case in Greece?
Statistical Analysis
Categorical variables were presented as a percentile. Descriptive statistics were calculated for all participant characteristics and survey responses and were presented as valid percentages and as numerical values were appropriate. The chi square test was used to determine statistically significant differences among subgroups of the study’s participants. A p value <0.05 was considered as statistically significant. SPSS 24 for Windows (SPSS 23 Armonk, NY: IBM Corp) was used for the analysis.
Results
General Knowledge about SARS-CoV2
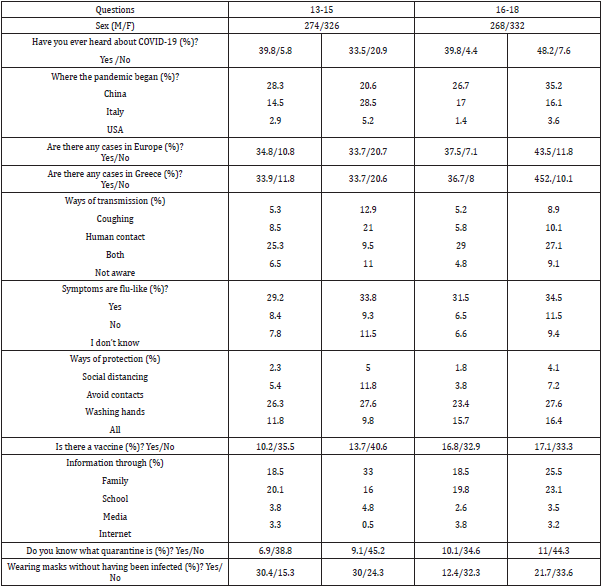
From the total group of 1,200 teenagers aged between 13 and 18 years, 658 (54,8%) were female. Among the participants, 1,044 (87%) knew what the coronavirus is, and 744 (62%) were aware that the outbreak began from China. When the survey was conducted, the virus had spread to all regions of Italy, while on March 12th the first victim was reported in Greece. Therefore, when participants were asked if the virus had infected people in Europe and Greece, 79,5% and 74,7% respectively, answered positively. Interestingly, most of the responders (85%) were informed by their families or teachers; only 180 of the students (15%) said that the source of their information about COVID-19 was media and the web.
Symptoms and Transmission of Covid-19
Study participants were asked about the symptoms of COVID-19; 774 (64,5%) said the symptoms are similar to those of a common cold-like illness, while 198 (16%) were unaware. Regarding the ways of transmission 54,1% of them answered through coughing and human contact while 15,9% of them were not aware. On average one third of responders (30,5%) claimed that there is no need for an urgent visit at the hospital if someone is suspected to be infected by the SARS-CoV-2.
Awareness of Ways of Protection
The study aimed to determine how informed students were about protection measures. Of note, only 66 (5,5%) and 138 (11,5%) recognized the social distancing and avoidance of contacts as effective precaution measures, respectively. More than half of them (53%) answered that hand washing should be followed. Interestingly, nearly one third agreed that all the above-mentioned measures should be applied by general population to avoid the spread of the disease. Furthermore, only 222 (18,5%) of the participants knew what quarantine is; 390 (32,5%) claimed that there is no need for a mask if the person is not infected. Regarding whether an effective vaccine exists, 330 (27,5%) reported falsely that a vaccine already exists. (Table 1) summarizes respondents’ estimations according to their age group.
Table 1: Knowledge level of participants about COVID-19.
Data Stratified According to Sex or Age
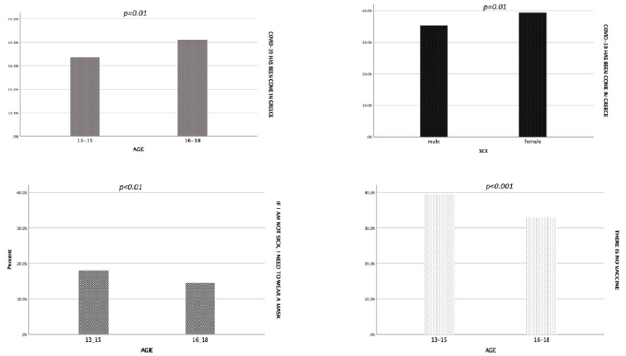
After multivariable adjustment, male subjects were more aware that COVID-19 has been come to Greece (78% vs. 71%, p=0.01). Older students were more aware that COVID-19 has come to Greece compared to younger ones (82% vs. 67%, p=0.01), while they were also aware that if they are suspected of having the disease there is no need to go immediately to hospital (73% vs. 66%, p=0.01). Nevertheless, the younger compared to older students were more informed that no vaccine exists (79% vs. 66%, p<0.001) and that the mask should be applied even if the person has not the disease (36% vs. 29%, p<0.01) (Figure 1).
Figure 1.
Discussion
In a survey of more than 1,200 sociodemographically diverse teenagers, we found that most respondents perceived that they have heard of the coronavirus (COVID-19). However, many are not properly aware about the symptoms and the ways of protection; the one forth could not identify symptoms and almost the one third were totally informed about the proper prevention measures. Another critical point is the use of mask by healthy individuals as two thirds answered that is not necessary. That facts may reflect the blurred image given by the experts regarding the use of the mask. In our study, disparities by sex and age were presented. During the pandemic, Greece managed to react early and effectively. The number of the cases (2,892) and the victims (173) rank Greece in 78th position [7]; international mass media praise Greece’s handling of outbreak as a surprising success story. As a consequence, from the beginning of May, most activities gradually return to normal, employees go back to work, various public restrictions ceased, bar and restaurant reopened. Whilst pandemic globally exists, Greek government outweighing the benefits for children’s education and mental health, decided to reopen schools in 7th September. Several studies of COVID-19 hint that children are less likely to catch the novel coronavirus, and they don’t often transmit it to others [8,9]. Relying on those encouraging data and the reassuring knowledge that very few children get severely ill from COVID-19 other governments, amongst then Denmark, Germany and Israel have already reopened schools. The measures are tentative as most schools are resuming with reduced class sizes, shortened school days, and extra handwashing, while spots, which outbid about social distancing are flooding the media. However, some scientists worry about the risks, as even if the possibilities of transmission are low, the web of contacts makes the tracking process difficult. Our study, working to quickly capture the opportunity to investigate the level of awareness in teenagers, has clear limitations. First, the survey was conducted among a selected group of students only in the Attika region. Therefore, there is no knowledge how semi-urban and rural areas are informed regarding coronavirus. However, our study samples purposefully include girls and boys from schools socioeconomically diverse. Prior research on virus outbreaks guided our selection and creation of survey items [5,6]. However, items followed best practices for the design of assessments for use among persons with lower literacy [10]. Third, our outcomes capture only initial awareness of COVID-19, fundamental knowledge, attitudes, and a limited set of behaviors. However, understanding of the virus has since quiete evolved, and we could not expand on those developments. Items included in planned follow-up waves of the survey will adapt accordingly. Finally, public health messages about new policies and restrictions dramatically change day to day. Regardless, our findings depict the initial lack of clarity in understanding and perceived susceptibility, among teenagers regarding pandemic. Bearing in mind our findings, actions and cooperation are needed amongst local authorities, health boards, trade unions, public health, disease control experts, and schools, to ensure that as long as the pandemic exists, all teenagers are adequately made aware of the gravity of the threat.
Conclusion
The level of information about COVID-19 among Greek students aged 13 to 18 years was found to be not ideal but adequate. Although the students were found informed on some aspects, they were unfamiliar with other important issues. In the light of a potential second wave of COVID-19 pandemic, our findings highlight the need for intensified health education programs in Greek schools in order to deal with this serious emerging health problem.
Experimental Cerebral Ischemia Causes Disturbances in Mitochondrial Respiration of Neurons
Introduction
Energy exchange in the cell is associated with mitochondria, which play an important role in vital processes, participating not only in the formation of ATP, but also in the storage and transmission of hereditary information, apoptosis and plastic processes [1-3]. Mitochondria are very mobile and plastic organelles that constantly change their shape, have the ability to fusion and subsequent separation. The movement of mitochondria in the cytoplasm is associated with microtubules, which determines their orientation and distribution in the cell. In some cells, mitochondria form long mobile filaments or chains, while in others they are fixed near the places of consumption of ATP [4-6]. Neurons need a constant supply of ATP for their stability and maintaining the level of potassium ions K + inside the cell, and sodium and calcium ions outside. At rest, the brain consumes up to 20% of the oxygen received by the body. Under normal conditions, effective biological oxidation is the main source of energy-rich phosphate compounds required for the renewal of structures corresponding to the functional activity of cells [5-7]. Elucidation of the mechanisms of development of energy deficiency in ischemic damage is advisable for detailing the pathogenesis, the ratio of damage and compensation processes in this pathology.
Materials and Research Methods
The experiments were carried out on 88 male outbred white rats weighing 260 ± 20 g in compliance with the Directive of the European Parliament and of the Council No. 2010/63/EU of 22.09.2010 on the protection of animals used for scientific purposes. The studies used models of total (TCI) and subtotal (SCI) cerebral ischemia. Cerebral ischemia (CI) was modeled under conditions of intravenous thiopental anesthesia (40-50 mg/kg). Total cerebral ischemia was modeled by decapitation of animals. Subtotal cerebral ischemia was modeled by simultaneous ligation of both common carotid arteries (CCA). The sampling of material for the study of tissue respiration of mitochondria was carried out 1 hour and 24 hours after decapitation or ligation of the CCA. The control group consisted of sham-operated rats of the same sex and weight. To study mitochondrial respiration, the brain was removed in the cold (0-4°C), dried with filter paper, weighed and homogenized in an isolation medium containing 0.32 M sucrose, 10 mM Tris-HCl, 1 mM EDTA, pH 7.4 (in the ratio 1:10) using a Potter-Evelheim homogenizer with a Teflon pestle according to the modified method [8]. Mitochondria were isolated by differential centrifugation. The nuclear fraction was separated by centrifugation at 600g for 10min (4°C). The resulting supernatant was centrifuged at 8500g for 10min (4°C), the mitochondrial pellet was washed twice in the isolation medium and resuspended to a protein concentration of 35-40mg/ml in the isolation medium and stored in a short tube on ice. Protein concentration was determined by the Lowry method. To study mitochondrial respiration, a concentrated suspension of mitochondria was introduced into a thermostated sealed polarographic cell with an incubation medium in an amount providing a final protein concentration in the cell of 1mg/ml. The incubation medium for recording mitochondrial respiration includes 0.17 M sucrose, 40 mM KCl, 10 mM Tris-HCl, 5 mM KH2PO4, 8 mM KHCO3, 0.1 mM EDTA, pH 7.4. The principle of operation of a 3.0 ml polarographic cell is based on the registration of oxygen uptake by mitochondria using a built-in Clarke electrode at a temperature of 25°C (Figure 1).
Figure 1: Polarographic cell for studying the respiratory activity of mitochondria 1. Cell; 2. Thermostatically controlled chamber; 3. Clarke electrode; 4. Mmagnetic stirrer; 5. Sealing plug; 6. Channels for dosed anaerobic administration of substrates and ADP; 7. A sealing ring; 8. Channel for removing air and excess liquid; 9. Fitting for connection to an ultrathermostat.
Registration of changes in oxygen tension (pO2) in the mitochondrial suspension was carried out using an electronic recorder KSP-4. The Clarke electrode was calibrated by successively blowing air (pO2 of air) and gaseous nitrogen (pO2 = 0 mmHg) through the cell. After recording the rate of basal (endogenous) respiration in the absence of a substrate (V1), respiration substrates (malate – 2 mM/glutamate – 5 mM or succinate – 5 mM) are alternately introduced into the mitochondrial suspension, and then ADP in an amount of 200 nmol/ml. The obtained polarograms are used to calculate the respiration rate of mitochondria in different metabolic states and the coefficients characterizing the conjugation of oxidation and phosphorylation processes. The following indicators of mitochondrial respiration were recorded: V1 – the rate of basal respiration, V2 – the rate of substrate-dependent respiration, V3- – the rate of respiration coupled with phosphorylation (after the addition of ADP), V4 – the rate of respiration after the completion of phosphorylation of the added ADP. The indicators characterizing the conjugation of oxidation and phosphorylation processes in mitochondria were determined: the acceptor control coefficient (AK = V3/V2), the respiratory control coefficient (DC = V3/V4) and the phosphorylation coefficient – ADP/O. The use of solutions of substrates of the complex “malate/ glutamate” and succinate makes it possible to assess the degree of functional activity of the electron transfer chain (ETC) in mitochondria in general, in particular I and II of the ETC complex [9,10]. To prevent systematic measurement errors, brain samples from the compared control and experimental groups of animals were studied under the same conditions. As a result of research, quantitative continuous data were obtained. Since the experiment used small samples that had an abnormal distribution, the analysis was carried out by methods of nonparametric statistics using the licensed computer program Statistica 10.0 for Windows (StatSoft, Inc., USA). Data are presented as Me (LQ; UQ), where Me is the median, LQ is the value of the lower quartile; UQ is the upper quartile value. Differences between groups were considered significant at p<0.05 (Kruskell-Wallis test with Bonferoni’s correction).
Results
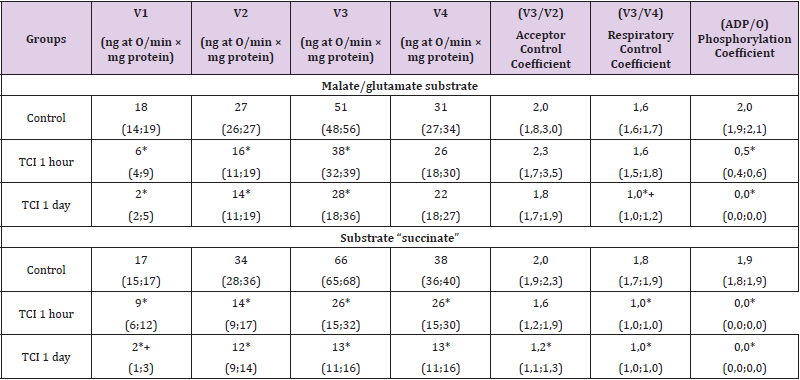
Compared with the control, at 1-hour TCI in the presence of the substrate “malate/glutamate”, which characterizes the state of the first (NADH-dehydrogenase) complex, the electron transport chain V1 decreased by 65 (58; 67)%, p<0.05, V2 – by 41 (38; 48)%, p<0.05, V3 – by 25 (22; 38)%, p<0.05, and the phosphorylation coefficient – by 78 (71; 84)%, p<0,05. The rest of the indicators (V4, the coefficient of acceptor control and the coefficient of respiratory control) did not change (p>0.05), (Table 1). In the presence of succinate substrate, which reflects the work of complex II (succinate dehydrogenase) of the electron transport chain, a decrease in the parameters of energy exchange was established: the rate of basal respiration V1 – by 44 (38; 52)%, p<0.05, the rate of substratedependent respiration V2 – by 60 (48; 64)%, p<0.05, respiration rate associated with V3 phosphorylation – by 59 (38; 65)%, p<0.05, respiration rate after completion of phosphorylation of added V4 ADP – by 32 (28; 46)%, p<0.05 [9].
Table 1: Respiration indices of the mitochondrial fraction of rat brain homogenates with total cerebral ischemia when using the substrates “malate/glutamate” and “succinate”, Me (LQ; UQ).
Note: p<0.05 compared with the control group, + – p<0.05 compared with 1-hour TCI, TCI – total cerebral ischemia.
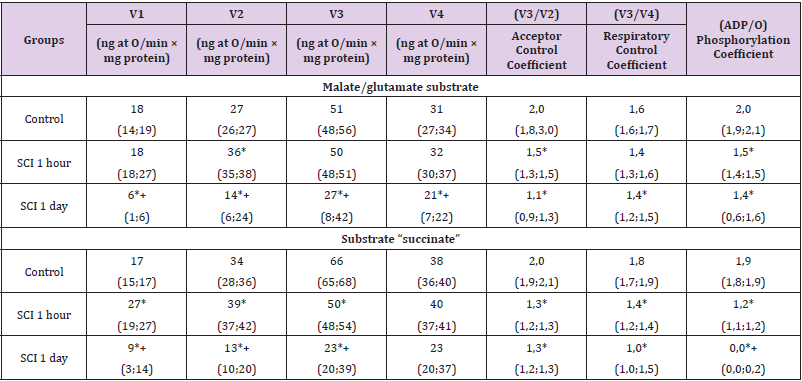
The respiratory control coefficient (V3/V4) decreased by 45 (42; 48) % (p<0.05), the phosphorylation coefficient (ADP/O) at 1-hour CTI was zero. The acceptor control coefficient (V3/V2) did not change (p>0.05). The decrease in the rate of basal respiration V1 was more pronounced when using the substrate succinate (by 21%, p<0.05), which indicates a greater damage to the II complex (succinate dehydrogenase) of the electron transport chain (ETC) during TCI. There were no differences between other indicators (p>0.05). Under conditions of 1-day TCI in the presence of the substrate “malate/glutamate” at 1-day TCI, V1 decreased by 90 (82; 96) %, p<0.05, V2 – by 46 (42; 55) %, p<0,05, and V3 – by 45 (39; 56) % (p<0.05), the respiratory control coefficient – by 35 (31; 42) % (p<0.05). Indicators V4 and the coefficient of acceptor control did not change (p>0.05). The phosphorylation coefficient (ADP/O) when using both succinate and malate/glutamate with 1-day TCI, as with 1-hour TCI, was equal to zero. Compared to 1-hour TCI, the respiratory control coefficient with 1-day TCI was 41 (35; 47) % less (p<0.05). There were no differences in other indicators (V2, V3¬, V4, acceptor coefficient and phosphorylation coefficient) (p>0.05), (Table 2). In the presence of succinate, there was a more significant decrease in V1 than with 1-hour TCI – by 90 (84; 95) %, p<0.05, V2 – by 65 (54; 70) %, p<0.05, V3 – by 78 (54; 87) %, p<0.05, V4 – by 67 (59; 81) %, p<0.05. The respiratory control coefficient decreased by 45 (41; 49) %, p<0.05. Compared with 1-hour TCI, the V1 index was 80 (75; 86) % less (p<0.05) Changes in mitochondrial respiration in relation to the control level when using both substrates were equivalent (p>0.05). In the SCI group lasting 1 hour, compared with the control group, in the presence of malate/ glutamate, V2 increased by 24 (18; 27) %, p<0.05, and the acceptor control coefficient and phosphorylation coefficient decreased by 25 (17; 29) %, p<0.05. Other indicators (V1, V3, V4, respiratory control coefficient) did not change (p>0.05). In the presence of the substrate “malate/glutamate” at 1-hour SCI, the mitochondrial respiration indices V1, V2, V3 and V4 were 89 (82; 93) % higher than at 1-hour TCI, p<0.05, 58 (55; 63) %, p<0.05, 24 (21; 29) %, p<0.05 and 32 (27; 37) %, p<0.05, respectively [10-19].
Table 2: Respiration indices of the mitochondrial fraction of rat brain homogenates in subtotal cerebral ischemia when using the substrates “malate/glutamate” and “succinate”, Me (LQ; UQ).
Note: p<0.05 – in relation to the control level, + – p<0.05 compared to 1-hour SCI, SCI – subtotal cerebral ischemia
The respiratory control coefficient did not change (p>0.05), while the acceptor control coefficient was 34 (24; 43) % less, p<0.05, and the phosphorylation coefficient was 66 (58; 73) % more, p<0.05. The decrease in the phosphorylation coefficient with SCI was less significant by 53% (p<0.05). In the presence of succinate substrate, an increase in the rate of basal respiration V1 was noted – by 38 (34; 42) %, p<0.05, the rate of substratedependent respiration V2 – by 13 (9; 18) %, p<0.05, rate respiration associated with V3 phosphorylation – by 26 (21; 32) %, p<0.05. These changes indicate a significant decoupling of oxidation and phosphorylation. The respiration rate after the completion of phosphorylation of the added ADP (V4) did not change (p>0.05). At the same time, the acceptor control coefficient, the respiratory control coefficient and the phosphorylation coefficient decreased by 35 (31; 39) %, p<0.05, 20 (18; 28) %, p<0.05 and by 36 (30; 41) %, p<0.05, respectively, which indicates a decrease in energy production. Compared with 1-hour TCI, with 1-hour SCI in the presence of the substrate “succinate” the rates V1, V2¬, V3 and V4 were 67 (62; 71) % higher, p<0.05, 64 (58; 68) %, p<0.05, 46 (39; 52) %, p<0.05 and 35 (31; 41) %, p<0.05, respectively. The respiratory control coefficient increased by 30 (24; 36) %, p<0.05. The phosphorylation coefficient at 1-hour TCI was zero. When using succinate, the decrease in the respiratory control coefficient was less pronounced with SCI (by 10%, p<0.05). When using succinate, when using malate/glutamate, in relation to the control level, the phosphorylation coefficient was lower by 11% (p<0.05). Other indicators (V1, V3¬, V4, respiratory control coefficient, acceptor control coefficient) did not differ (p>0.05). An increase in V1 and V2 and a decrease in the phosphorylation coefficient (ADP/O) indicates proton transfer bypassing the ATP synthase complex. Enzymes of the mitochondrial matrix and cytochrome in this model of CI do not yet have pronounced damage, as evidenced by the high rates of V1 and V2, however, a decrease in the coefficients of acceptor control, respiratory control and phosphorylation indicates the separation of oxidation and phosphorylation processes and a decrease in the production of ATP during SCI. More pronounced disturbances with the use of succinate than with the use of malate/glutamate indicate a greater damage to the succinate dehydrogenase complex of ETC, as in TCI. In the presence of the substrate “malate/glutamate” at 1-day SCI, compared with 1-day TCI, V1 decreased by 66 (60; 71)%, p<0.05, V2 – by 45 (41; 50)%, p<0.05, V3 – by 47 (39; 52)%, p<0.05, V4 – by 34 (27; 39)%, p<0.05, which is more significant than with 1-hour SCI by 87 (72; 94) %, p<0.05, 61 (58; 73)%, p<0.05 and by 46 (41; 52)%, p<0.05, respectively, except for the value of the V4 indicator, which did not change, p>0.05. The coefficients of acceptor control, respiratory control and phosphorylation decreased by 42 (37; 51) %, p<0.0; by 12 (9; 18) %, p<0.05 and by 25 (21; 32) %, p<0.05, respectively. In the presence of the “malate/glutamate” substrate, the basal respiration rate V1 was 67% higher (p<0.05), the acceptor control coefficient was 39% lower (p<0.05), and the phosphorylation coefficient at 1-day TCI was zero. Under the conditions of daily SCI in the presence of succinate substrate, a decrease in V1 was noted – by 47 (39; 51)%, p<0.05, V2 – by 62 (54; 66)%, p<0.05, V3 – by 64 (59 ; 68)%, p<0.05, which is more pronounced than with 1-hour SCI by 67 (62; 72)%, p<0.05; by 66 (63; 74)%, p<0.05 and by 55 (49; 59)%, p<0.05, respectively. The acceptor control coefficient and the respiratory control coefficient decreased by 35 (29; 41) %, p<0.05 and by 44 (38; 49) %, p<0.05, respectively. The phosphorylation coefficient with 1-day SCI, as well as with 1-day TCI, was equal to zero. Compared with TCI lasting 1 day, with 1-day SCI in the presence of succinate substrate, the V1 rate was 78% higher (p<0.05), and the V3 and V4 rates were higher by 43% (p<0.05). while other parameters did not change (p>0.05). The use of a mixture of malate with glutamate as a substrate for 1-day SCI showed similar changes in mitochondrial respiration parameters as with succinate, with the exception of a higher phosphorylation coefficient – 1.4 (0.6; 1.6), p<0,05. The decrease in the V1, V2, and V3 indices with 1-day SCI is a consequence of a decrease in the oxygen content for mitochondrial respiration. The suppression of energy processes was more pronounced than with 1-hour SCI, which reflects an extremely low phosphorylation coefficient. Changes in V1, V2 and V3 indicators at 1-hour SCI and 1-hour TCI were multidirectional. Their increase in SCI is associated with the uncoupling of oxidation and phosphorylation, while a decrease in TCI is associated with a lack of substrates for mitochondrial respiration. The decrease in the rate of basal respiration V1 with 1-day SCI was less pronounced than with TCI: in the presence of succinate – by 43% (p<0.05), and in the presence of malate/glutamate – by 24% (p<0.05).
Conclusion
During cerebral ischemia, damage to the inner mitochondrial membrane occurs due to the activation of free radical oxidation processes [5]. Damage to the inner mitochondrial membrane, in turn, leads to an increase in its permeability and a decrease in the level of the proton gradient due to the transition of protons along the concentration gradient through the formed nonspecific pores into the mitochondrial matrix [13,19,18]. As a result, the efficiency of ATP synthesis decreases, and to maintain the intermembrane potential under these conditions, more substrates and oxygen are required [14-18]. Thus, the most pronounced decrease in the respiration indices of the mitochondrial fraction of brain homogenates occurs in total cerebral ischemia due to the complete cessation of the blood supply to the brain neurons. With this method of modeling cerebral ischemia, the appearance of hyperchromic shriveled neurons with pericellular edema is characteristic. In their cytoplasm, the destruction of organelles occurs, the disintegration of neurofibrils and neuropil, which indicates their low functional activity. Simultaneous subtotal ischemia also leads to severe irreversible damage to neurons: at the morphological level, this is manifested by a significant increase in the number of hyperchromic shriveled neurons. Their predominance in the population of neurons in the SCI group corresponds to the inhibition of respiration of the mitochondrial fraction of brain homogenates.
COVID-19 Pandemic and Horticultural Sector: An Investigation of Cause & Effect Relationship in J&K
Introduction
Despite radical structural changes over the years, the agricultural sector consistently continued to remain an important activity supporting J&Ks’ economy. Although the domestic product generated in this sector has increased by 25.94 cr. since 1980-81 (DE&S, various issues) but it could not keep pace with the growth of other sectors of economy. The proportionate decline in the role of this sector towards states’ domestic product seems discouraging given the huge dependence of labour force on this sector. The concentration of poor and landless labourers has given a strategic place to this sector in the process of economic progress for whom it is the only option for sustenance and livelihood. Agriculture has played an important role in ensuring inclusive growth and providing food security to its populace [1] despite huge urban pressure on land resources. The development of this sector seems more relevant in spite of shrinking land resources, depletion of water resources, climate change, costlier farm-inputs and instability in global markets. To overcome these issues, quality research and skill development would be required to develop technologies that are relevant to the region and could be put in use to achieve rational resource use efficiency. But it will require strengthening of infrastructure which could intern result in and better governance/ management to make delivery of services better.
Switching over to Horticulture
The agro-climatic diversity of the union territory of Jammu and Kashmir favors diversification towards horticultural crops. The capacities of the territory are being increasingly shifted towards the production of horticultural crops as driven by market demands and in turn profitability. The reason for this switchover may be attributed to the less remunerative production of field crops like rice and maize. Horticulture crops occupy an area of 3.31 lakh hectares (2018-19) in J&K, of which a whopping1.64 lakh hectares is under apple cultivation [2]. 20 and 24 lakh metric tons annually of fresh and dry fruits, respectively of which apple alone constitutes 80 per cent. Horticultural sector is the largest employment provider in the region engaging over 23 lakh people, depending directly or indirectly on this sector [3]. Kashmir has rightly been described as the land of fruits, producing 24.15 lakh mt of fruits from 332 lakh ha of land. Its land, environment and salubrious climate provides greater facilities for rapid growth of horticulture industry. The fruit production is highly capital and labour intensive activity, thus become the most dominant factor for changing the social and economic status of rural Kashmir. The vibrant fruit sector of Kashmir holds key to the economic growth as well as sustenance by containing the widespread unemployment in the union territory. The fruit sector has strong backward and forward linkages which involve such activities that have significant multiplier effects. From the input market to the final destination of produce, this sector has a long supply/ value chain. The market functionaries and various marketing logistics/infrastructures including cold storages, market yards, loading, weighing facilities involved in long supply/value chain constitute the basics of an efficient supply chain management. Any permanent or temporary changes that disrupt its supply/value chain to any extent have long lasting multiple negative implications on the performance of the fruit economy. In accordance with this the political disturbances, climate change, price fluctuations, availability of labour or inputs, etc. may have undesirable effects on the desired performance of the horticultural sector. Undoubtedly the ongoing covid-19 pandemic and associated lockdown are expected to have some implications on horticultural economy necessitating assessment in terms of their magnitude which forms an objective of this study.
Status of Covid-19 Pandemic Across States & in J&K, UT
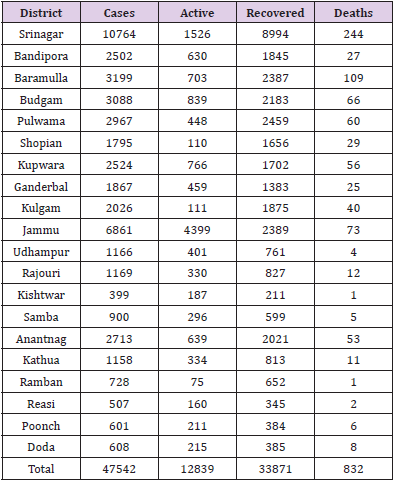
Table 1: District wise status of corona virus cases in Jammu and Kashmir.
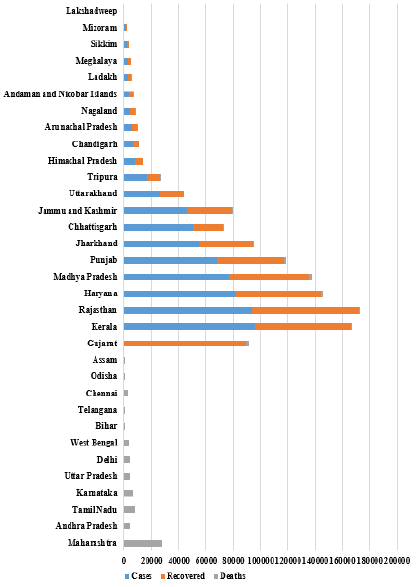
There is hardly any place on the earth which is not infected by this dreadful virus. Covid-19 pandemic that spread in every part of the world. This virus was first detected in Kerala (state of India) on January 30, 2020 and then gradually kept on spreading across all the states and UTs of the country. As of now the country has reported 4.47 million infected cases of which 3.47 million have recovered (MHFW, India). This covid-19 infection has taken about 75,062 lives. All the health centers across the country are involved in prevention as well as arresting further spread of the disease. In India, Maharashtra recorded highest number of cases compared to other states (Figure 1). The other highly affected states/UT’s in India include Tamil Nadu, Gujarat and Delhi. The situation is J&K, UT is also grim as the numbers of cases are adding to the infected patients with every single passing day. Within Kashmir province of Jammu and Kashmir UT the first covid-19 case was reported from Khanyar area of Srinagar city, and the case was having a travel history. Since then every nook and corner of the Union Territory was put on high alert with demarcation of district with Red, green and Orange zones. The capital of the UT, district Srinagar, witnessed highest number of infected persons (Table 1). A total of 671 people (614 in Kashmir and 57 in Jammu) have died of the virus in the Union Territory so far. The infection is spreading at an exponential rate and is yet to see its peak in the territory which calls for necessary measures to neutralize the effects of this pandemic.
Figure 1: State wise covid-19 confirmed cases and deaths recorded in India. Ministry of Health & Family Welfare, Govt. of India, 10 September, 2020
Restricting Corona Spread with Lockdown
The novel coronavirus has wreaked havoc across the globe, killing and infecting millions and in turn affecting world economy. Since the virus is highly communicable, the only option to prevent or slow down its spread is to prohibit contacts and maintain social distancing. Therefore, like other economies, lockdown was taken as a measure to restrict its spread across India which has over 1.35 billion population. Lockdown is considered one of the harsh steps to combat the coronavirus pandemic as it is novel in nature and no vaccine is available till date despite a lot of ongoing research. Lockdown is the best available option for India considering it less advanced and less equipped health sector. J&K UT also observed like rest of the country a strict lockdown with prohibitory orders and all the economic activities of the territory were stopped. During this period government took a number of measures like opening up of dedicated covid-19 test centers, provision of support to the poor sections and relief package to few economic activities. Although the lockdown has reduced contacts and spread of virus significantly but the closure of economy definitely has broken the network of its various activities which is expected to have short as well as long term implication on the livelihood of different sections of the population and wellbeing of the national economy.
Lockdown Features and Impact on Growth Indicators of Horticulture
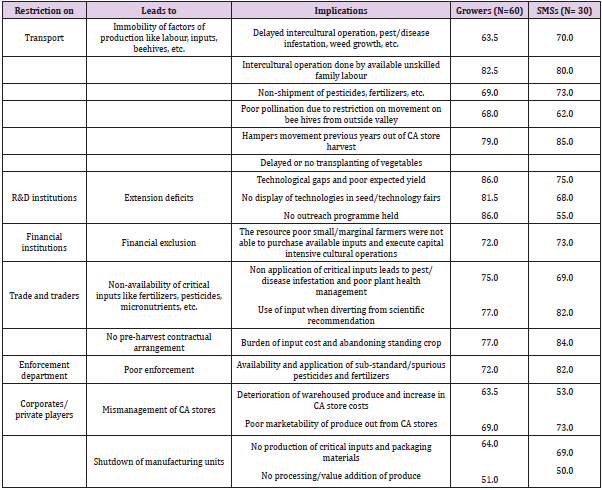
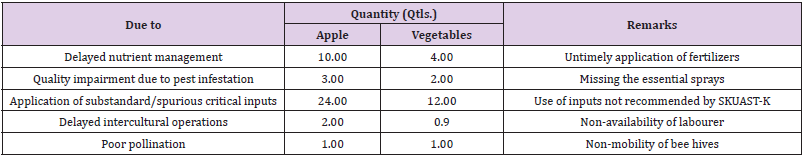
Lockdown in Kashmir valley of J&K was imposed to restrict the spread of covid-19. Barricades, barbed J-hock wires and even trunks of popular trees were used to block all the roads connecting cities, towns and villages. The restrictions imposed on internet, transport, and communication subsequent to the abrogation of Article 35A and 370 was further carried forward with strict prohibitions. The implication of the lockdown has impacted the already limping economic activities of the territory along with its relevant sectors. Of these, agricultural sector owing to its biological nature was expected to get drastically influenced by the lockdown, since the impact on this sector is complex and varies across diverse segments that form its value chain. Farming is gradually diversifying in favour of fruits especially apple which has strong linkages in pre-production and post-production. Apple cultivation is the main farming activity employing more than 23 lakh people in the valley and is the predominant activity of small and marginal growers. Apple production has long value chain between input markets and consumers of final products which necessarily has to be integrated. Through its value chain horticultural production and processing requires diverse inputs and services and any distortion in this chain would have drastic unfavorable impact on its productivity and growers net returns. The restriction on transport, mobility, administration, financial sector, etc. under lockdown is an add-on hurdle inflicted on different segments of long value chain of horticultural sector of J&K. During the first phase of lockdown which coincided with leaflet and first fruit development stage of apple and the application of dose of nitrogen, potassium, phosphate, fungicides, acaricides, insecticides and sprays of other micro-nutrients which is highly crucial for plant health and prevention of infestation of pests got affected badly. Since the restrictions were imposed on all the activities, it has resulted in immobility of factors of production that delayed the application of inputs at stage specific for their execution. The complete shutdown of all Universities, Research institutions, KVK’s led to the communication gaps between apple growers and the extension functionaries resulting in no or poor percolation of advisories to the growers. The technological disseminations activities like farm visits, training/workshops and exhibitions could not be organized by the Agricultural institutions. Moreover, scientists and Subject Matter Specialists (SMS’s) were not able to attend experimental field that drastically affected field demonstration. The response to huge technological gaps owing to poor extension system was reported by 21.0 and 7.3 per cent of growers and SMSs, respectively. This duration has taken apple cultivation far from scientific package of practices in absence of the role of extension activities, financial institutions, etc. (refer Figure1 for details of implications). The horticultural economy got severely hit when lockdown halted transportation that suspended the movement of the previous year’s harvest kept in the CA stores. March and April is considered the peak season for the stored apple to be transported to the mandis outside the state, but due to transport restriction, the fruit is expected to rot in the stores and the growers may not be in a position to meet the production cost including CA store charges and has been also disrupting the supply chain (Raashid Hassan and Ishtiaq Wani, 2020). As per reports approximately 4 per cent of Kashmir’s’ apple produce of 23 lakh metric tons was in cold storage units. The growers had to pay an amount of Rs 30 per box per month as cold storage charge and the apple which is stored for seven months costed around Rs 215 for a 16 kilogram box which amounts to an additional Rs 100 crore cold storage charges for one lakh tons of apples. Within CA stores the quality of apple gets gradually deteriorated raising the concerns for its sale but despite this fact the growers still paid the charges. As per official records apple worth Rs 900 crores were still in the valleys’ CA stores up to ending May, 2020 that imply, the loss of such a huge amount raised havoc among the farming community. The closing up of corporate or the functioning of private players has put manufacturing of fertilizers, pesticides, and packaging material to a complete halt and this problem intensified with the non-availability and immobility of raw material to these units. The apple/vegetable growers faced lot of inconveniences in purchasing the chemicals and fertilizers due to closure of shops in the valley besides all the government offices and functionaries remained closed which inflicted indirect costs to growers in terms of non-availability of timely credit for performing capital intensive intercultural operations and purchase of inputs. In consideration to the severity of lockdown, a good proportion of worried growers were apprehensive of possible sale of their apple produce which apprehensions forced them to reduce the application of fungicides and other chemicals, further resulted in intense pest infestation. A proportion of growers preferred fungicides which are not prescribed in package of practices to save money to meet the expenses on basic necessities [4]. Since the vegetable and fruit cultivation is highly labour intensive, therefore, unavailability of laborer’s contributed too negatively to the apple economy. Labour demand in Kashmir broadly depends on out-side state labour force. Political disturbances that arose due to scrapping of Article 370 had already forced migration of laborer to return to their native places which had created scarcity of skilled/unskilled laborer’s in apple growing belt of the valley. The non-availability of laborer’s due to COVID-19 further aggravated the problems in production of fruits particularly apple and vegetable. The standing vegetable crop could not be harvested skillfully on time and there was a delay in transplanting of vegetables nurseries, which reduced the returns from vegetables further by an amount of Rs 22000 per kanal (Table 2). Apiculturists rent out beehives to apple growers for pollination of their apple orchards. Since these apiculturists are migratory, they were yet to return to the valley when covid-19 lockdown was announced. The mis-managed pollination not only caused loss to the apiculturists but is expected to decrease the productivity of apple by 20-25 per cent.
Table 2: Lockdown features and possible implications on horticulture (%).
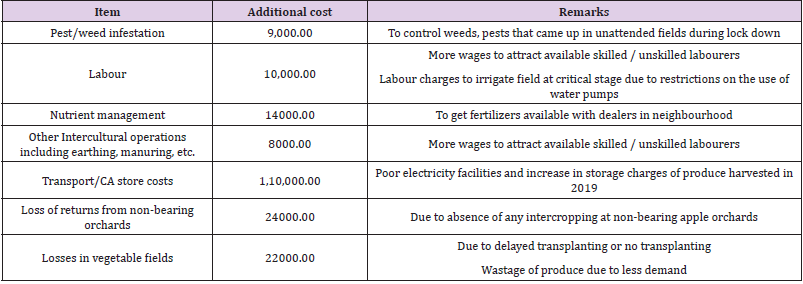
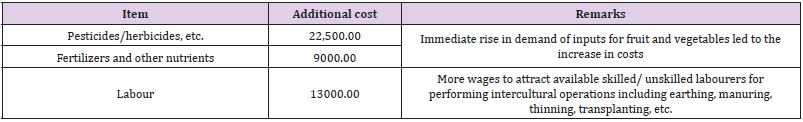
The poor execution of various economic activities relating to the value chain of apple and vegetables leads to an increase in the cost of cultivation. Farmers could not attend their fields in a crucial fruit development stage that resulted in pest/weed/disease infestation and an additional amount of Rs 450.0 were spent on this input. More demand in relationship with the supplies resulted in more wage rate of available labour. Agriculture land is being shifted to horticultural crops especially apple at alarming rate and nearly 2.5 lakh hectare apple area is in non-bearing stage. Farmers raise intercrops for home consumption thus increase their real income but owing to strict restriction there have been dis-economies worth of Rs 24000.00 per hectare as no intercropping has been done within non-bearing orchards. During the second phase of Covid-19 lockdown, the transporting fare escalated from Rs 15,000 per truck to around Rs 35,000 and even then, only few trucks were available for transporting the apple to the other mandis. Though the restriction on mandis was relaxed to open the outlets but the out of CA store apple produce could not see the buyers and the produce spoiled in a bad way. Similarly an additional amount was spent by growers in different items to resolve the added problems due to lockdown (Table 3).
Table 3: Additional costs due to lockdown (Rs/ha-1).
Relaxation in Lockdown have Aggravated Problems
In the first phase of relaxation all the farm operation were permitted which made all the stakeholders like growers, traders, and custom hiring activities restarted. Growers came out to start spraying, fertilization and other intercultural operations but they face trouble in finding skilled labour services, quality critical inputs and other material. The abrupt increase in the demand in relationship with inelastic supplies in short period resulted in the rise in price of inputs. Although manufacturing sector was allowed to start their activities but they could not come up the spike in demands for pesticides and fertilizers for three main reasons viz. one that they could not use their unit to full capacity while observing social distancing and other relaxation guidelines, second a good chunk of laborer’s were on way to or reached to their native place and third was the dearth of transport to ship the consignments. The pesticides, which may not be as per scientific recommendation, are purchased at higher prices and growers have to bear the additional costs on these items (Table 3). The Covid-19 further aggravated the mayhem created after repealing of article 35A and 370 of Indian constitution. Only a few laborer’s available in the valley took ways back to their native places though a part of local laborer’s returned to the valley. The non-local labors did not wish to come back to the valley, given the unpredictable corona related situation following the lockdown [5-8]. This resulted in the less or no availability of labour services bringing asymmetry in the execution of farm operations. As high as Rs 9000 ha additional amount was spent on labour wages contributing to heavily for horticulture industry especially apple (Table 4). The associated implication of lockdown resulted in the limited production of packaging material for fruits like cherry. Although the cherries were harvested with available family laborer’s but the poor transportation facilities and irregular marketing activities in wholesale markets within and outside the valley resulted in the wastage of produce and sale of some surpluses at lower rates in domestic markets. The rising demands for inputs and labors and deficit supplies led to the overall rise in the prices of factors of production. After lockdown, the economy is expected to take time to balance the markets, however, the institutions has to play an important role with safety cover and financial support.
Table 4: Additional costs on intercultural operations in apple in relaxing lockdown (Rs/ha-1).
Climate and Covid-19
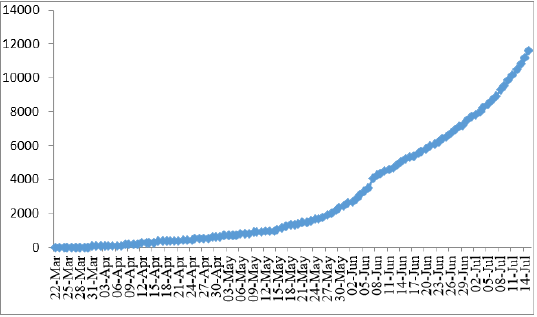
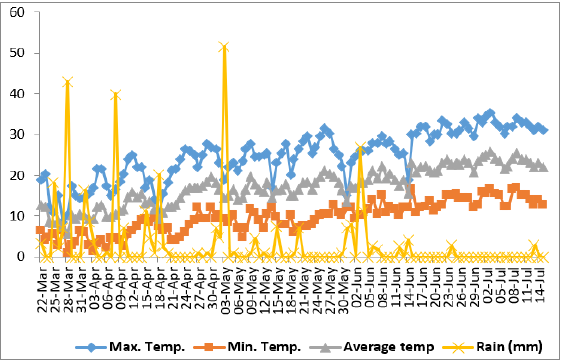
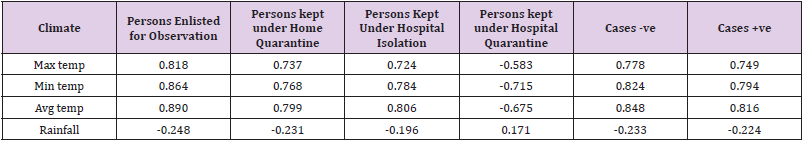
Scholars across the globe were of the opinion that the severity of corona virus infestation may reduce gradually with each degree rise in temperature and this notion says that the territory would have a virtual exit from pandemic in summers. The temperature (max., min., and average) experienced a gradual rise as the territory has been through spring towards summer season with an ideal normal behaviour with occasional rains with maximum spike of only 55mm in the beginning of May (Figure 2). The covid-19 pandemic finds no end rather the positive cases kept on rising consistently with steeper upward slope in recent days (Figure 3) thereby explaining the regressive increase in corona virus affected cases wherein community has got involved. The evolving scenario of covid-19 pandemic exhibits positive correlation with temperature as both progresses towards same direction (Table 5). There appears no significant association of corona virus infection with rainfall. Given these findings we can foresee only uncertain behaviour of covid-19 pandemic which directs towards building up health care facilities in the region. It would apparently cost fairly a good amount to adhere medical guidelines to be followed in horticultural farms. Institutional role with a kind of safety cover could inevitably find its place in avoiding further deviations from scientific management of orchards and vegetable farms.
Figure 2: Behaviour of covid-19 cases between 22/03/20 and 14/7/20
Figure 3: Behaviour of climate variables between 22/03/20 and 14/7/20.
Table 5: Climate in correlation with corona virus infections.
Lasting Impacts of Covid-19 Pandemic on Horticulture in Kashmir
The covid-19 related lockdown has affected all the farm activities like the entire economy. There as a huge delay in the execution of intercultural operations and application of input. The inputs available within the approach of growers, could be substandard but were purchased at much higher costs and applied on apple crop. The delayed pest management due to unavailability of quality pesticides encouraged pest/disease/weed infestation which not only increased the cost of their management but also expected to reduce the productivity of apple/vegetables and deteriorate the quality of produce. During relaxation the orchards are suffering from scab, sanjose scale and other pests, which may be much worse in the coming months. Estimated 40-50 per cent of the apple orchards and 25-35 per cent of vegetable fields are suffering from pest/diseases of various kinds. The delayed management of orchards and poor pollination is expected to reduce the yield level to a great extent (Table 6). These manifestations of impact are considered to last for a longer time period.
Table 6: Expected decline in productivity (kg/ha-1).
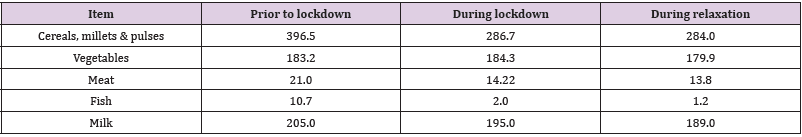
The supply chain of apple and vegetables starts from the purchase of inputs and their application on crops. The nonavailability of transportation made growers to act as a part of closed economy wherein the inputs whatsoever available with whosoever traders were applied on the crops resulted in the complete distortion of supply chain. The produce of other fruits like cherries at farm of apple orchardist were due to be harvested by ending May. However, due to non-availability of skilled laborer’s the cherries were harvested by the family laborer’s but the surplus fruit could not be sold outside the state incurring a huge loss to the producers accompanied by less net price received. This scenario obviously shall have a long-term self-perpetuating negative implications on farm economy in general and horticultural economy in particular. Growers were not able to sell off their vegetable produce during the first phase of lockdown and could not earn from subsidiary occupations like shop-keeping, handicraft, driving services, etc. that reduced their purchasing power drastically. Poor role of financial institutions coupled with poor resource position of grower are expected to reduce their spending on critical inputs in future and may further reduce productivity on account of increasing technological gaps and unscientific cultivation of apple. Moreover, the small holders with limited resources in consideration of unforeseen corona situations were seen to spend lesser amount on family consumption of food and nutrients (Table 7) which may inflict undesirable influence on the health status. The uncertainties about the persistence of Corona Virus related disease is expected to have negative impact on the sale proceeds of apple in domestic as well as international markets. The demand of apple by traders, processors and export houses is likely to reduce further in consideration of poor business returns in the current season. Moreover, our importing partners would possibly prefer to consume their domestic produce. The slackening of working capital and poor employment of laborer’s may lead to less derived demands and in turn would make the multiplier to operate in a reverse order. Unless this situation is taken seriously, it is rather impossible to put apple economy back on the trajectory of steady growth.
Table 7: Dietary intake of small holders during and after lockdown (g/capita/day).
Conclusion and Policy Suggestions
Even though relaxations for agricultural activities have been announced after the first lockdown in J&K, impact of the lockdown still can be seen in terms of difficulties in marketing perishables, transporting farm inputs, institutional closure, credit availability, closure of Government offices and basic necessities for the apple growers. Following policy suggestion would help to bring up horticultural economy to the steady growth level: Farming community, especially horticulturist’s, with small holders and landless laborer’s should be brought under the benefits of economic packages. There is a pent up need to conceive a special insurance coverage scheme including damage to the crop in terms of quality and quantity both in view of climate uncertainties and for not attending farms due to geopolitical conditions and pandemic like that of covid-19. E-crediting system with easy procedures find their importance in advancing loan to small holders at the time when it is highly required. These options could help retention of farmers in farming and prevent them from selling out land or abandoning of farming as a commercial activity. There is a need to integrate production with marketing through value addition so as to achieve various economies and utilities. This way grower can utilize his farm produce efficiently if markets are not available immediately and the skilled/unskilled laborer’s would find employment for major part of the year. There is a dire need to make a demand assessment of inputs well in advance, consistent with regional crop plans, to ensure full stock of required quantity well before the commencement of crop season. This will provide information to the industries Moreover, the timely warehousing and creation of CA storage facilities in PPP mode with necessary logistics around each production centre would help to hoard inputs and outputs for their timely availability. Additional 10-20 CA stores would be required in the valley for which government and corporate sector should chain up with pooled resources. In light of unforeseen abrupt distortions in supply chain, there is a need of a properly conceived procurement policy so that farmers may not face glut or price fluctuations. Additionally this policy may be converged with MSP system to add security to the farming community by avoiding market and price uncertainties. Labour scarcity is considered to be one of the persistent problems to confront horticultural sector in view of male outmigration and other significant reasons. There is a need for automation and mechanization of farm operation to enhance work and input use productivity in horticultural crops.
Influence of iSGLT-2 on Lipid Profile in Patients with Diabetic Nephropathy
Introduction
Diabetes mellitus (DM) is a global medical and social problem of our time, which is faced by medical science and healthcare in almost all countries of the world. The World Health Organization (WHO) for the first time recognized this disease as a new non-infectious epidemic of the 21st century, since in recent years the growth rate of patients has become alarming [1]. The current constant increase in the number of patients with type 2 diabetes unambiguously affects the incidence of microvascular complications, including diabetic nephropathy (DN). DN increases morbidity, disability and mortality in type 2 diabetes patients. DN in parallel with diabetes is a risk factor for the onset and progression of cardiovascular diseases and one of the main factors of end-stage renal failure [2,3]. Type 2 diabetes increases the risk of chronic kidney disease (CKD) 2.6 times, and the risk of death due to kidney pathology – 3 times. According to statistics, CKD develops in about 15% of individuals in the general population and in every second patient with diabetes mellitus (DM). In Uzbekistan, 118026 patients with CKD were registered, in 2020 the number of patients with CKD was 23773 with CKD, of which 5146 are on hemodialysis, about 40% are patients with diabetes [2]. The leading role in the development of CKD in patients with diabetes is played by permanent hyperglycemia. Advances in the treatment of patients with diabetes mellitus (DM) in recent years do not reduce the risk of chronic kidney disease (CKD), but provide a delay in its development. Obesity and the associated lipid metabolism disorder is a factor in the progression of any kidney disease, including DN. Along with damage to the mesangial and paramesangial regions of the glomerulus, lipids filtered into the primary urine can also cause damage to the cells of the renal tubules [3-5]. It has been shown that the lipid profile shift characteristic of T2DM is chronologically ahead of the development of carbohydrate metabolism disorders and confirms the fact that lipotoxicity pathogenically precedes glucose toxicity [6,7]. The most pronounced anti-lipolytic effect is possessed by representatives of the gliflozin classes (iSGLT-2). Meanwhile, the action of hypoglycemic drugs should also be considered from the point of view of renoprotection and correction of cardiovascular insufficiency [7].
Purpose of the Study
To study the effect of iSGLT-2 on the parameters of carbohydrate metabolism, lipid spectrum in patients with diabetic nephropathy.
Material and Research Methods
The prospective study included 80 patients with type 2 diabetes with DN. The duration of diabetes mellitus was on average 9.7 ± 0.9 years. To study the effect of iSGLT-2 on carbohydrate metabolism, lipid profile in type 2 diabetes mellitus, 2 groups were identified. Group 1 40 patients with type 2 diabetes with CKD G3a diabetic nephropathy, average GFR 56 ± 0.9 ml / min 72 m2, patients’ age was 56.8 ± 2.8 years, of which 18 were men and 22 women, as hypoglycemic therapy received metformin and a sodium-glucose cotransporter type 2 inhibitor (iSGLT-2) empagliflozin. Group 2 of 40 patients with diabetic nephropathy, the average age of patients was 58.3 ± 2.9 years, including 21 men and 19 women with CKD G3b, the average GFR was 40 ± 0.9 ml / min 72 m2. The studied groups of patients were comparable in terms of sex, age, duration and severity of diabetes mellitus. The patients were on a constant diet, and they were not prescribed hypolipidemic therapy. Glomerular filtration rate was determined using the CKD-EPI formula. Glycemia was determined on an automatic biochemical analyzer BS-380 “Mindray” by glucose oxidase method in venous blood on an empty stomach using HUMAN Glucose reagents (Germany). HbA1c was determined on a Huma Nex A1c analyzer. The lipid spectrum of blood was determined using kits from Cypress Diagnostics (Belgium) using a Hospitex Diagnostics spectrophotometer. Total cholesterol and triglycerides in blood serum were determined by a standard enzymatic method, HDL cholesterol in the supernatant was determined after precipitation of lipoproteins of other classes with dextran sulfate. LDL cholesterol values were calculated according to the formula of W. Friedwald (1972): LDL cholesterol = total cholesterol – (TG / 2.2 + HDL cholesterol), mol / l. Control studies of the studied parameters were carried out after 3 and 6 months.
Research Results and their Discussion
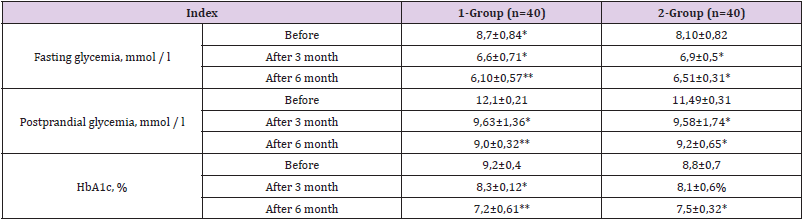
Studies have shown that the baseline indicators characterizing glycemia (fasting glycemia, postprandial glycemia and HbA1c%) in the studied groups were comparable (Table 1). By the 3rd month of treatment, there was a significant decrease in HbA1c in the 1st and 2nd groups of patients. The decrease in HbA1c in the 1st group occurred by 9.2% (P <0.05), in the 2nd group by 8.8% (P> 0.05), which is almost 2% lower. The initial indicators of fasting glycemia and postprandial glycemia in the 1st group did not significantly exceed the indicators of the 2nd group (8.7 ± 0.84 mmol /l and 8.10 ± 0.82 mmol /l, respectively; 12.1 ± 0, 21 mmol /l and 11.49 ± 0.31 mmol /l, respectively), after 3 months these indicators significantly decreased in the 1st group by 24.9% and 19.8%, respectively, in relation to the initial data, in the 2nd group, the decrease was significantly lower – 14.1% and 16.8%, respectively. In the dynamics of treatment, after 3 and 6 months, there was a pre-delivery decrease in the studied parameters of carbohydrate metabolism in both groups of patients. So, the level of postprandial glycemia within 6 months in both the 1st and 2nd groups significantly decreases in relation to the initial data, in the 1st group – by 25.6% and by 19.9% (P < 0.05). The HbA1c content after 6 months decreased by 25% in the 1st group of patients with type 2 diabetes and by 10.2% in the 2nd group (P <0.05). Episodes of hypoglycemia were not observed in both groups. By the 6th month of observation, it should be noted that the glycated hemoglobin indicators reached the target values in patients with diabetic nephropathy (Table 2).
Table 1: Dynamics of carbohydrate metabolism indicators in the treatment groups at baseline and after 3 (M ± m).
Note: * p <0.001, ** p <0.05
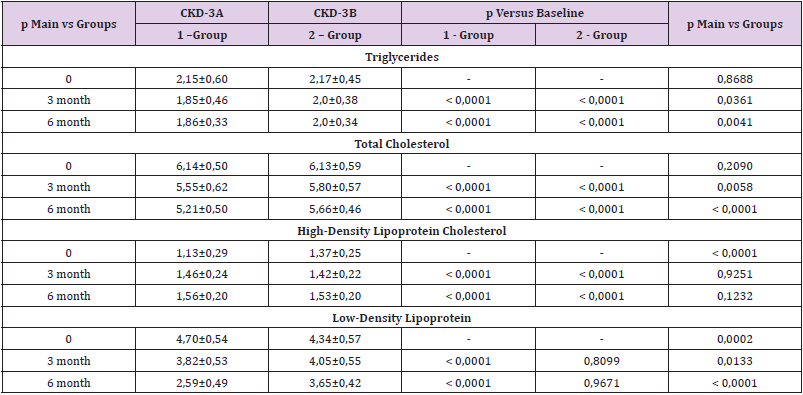
Table 2: Influence of the appointment of sodium glucose cotransporter type 2 inhibitors (iSGLT-2) on the lipid profile in DN.
The study of the lipid spectrum in the observed patients showed that when using hypoglycemic therapy (metformin + iSGLT-2) after 3 and 6 months of therapy, a decrease in the level of triglycerides by 9.8 and 14.1%, respectively, in total cholesterol by 15.4 and 9,8%, respectively, LDL-C – by 11.0 and 12.4%, respectively, and an increase in cholesterol in HDL-C – by 32.0 and 41.8%, respectively (p <0.05). At the same time, the TG level was slightly changed and remains within the normal range in all the studied groups. The data obtained indicate that TG should be determined with reference or slightly increased levels of TG and LDL in patients with type 2 diabetes in patients with DN. In the 1st group of patients, there is a decrease in TG 8,6%, and HDL 38,1% increases. In group 2, the dynamics of TG, HDL was less pronounced: TG decreased 9,2%, HDL increased 11,1%. Thus, it should be emphasized that the first group of patients with type 2 diabetes with CKD G3a achieved a more favorable lipid spectrum in general, TG and HDL parameters were close to the target values in this category of patients. In the second group, patients with type 2 diabetes with CKD G3b also showed a decrease in TG, but less pronounced, the level of HDL was achieved the target values in this category of patients. The lack of significant dynamics of LDL in both groups is possibly due to the lack of special lipid-lowering therapy.
Discussion
Advances in the management of patients with DM in recent years do not reduce the risk of CKD, but provide a delay in its development [4,5]. Along with damage to the mesangial and paramesangial regions of the glomerulus, lipids filtered into the primary urine can also damage the cells of the renal tubules. Lipoproteins deposited in the renal tissue bind negatively charged glycosaminoglycans, there by neutralizing its negative charge and increasing its permeability to proteins [7,8]. Damage to the renal tubules is associated with intense lipid reabsorption and metabolism by nephrocytes, which leads to the release of lysosomal enzymes, cytotoxic effect and subsequent sclerosis. In turn, proteinuria is one of the most studied risk factors for the progression of renal disease [7]. The strategy and therapeutic goals, including those for indicators of lipid metabolism in patients with diabetes, have been determined. In recent years, special attention in diabetology has been paid to inhibitors of the sodium-glucose cotransporter 2 (iSGLT-2). These drugs, in addition to successful glycemic control, have a positive effect on renal function in individuals with type 2 diabetes and CKD [9], they also have positive metabolic effects, but also the ability to correct hemodynamic disorders, reducing intraglomerular hypertension and systemic arterial pressure, which can potentially have a nephroprotective effect. The mechanism of the effect of iSGLT-2 on lipid metabolism is not fully understood, according to the data, a potential mechanism of action of SGLT2 inhibitors may be an increase in the metabolism of LDL, but this fact has been shown in rats [9,10]. So, the main mechanism for reducing the fat content in the liver under the action of iSGLT2 inhibitors is a decrease in de novo lipid synthesis by reducing the level of glycemia and insulin and an increase in beta-oxidation of fatty acids.
Conclusion
Thus, in patients with type 2 diabetes with CKD G3, the combination of metformin and iSGLT-2 a had a positive effect on the main indicators of carbohydrate and lipid metabolism. This combination was more effective in improving lipid metabolism in type 2 diabetes patients with CKD G3a compared with type 2 diabetes patients with CKD G3b.
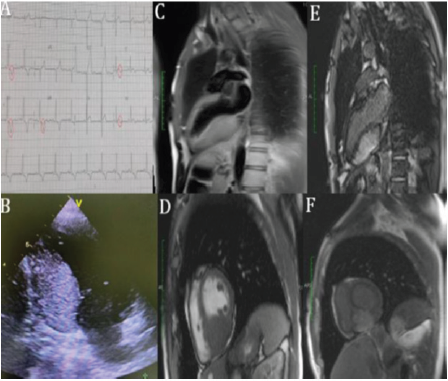
A 37-year-old man without known comorbid conditions or cardiovascular risk factors presented with lipothymia. The neurological and cardiovascular examinations were normal. The brain magnetic resonance imaging was normal. Electrocardiogram (EKG) showed LV hypertrophy with T waves inversion in inferolateral leads (A). 24-hours EKG Holter showed a sinusal rhythm with no further abnormalities. Transthoracic echocardiography (TTE) revealed a left ventricular hypertrophy localized in the inferior wall suggestive of myocardial mass (B) with normal left ventricle ejection fraction. In the subsequent cardiac magnetic resonance (CMR) imaging, a 7.6×2.6 cm mass was found. The mass was well demarcated, lined with normal myocardial tissue, hyperintense on T1 weighted images (C), hypointense on T2 weighted images (D), and showed extensive late gadolinium hyperenhancement (E; F). Those CMR findings were consistent with cardiac fibroma. Despite of the known risk for arrhythmias of cardiac fibroma, the decision was made to closely follow this patient without excisional surgery given the normal sinus rhythm, the absence of history of syncope or resuscitated sudden death and the patient preference. Cardiac fibroma is the second most common primary pediatric cardiac tumor after rhabdomyoma. It remains a rare entity, especially in the adult population. Clinical presentation of patients with cardiac fibroma depends on the location and size of the tumor. CMR imaging is an excellent tool for evaluation of patients with suspected cardiac masses as it provides excellent tissue characterization and may give information about the possible etiology of cardiac mass thus foregoing the need for myocardial biopsy (Figure 1).
Figure 1:
a) EKG showing LV hypertrophy (Sokolow index at 39 mm) and T waves inversion in infero-lateral leads b) TTE 2-chamber view showing the myocardial mass in the inferior wall of the left ventricle c) T1-weighted imaging 2-chamber view showing a hyperintense cardiac mass d) T2-weighted imaging short-axis view showing a hypointense cardiac mass. Delayed enhanced imaging (2-chamber view at 2 min) e) Short axis at 10 min f) Showing marked late hyperenhancement of the mass with gadolinium, which is a hallmark of cardiac fibroma.
Predicting Delays in Acute Ischemic Stroke Care with Machine Learning
Introduction
Machine learning with neural networks have demonstrated remarkable success in finding patterns in structured, as well as unstructured data. It has been applied to various aspects of health care including early detection and diagnosis, treatment, as well as outcome prediction and prognosis evaluation [1]. Process optimization is another application of machine learning, as it can find intricate trends from historical data. With 15-year historical data from the stroke thrombolysis program at a tertiary care center, an attempt was made to design a neural network with the aim of predicting team performance, in terms of door to needle time (defined as the time interval from arrival at the hospital to administration of the thrombolytic drug). Such information could be of help to warn of potential delay when a particular patient arrives, and the team armed with this information will be better enabled to pre-empt the delay [2].
Methods
Historical records of acute stroke thrombolysis were available from 2003 – 2018. The data was first split into training, validation sets. Data from 2003 – 201, consisting of 221 cases, was used as the training data, and the last 2 years’ data of 61 cases was used for validation. Identification of feature and target measures. (The inputs parameters fed to a machine learning model are called features, and the output it is trained to optimize on, the target). It has been reported from various centers that the door to needle time in acute ischemic stroke tends to have an inverse relation to duration of stroke at presentation [3], and this was replicated from data in our center as well. Similarly, regression and scatter plots were used to identify that: severity of stroke by NIH Stroke Score (NIHSS) scale, age of the patient in years, time of the day (rounded to the nearest hour) were also showing an association with the door to needle time, though individually the effects were weak (Figure 1). Thus, these four features were selected to train the network. The target parameter was the door to needle time, parametrized as above or below 45 minutes, as this was the cut off that showed the best predictive performance. Cases with delay <= 45 minutes were labelled as 0 and others as [1] (Table 1).
Table 1: Features and target.
Neural Network Architecture
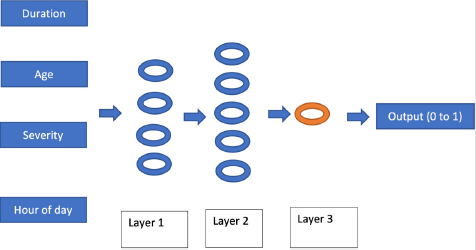
A 3-layered fully connected architecture was used and implemented using the open source Tensor Flow framework [4]. The number of neurons in each layer were 4, 6 and 1, from input to output. The first two layers consisted of rectified linear activation units (Re LU), and the final unit used the sigmoid activation function, to give output in the range of 0 to 1. (Figure 1). The source code of the implementation is available at https://github.com/mlnoone/ nnstroketeamperf/
Training
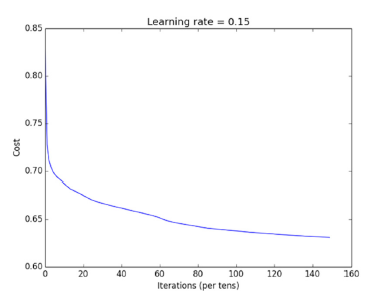
The network was trained using batch gradient descent, with total iterations of 1500. Sigmoid cross entropy cost of the 45 min delay prediction (ranging 0 to 1) vs actual status (0 vs 1) was used as the minimization target. The learning rate was optimized based on performance on the training set and a value of 0.15 achieved the best result as shown in (Figures 2 & 3).
Figure 1: Scatter plots showing the (weak) correlations with door to needle time in minutes (on the vertical axis in all) of duration (A), Age(B), Severity (C) and Hour of day (D)
Figure 2: The neural network architecture.
Figure 3: Plot of cost vs iterations as the network was being trained at a learning rate of 0.15
Hyper Parameter Tuning
Based on performance in the training and the validation sets, the hyper parameters of the network were optimized. Performance on the validation set was assessed using the following parameters: a) Accuracy, defined as percentage of delay > 45 min correctly predicted. b) Sensitivity and positive predictive value (also called recall and precision in machine learning parlance) which were combined into the F1 score, defined as: 2 x precision x recall / (precision + recall). These were then used to select the optimum hyper parameters for the network which, in addition to the learning rate of 0.15, included: a) The number of neurons in each layer as mentioned above was set at 4, 6 and 1 which resulted in optimum performance on the training set (accuracy 60%, precision 68%, recall 71%, F1 0.68). b) L2 Regularization was used to minimize overfitting which was observed initially, a regularization parameter (lambda) of 0.02 was chosen based on observing the result over a range of parameters to minimize error on the validation set.
Results
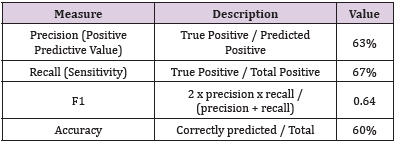
The network after optimization showed precision (positive predictive value) 63%, recall (sensitivity) 67% and F1 0.64 on the validation set, with an overall accuracy of 60% (Table 2).
Table 2: Performance measures on the validation set.
Discussion
Neural networks are capable of extracting intricate patterns from complex data, which are otherwise nearly impossible to delineate. They have been applied with remarkable success in fields like advertising and manufacturing to optimize performance based on structured data. Though the success of neural network with unstructured data like computer vision, speech and language are more widely appreciated, they are also remarkably effective in analyzing structured data. As seen here, with four weakly associated parameters it was possible to develop a reasonable prediction model for stroke team performance with 60% accuracy and 63% positive predictive value. Application of neural network in this context of optimizing acute care based on a predictive model has not so far been reported in literature. With increasing application of care pathways, neural networks could be a natural choice to build predictive models to identify potential for errors and delays.
Pneumothorax Associated with Thoracic Endometriosis: Current Knowledge
Introduction
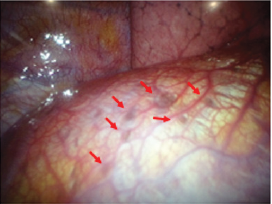
Endometriosis is a condition in which endometrial-like glands and stroma are located outside of the uterine cavity. The ectopic endometrium is encountered most commonly pelvic structures such as ovary, uterine ligaments, pelvic peritoneum, and genital structures [1-4]. The usual site of endometriosis outside of the abdominopelvic cavity is in or around the lung (intrathoracic cavity) (Figure 1). Although endometriosis in general can affect up to 15% of women of reproductive age, thoracic endometriosis remains a very rare condition [5-9]. Thoracic endometriosis produces a broad range of clinical and radiological manifestations, including catamenial pneumothorax (80%), catamenial hemothorax (15%), hemoptysis (5%), and rarely pulmonary nodules [5-9]. The age of onset in patients with thoracic endometriosis (a mean of 35 years) is higher compared to a mean age at presentation of 25 to 30 years in patients with only pelvic endometriosis [5-9]. The exact mechanism of catamenial pneumothorax associated with thoracic endometriosis remains unclear, but several hypotheses have developed to explain this condition.
Figure 1: Endometriosis involving the pleural surface of diaphragm (arrows). The clinical and laboratory findings have been reported previously [32].
Retrograde Menstruation through Diaphragmatic Fenestrations
The endometrial tissue is thought to move through the fallopian tubes to the peritoneal cavity by retrograde menstruation backflow [4]. The endometrial cells in peritoneal fluid may follow clockwise peritoneal circulation and pass through the right paracolic gutter towards the right sub-diaphragmatic region. The phrenicocolic ligament on the left side and falciform ligament form barriers that prevent cells and fluids from reaching the left sub-diaphragmatic area [10,11]. Implantation of endometrial cell leads to the formation of endometriotic nodules on the ventral side of the diaphragm [10]. The nodules cause cyclical necrosis and induce diaphragmatic fragility, leading to the formation of the usual diaphragmatic fenestrations. After endometrial tissue enters the pleural space, it may form colonies in other part of the diaphragm or in the pleural space. Air leaks from vagina may occur during the menstrual cycle when the cervical mucus plug is deleted [10-14]. This hypothesis may be in good agreement with the observation that endometriosis occurs nine times frequently on the right hemidiaphragm than on the left [4,6,14,15].
Coelomic Metaplasia
The second proposes the coelomic metaplasia mechanism that causes endometriosis by metaplasia of mesothelial cells lining the pleura and peritoneal surfaces into endometrial stroma and gland [9,16,17]. Transformation of these cells may be affected by physiological stimuli such as estrogen [18]. Support for this hypothesis is observed in endometriosis patients with Mayer- Rokitansky-Küster-Hauser syndrome who lack a functional endometrium [19,20]. Rare cases of endometriosis can also occur in men receiving high-dose estrogen. The coelomic metaplasia hypothesis provides an explanation for pleural cases of thoracic endometriosis. However, this fails to explain the right-sided predominance seen in patients with thoracic endometriosis.
Prostaglandin
The third is a bioactive substance-mediated mechanism in which high levels of prostaglandins, in particular prostaglandin F2α. Prostaglandins are detectable in the plasma of women during menstruation. Circulating prostaglandins increase with menstruation [21,22-25] and causes vascular and bronchiolar vasoconstriction, leading to the vasospasm and associated ischemia within the lung [23,25,26]. This may result in alveolar rupture of previously formed subpleural blebs and bullae, and subsequent air leaks [23,25-27].
Hematogenous or Lymphatic Metastasis
An interesting hypothesis of metastasis suggests that endometrial transplantation occurs through lymphatic or hematogenous dissemination of endometrial cells, explaining both the thoracic and other sites of implantation, in an analogous manner to cancer metastasis [7,28,29]. Review of autopsy data of humans with thoracic endometriosis shows that patients with bronchopulmonary endometriosis usually have bilateral lesions, whereas diaphragmatic and pleural diseases are predominantly right sides [17]. Perhaps the most compelling evidence for the benign metastasis hypothesis is derived from the investigations of ectopic endometriosis lesions occurring in remote parts of the body including the bone or brain [8,21,30-32].
Comment
Thoracic endometriosis is characterized by the presence of endometrial-like glands and stroma within the lung parenchyma or on the diaphragm and pleural surfaces. It remains unclear how endometrial tissue migrates to the thoracic cavity, but it is often associated with abdominal endometriosis. As none of the theories proposed alone can account for all clinical manifestations of this condition, so the etiology of thoracic endometriosis development is likely multifactorial and closely intertwined with each other hypothesis.
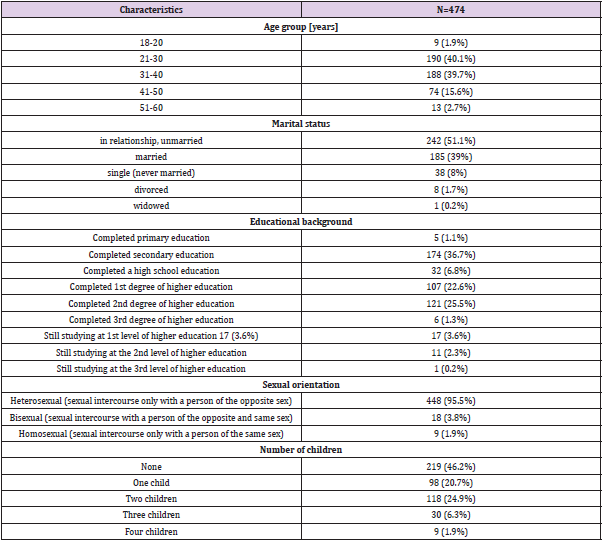
Partnership not only satisfies the basic needs of the individual as a social being, but also contributes to health, positive interpersonal relationships, self-confidence, good self-esteem, and general well-being [1,2]. Sexuality is also crucial for good partnership and an important part of the human life cycle [3-5]. Sexual orientation is a predisposing characteristic of a person who is sexually attracted to persons of the same and/or opposite sex. Sexual orientation refers to the gender to which a person is emotionally, physically, sexually, and romantically attracted. It is primarily assessed through personal evaluation and reporting of whether one is attracted to a man or a woman [6,7]. Engaging in sexual relationships with persons of the same or opposite sex most often determines a person’s sexual orientation. Factors that influence whether a person has sex with a person of the same or opposite sex include availability of a partner, moral relationships, social norms, curiosity, need to fulfill the role of a parent, financial motives, etc. [8]. In sexuality it is necessary to separate the masculine and feminine sides. Men are more pragmatic beings, while women are more tactile beings. Therefore, an embrace is of great importance for a woman’s perception of sexuality, as the release of serotonin, dopamine and oxytocin then increases. A woman, who is otherwise a hyperdynamic being and has all her senses constantly activated, usually closes her eyes when kissing. This activates the depilation of the basic system of the visual sense, with which we reach the maximum information capacity of up to 90% [9]. Therefore, the aim of the study was to assess sexual satisfaction in the general Slovenian population using an adapted but modified questionnaire, which was suitable for identifying differences in sexual satisfaction between different variables.
Methods
The study was conducted on female and male participants via online survey. The online survey began in July 2020 and was completed in September 2020. The research was conducted according to the principles of the Declaration of Helsinki. All participants were informed of the aims and anonymity in writing before the study began. Informed consent was given by clicking the “Proceed with questionnaire” button. The National Ethics Committee approved the study design (No. 0120-200/2020/6). Recruitment was based on the following inclusion conditions: (a) Age of 18 years and older, and (b) Personal consent to the questionnaire. Participants with mental and sexual disorders were also included in the study. All participants were asked for demographic data: gender, age, marital status, education level, sexual orientation, number of children, number of all lifetime sexual partners, number of current sexual partners, number of sexual contacts per month, diagnosed mental and/or gynecological disorders and, for women, the number of archived orgasms during a sexual contact. A validated questionnaire from Stulhofer, et al. [10] was used with some adaptations that allowed the questionnaire to be completed by both sexes. Linguistic validation of the questionnaire was done by translating it from English to Slovenian and vice versa. The Cronbach’s alpha coefficient showed adequate internal consistency (α=0.963) for all statements. Based on the theoretical content relationship, we grouped certain statements into new cushions/variables: My mood before sexual intercourse/activity (α=0.936): • My sexual arousal toward a partner. • Rate your sexual desire toward a partner • My sexual response to a partner • The intensity of my sexual arousal My mood during intercourse/sexual activity (α=0.854): • My emotional engagement during sexual activity. • During sexual activity, I give myself to sexual pleasure • The intensity of my orgasms My partner’s mood during intercourse/sexual activity (α=0.936): • Rate your partner’s sexual activity • My partner gives in to sexual pleasure • The way my partner is responsive to my sexual needs • My partner is sexually creative • My partner is sexually available My balance in sexual intercourse/activities (α=0.857): • Rate the appreciation of the pleasure I give to my partner. • The variety of my sexual activities • The frequency of my sexual activities • The balance between what I give and what I get during sexual activity • And the autonomic variable: • My mood after sexual activity. The modified questionnaire consisted of demographic data and 17 statements. A 5-point Likert scale was used for each statement, ranging from “not at all satisfied” to “extremely satisfied.” Data were analyzed using SPSS 26.0 statistical software. The Kolmogorov-Smirnov test and the Shapiro-Wilk test were applied to determine whether the values had a Gaussian distribution and to choose between parametric and nonparametric statistical tests. The Kolmogorov-Smirnov test and the Shapiro-Wilk test showed a non-normal distribution. Based on this result, a non-parametric statistical analysis was chosen, namely Pearson’s correlation coefficient and χ2 -test. The statistical significance was set at p ≥ 0.05.
Results
A total of 1418 questionnaires were received, of which 474 were fully completed. The realization of the sample was 33.43%. The sample included 405 female (85.4%) and 69 (14.6%) male participants. The basic demographic data are presented in Table 1. Participants were asked about the total number of sexual partners in their lifetime (Table 2). Most had one to two (n=134; 28.3%). Regarding the number of current sexual partners, respondents had one (n=462; 97.5%) or two to three (n=12; 2.5%) sexual partners (Table 2). In addition, the majority of participants had 11 or more (n=98; 20.7%) sexual contacts per month (Table 3). The female representatives were additionally asked about the number of orgasms during sexual intercourse. Most achieved two (n=178; 37.6%), three (n=110; 23.2%), one (n=69; 14.6%), and four or more (n=50; 10.5%) orgasms. Thirty-one (6.5%) participants did not have an orgasm, and 36 (7.6%) responses were missing. Twentysix (5.5%) participants were diagnosed with a mental disorder and 14 (3%) with a gynecological disorder. These individuals were also included in the study as we were interested in finding possible correlations.
Table 1: Demographic data of the participants.
Table 2: Number of sexual partners in their lives and current sexual partners.
Table 3: Number of sexual intercourses per month.
Table 4: Person correlations between the statements.
Note: **. p≤0.01
Based on Pearson correlation coefficient, strong correlations were found between mood before intercourse/activities and mood during intercourse (r=0.837), balance during intercourse/activities (r=0.782), mood after intercourse/activities (r=0.732) and partner’s mood rating during intercourse/activities (r=0.698). There were also correlations between mood during intercourse/activities and mood afterwards (r=0.762), balance during intercourse/activities (r=0.727), and rating of partner’s mood during intercourse/ activities (r=0.590). And between rating partner’s mood during intercourse/activities and balance during intercourse/activities (r=0.848) and mood after intercourse/activities (r=0.571) (Table 4). Female representatives were associated with partner mood and balance within sexual activity (Table 5). Male representatives showed no correlations with any of the cushions. In addition, correlations were found between an age group of 21 to 30 years and mood before, mood during, partner’s mood during, and balance during sexual intercourse/activities (Table 6).
Table 5: Correlation between gender and pillows.
Table 6: Correlation between the age group of 21-30 years and pillows.
Table 7: Correlation between number of children.
Table 8: Frequency distribution between the number of children and satisfaction-dissatisfaction.
Discussion
Although there are quality of life questionnaires that include questions about sexual satisfaction in the context of chronic disease, there is not much evidence of questionnaires that fully capture sexual satisfaction in the general population. Previous analyses included more women and examined the influence of menopause, body image, psychological distress from chronic disease, discomfort with sexual intercourse, and satisfaction with sexual intercourse. However, as far as we know, there is no questionnaire that includes different variables that could also influence men’s sexual satisfaction. Therefore, the aim of this study was to modify the already established questionnaire to more accurately capture the variables that have an impact on sexual satisfaction, in this case in a general Slovenian population. In our analyses, we included the general population of men and women and even individuals with mental and/or gynecological disorders. The questionnaire was adopted from Stulhofer et al. (2009) and modified to fully capture the sexual satisfaction of men and women from our population. Based on the achieved reliability of the questions and results, we believe it can be used as a simple tool for clinicians in daily practise to facilitate communication about sexual satisfaction. Examination of correlations between general parameters such as gender, marital status, number of children, sexual intercourse per month, orgasms per activity and dependent variables for sexual satisfaction such as mood before, during and after intercourse and balance within intercourse showed interesting results. Satisfaction correlated well with mood before, during, and after sexual activity and, more importantly, with balance within intercourse. Important here are the questions that measure balance within sexual activity: ‘rating how much pleasure I give my partner’; ‘variety of my sexual activities’; ‘frequency of my sexual activities’; and ‘balance between what I give and what I receive during sexual activities’. This clearly shows that sexual satisfaction depends on the correlation with the activities of the participants and their partners during sexual intercourse. This was even confirmed by the correlations between female representatives and their partner’s mood (F=18.892; p 0.001) and balance during intercourse itself (F=5.625; p=0.994). In several studies by Basson (2000, 2005, 2015) [11-13], the authors showed that women’s sexual desire is highly dependent on current relationship and partner dynamics, proving that women’s motivation for sexual intercourse does not necessarily arise from sexual desire, but is likely determined by the relationship [14- 17]. In addition, the results of our study proved that previous experience with more sexual partners, higher number of monthly sexual intercourse and orgasms, and younger age were associated with better sexual satisfaction. In addition, participants with more children showed lower sexual satisfaction. Having more children could affect sexual activity and thus sexual satisfaction. Intimacy is an important factor for women with children. The presence of children lowers the level of intimacy as women begin to ignore their sexual arousal because they focus primarily on the children and the family relationship [18,19]. Both were evident in our study, as participants without children were the most satisfied with their sex lives, followed by participants with only one or two children. Satisfaction decreased with the number of children, such that participants with three or four children were the least satisfied with their sex lives. In addition, there were statistically significant correlations between participants who had no children and mood before, during, and after sexual intercourse, partner mood during and after sexual intercourse (both p=0.001), and mood after sexual activity (p=0.013). In addition, Dewitte, et al. [20] showed that the situation of not having children increases sexual activity in women and even decreases the negative effect of sexual desire on sexual activity. Sexual satisfaction was also associated with the age of the participants. Age from 21 to 30 correlated with mood before and during intercourse, mood of partner during intercourse, and balance during intercourse. Increasing age is associated with lower quality of life [21] and therefore could also affect sexual aspects of life, such as number of intercourses per month, number of orgasms, and overall satisfaction. However, there is a contradictory variable that could affect sexual satisfaction. Namely, in our study, the number of sexual partners also showed a correlation with satisfaction. In this case, we would expect older participants to have better sexual satisfaction than younger ones, but this was not the case. One reason for this is the specificity of the questionnaire we used in our study. The questionnaire specifically addressed sexuality and sexual activity rather than overall quality of life. A middle-aged person may have a higher quality of life than a person aged 21 to 30 because their life priorities lie elsewhere. Here we have not come across the financial influences, career, family and social status. These are all factors that significantly affect the quality of life. On the other hand, life experience in sexuality, as people learn more about their sexual preferences or those of their partner over the course of their lives, could also be an interesting influencing factor on sexual satisfaction. This is suggested by the study of Forbes, et al. [21], who found opposite results when examining sexual quality of life with age. They observed a positive relationship between age and sexual quality of life. Accordingly, for older participants, the quality – rather than quantity – of sexual encounters was a more important predictor of higher sexual satisfaction. In our study, we did not specifically measure quality per se, but attempted to estimate quality based on pleasure, number of sexual encounters, and orgasms. This could be the reason why younger participants experience better sexual satisfaction than participants in older age groups. The number of sexual encounters became less influential with age [22]. However, in both reports, age was associated with a decrease in sexual aspects of life. Our modified questionnaire was informative enough, showed good reliabilities of variables of significantly above 0.8, and can potentially be used in daily clinical practice. However, there were limitations in this study. Despite the large sample size, the questionnaire should be validated in further studies to obtain additional information about the reliability of the questions. Also, more comparisons should be made between different parameters such as gender, marital status, and sexual orientation to gain truly meaningful insights into the variables that influence sexual satisfaction. In addition, a larger sample of men should be included in the future, as the results cannot be generalized to the general population due to the predominantly female participants. As this study was designed as a pilot study, we intend to conduct further analysis and gather further insights as we consider the questionnaire to be meaningful enough.
Conclusion
The present study provided the results that previous experience with more sexual partners, higher number of monthly intercourse and orgasms, and younger age were associated with better sexual satisfaction. In addition, participants with more children showed lower sexual satisfaction. In addition, a newly modified questionnaire was used for the first time to assess sexual satisfaction in male and female representatives. The questionnaire was evaluated and can be used in clinical practice to assess the level of satisfaction with sexual life. By measuring sexual satisfaction using mood pillow ratings, the questionnaire is a suitable tool for further evaluation and for a larger sample to obtain additional data on factors that might influence sexual satisfaction.
Phase change phenomenon involves instantaneous variations of the local heat transfer, which is coupled to the unsteady fluid currents overlying the surface. An example is the sessile drop, which is of interest in several fields including coating, combustion, and cooling facilities. Understanding of these mechanisms requires fine spatial and temporal measurements, which is essential for applications associated with design optimization and safety consideration of a process. Such consideration is crucial within the operations of boilers, for instance, where the evolved heat flux is restricted by the boiling crisis. This operational regime is often associated with equipment failure. Within the miniaturized electronics applications such as transistors, high heat fluxes up to 200 W/cm2 can be liberated from such instruments, where a low wall superheat is desired with respect to the cooling fluid. Thus, operating within the correct boiling regime becomes paramount in the thermal management of the operating equipment [1-4]. In addition, some of the proposed models are not well validated due to the limited resolution of the available data, which might bring about a misinterpretation of the phase change phenomenon under study. Such situations can be encountered with respect to models based on point measurements, which cannot resolve fine spatial resolutions associated with phase change phenomenon [5-6]. In the current paper, some of the relevant temperature measurement techniques are provided, which include point measurement techniques and IR thermography. A review of fluorescing materials and their usage within temperature measurement applications are given by the end of the paper.
Point Measurements
A conventional point measurement technique is the thermocouple, which operates on the basis of Seebeck effect. In principle, two dissimilar metals are connected at a junction, which generates a small voltage with respect to a given temperature. Such technique was used to acquire average heat flux measurement over a surface of interest [6]. In parallel to this technique, Truong [7] considered using a heat fluxmeter, so as to evaluate the heat transfer coefficient associated with a heat sink, via Newton’s law of cooling. The drawback of such methods is that its usage is limited to quasi-steady state regime, which cannot be used for complex flow phenomena, due to multidimensionality and the instantaneous local changes of the fluid-wall interaction [6-7]. In case of the heat fluxmeter, significant measurement error can incur, in case the thermal properties of the instrument was not well quantified [7].
Resistive Based Sensors
In the past decades, thermal resistance-based sensors has been the focus of wide of variety of applications. These include thermal actuator, flow rate and temperature measuring devices, and sensors pertaining to gas monitoring within food logistics [8-10]. Several studies focused on developing high compact microheater sensors, with competitive spatial resolution performance. Such advances were permitted with development of microfabrication, which enable one to realize fine features as small as a submicron length. Such sensors can play a crucial role in detailed examination of adverse flow condition, as in phase change application for instance, which can be achieved by its instantaneous measurement at multipoint resolution and its conformity to nonplanar surfaces [11-14]. Among the various works on resistive sensors, is the one done by Guereca [15] in the field of microelectromechanical systems, which was used in boiling application. The instrument used in Guereca [15] study was fabricated via ion beam milling and photolithography, which had a dual function of providing heat to surrounding fluid and for temperature measurement purposes. The latter used to measure the nucleation temperature, based on sudden changes in the observed temperature, with respect to the temperature coefficient of the instrument resistance [15]. Figure 1 depicts the microheater array used by Demiray and Kim [16] within FC-72 pool boiling experiment.
Figure 1: Micro heater array for pool boiling experiment (left), heat transfer distribution under nucleating bubble at micro heater surface (right) [16].
Some of the major challenges with respect to the sensor’s fabrication regard the dimensional scale difference between the patterned lead connection and the deposited sensor metal, which is one of the main causes for electrical disconnection, due to the sensor’s breakage along the lead’s edges. Such issues are further complicated if an adhesion layer exist between the flexible substrate and the pattern leads. In addition, it is crucial to include a thermal insulation within the metal sensor design, which can affect its performance criteria, such as measurement sensitivity and resolution [11-12,17-19]. Also, some studies have indicated deviation of the material properties from bulk metal value for thicknesses close to the mean free path. For instance, Siegel, et al. [20] observed an inverse relation between resistance and temperature for gold thickness of several nm, as opposed to the proportional correlation between resistance and temperature for bulkier gold thicknesses. Inhomogeneity in the deposited sensor can lead to large temperature gradient on the sensor’s surface, which can affect the integrity of the temperature measurement. For instance, Guereca [15] noticed that the acquired temperature measurement was lower for thinner fabricated resistive sensor. Lastly and not least, such temperature measurement requires direct contact with fluid of interest, and it has an element of Joule’s heating. Thus, there is some form of intrusion upon the investigated phenomenon, which might induce some form of error.
Non-Contact Local Temperature Measurement Techniques
A breakthrough in surface temperature measurement has been achieved recently, via infrared (IR) technology, which permitted local heat flux measurements at fine spatial resolution. Such technique proved to be of an essence in proper understanding of heat transfer mechanism, and to further elaborate existing models and correlations.
Infrared Thermography
Several studies utilized Infrared (IR) technique in order to resolve the local wall heat transfer in both pool and flow boiling applications. An example is the study conducted by Scammell and Kim [21], where they examined the effect of vortex shedding upon the local wall heat transfer in flow boiling applications. A schematic of the flow boiling test section is shown in Figure 2. The IR measurements in such studies are based on black coating of the wall surface, adjacent to the working fluid, which acted as temperature markers for the IR camera. The temperature profile across the wall was deduced numerically, in a coupled radiationconduction problem from which the local heat flux profile was resolved [21].
Figure 2: Flow boiling test section setup featuring golden mirrors for simultaneous heat transfer measurements and flow visualization (left image), and cross-sectional view of the flow boiling test section (right image) [21].
Some of the major obstacles associated with IR thermography, pertains to the availability of the IR optical properties, which is required to resolve the temperatures across IR transparent materials, such as silicon and Kapton tape [6,22-24]. Not to mention that IR transparent materials are not easy to machine, such as in the case of CaF2 [25]. In addition, in case there is a sharp temperature gradient, there is a restriction on the minimal number of pixels covering an area, so as to resolve the spatial temperature distribution at a region of interest [22-23]. Jason [23] has also raised an issue pertaining to the integration time with respect to the calibration range, where an error in the order of 10 degrees can incur, in case the measurement was done outside the calibration range.
Time Domain Thermoreflectance
Another non-contact measurement technique is the time domain thermoreflectance (TDTR), which relies on the examining the material reflectance property variation with temperature. A schematic of the TDTR technique is shown in Figure 3. Such approach is applied in order to determine the thermal properties of materials, which is of interest within the development of new materials, including nanomaterials and thin films. In a study by Mehrvand and Putnam [24], the heat transfer coefficient at the thermal boundary layer within a flowing fluid was examined using TDTR technique. One of the advantages of the TDTR techniques is its spatial resolution relative to IR thermography, due to its use of visible light. On the other hand, TDTR requires a complex setup, which involves various optical equipment and probing instrumentations. Therefore, its generally not applicable to the complex geometries that can arise in boiling heat transfer application.
Figure 3: TDTR setup for material thermo conductivity measurement (ww.nist.gov/programs-projects/measurements- and-standards-thermoelectric-materilas).
Fluorescing Measurement Techniques
The following subsections summarizes the measurement techniques that utilizes photoluminescent materials, such as liquid crystals and quantum dot. Such measurement approach relies on the spectral emission variation of such materials temperature, which can give a fine spatial resolution of the surface measurement.
Liquid Crystals
Thermographic techniques based on liquid crystals and fluorophores has been suggested as a temperature indicator. One such an attempt is the work done by Kenning [26], where he examined the wall temperature profile within nucleate boiling application, via a thermochromic liquid crystal. However, such techniques can involve tedious calibration procedures and limitations associated with equipment availability and operating costs [27-30]. Not to mention, the narrow temperature operating range by liquid crystal technique [25].
Quantum Dots
Quantum dots (QDs) are semiconductors whose length scale is in the order of nanometers and thus subject to 3D confinement. QDs have unique optical properties relative to traditional fluorophores in which it can be excited by a wide range of wavelengths. In addition, it emits light over a narrow spectrum at a longer wavelength, which can easily be captured using a long pass filter. Solid-state lamps in the form of LEDs are usually used for QD excitation purposes. As a direct consequence of the QD length scale, the color of the emitted light can be tuned by changing the QD size via temperature and synthesis time control of the fabrication process. Examples of QDs spectrum emission variation is shown in Figure 4. QDs are prepared in a colloidal liquid, and it can easily be transferred to surfaces of interest via spray or spin coating. Such versatile fabrication processes can greatly downsize the expenses, pertaining to facility complexity [31-38]. Other QDs delivery methods include electrostatic coating, UV curable solutions, as well as sol-gel approach [38-42]. According to the airy diffraction theory, the minimum spatial resolution that can be detected by a camera (x) is related to the observed wavelength (λ) by Equation 1. In Equation 1, f is the distance between the lens and object and d is diameter of the aperture. Thus, QD has a spatial resolution advantage over IR thermography, where local heat flux measurements can be acquired at submicron ranges, due to its smaller wavelength emission [43].
xf =1.22λd (1)
Figure 4: QD, (left) emission from dots of increasing size from left to right (Wikipedia.org/wiki/quantum_dot).(right)Spectral characterization of QD.
Another characteristic of QDs is the temperature dependency of their optical properties as shown in Figure 5, which can be exploited for temperature measurement purposes. This can be related to stoke shift behavior of QDs, which is related to the photoluminescence peak shift, as was observed in previous studies [33,37,44-46]. The temperature variation alters the QD optical properties due to thermal expansion of the QD structural lattice [30,36]. Two trends are evident. The intensity of the emitted light tends to decrease with temperature and the peak in the emitted spectrum tends to shift to longer wavelengths. The changes in the intensity and peak wavelength spectra are not necessarily proportional with temperature. The emitted light intensity changes with temperature tend to be quadratic, which makes it less precise than spectral measurement over large temperature ranges [37,45].
Figure 5: Quantum dot optical property variation with temperature [44].
Relative Intensity 1.00 0.80 0.60 0.40 0.20 0.00 360 410 460 510 560 610 660 710 760 Wavelength (nm) Several studies have used QDs to measure temperature. Al Hashimi and Kim [47] investigated the local heat flux distribution arising from the vaporization of an ethanol drop, where QDs dispersed within a gelatin film were used to acquire surface temperature variation underlying the ethanol drop. The experimental setup for the ethanol drops temperature measurement is given in Figure 6. Matsuda, et al. [31] used ZnSAgInS 2 QDs for surface temperature measurement due to their low toxicity and high temperature sensitivity. Jorge, et al. [33] achieved independency from the excitation source intensity by using multiple QDs with different emission spectra and looking at the intensity ratio. Sakaue, et al. [34] developed a QD temperature sensor for cryogenic application. Li, et al. [44] examined the temperature profile of a micro-heater by calibrating the spectral shift of QDs with temperature. They emphasized the importance of QDs particle concentration on a surface so as to achieve a certain temperature precision as a result of particle size variation [44].
Figure 6: Ethanol drop experimental, (left) test setup, (right)QD-gelatin film.
The average temperature precision was enhanced at a higher number of QD particles, according to Li et al. [44]. Wang et al. [39] developed a miniaturized temperature sensor in the form of a reflective fiber for high temperature applications. In a similar line of work to Wang et al. [39], Bueno et al. [37] developed a photonic planar waveguide temperature sensor using nanocomposites of CdTe and CdSe, which were embedded in PMMA. QDs-PMMA nanocomposites have a peak spectral emission at a shorter wavelength than colloidal solutions of QDs, due to the particles agglomeration and waveguide effects introduced by PMMA matrix. In addition, PMMA tends to be hydrophobic, which minimizes the effect of humidity upon temperature measurement [37]. One of the issues pertaining to QDs can be related to the photobleaching degradation of the emission, which is associated with the breakdown of QDs as a result of continuous light excitation. Other issues pertain to the temperature calibration, which is sensitive to the observed noise in the QD emission readings. Such issues can be remediated by utilizing a high quantum yield of QDs, or photoluminescence emission, and by utilizing CCD cameras instead of CMOS cameras for higher signal to noise ratio [33-34,48-49]. Yu, et al. [45] reported an initial blue shift of the QDs peak spectral emission to shorter wavelengths during the first heating and cooling cycles. Such behavior was resolved by exposing the QDs to several thermal cycles, which resulted in a reproducible spectral peak emission with respect to temperature. Other issues pertain to photooxidation, which can cause an irreversible blue shift due to interaction with surrounding gases [48]. Also, the concentration variation of QDs on a particular area can bring about an uneven intensity distribution, since it’s difficult to control the uniformity of QDs over a surface [38,44].
Temperature Sensitive Paint
Another fluorescing material that works under the same principle as the quantum dots is the temperature sensitive paint (TSP), which comprises of a light emitting luminophores and a binder. As shown in Figure 7, the luminophores gets excited to a higher energy state upon absorption of photons from a short wavelength light source. Afterwards, the excited luminophores undergoes a decay to a lower energy state, where it emits light at a longer wavelength. This process is called photoluminescence. Two conversion processes compete with the photoluminescence of the TSP, which causes the luminophores to decay closer to its ground state: first, the external conversion of the luminophores energy, which is associated with its emitted light quenching via molecular interaction. Such process is relevant within pressure sensitive paint applications, where various oxygen concentrations are associated with different light emission intensity from the luminophores. The second type of the luminophores conversion processes is the internal conversion, which is associated with the energy state variation of luminophore with temperature. Such process is called thermal quenching [25]. The material selection for the luminophores and the binder governs the optical characteristics of the yielded TSP. For instance, the temperature dependency of the luminophore’s light emission varies from one material to another. In addition, the operation of the paint as a temperature sensitive or pressure sensitive paint depends on the binder permeability to oxygen [50]. Recent interest in TSP has emerged in several applications, as a local temperature measurement mean.
Figure 7: Jablonsky energy-level diagram [25].
One of those attempts is the work by Al Hashimi, et al. [51], where Ruthenium based TSP was used to measure the local heat flux distribution within both pool boiling and flow boiling application. Figures 8 & 9 illustrate the test section set up within the pool boiling experiment, where the local heat flux distribution was acquired using the inverse heat conduction problem. The temperature measurement across the adhesive layer was used as boundary conductions for the heat conduction problem, where the heat evolved to the boiling fluid was evaluated as the difference between the heat generated at the NiCr heater and the heat lost to the Sapphire substrate. In Shibuya, et al. [52] study, local temperature variation was captured in form of TSP intensity changes, as a consequence of a passing bubble. Several studies utilized TSP optical properties for surface temperature measurement within wind tunnel facilities some of which were involved in hypersonic flow conditions.
Figure 8: Schematic of the test section.
Figure 9: Depiction of the germanium dot and NiCr heater.
Among the various wind tunnel experiments are the work by Kurits [53], Bhandari [54], Lee, et al. [50], Schramm, et al. [55], Huang [56], Yang, et al. [57] and Ozawa et al. [58], where the local temperature distributions were deduced from surface of interest, based on the observed TSP emission. In more recent study by Liu and Risius [59], TSP is used for thermal imaging purposes within high-enthalpy shock tunnel application. Within Liu and Risius study, a reliable heat flux sensor was used in conjunction with an in-situ calibration technique, so as to determine the thermal penetration within the TSP layer, via an analytical inverse solution [59]. Long [60] utilized multiple luminophores one of which is temperature insensitive, so as to account for the intensity variation within the excitation light source. In a study by Huang, et al. [61] examined the temperature profile within a microchannel flow application, via the optical properties of the TSP. Simultaneous flow visualization and thermal profiling was achieved by Matsuda, et al. [62] for a multiphase flow phenomenon, within microchannel applications. In Matsuda study, TSP was used to survey the temperature profile at various flow boiling conditions, where the acquired Nusselt number was in good agreement with the Sieder- Tate equation [62]. Other work by Ishii and Fumoto [63] utilized TSP in order to acquire temperature distribution at the evaporator wall of a pulsating heat pipe. From the temperature data analysis, a correlation was acquired between the temperature distribution and the observed oscillatory flow phenomenon within the pipe. In addition, a temperature accuracy of 0.263°C was reported within Ishii and Fumoto study [63].
Recent interest in luminophores utilization was found in other applications, such as its usage as PSP. Examples are the studies carried out by Jiao, et al. [64,66,67]. In Jiao, et al. [64] study, a twodimensional correction factor was adopted in the data analysis, so as to resolve the temperature sensitivity of the PSP. Such result was validated against CFD data. In another study by Noda, et al. [66], PSP was used to resolve the transient pressure field on a NACA 0012 airfoil. Other applications for PSP include jet impingement, such as the study carried out by Li, et al. [67], where it was used to examine the pressure field characteristics near the impingement point, such as the nozzle-plate distance, impingement angle, and pressure ratio. The luminophores suffer from similar shortcomings as the quantum dots. For instance, paint thickness inhomogeneities over the surface as well as non-uniform excitation light illumination are among several factors attributed to the observed noise within optical measurements. Background noise and particulates can also interfere with the optical properties of the TSP, which can bring about a shift in the observed intensities. Photobleaching effect tends to be more severe in the case of TSP [68]. In a recent study by Liu et al [69], the temperature dependency of the thermal diffusivity parameter was addressed within the TSP heat flux measurement, which can arise within hypersonic wind tunnel applications. A correction factor was developed within Liu et al study, which was validated against simulation data [69]. Other issues pertaining to the error arising from the TSP apparent temperature relative to the actual wall temperature, as was suggested in a study by Liu, et al. [70]. Such discrepancy becomes more prominent as the thickness of the TSP layer increases, relative to adjacent layers [70].
Conclusion
In the current review paper, various temperature measurement techniques were examined, along with their applications in various research works. Conventional temperature measurement techniques include thermocouple and microheater arrays, where thermocouples can misrepresent the local interaction at the measurement surface, due to its spatial limitation by its average measurement approach. On the other hand, microheaters are complex to fabricate and are difficult to install on non-flat geometries, such as tubes. In the past decade, IR thermography was adaptedas a measurement technique, which can monitor the temperature distribution at a micron resolution. Therefore, an enhanced measurement fidelity can be achieved with respect to the investigated phenomenon. Some of the drawbacks of the IR technique is its compatibility with the measurement surface, which can be opaque to the IR wavelength or are generally expensive to acquire. Novel temperature measurement approaches involve fluorescing materials, which act as a potential alternative to IR thermography. Such materials include QDs and TSP, which operate within the visible wavelength. Hence, a broader range of materials can be used as a substrate for the experiment, where an affordable monochromic camera can be used for local temperature measurement purposes in various applications, such as pool boiling.
Conflict of Interest
No conflict of interest with any institution/organization.
The COVID-19 pandemic has created an unprecedented need for diagnostic testing. In early 2020, diagnostic manufacturers were still struggling to raise the capacity of the new COVID-19 test to a reasonable level, but due to limited supply and high demand, prices became a challenge to low- and medium-income countries [1]. COVID-19 screening tests are essential in tracking where countries are in terms of COVID-19 and how far they need to act to combat /and manage it. There are two types of tests currently being conducted, namely the COVID-19 Polymerase Chain Reaction (PCR) and Rapid Antigen Tests. The PCR tests whether a person has the virus, whereas the Rapid Antigen tests whether a person has developed antibodies against the virus, assuming they have previously contracted the virus and whether their immune system produced antibodies in response to the infection. In South Africa, a COVID-19 test is accessible in a public sector setting; however, in a private setting, the RT-PCR tests cost R850 and results are available within 24 hours. Rapid Antigen Tests cost R400 providing results within 15-30 minutes [2]. The CMS alleged that laboratory prices for COVID-19-tests were exorbitant and unjustifiable at R850 per test. As of 12th December 2021, the cost of the RT-PCR test had been revised to not more than R500. The reduction of 41% decline followed a complaint by the Council for Medical Schemes (CMS) to the Competition Commissioner that private laboratories were [3]. A COVID-19 test can be taken at a doctor’s room, in a laboratory with a medical prescription, a pharmacy, a screening centre, or even a hospital setting. The test is costly when it is carried out in private laboratories and the price varies per laboratory. The intervention by the CMS, which led to a price reduction, has been widely welcomed in the private sector. It has also been accepted as a victory for patients utilising private laboratories, especially those patients would require more frequent testing as the variants emerge ad mutate differently. Real-time- PCR is the most accurate diagnostic test for COVID-19, as it is more reliable than a rapid antigen test because of its high sensitivity and specificity to the virus. The PCR tests, which require a small saliva sample, have a sensitivity of 94% and specificity of 100%. In contrast, Antigen tests, which detect viral surface proteins, can provide a rapid and accurate indication of active infection, and provide a sensitivity of 97·1% and specificity of 98·5% [1,4]. Disparities in the price of a COVID-19 test vary by country, as shown in Table 1. COVID-19 as global pandemic has affected all countries across the globe, the recent new variant omicron has servery affected countries such as Europe a depicted in figure 1. Testing and tracing are one of the main strategies used to screen patients infected by the virus. A pandemic such as COVID-19 is financed mainly by governments through national budgets allocated to the ministries of health. Public sector testing is free of charge. However, should patients choose to test in a private setting or laboratory, there are costs associated. As of 11 December, the National Institute for Communicable Diseases (NICD) reported a total of 20 176 391 COVID-19 tests that have been conducted , with the private sector accounting for 54% of all tests conducted [5-14].
Figure 1: Daily new confirmed COVID-19 cases per million people [14].
Table 1: Comparison Analysis country’s PCR test prices.
Conclusion
This editorial showed varying costs associated with COVID-19 tests depending on the setting, geographic region, and country. High extremal values of COVID-19 tests costs in other countries indicate an urgent need to regulate prices associated with a COVID-19 test. The case study of CMS in South Africa is essential key learning for other countries on how stakeholders and consumers can intervene of fair practice, competition, product, and services relating to the pandemic can be scrutinised for fairness. This editorial further calls for transparency in all input’s costs associated with COVID-19 tests. This is to ensure that the private sector does not unduly benefit or employ profit driven approaches or practices during a pandemic such as COVID-19. Lastly, the review of costs associated with COVID-19 tests should be a function of an ever-changing environment coupled with increased demand for the product or service and the emergence of new variants which may well require patients more frequents testing.