Biomedical Journal of Scientific & Technical Research (BJSTR) is a multidisciplinary, scholarly Open Access publisher focused on Genetic, Biomedical and Remedial missions in relation with Technical Knowledge as well.
Dental and Oral Health Care Coverage for Seniors in the United States
Introduction
Oral health is a key component of general health. Estimated prevalence of oral health problems is a staggering 50% worldwide [1]. In addition, diseases of the mouth have been associated with serious chronic diseases, especially among elderly adults [2]. In the US, federal legislators are currently debating proposals to expand Medicare, the public insurance for adults over age 65, to provide dental, vision and hearing benefits. However, these proposals raise both cost and feasibility concerns. Interim steps can be undertaken now to facilitate planning for providing dental benefits to seniors in public insurance schemes.
Health Impact of Oral Disease
Chronic diseases correlated with poor oral health range from diabetes and heart disease to arthritis, and mouth pain interferes with eating which, in turn, causes nutritional deficits that impact overall health [2]. Also, tooth loss is disfiguring, with mental health sequelae, such as shame, isolation and loss of self-esteem. All these problems are more common and more severe among older individuals, especially those with disabilities and among racial/ ethnic minorities or low socioeconomic groups. Assessing the true extent of the problem is hampered by a lack of outcome measure standardization and reliability [3]. This knowledge gap creates an evidence vacuum, likely to be filled by political agendas and shortterm cost considerations.
Current Policy Debate
The Build Back Better Act of 2021 includes vision, hearing and dental benefits for seniors as part of a $3.5 Trillion spending bill for health and other topics. By September 16, the proposal had passed in two committees of the House of Representatives that are on the pathway to a full House vote. Unresolved issues include the fact that many low-income seniors are covered by Medicaid, instead of Medicare, and some states have not extended Medicaid dental coverage to all eligible residents. In addition, the Congressional Budget Office estimated that the cost of providing dental benefits would be higher than the costs for vision and hearing services ($238 Billion over 10 years for oral health for seniors, versus $30 billion for vision care and $89 Billion for hearing benefits). This led to provisions that phase-in coverage for dental treatment beginning in 2028. Additionally, debate between public health advocates for seniors and representatives of private practice dentistry center on whether patients and providers would actually participate in a public system, and about the feasibility of new government regulations [4,5]. One example of a regulatory barrier is that medical practice is reimbursed via diagnostic codes, but dental practices are typically reimbursed via treatment codes.
Interim Policy Options
If it is not possible to provide oral health benefits for all seniors now, then demonstration projects could focus on what works for seniors and private practice dentists. This applied research could be overseen collaboratively by health agencies and the US Small Business Administration. The projects should research the impact of various payment models (e.g., fee-for-service vs. Valuebased care) among small dental businesses in major regions of the country. Primary outcome measures would be cost efficiency, cost effectiveness and participation rates of both seniors and dental providers. Secondary study aims might be reliability of treatment outcome measures for dental function, esthetics, disease, and comfort, especially in high-risk seniors and those with disabilities.
Conclusion
US seniors have an urgent need for dental and oral health care. The minimum policy response would be research conducted now to pave the way for a workable system of dental coverage by 2028. Given the increasingly clear connection between oral health and overall health, some of these projects should be cost-effectiveness studies with both oral and general health outcomes. Investments in oral health today may not only save money on overall health costs in the long run, but improve the quality of life, and may even save the lives of seniors.
Predictors of Mortality Among Children Co-Infected with Tuberculosis and Human Immunodeficiency Virus in Region, North Ethiopia, Retrospective Follow- Up Study
Tuberculosis (TB) and human immunodeficiency virus (HIV) co-infection remain a major global and national health problem that requires substantial action to achieve the Sustainable Development Goals (SDG) and the END-TB strategies [1]. Both TB and HIV are the leading causes of death from infectious diseases worldwide [2]. Mycobacterium tuberculosis and HIV co-infection in the human body, potentiate each other and accelerate to death by deteriorating body immunity causing premature death if untreated [3]. Tuberculosis is a major cause of morbidity and mortality in HIV-infected children [4]. In 2015, the World Health Organization (WHO) report showed that nearly 41,000 children died from TB and HIV co-infection. Of which more than 83% were occurred in Africa [5]. Mortality among children co-infected with TB and HIV varied in different settings and fluctuated widely from 6.2% to 36.5% [5-7]. In Ethiopia, mortality of children co-infected with TB and HIV was 14% [8] and co-infected children had six times greater death than TB disease alone [9]. Furthermore, more than 1 in 5 TB and HIV coinfected individuals were died [10], but this huge problem was not specifically known in children. The prevalence of TB and HIV co-infection in children was under-assured due to the problem of reaching a definitive diagnosis. However, the WHO report showed that HIV prevalence among children with active TB disease ranges from 10 to 60%, depending on the background rates of HIV infection in countries with moderate to high prevalence of TB [11]. The estimated rates of tuberculosis among HIV positive children also had a wide variation, depending on the TB epidemic and the coverage of highly active antiretroviral treatment (HAART) coverage in the area [4]. Data on the survival of TB and HIV co-infection in children are still lacking and the available information is difficult to interpret due to problems with the diagnosis and selection of study populations [4]. In developing countries, including Ethiopia, the management of TB and HIV co-infection in children is very challenging due to the inaccessibility of appropriate formulations of drugs, drug-drug interactions, pill burdens, drug side effects, and poor drug adherence [12-14]. This may result in high TB incidence and mortality among HIV-positive children. TB is not only the most commonly reported opportunistic infection [15], but also a major cause of hospital admission and death in HIV infected children [16]. The cause of death is also multifactorial and determined by socio demographic, clinical, laboratory, drug and follow-up related factors [8]. Which are poorly understood. Therefore, studies on mortality and its predictors in TB and HIV co-infection in children are very significant to designate appropriate action according to their ages. Most of the studies on TB-HIV co-infection focused on adult, fewer studies on general co-infected population, little is known in pediatrics sub-age group. Still, the problem in children is masked and actions are taken based on findings from studies in the adult population. However, the problem is very alarming in children due to immature immune system and fast deterioration into death [17,18]. A previous study in the comprehensive specialized hospital of Gondar University in Ethiopia lacks a time specification on the TB and HIV co-infection period, rather they prolonged their follow-up after TB was cured. This makes the study more biased. To some extent, there is better evidence on the incidence and predictors of tuberculosis in HIV-infected children [19,20], but evidence on survival and mortality after co-infection is limited in Ethiopia. Therefore, survival and predictors of mortality among children co-infected with TB and HIV have not been well documented in Ethiopia. Therefore, this study was to try to fill the above gaps by estimating survival and identifying predictors of mortality among children co-infected with TB / HIV in public general hospitals in Mekelle and the southern zone of Tigray region, northern Ethiopia.
Methods
Study Design, Setting, and Period
A retrospective hospital follow-up study was conducted in two zones of the Tigray Region (Mekelle and Southern), which is located in the northern part of Ethiopia by reviewing 10 years (2008- 2018) medical records of children co-infected with TB and HIV in 2019. About 1,179,687 populations lived in these two zones. Of which 515,524 were children [21]. The study was conducted from October 1,2018 to June 30, 2019 in three selected general hospitals (Mekelle, Alamata, and Maychew).
Population and Sampling
Source Population
All children infected with TB and HIV co-infected under 15 years of age who received follow-up care from January 1 / 2008 to December 30/2018 in the ant-retroviral treatment (ART) clinic at public general hospitals of the Mekelle and southern zone of the Tigray region, North Ethiopia.
Study Population
All children co-infected with TB and HIV, under 15 years of age and those who followed up from January 1 / 2008 to December 30/2018 in the ART care clinic of selected hospitals in the study area.
Inclusion and Exclusion Criteria
Children infected with TB-HIV co-infected younger than 15 years were included in this study and had follow-up care from January 1/2008 – December 30/2018 in a selected hospital. Children who had missed key information on clinical, immunological, drug information and their outcomes had not been recorded on medical charts were excluded.
Sampling Technique
In the Mekelle and Sothern zones of the Tigray region, five general hospitals were found to provide ART services. These are the general hospitals of Mekelle, Quiha, Maychew, Alamata, and Korem. However, this study used cluster sampling by randomly selecting three hospitals (Mekelle, Alamata, and Maychew). Since we used cluster sampling, all children co-infected with TB and HIV who were enrolled in selected hospitals in two zones who met the inclusion criteria were included. The medical charts of children with TB and HIV co-infected from 2008 -2018 were reviewed.
Data Collection and Analysis
Data were collected from medical records (charts) using a data extraction checklist developed from the national HIV intake and follow-up form [22]. The checklist consisted of sociodemographic, clinical, and HIV care/ART/ follow-up related information. Data were collected from April 15/2019 to May 20/2019 from medical records. If the child is co-infected with TB and HIV, the follow-up should continue for the entire life (for HIV care) even if the child was cured from TB. After verifying completeness and consistency, the data were coded and entered into Epi-data manager version 4.4.2.1 and then exported to Stata version 14 for analysis. Kaplan–Meier survival graph and Log-rank test were used to compare the survival difference between intragroups of categorical variables. Mortality rate, person-time observation, and mean survival time were calculated by Stata. The Cox proportional hazard model was used for analysis. The Schoenfeld residual test (estat phtest) or global test was used to check the Cox proportional hazard assumption, it was non-significant (Prob>chi2 = 0.4179) indicates the hazard was proportional over time. Regarding multi- collinearity, the mean VIF was 1.39 indicates, collinearity between variables was within the acceptable range. Both bivariate and multivariate analysis was computed to determine the association between predictor variables and the outcome variable. These variables that were significantly associated with a p-value of <0.2 in the bivariate analysis were entered into the multivariate analysis. Variables significantly associated with the outcome variable at a p-value <0.05 in the multivariate analysis were considered independent predictors of mortality. Finally, the adjusted hazard ratio with 95% CI and P value was used to measure the significant association between predictors and outcome variable.
Ethical Considerations
The study protocol was evaluated and approved by the Institutional Review Board (IRB) of Mekelle University, a college of health sciences, and then ethical clearance was obtained. A cooperation letter was written to the chief executive managers of each hospital. Since the study was retrospective and document review, it did not cause any risk to the study participants.
Results
Sociodemographic Characteristics
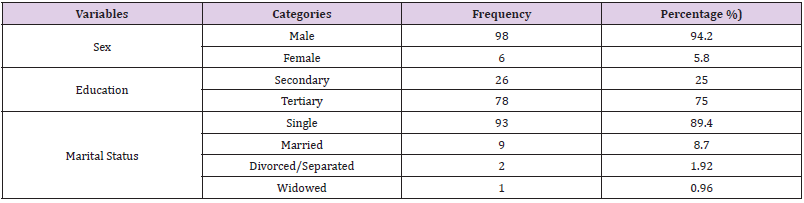
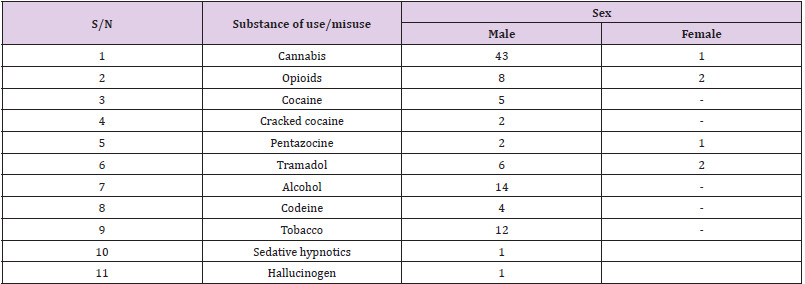
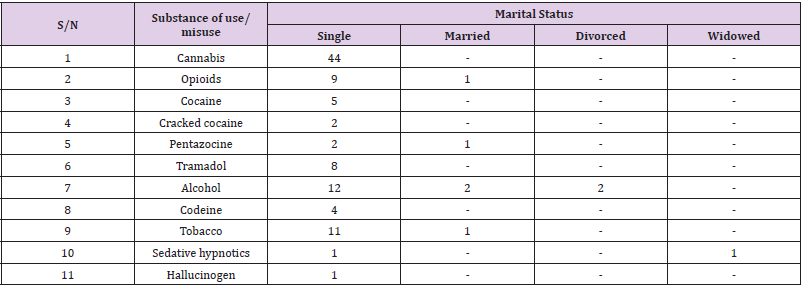
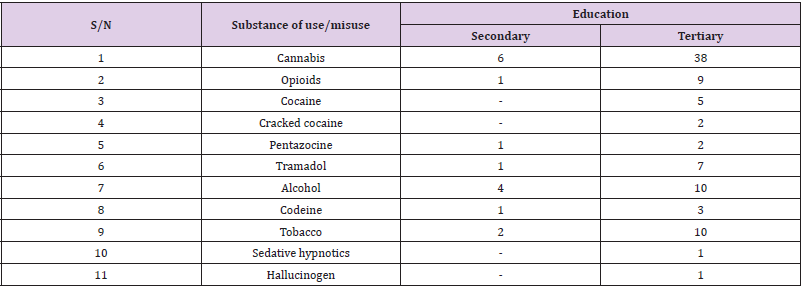
A total of 282 children with co-infected TB and HIV were enrolled in the general hospitals of Mekelle, Alamata, and Maychew. Of which 29 were excluded from the study due to lost cards or incomplete data. The remaining 253 children co-infected with TB and HIV were included in the study. The median age of the study participants was 8 years with IQR (4-13). One hundred and thirtyone (51.8%) of the children were females (Table 1).
Table 1: Sociodemographic characteristics of children co-infected with TB and HIV in general hospitals of two zones of the Tigray region, North Ethiopia, 2019 (n=253).
Clinical and Immunological Related Characteristics
Of a total of 253 children co-infected with TB and HIV, 186 (73.6%) of them developed TB after starting ART. At baseline, 165 (65.2%) of the children co-infected with TB and HIV had WHO stage III, and 129 (51%) had a CD4 count of less than 350 with a median of 330 cells (IQR (176.50-519.50)) cells/μl. During followup, 145 (57.3%) of the children co-infected with TB and HIV had improved their WHO staging to stage I & II. However, 66 (26.2%) of the children had a CD4 count of less than 350 with a median of 540 IQR cells (322.50-840.50) cells/μl. Thirteen (5.2%) of the children had anemia (HGB <10mg/dl) with a median HGB level of 13 (IQR (12-14.4)) mg/dl (Table 2).
Table 2: Clinical and immunological characteristics among children co-infected with TB and HIV in general hospitals of two zones of the Tigray region, North Ethiopia, 2019 (n=253).
Education and Follow-Up Related Characteristics
One hundred and ninety-seven (77.9%) of the respondents had taken co-trimoxazole preventive therapy and 145 (57.3%) had also taken isoniazid preventive therapy before developing TB. The initial ART regimen was changed in 59 (23.3%) of the children due to side effects 35 (13.9%), TB 9 (3.6%), treatment failure 13 (5.1%) and other reasons 4 (1.6%) such as drug toxicity. Firstline ART treatment failure was observed in 13 (5.1%) children. Of these, 10 (76.9%) of them initiated second-line ART regimens. Regarding ART adherence, 211 (88.4%) of the children had good ART adherence (Table 3).
Table 3: Medication and follow-up related characteristics among children co-infected with TB and HIV in general hospitals of two zones of the Tigray region, North Ethiopia, 2019 (n=253).
The Mortality Rate Among Children Co-Infected with TB and HIV
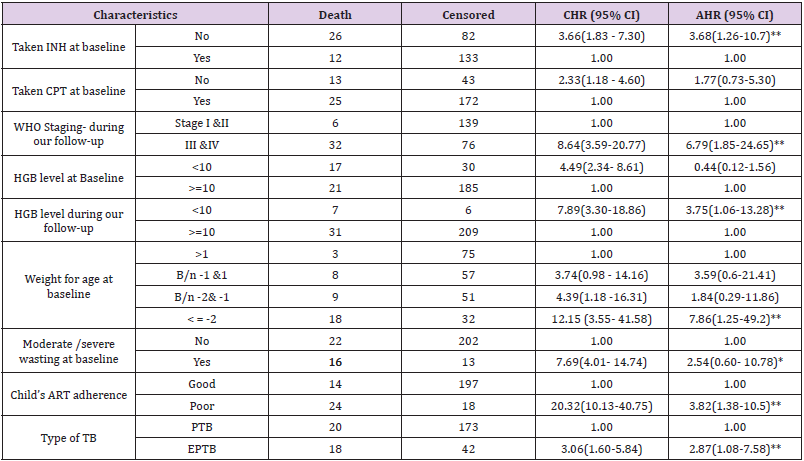
Of a total of 253 children co-infected with TB and HIV included in the study, 38 (15%) deaths and 215 (85%) censored were recorded. Of the censored cases, 186 (73.5%) were alive until the end of the follow-up period, 14 (5.5%) were transferred out, 15 (5.9%) were dropped out of follow-up, and the rest were in TB treatment. Those 253 TB and HIV co-infected children were followed for different periods (1 month to 12 months), which provides 226 child-month observations with a mean survival time of 10.75 (95% CI; 10.37 -11.14) months. In this study, the mortality rate was 0.17 (95% CI 0.12 to 0.23) per 1,000 child-month observations. The majority (73.7%) of the deaths occurred in the first six months of followup period and 15 (40%) occurred during the initial phase of TB treatment. All deaths 38 (15.02%) had occurred during ART. The cumulative probability of survival at the end of 2 months, 6 months, 9 months and 12 months was 94.0 %, 88.0%, 85.0 % and 82.9%, respectively (Figure 1).
Figure 1: Kaplan-Meier cumulative survival estimate of children co-infected with TB and HIV in general hospitals of two zones of the Tigray region, North Ethiopia, 2019.
Predictors of Mortality Among Children Co-Infected with TB and HIV
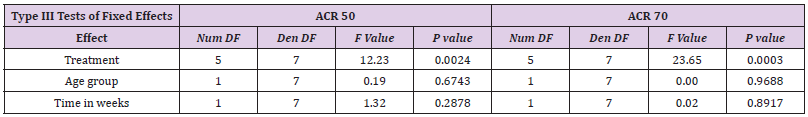
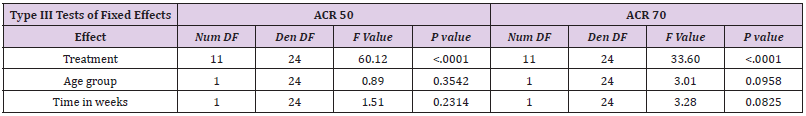
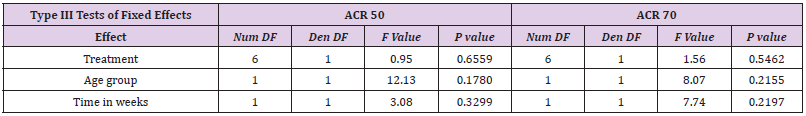
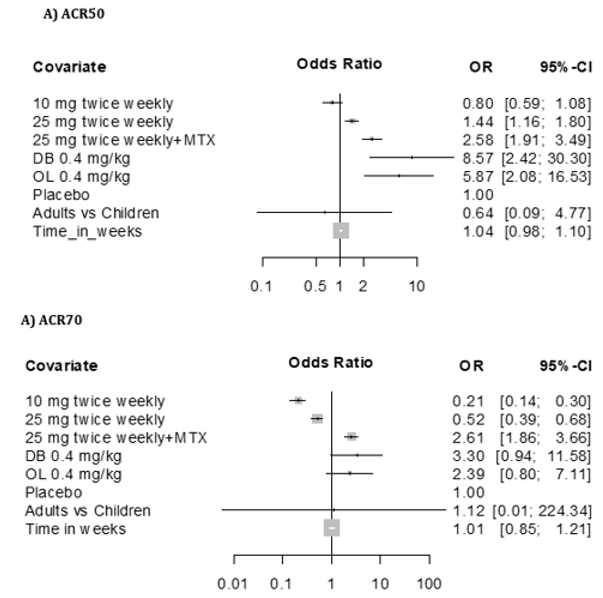
Bivariate and multivariate analyzes were used to assess the significant association between exposure variables and the outcome variable. Underweight at baseline, moderate / severe wasting at baseline, IPT, CPT, baseline hemoglobin level, level of adherence to ART, type of tuberculosis, WHO staging during follow-up, and hemoglobin level during follow-up were statistically significant at 0.2 level of significance in bivariate analysis. In multivariate analysis; underweight at baseline, IPT user/not/, ART adherence level, type of TB, WHO staging during follow-up, and hemoglobin level during follow-up were statistically significant at 0.05 significance level (Table 4). The risk of death among children with TB and HIV co-infected with underweight was approximately 8 times higher than children with normal weight at baseline (AHR=7.9 (95% CI 1.26, 49.3)). Children who did not take IPT were approximately 4 times more likely to experience death than children who had taken IPT (AHR=3.69 (95% CI=1.26, 10.8)). The risk of child death with poor adherence to ART was approximately 4 times higher than children with good adherence to ART (AHR = 3.82 (95% CI: 1.38, 10.54)). The risk of death among children infected with extrapulmonary TB was also approximately 3 times higher than infected children with pulmonary TB (AHR = 2.9 (95% CI: 1.1, 7.6)). During follow-up, children with advanced WHO staging (III & IV) were approximately 7 times higher risk of death than children with stage I and II (AHR=6.79 (95% CI= 1.85, 24.9)). Anemic children were approximately four times more likely to experience death compared to nonanemic children during follow-up (AHR=3.76 (95% CI= 1.06, 13.27)).
Table 4: Results of the bivariate and multivariate analysis among children infected with TB and HIV in general hospitals of two zones of the Tigray region, North Ethiopia, 2019(n=253).
Discussion
The study provides information on the overwhelming problem of high mortality and associated predictors among children with TB and HIV coinfected. The mortality rate in this study was 0.17 (95% CI 0.12–0.23) per 1000 child-month observations. The result was lower than the mortality rate reported from a single study conducted in four developing countries (Burkina Faso, Cambodia, Cameroon and Vietnam), which is 0.370 per 1000 child- month observations [23]. The difference may depend on the sample size difference used by the studies. In this study, mortality was higher in underweight children at baseline. A similar finding was reported from a study conducted in Thailand [24]. This might be the effect of underweight on reducing body metabolic processes resulting in inadequate energy acquisition that increases disease progression, which may end up in death. Furthermore, inadequate weight gain in TB treatment indicates a poor response to treatment [25]. However, stunting and wasting were not significant in this study. This could be due to a higher proportion (90%) of children diagnosed with malnutrition in this study who received treatment for malnutrition. The study also revealed that children who did not take IPT were three times more likely to experience death than children who did take IPT. This was in line with a study conducted in Gondar, Ethiopia [8]. The possible reason might be that IPT reduces the severity and spread of TB disease. However, CPT was not found to be statistically significant in this study, which was reported as a protective factor for death in a study conducted in Gondar, Ethiopia [8]. This may be because a higher proportion (78%) of our respondents had taken CPT and were unable to make a difference. The number of children who didn’t take CPT and died was too few (5.1%). For better survival, HIV positive children should take both CPT and IPT as preventive prophylaxis. In this study, the risk of death among children infected with extrapulmonary TB was three times higher than that of children infected with pulmonary TB. This result was in line with a study conducted in Gondar, Ethiopia [8]. The reason might be that the easy diagnostic technique for EPTB is not available in most of our clinical settings, resulting in delayed initiation of anti-TB treatment leading to rapid disease progression and easy involvement of vital organs. During follow-up, this study revealed that anemia was associated with higher child death. No previous studies examined anemia during follow-up, but at the beginning of the study, it was identified as a predictor of mortality in studies conducted in Gondar (Ethiopia) and Thailand [8-24]. Higher mortality with anemia may be associated with decreased oxygen and nutrient care capacity of the blood, resulting in inadequate oxygen and nutrient supply to vital organs that become synergistic with TB and HIV [8]. In contrast to other studies in Gondar (Ethiopia) [8], Thailand [24], Nigeria [6], Malawi [26], and a single study in four developing countries [23]; WHO staging, CD4 count, and hemoglobin level at baseline were not significantly associated with mortality in this study. The reason might be that unlike these studies, our study assessed the effect of the variables during follow-up time and at baseline. Most of these variables were significantly associated during follow-up, which shows a better effect on the outcome variable than at baseline. This is one of the strengths of this study. Assessing the effect of these variables during follow-up enables us to overlook the more accurate effects of exposure variables on the outcome variable. The study also considered the time of the event, which enables us to consider the contribution of censored cases.
Limitation of the Study
Since the study was a retrospective review of the chart (secondary data), some variables not documented in the child’s medical records were missed. A further prospective study is needed to address other important issues not addressed by this study.
Conclusion
The mortality rate of children co-infected with TB and HIV in two zones of the Tigray region was high. Most deaths occurred within the first six months of the follow-up period. Underweight at baseline, IPT non-user, poor ART adherence, extrapulmonary TB, advanced WHO staging during follow-up, advanced/severe immunosuppression status during follow-up, and hemoglobin level < 10mg/dl during follow-up were predictors of increased mortality. This study is important for planning and decision making by pointing out gaps to make a successful strategy to combat TB and HIV and related consequences to increase the overall effectiveness of therapy in TB and HIV co-infected infected children.
Isolation and Molecular Characterization of Methicillin – Resistant Staphylococcus Aureus (MRSA) In Hospital Patients
Staphylococci are gram positive bacteria belonging to the Staphylococcaceae family. They are catalase positive, spherical in shape arranged in clusters or tetrads, non-spore-forming, and immobile. Many staphylococci can grow under various conditions, in the presence and absence of oxygen, with another market concentration (10% NaCl) and a temperature between 18 °C and 40 °C. Staphylococci are found mainly on the skin and mucous membranes of mammals, some species have a preferential host such as Staphylococcus hominis in humans, while others such as Staphylococcus aureus, find it in more hosts. S. aureus is present on the skin and mucous membranes in 20-30% of healthy people. Adolescents and adults often carry short-term or persistent S. aureus, approximately 15% of healthy adults are persistent carriers. The adult is colonized by S. aureus for a 30-50%, 20% of the population in a persistent way. There are also conditions such as diabetes, drug addiction, immunodeficiency that support colonization and proliferation and transmission [1-3]. S. aureus is one of the most common and important human pathogens, both in the community and in the hospital. The most common S. aureus infections, defined as staphylococcal, are of the supportive type, affect various organs and systems with a high and variable degree of virulence. Infections affect the skin, cutaneous glands, and subcutaneous soft tissues. There may be localizations in the site of abscesses in various organs, therefore infections in surgical wounds and systemic forms. Other infections are represented by Ritter’s disease or burned skin syndrome, due to the epidermolysin staphylococcus produced. It is a toxin capable of detaching the superficial layers of the skin and by the toxic shock syndrome, TSST-1, also deriving from action of a toxin that involves symptoms such as: fever, hypotension, desquamative erythroderma and organ symptoms [1,4,5]. The main factors that increase susceptibility to infections are the prolonged or inefficient antibiotic or corticosteroid therapies, the use of invasive procedures (vascular and bladder catheterization, tracheal intubation, etc.), prolonged hospitalization and surgical interventions [6,7]. S. aureus is also responsible for food poisoning, due to the multiplication in foods of strains of S. aureus producing toxins resistant to cooking temperatures and the action of digestive proteolytic enzymes [8,9]. S. aureus is provided with a polysaccharide capsule, with phagocytic power, neutralized by specific antibodies. On the cell surface there are proteins that are able to cooperate with those of the host, such as fibronectin and fibrinogen, playing the role of adhesions. Among these, the clumping factor is a protein which, interacting with fibrinogen, forms aggregates that can be highlighted on the slide. Another important surface protein of S. aureus is protein A. This is involved in complement activation, inhibits the phagocytosis of the bacterium by polymorphonuclear leukocytes, invokes hypersensitization and stimulation of lymphocyte production, contributing significantly to increase the virulence of S. aureus [3,10]. Furthermore, S. aureus has always been an absolute protagonist of acquired antibiotic resistance. Of particular importance and interest was the evolution of the resistance of S. aureus to β-lactam antibiotics, characterized by two distinct periods of hospital infections. A first hospital infection, which developed early (around the early fifties of the last century) and rapidly spread all over the world, was sustained by penicillinresistant strains, which became such having acquired the ability to produce penicillinase [11]. The end after 10 years thanks to the advent of new antibiotics (such as penicillinase-resistant penicillin and the first cephalosporin’s), even if the phenotypic and genotypic characteristic of β-lactamase production remained definitively acquired by most of both hospital community. A second hospital infection, still ongoing today, is that sustained by methicillinresistant strains (internationally known with the acronym MRSA, methicillin-resistant S. aureus), that is, competent of resisting methicillin, the progenitor of penicillinase-resistant penicillins [4]. Methicillin is characterized by an acyl group in 6 ‘which sterically prevents attachment to the β-lactam ring, thus preserving its activity even in the presence of β-lactamase [12,13]. Furthermore, MRSA are resistant not only to penicillinaseresistant penicillins but to all β-lactams, and in addition they are characterized by a demonstrated multi-resistance [9,14]. The onset of MRSA has occurred over time in at least three different areas that have seen changes in those involved in infections: hospitalized people, therefore nosocomial infections, people outside the hospital community and animals. The presence of MRSA was reported for the first time as a nosocomial infection (hospital – acquired MRSA, HA -MRSA), affecting hospitalized patients, so much so that up to the 1970s strains of MRSA represented the major cause of hospital infections. The beginning and spread of HAMRSA has been associated with typical risk factors related to the hospital environment and isolates from patients who were MRSA negative at hospital admission or MRSA isolates are still defined as HA-MRSA. Between 1970 and 1990 several HA-MRSA epidemics occurred in the USA and Japan; pandemics followed by some cases in Europe [15-17]. Since the 1990s, invasive MRSA infections of the skin have occurred in patients who are not hospitalized and who did not possess characteristics to be attributable to HA-MRSA strains [18-20]. The S. aureus that affects such infections are called community-acquired MRSA (CA-MRSA). Described for the first time in the United States, they are potentially dangerous even for the “healthy” population, and are, unfortunately, responsible for most of the children’s deaths. It was possible to discriminate between HA-MRSA and CA-MRSA strains thanks to not only phenotypic but above all genotypic characteristics. Most infections caused by CA-MRSA involve skin and soft tissue, and some also produce the toxin PVL [21-24]. S. aureus owes its resistance to methicillin to the presence in the SCCmec cassette of the gene encoding a variant of the penicillin binding protein (PBP) referred to as PBP2a. Beta-lactam antibiotics work by binding PBPs to the wall, inhibiting the synthesis of peptidoglycan, the main component of the bacterial wall, thus causing cell death. The PBP2 variant is unable to bind β-lactams, so the synthesis activity can continue, making the action of these ineffective. It is a form of resistance that develops with the production of a protein like the drug’s target, but not susceptible to it. The mecA gene is regulated by the Mecl repressor and the β-lactam sensitive transmembrane signal transducer, MecRI. In the absence of β-lactam antibiotics, MecI represses the transcription of all the genes of the mec complex, therefore not only mecA, but also MecRI and mecI. MecRI with an autocatalytic cut activates the cytoplasmic metalloprotease domain, which splits the link between Mecl and the operator region of the mecA gene, allowing the transcription and production of PBP2a, in the presence of β-lactam. Therefore, the staphylococcal chromosomal cassette mec (SCCmec) is the main genetic determinant able to discriminate between the two groups of HA and CA-MRSA [11,21,25,26]. SCCmec is a mobile genomic island that encodes various resistance determinants. Currently 8 different types of SCCmec have been described. Types I, II, III and VIII are associated with HA-MRSA. While type IV, V, VI and VII are associated with CA-MRSA, virulent mainly, which mainly affected previously healthy young subjects. Therefore, according to the single clone theory, the cassette would have been introduced only once in S. aureus with horizontal transfer from a species of Staphylococcus, therefore MRSA would have a single precursor, unlike the multiple clone theory which predicts that there have been different events and factors involving different strains of S. aureus [27,28]. Multi-Locus Sequence Typing (MLST) demonstrated that the 5 pandemic clones of MRSA evolved from only two genetically distinct ancestral backgrounds: one dating back to the earliest European MRSA strains and to MSSA strains circulating in Denmark towards the end of the 1950s, and the other, a completely different background, attributable to MRSA strains originally isolated in the USA, Japan and in pediatric patients from different parts of the world [29,30]. The first European MRSA isolates were characterized by belonging to the same phage group, resistance to penicillin, streptomycin, tetracycline (PST) and occasionally to erythromycin (PSTE), by a low MIC (minimum inhibitory concentration) of methicillin (6-25 μg/ml), and a heterogeneous expression of resistance [31,32]. These strains have evolved to the current clone called Iberic, which has acquired additional resistance determinants (some resident on mobile elements, such as plasmid pUB110 and transposon Tn554) and is often resistant to the most common antibiotics except co-trimoxazole. And glycopeptides. The Brazilian and Hungarian clones would also have derived from the first background. The New York / Japan and Pediatric clones would have derived from the second background. The Iberic, Hungarian and New York / Japan clones is sensitive only to co-trimoxazole and glycopeptides. The Brazilian clone is sensitive only to spectinomycin and glycopeptides. The pediatric clone is resistant only to oxacillin, penicillin, gentamicin, and occasionally erythromycin [13,31]. Epidemiologically, the various reports relating to the isolation of Community MRSA strains outline a European reality characterized by a polyclonal character. In Italy, several clones have been described such as ST88, ST30, ST8, ST72 and ST813. On the contrary in the United States, there is the diffusion of a clone called USA300, belonging to the ST8 and USA400 [16,33,34]. The main HA-MRSA clones circulating in the world belong to the clonal complexes CC5, which includes ST5 SCCmec type II (New York / Japan); ST5-IV pediatric, ST228-I (southern German); The CC8 with ST250-I (Archaic clone), ST8-IV (EMRSA-2, -6), ST8-II (Irish), ST239-III (Brazilian / Portuguese), ST247-I (Iberian); The CC22 with ST22-IV (EMRSA-15); CC30 with ST36-II (EMRSA-16); The CC45 with ST45-IV (Berlin) [35,36]. The aim of this work was to characterize the presence of methicillin resistance in Staphylococcus spp. by phenotypic and genotypic methods isolated from hospitalized patients. In addition, an epidemiological-molecular study was performed on some MRSA isolates from various departments, applying MLST, to understand the origin and spread of circulating clones.
Materials and Methods
Bacterial Isolates
Eighty-one Staphylococcus spp. strains were isolated and identified. methicillin resistant from patients at the University Hospital of Sassari, Sardinia, Italy. The strains were isolated respectively from 14 blood cultures, 41 samples from the respiratory tract (bronchus aspirate, sputum, nasal, and pharyngeal swabs); 14 from swabs and wound fluids and 12 from other anatomical sites (skin swabs, urine, other). Biochemical identification and antibiogram were performed on all isolates, using the VITEK 2 automated system (Advance Expert System 4.01 software, Biomerieux, Rome, Italy) before being subjected to molecular investigation.
DNA Extraction
Two methods were used for DNA extraction: simple boiling or boiling prep and the use of the DNeasy Blood & Tissue Kit – (QIAGEN GmbH, QIAGEN Strasse 1, D-40724 Hilden). Boiling prep. Some colonies (4 or 5 colonies) were collected and resuspended in 150μl of sterile double-distilled water and boiled at 100°C for 10 min, to lysate the bacterial wall and obtain the escape of the DNA. Next it was centrifuged at 10000 rpm for 3 min, allowing the separation between the pellet (the bacterial lysate) and the supernatant containing the DNA. One μl of supernatant was used in the PCR reactions. The DNA thus extracted are stored at – 20 °C. The instructions of the DNA producers were followed extraction DNeasy Blood & Tissue Kit (QD). Bacterial strains were grown in liquid Luria Broth medium under stirring at 37 °C overnight. Pellet was obtained from 1.5 ml of bacterial culture by centrifugation at 7500 rpm for 10 min. The bacterial pellet was resuspended in 180μl of enzymatic lysis buffer (20 mM Tris HCl at pH 8.0, 2 mM sodium EDTA, 1.2% Triton X-100, lysozyme, 20mg/ml) and incubated for 30 min at 37 °C. Then Buffer AL is added with 25μl of Proteinase K (100mg/ml) and incubated at 56 °C for 30 min for further lysis. The lysate thus obtained was added with 200μl of ethanol is transferred to the columns provided by the kit and centrifuged at 8000 rpm for 1 min. This is followed by 2 washes with 500μl of washing Buffer (AW2). The DNA was then eluted from the column by adding 100μl of double distilled water and centrifuging at 8000 rpm for 1 min. The DNA thus extracted is stored at -20 °C until use.
Detention of S. aureus using PCR Amplification
Validation of S. aureus species identification was performed by PCR using the species-specific primers [37]. Primers were as follows: Fw, SAU1 5’AGGGTTTGAAGGCGAATGGG 3’; and RV, SAU2 (reverse) 5’CAATTTGTCGGTCGAGTTTGCTG3’. The reaction was carried out in a final volume of 25μl which included 22μl of Platinum® PCR Supermix (Hot start recombinant Taq DNA polymerase, buffer 22 mM Tris-HCl at pH8.4, 55 mM KCl, 1.65 mM MgCl₂, 220μM dNTPs, Invitrogen), 1μl of DNA sample and 1μl of each primer (final 0.5μM concentration). The amplification program consisted of an initial denaturation step at 95 °C for 10 min, 35 cycles of denaturing at 95 °C for 30 sec, annealing at 61 °C for 30 sec and extension at 72°C for 2 min; and a final extension at 72°C for 10 min. PCR products were analysed by electrophoresis on a 1% agarose gel, previously stained with GelRed® Nucleic Acid Gel Stain, 10,000X (Biotium, Inc. Landing Parkway. Fremont, CA), and run at 5 V/cm for 40 min. The molecular marker used was a 100 bp ladder (Invitrogen, Waltham, Massachusetts, USA). The sizes of the PCR products sequenced after PCR were 296 bp amplicon.
Detection of the mecA, mecC (mecALGA251), spa e pvl genes using Multiplex PCR in S. aureus Sample
Was designed a Multiplex PCR for 13 samples identified as S. aureus and 14 invasive CoNS strains, isolated from all blood culture samples, from several departments (intensive care unit, surgery, hematology, pneumology, medical pathology, ENT, nephrology, and dialysis departments) (23,52) to detect the mecA regulatory genes, MecC, spa and pvl genes. Primers: mecA P4, 5´TCCAGATTACAACTTCACCAGG 3´; mecA P7, 5´CCACTTCATATCTTGTAACG 3´; spa- 1113F, 5´ TAAAGACGATCCTTCGGTGAGC 3´; spa-1514R, 5´ CAGCAGTAGTGCCGTTTGCTT 3´, to amplify mecC, mecALGA251 MultiFP, 5´ GAAAAAAAGGCTTAGAACGCCTC 3´; mecALGA251 MultiRP, 5´ GAAGATCTTTTCCGTTTTCAGC 3´; pvl-F, 5´ GCTGGACAAAACTTCTTGGAATAT 3´; pvl-R, 5´ GATAGGACACCAATAAATTCTGGATTG 3´. A 50μl PCR reaction contained final concentration 1 U of Platinum Taq DNA Polymerase (Invitrogen); 0.25 mmol/L of each dNTP (GeneAmp, Applied Biosystems, Warrington, UK); 4 mmol/L of MgCl2; 0.4 μmol/L of each of forward and reverse primers (spa; mecA; mecALGA251; pvl) and 2 μl of DNA template. The amplification program consisted of an initial denaturation step at 94 °C for 5 min, 30 cycles of denaturing at 94 °C for 1 min, annealing at 59°C for 1 min and extension at 72°C for 1 min: and a final extension at 72°C for 10 min. The sizes of the expected PCR products were 162 bp for mecA, 138 bp for mecC, 85 bp for the gene encoding Panton Valentine Leukocidin (pvl) 180-600 bp for spa fragment (the absence of fragment spa indicates that the isolate is not a S. aureus) [37,38].
Multilocus Sequence Typing
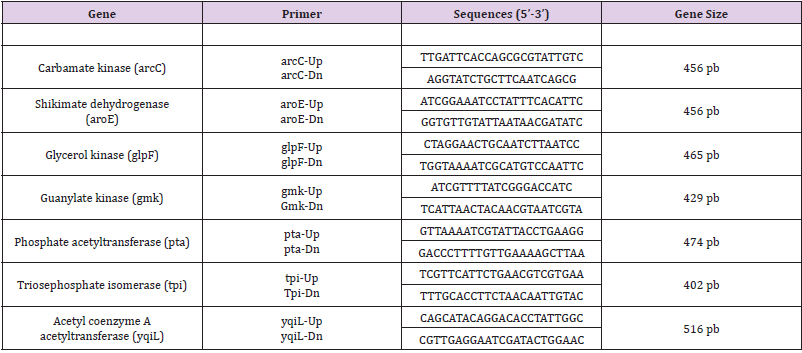
MLST with standard primers introduced by the MLST database was performed on 7 MRSA isolates based on seven housekeeping genes (arcC, aroE, glpF, gmK, pta, tpiA and yqiL) as described by Enright et al. (2000). The following seven housekeeping genes were used in the final MLST scheme, and the fragments were amplified by using the primers shown in (Table 1). PCRs were carried out with 25 μl reaction volumes containing 1 μL of chromosomal DNA (approximately 0.5 mg), 1.25 μL of each primer, 21,5 μl di Platinum® PCR Supermix (Hot start recombinant Taq DNA polymerase, buffer 22 mmol/L Tris-HCl a pH8.4, 55 mmol/L KCl, 1.65 mmol/L MgCl₂, 220 μM dNTP, Invitrogen). The PCR was performed in a PTC-200 DNA engine (MJ Research, Boston, Mass.) with an initial 3 min denaturation at 94°C, followed by 30 cycles of denaturing at 94 °C for 30 sec, annealing at 55 °C for 30 sec and extension at 72°C for 30 sec; and a final extension at 72°C for 5 min. The amplification products were purified with a MinElute 96 UF PCR purification kit (QIAGEN, Venlo, and The Netherlands) and the samples were sent to the sequencing service, Sequencing Service LMU Munich, Germany (http://www.gi.bio.lmu.de/sequencing). Allele numbers and sequence types (STs) were assigned according to the S. aureus MLST website (http://saureus. mlst.net). Trace files of putative novel alleles and the allelic profiles of novel STs were sent to the database for allele or ST number assignment and admission into the database.
Table 1: Sequences of primers used in the Multiplex PCR.
Statistical Analysis
Statistical analysis was performed using Statgraphics Centurion® XV for Windows.
Results
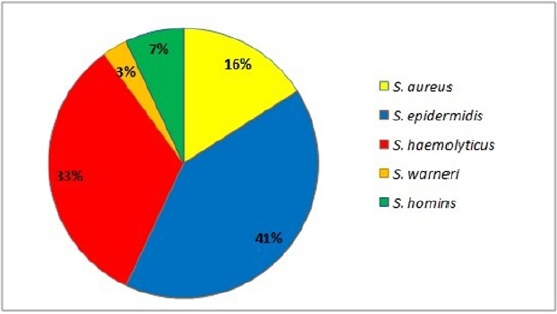
In this study, 81 strains of Staphylococcus spp. were recovered from infected blood samples (17%), respiratory tract samples (51%), wounds (17%) and samples of various kinds (15%). Of the 81 strains, the majority came from inpatients in intensive care (84%). Strains identified included the following Staphylococcus species: 84% Coagulase negative staphylococci (CoNS) of which S. epidermidis, S. haemolyticus, S. hominis, S. warnerii, and S. aureus (16 % n=13) (Figure 1).
Figure 1: Staphylococcus spp. identified by the Vitek2 biochemical system.
Antimicrobial Susceptibility
The following resistance patterns were observed among Staphylococcus spp. isolates: cefoxitin (95%), oxacillin (81%), benzyl penicillin (97%), gentamicin (77%), levofloxacin (85%), erythromycin (86%), clindamycin (48%), and trimethoprim sulfamethoxazole (43%). All isolates were susceptible to vancomycin, teicoplanin, linezolid and tigecycline. On the contrary, all Staphylococcus spp. isolates were sensitive to vancomycin, teicoplanin, linezolid and tigecycline. Of 13 Staphylococcus aureus isolates, 11 (85%) were MRSA and MDR. The predominant resistance profile among MDR isolates included a resistance profile to 7 antibiotics (53.9%) followed by 6 antibiotics (7.7%), 5 antibiotics (15.3%), 3 antibiotic (7.7%) and 2 antibiotics (15.3%) simultaneously.
Distribution of mecA, mecC (mecALGA251), spa and pvl
Multiplex-PCR analysis for detection of different mecA, mecC (mecALGA251), spa and pvl revealed the mecA gene for methicillin resistance in all 14 CoNS (100%) and 11 of 13 of the MRSA (84.6%). The mecC gene was found in 9 MRSA isolates (69.2%). All MRSA samples have showed the presence of spa and the absence of pvl. On the other hand, the previous genes (spa and pvl) were not found in 14 CoNS strains.
MLST
According to the MLST method, isolates were assigned to five different sequence types (STs) (ST5 in 1 strain, ST8 in 1 strain, ST10 in 1 strain, ST22 in 2 strains, and ST228 in 2 strains). Furthermore, the 3 MRSA of care unit were belonged to ST8 (n = 1) and ST228 (n = 2), the strain isolated from the Surgical Clinic showed ST5, from hematology the ST10, while the isolates of Infectious Diseases (n = 1) and of Pneumology (n = 1) were ST22.
Discussion
S. aureus is one of the species most frequently implicated in the etiology of hospital infections in different parts of the world, especially in the intensive care, pneumology, hematology, and surgery departments [39,40]. Although with lower percentages, CoNS are also emerging as important opportunistic pathogens, and are often involved in hospital epidemics [41,42]. This study, in agreement with these studies, highlighted beyond the isolation of S. aureus, a high percentage of CoNS from clinical samples from acutely patients, confirming the growing involvement of these problems in nosocomial infections. The MRSA spread infections is increasing and is achieving worrying levels in several countries, including Italy. Since Staphylococcus spp., in particular MRSA is transmitted through infected people, or vehicles, the first strategy to contain this spread may therefore concern the implementation of prevention, as suggested by the guidelines [43,44]. In this work, all methicillin resistant strains were found to have high resistance to other classes of tested, in accordance with what was reported by the European Center for Disease Prevention and Control (CDC) [45]. The mecA gene was considered the “golden standard” for detecting methicillin resistance in MRSA, however, recently methicillinresistant mecA negative strains have been found, in which the presence is associated with the mecC analogue (mecALGA251). In this work 97% of methicillin-resistant staphylococci had showed the presence of the mecA gene. Instead, in two isolates, despite being resistant to methicillin from the analysis with Vitek2, they did not possess the mecA and cC genes, highlighting, as reported by other authors, the limits of the phenotypic systems [46,47]. The data confirmed that HA-MRSA showed the virulence gene of Protein A (spa) but not the Leukocidin Panton – Valentine (pvl) gene, usually associated with CA-MRSA a community circulation [48]. Through the MLST profile have been identified 5 different clones of S. aureus, 4 of which ST5, ST8, ST22 and ST228 already circulating in Italy and worldwide, while the ST10 was not yet reported in Italy, was present only at community and veterinary level, confirming the trend of diffusion and exchange between CA-MRSA and HA-MRSA [49]. The ST5 profile strain from surgical clinic, linked to the type of sequence of a HA-MRSA widespread throughout the world and responsible for nosocomial, tract, mucosal and wound complications. Strains of ST8 and ST228 were identified in the intensive care unit isolates, detecting the circulation of at least two different clones in this unit. The presence of strains with characteristics such as to be included in ST8 and ST228, found to be circulating in both hospital and community settings, has been reported throughout the world [3,31,43]. Furthermore, MRSA with ST22 type sequence had been isolated from different types of samples from infectious disease and pneumology department, clone was found mainly in hospital and outpatient clinics, but also in communities and in animals in close contact with humans (dogs and cats) [3,46]. Finally, in this work, a type of ST10 sequence never reported in Italy was found coming from a nasal swab of the hematology department.
Conclusion
In conclusion, this study demonstrated the importance of constant supervision of the clones circulating in the several hospital departments, colonization, and the probable, but already possible, diffusion and exchange of strains found in the hospital and then in the community. This study was conducted on clinical samples that were chosen to represent the reality nosocomial situation. Although conducted on a restricted number of samples, it provides a database for the design of targeted screening and preventive molecular diagnostics.
Effects of Different Cryotherapy Techniques on Skin Surface Temperature, Agility and Balance – Comparison Between Cold Water Immersion, Game Ready®, And Ice Pack: A Randomised Clinical Trial
Cryotherapy is widely used for the treatment of acute soft tissue [1] to reduced pain, slow edema formation, decreased tissue temperature and cell permeability, induced superficial vasoconstriction, and prevention of secondary hypoxic injury [2,3]. However, its results are directly associated with the technique used, application time, decrease in skin temperature, and depth of cold penetration [4]. Among the cryotherapy techniques the ice pack is a low-cost device which is easily accessible, causing a reduction in tissue temperature and physiological changes to at least one centimeter [5,6], the cold water immersion (CWI) allows a greater body area to be exposed to cold [7], maintaining tissue cooling for longer and providing increased analgesia [8] and cryotherapy with intermittent compression can deliver similar results [9,10]. The literature shows that cryotherapy with intermittent compression is widely used for recovery of ligament injuries [11], total knee arthroplasty [12] and reduction in post-operative pain [10].
This form of application is effective in reducing pain [10,13,14], improving tissue oxygenation and microcirculation, and providing faster recovery from ligament disorders [15]. In addition, Murgier at. al. Murgier, et al. [11] reported that pneumatic compression and cryotherapy may reduce pain and postoperative blood loss, and lead to higher functional scores [12]. On the other hand, cryotherapy and intermittent compression equipment are more expensive and less accessible for health professionals. Several studies have aimed to evaluate the differences between the application of cryotherapy techniques, with divergent methods and contradictory results [10,16,17]. In addition, Hawkins and Hawkins [18] reported that sports physical therapists applied cryotherapy with great variability for acute or sub-acute ankle sprain and that efforts need to be made to substantiate the evidence of cryotherapy application [19].
Thus, little is known about the differences between the applications of an ice pack, cold water immersion, and cryotherapy associated with intermittent compression for the purpose of reducing skin surface temperature (related to treatment efficacy) and changing agility and balance. Therefore, new research should include controlled and reproducible different techniques. To contribute to discussions on the effects and indications of different techniques of cryotherapy on the ankle joint, the present study aimed to establish differences between applications of cryotherapy techniques on the ankle superficial skin temperature (SST) in different regions of this joint; the effects on agility and dynamic balance were also evaluated. We hypothesized that the three cryotherapy techniques studied would have the same effects on decreasing skin temperature, agility and balance. In addition, we hypothesized that the anterior, posterior, and lateral regions of the ankle would present different values of cooling. Thus, the results may support clinical decision making and aid choices made according to preference among the techniques.
Methods
This was a randomized clinical study, approved by the Research Ethics Committee of the institution (case N. 2.117.378) and registered at http://www.clinicaltrials.gov (ID NCT03659474). All procedures were performed at the physiotherapy outpatient clinic of the University. Twenty young and physically active subjects (ten men and ten women), without injuries or complaints in the ankle participated in the study. The women’s evaluations were carried out outside the menstrual period, since when they are menstruating, worsening in agility and dynamic balance can occur [20]. The sample size was calculated based on the results of the manuscript “The Magnitude of Tissue Cooling during Cryotherapy with Varied Types of Compression” [21], considering the SST over the mid-portion of the right gastrocnemius belly in twenty minutes after application of ice only and the elastic wrap. The values used were the means of each group (15.51 and 11.01) with a standard deviation of 4.39 (p <0.05). The program used was the Power and Sample Size, with a 95% confidence interval, 5% alpha level, and test power of 90%. Thus, 20 participants were recruited.
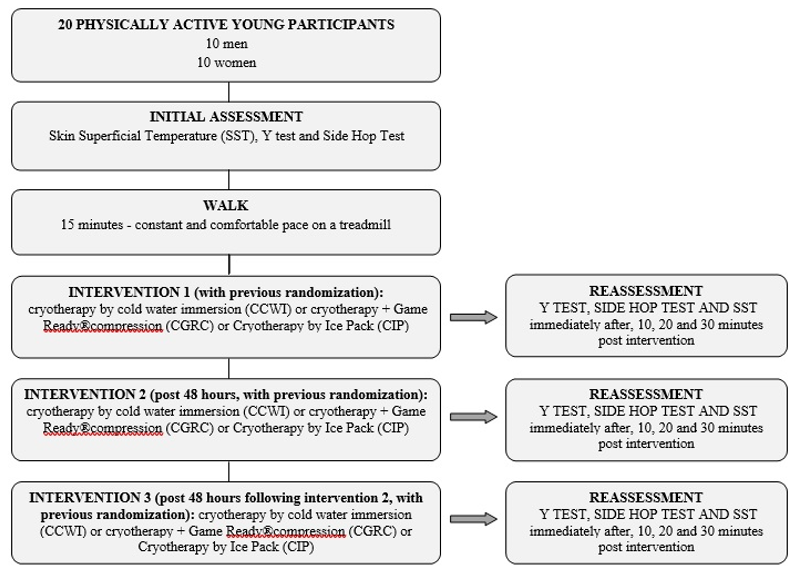
All participants underwent cryotherapy for the ankle with three different applications: cold water immersion (CWI), cryotherapy+Game Ready® compression (CGRC), or icepack (IP). Entries were randomly performed by a researcher not involved in the study through the platform http://www.ramdom.org and recorded in three different periods, with a 48-hour interval between measurements (Figure 1). All participants performed the three interventions, and there was no sample loss. Initially, a pre-intervention evaluation was performed where the SSTs of the anterior, lateral, and posterior regions of the ankle were collected with a professional Flir C2® thermal camera (FLIR® systems, Inc. Washington, USA). The thermographic camera had automatic ZOOM, it was positioned perpendicularly to the ankle, with a distance of 30 centimeters from the anterior joint line of the ankle, lateral malleolus and midpoint of the calcaneus tendon. In sequence, the Y test and Side Hop Test (SHT) were developed, already used in previous studies for the analysis of dynamic balance (22,23) and agility (24), respectively. Participants were familiarized with the tests prior to conducting the data collection.
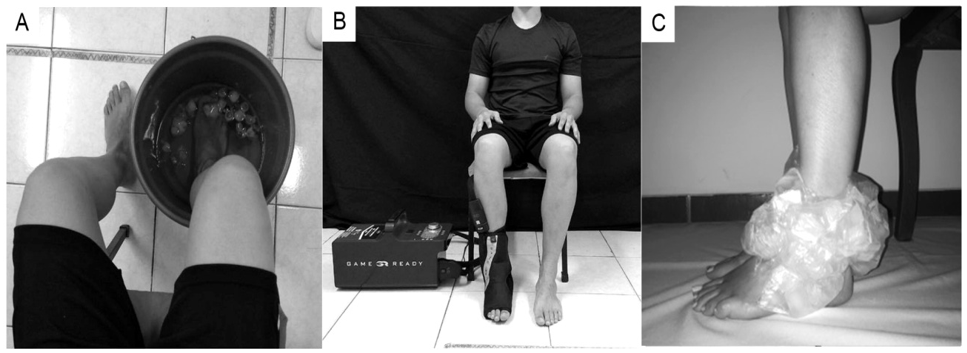
After the baseline assessment, the participants performed a warm-up with a 15-minute walk on the treadmill (Movement®) at a constant and comfortable pace. Immediately after walking, subjects were referred to one of three cryotherapy techniques for testing. For the CWI group, the ankle joint was immersed in cold water up to the mid portion of the tibia, at approximately 4°C [22], controlled by the thermal camera. For the CGRC group, the ankle joint was wrapped (cold wrap) using maximum dynamic intermittent compression (established by the equipment) and programmed to maintain a temperature of 1°C, according to the manufacturer’s instructions. For the IP group, the ankle joint was wrapped with three ice packs, each containing 500g of crushed ice. All treatments were performed for 20 minutes. The ambient temperature was always between 25 and 27 degrees Celsius. During cryotherapy applications, the participants sat on a comfortable chair, with their knee and ankle at 90º (Figure 2).
Figure 1: Flow chart depicting methodology for the assessments and interventions using cryotherapy.
Figure 2: Cryotherapy techniques. A. cryotherapy using cold water immersion B. cryotherapy + Game Ready® compression; and C. cryotherapy using an ice pack.
The same position was adopted for the three interventions to reduce the effects of the peripheral blood flow on the cooling and rewarming of the skin. The SST assessment was performed immediately after, 10 minutes, 20 minutes, and 30 minutes after the cryotherapy techniques. The same procedure was carried out for the functional tests. The participants attended data collection on three distinct days and were randomized into one of the three interventional groups each day. Statistical analysis was performed using SPSS software version 2.2 (SPSS Inc. Chicago, Ill, USA). The level of significance was set at 5%. The Shapiro Wilk test was used to establish the normality of the data. The values obtained were compared using a two-way repeated measure ANOVA, one-way ANOVA, and the Bonferroni post-test. To verify the effect size (d), the following formula was used: d= (x1−x2)/averages of the standard deviations (SDs), where x1 is the average of the analyzed variable in the initial assessment, and x2 is the average of the analyzed variable in the final assessment [23]. The average of the SDs was calculated through the arithmetic mean of the standard deviations related to the initial and final assessments: (SD1+ SD2)/2. The effect size was defined as ≤ 0.5 representing a small effect, between >0.5 and ≤ 0.8, a medium effect, and > 0.8, a large effect [23].
Results
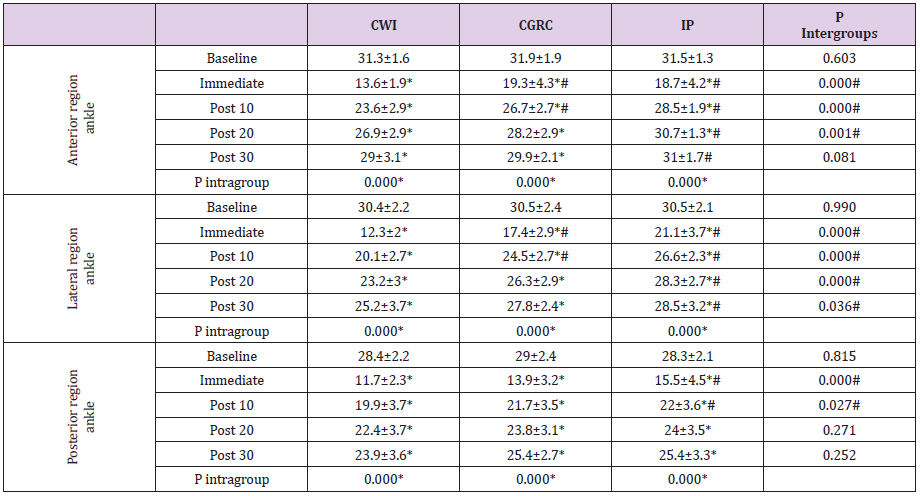
Twenty physically active subjects (10 men and 10 women) with a mean age of 21.4±1.9 years, weight of 70.7±12.4kg, and height of 1.7±0.07 meters participated in this study. The subjects engaged in physical activities (gym, soccer, running and other exercises) three to five times a week and were present at the three different data collection moments; there were no sample losses. The three cryotherapy application techniques significantly decreased the SST in the anterior, lateral, and posterior regions of the ankle when the time periods (baseline, immediately post, post10, 20, and 30 minutes) were compared. However, the IP group showed no significant difference for cooling of the anterior region of the ankle 30 minutes after application. In addition, only the CWI group (anterior, lateral, and posterior region of the ankle) and the CGRC group(posterior region of the ankle) exhibited SST sunder 15ºC (Table 1), related to analgesic effects [24]. The comparisons between the three application techniques showed that the CWI induced lower SST values for the anterior and lateral regions of the ankle at up to 10 minutes after application.
Table 1: Assessment of the SST for the anterior, lateral, and posterior regions of the ankle after the application of different cryotherapy techniques.
Note: SSP: superficial skin temperature. CWI: cold water immersion. CGRC: cryotherapy + Game Ready® compression. IP: Icepack. *Significant difference between baseline and rewarming time using the same cryotherapy technique established by repeated measures ANOVA. #Results established by one-way ANOVA for comparison between groups using CWI at different moments.
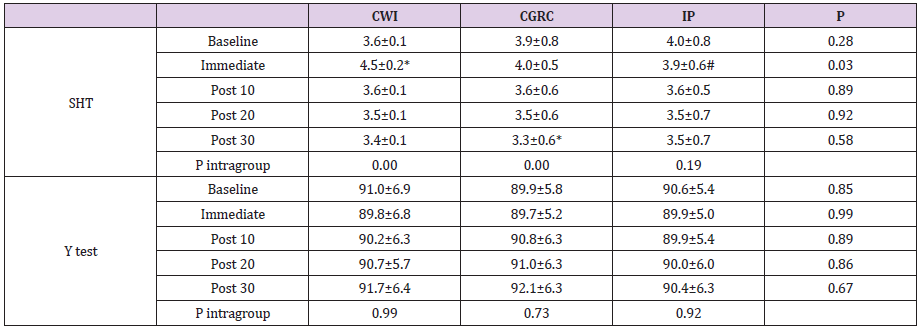
Both the CWI and CGRC applied to the posterior region of the ankle were equally effective in reducing SST at 10 minutes after the intervention. However, application of CWI produced the lowest temperature in the evaluated regions, except in the posterior region immediately after the ankle was removed from immersion (Table 1). Analysis of the effect size for SST of the anterior ankle demonstrated larger effect sizes for CWI (d = 0.90) and CGRC (d = 0.80), and a smaller effect (d = 0.20) for IP 30-minutes after application. For the lateral and posterior regions of the ankle all the application techniques demonstrated large effects (d > 0.8) for the reduction in SST at up to 30-minutes post-application. Functional performance based on the SHT indicated that the subjects in the CWI group performed worse immediately after application, with a significantly increased time. The subjects in the CGRC group showed improvement 30-minutesafter application, which was not expected. However, no performance differences were identified in the IP group (Table 2).
In addition, subjects in the IP group, even with no performance differences in the SHT at different moments, obtained better results when compared to the CWI group. For the Y test, no significant differences were identified at any moments or between the techniques used (Table 2). For the effect size produced by the different cryotherapy techniques, the CGRC group presented a large effect (d = 0.8) between the initial assessment and after 30 minutes, with improvement in agility performance (SHT). The CWI group demonstrated a large and negative effect (d = 1) between the baseline and immediately after assessments, with worse functional performance in the same test. The results obtained in the present study demonstrated significant differences between the techniques for the reduction in SST as well as changes in agility performance of the participants.
Table 2: Functional performance in the SHT and Y tests after applying different cryotherapy techniques.
Note: SHT: Side Hop Test. CWI: cold water immersion. CGRC: cryotherapy + Game Ready® compression. IP: Ice pack. *Significant difference between application times using the same cryotherapy technique established by repeated measures ANOVA. #Results established by one-way ANOVA for comparison between groups using CWI.
Discussion
The present study showed the cooling of the anterior, lateral and posterior ankle regions, and the posterior region of the ankle showed the lowest skin surface temperature (SST). All the cryotherapy techniques analyzed significantly decreased the SST; however, local cold water immersion (CWI) was better at decreasing SST when compared to cryotherapy + Game Ready® compression (CGRC) and ice pack (IP), up to 10 minutes after the end of the applications, in all regions. The importance of analyzing SST in different regions is justified by the different sites of injury in this joint (direct trauma, ligament injuries, Achilles tendon ruptures, inflammation of burses, etc.), which may respond unequally to the application of cold. The results revealed that the three techniques of cryotherapy applications significantly decreased the SST for up to 30-minutes of rewarming. The CWI group exhibited lower SST values in the anterior and lateral regions of the ankle (approximately 15 degrees immediately after application and better values at up to 10-minutes of rewarming), which is related to a local analgesic effect through inhibiting nerve conduction velocity [25].
However, 20-minutes after application in the anterior and lateral regions of the ankle, the subjects in the CWI and CGRC groups performed better than those in the IP group, which always exhibited higher SST values. These results contradict those by Kennet, Hardaker, Hobbs, & Selfe [26] and Hawkins, Shurtz, & Spears [9] who found lower temperatures after applying a ice pack compared to compression therapy. It is believed that greater rewarming after ice pack application may have occurred due to the lack of compression and worse contact between the skin and ice [21]. The cooling of the posterior region of the ankle demonstrated lower temperatures in all the techniques used, which may be justified by the decreased blood circulation of the Achilles tendon and bursa located in the posterior region of the ankle, since the connective tissue under the skin has less blood flow than the muscles, which does not favor the reheating of this place. It is worth noting that even after 10 minutes the CWI and CGRC groups presented better cooling results.
The best results associated with CWI application can be explained by the greater cooling area of contact [7], the hydrostatic pressure that redirected the skin blood flow to the central circulation [27], and the local vasoconstriction that reduces the fluid flux into the interstitial space. The intervention with CGRC provided satisfactory results that may be related to cooling associated with compression [12]. The results achieved for the effects of cryotherapy on agility performance, evaluated by SHT, confirmed the findings of previous studies, such as those reported by Macedo, et al. [22] and Furmanek, Słomka, & Juras [28] who showed worse functional performance immediately after CWI application. It has commonly been assumed that reduction in nerve conduction velocity may reduce the sensitivity of the afferent mechanoreceptors and the sensitivity of the muscle spindles with less afferent sensory information, causing damage to both the neuromuscular control and functional performance [4,25,29].
Moreover, Kilby, Molenaar, & Newell [30] and Oba, et al. [31] highlighted that the ankle joint capsule is more superficial than the majority of joints, and therefore, the receptors may be more influenced by cryotherapy application. However, after 10-minutes rewarming following CWI and at all intervention moments after CGRC and IP application, the agility performance returned to baseline values, which should be considered for the planning of physical and functional activities, training,and even for the return to sport after cryotherapy. These findings agree with those of Williams, Miller, Sebastianelli, & Vairo Williams, et al. [32] who reported that a 15-minute application of crushed ice on the ankle was not able to change the function of joint receptors. Finally, the Y test did not demonstrate any change after the application of the cryotherapy techniques, which may have occurred because this is a simple and easy test for young and healthy individuals, such as the participants of this study. Thus, we can infer that CWI was the best technique to reduce SST, followed by CGRC, and the IP provided the worst cooling.
This finding is important for clinical practice, since CWI application is widely used, low cost, and produced better results for the variables analyzed. For the posterior region of the ankle, CWI and CGRC were similar in cooling, and even at high cost the CGRC is an appropriate choice and can be used according to the preference of the physiotherapist or the patient. In addition, 10 minutes after the application of CWI, agility is worse and greater care must be taken. As limitations of this study it should be pointed out that healthy individuals were evaluated, intramuscular temperature analysis would be more reliable regarding the application of these techniques, and a force platform would be more appropriate to evaluate balance. Further research should complement the results obtained in this study.
Conclusion
The present study concluded that there is a difference in the application of the three cryotherapy techniques. The applications of CWI and CGRC were more effective in cooling and maintaining lower SST of the ankle. These two modalities should be the preferred treatment options for the anterior, lateral, and posterior regions of the ankle. CWI reduced agility performance at up to 10 minutes after cooling. Dynamic balance was not altered by any of the cryotherapy techniques tested. Ethics Committee of the State University of Londrina (UEL), Londrina, Paraná (Opinion No. 2.117.378). Clinical Trials (NCT03659474).
Joint Aches, Rash, and Fever in A Patient on Mepolizumab
Introduction
Sarcoidosis is a systemic disease characterized by noncaseating granuloma formations in one or more organ systems. Löfgren syndrome is an acute form of sarcoidosis that presents with a classic triad of arthritis or periarthritis, erythema nodosum (EN), and bilateral hilar lymphadenopathy (BHL). The heterogeneous presentations of Löfgren syndrome, especially in the setting of additional rheumatologic diseases, requires high clinical suspicion and acumen for early diagnosis and treatment. We present a case of a 29-year-old male with Löfgren syndrome.
Case Report
29-year-old male with possible eosinophilic granulomatosis with polyangiitis (eGPA)) with severe persistent asthma controlled on mepolizumab presented with arthralgias, rash, and fevers a week after a camping trip. He denied any consumption of unfiltered water, tick bites, trauma, sick contacts, cough, diarrhea, dysuria, or vomiting. His polyarthralgias were asymmetric, present in large joints of all four extremities, and unresponsive to ibuprofen. The patient’s history was notable for a presumptive diagnosis of eGPA dating back to a systemic inflammatory illness at age 16, which manifested with eosinophilia, pericarditis, palpable purpura, pulmonary infiltrates, nephritis and asthma, although the diagnosis was never biopsy confirmed. He had been managed with daily prednisone (20 mg/day) for over a decade due to a lack of health insurance and had been unable to taper due to recurrent asthma, sinusitis, and rashes. Three months prior to presentation, the patient was started on mepolizumab 100mg sq monthly and was able to taper completely off of prednisone.
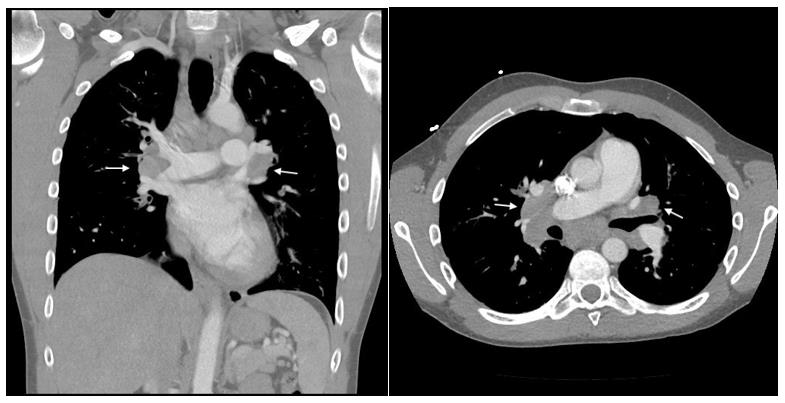
He was admitted to an outside hospital for severe right ankle swelling and underwent incision and drainage of his right posterior tendon tibial sheath for suspected septic arthritis. The aspirarate was clear, non-purulent and without growth on culture. Laboratory investigations were significant for WBC of 5.08 (ref 4.31-6.4 uL), normal absolute eosinophils, angiotensin converting enzyme (ACE) of 44 U/L (ref 9-67 U/L), negative chlamydia and gonorrhea PCR, and negative ANA and ANCA titers. He also had a negative quantiferon gold test four months prior to presentation. A chest CT demonstrated extensive, bilateral hilar and mediastinal adenopathy (Figure 1). He was started on vancomycin and discharged with cephalexin for right ankle cellulitis. His symptoms transiently improved on antibiotics but he was rehospitalized for progressive arthralgia, fevers, and new onset tender nodules on the left forearm four days later. On readmission, he was febrile to 38.1 C with otherwise normal vital signs.
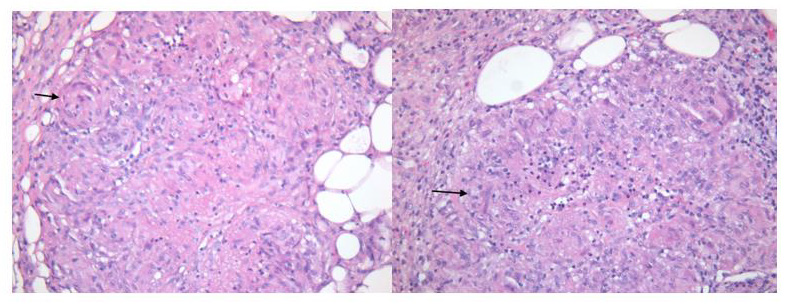
Physical exam was significant for pain with active and passive range of motion of large joints most pronounced in the right elbow, right wrist, right ankle and left knee. He had ill defined, pink erythematous patches on bilateral anterior lower extremities and 4 subcutaneous, slightly tender nodules on his upper and lower extremities. His laboratory analysis was significant for a WBC 9.52 K/cu mm (ref 3.5 – 10.8 K/cu mm) with 2% of eosinophil (ref 1-3%), creatinine of 1.32 (baseline of 1), ESR 58 mm/hr (ref 0-15 mmg/ hr), CRP 103 mg/L (ref <10 mg/L), and urine analysis without protein, blood, or WBC. Skin biopsy of the subcutaneous nodule on the left shin nodule demonstrated both sarcoidal and tuberculoid (intermittent central necrosis) granulomatous septal panniculitis without evidence of vasculitis (Figure 2). Although the presence of caseation and few eosinophils in his biopsy favored eGPA, his clinical presentation argued more for acute sarcoidosis.
Figure 2: Skin tissue biopsy of subcutaneous nodules demonstrate sarcoidal and tuberculoid granulomatous septal panniculitis.
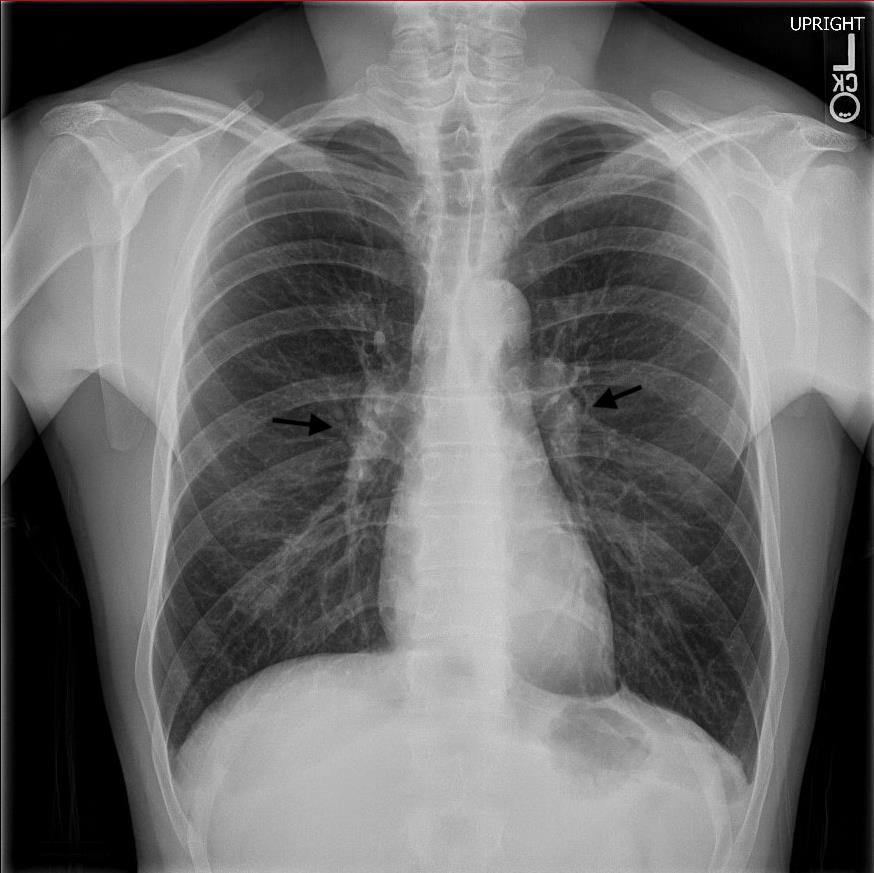
The differential diagnosis included infection, eGPA nodules, and Löfgren syndrome. Cultures and quantiferon were negative making infectious panniculitis less likely. EGPA nodules were considered, however this patient’s ankle arthritis, erythema nodosum, and hilar lymphadenopathy were most consistent with Löfgren syndrome. He was started on a dexamethasone 16-day taper starting at 6 mg daily and mepolizumab was continued. Post-discharge follow-up with rheumatology demonstrated resolution of arthritis, erythema nodosum, along with normalization of inflammatory markers. Three months post-treatment, his chest x-ray demonstrated decreased appearance of mediastinal and hilar lymphadenopathy when compared to prior CT (Figure 3). One year later, the patient continues to take mepolizumab without corticosteroids, and has had no recurrence of his symptoms.
Figure 3: Chear x-ray three months post steroid taper demonstrating decrease in BHL.
Discussion
Sarcoidosis, first described by dermatologist Jonathan Hutchinson in 1877, is a systemic disease of unknown etiology resulting in noncaseating granuloma formation in any organ [1]. The diagnosis is likely in the presence of clinical symptoms of organ involvement with radiographic correlation, tissue biopsy with histological evidence of granulomas, and exclusion of other diseases with granuloma formation. Exclusion of other granulomatous diseases include granulomatosis with polyangiitis, exposures to particulates (beryllium, dust), and infections such as mycobacterium, coccidiomycosis, and syphilis are important considerations. Löfgren syndrome, first described by pulmonologist Sven Löfgren in 1946, is a subset of sarcoidosis with a distinct phenotype [2,3]. Unlike the chronic often insidious development of sarcoidosis, Löfgren syndrome presents acutely with the classic clinical triad of polyarthritis or periarthritis, BHL, and EN. Fever and uveitis may also be present.
The arthritis or periarthritis is most commonly observed at the ankles but can affect elbows, knees, and metacarpophalangeal joints. Articular symptoms usually precede or present concomitantly with development of tender, erythematous, subcutaneous nodules called EN. Of note, biopsy is not necessary to diagnose Löfgren syndrome. Our case of a 29-year-old male with a history for possible eGPA and severe asthma on mepolizumab who presented with migratory polyarthritis, EN, BHL, and fever is consistent with Löfgren syndrome. Infectious etiologies were considered but less likely given absent history of tick bites, negative sexually transmitted disease and quantiferon gold test, non-purulent right ankle aspirate, and absence of growth on cultures. His history of possible eGPA presented a unique clinical challenge to differentiate from Löfgren syndrome. EGPA, a rare medium size vasculitis, can present with fever, arthralgia, and rash [4]. EGPA can cause subcutaneous nodules on extensor surfaces, which show granuloma on biopsy and may also show eosinophilia and/or vasculitis. Although presence of fibrinoid changes and few eosinophils on skin biopsy made eGPA possible, lack of palpable purpura, necrotic plaques, or retiform purpura on skin exam and overall clinical presentation made a vasculitis etiology less likely.
Given the patient’s recent initiation of mepolizumab, an IL-5 humanized monoclonal antibody, drug-induced sarcoidosis-linked reaction (DISR) was also considered [5]. DISR is a multisystem, granulomatous reaction with an indistinguishable phenotype to sarcoidosis. The four most common classes of drugs to cause DISR include tumor necrosis factor-inhibitors, interferons, antiretroviral therapy, and immune checkpoint inhibitors (Chopra). DISR has a temporal association with initiation of the offending drug and often will self-resolve after the withholding of the suspected drug. Mepolizumab is an anti IL-5 therapy, which is relatively new, but thus far has not been reported to cause DISR. Because this patient remained on mepolizumab even after Löfgren syndrome was diagnosed and had clinical improvement, DISR secondary to mepolizumab is less likely. The diagnosis of Löfgren syndrome in our patient required a multidisciplinary team that recognized the clinical constellation of acute migratory polyarthritis, BHL, and EN. In a young patient with acute arthritis and skin lesions, acute sarcoid should be considered. Work-up should include a chest x-ray to identify BLH and skin biopsy may be helpful in recognizing erythema nodosum. Although Löfgren syndrome is a self-limiting condition, a course of systemic steroids may relieve symptoms and provide quicker recovery.
Tuberculosis (TB) is the world’s most deadly infectious disease; it claims more than a million lives each year and affects a million more. It is the leading cause of death from a single infectious agent ranking above HIV/AIDS [1]. The global TB situation is dire with TB causing a significant mortality and morbidity [1]. India is the second-most populous country in the world with one fourth of the global incident TB cases occurring in India annually [2]. In 2019, out of the estimated global annual incidence of 10.0 million TB cases, 2.6 million were estimated to have occurred in India [1]. TB is a major public health problem in India, and it has a huge impact on the health and economy of the country [3]. Despite of the fact that TB is a curable disease if there is timely diagnosis and initiation of treatment, around two million people develop TB and 1.5 million die of TB in India every year.1 Poor primary health care and infrastructure in rural areas, irrational use of first- and second-line anti-TB drugs, unregulated private health care, rising prevalence of HIV TB comorbidity, widespread malnutrition fueled by poverty are some of the major challenges to control TB in India [4]. In addition, COVID-19 pandemic threatens to impact the progress made so far in reducing the burden of TB disease posing a considerable challenge for TB control efforts in India [1].
Journey of TB
The journey of TB control in India started with the establishment of sanatoria [5]. This was a maiden attempt in controlling the transmission of infection disease provided a timely diagnosis and initiation of treatment. Around two million people develop TB and 1.5 million die of TB in India every year [1]. The saga of TB control in India spans many decades. It is the most ancient disease with its description available in the ancient Vedas [6]. The evolution of the disease has been need-based, relating to problems of a technical, operational and managerial nature that arose over a period of time in the country [7]. As with most other countries, the initial anti- TB measures implemented in India were unplanned and ad hoc in nature, confined mainly to the establishment of hospitals and sanatoria [8]. This was due partly to lack of resources and partly to a preoccupation by way of isolation. Simultaneously, around the time India gained independence, effective drugs against TB began to be available (Streptomycin 1944, PAS 1946, Thiacetazone 1950, Isoniazid 1952 and Rifampicin1966) [8].
An estimated 4000 clinics and 5,00,000 beds were required for TB control according to western standards of the time in India [9]. Owing to money restrains, attention was directed to prevention of TB by way of BCG vaccination. Along with BCG vaccination, chest radiography, sputum microscopy for case finding, and ambulatory domiciliary chemotherapy for treatment were the other available tools for the control of TB. In order to apply these tools on a large scale, genesis of National TB control Programme (NTP) happened [9]. Now despite of the existence of NTP since 1962, no appreciable change was observed in the epidemiological situation of TB in the country. The situation was further threatened with the emergence of the HIV-AIDS epidemic and the spread of multi-drug resistance TB.7 In view of this, in 1992, came the Revised National TB Control Programme (RNTCP) which was renamed as National TB Elimination Program (NTEP) in 2020 [8,10].
National TB Elimination Program (NTEP)
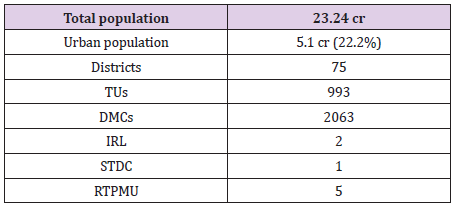
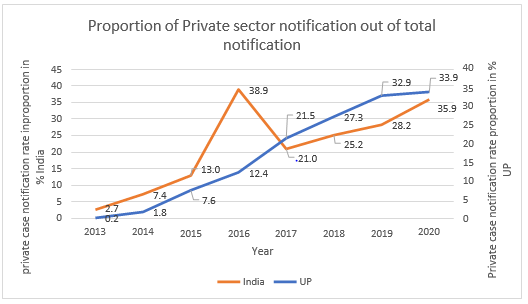
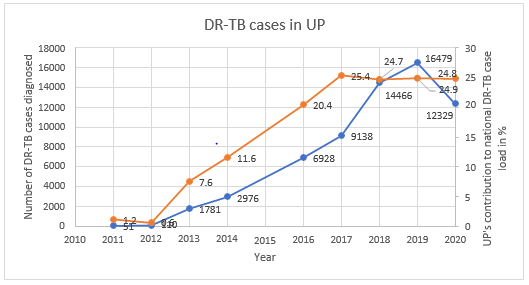
To revitalize the TB control programme in India, NTEP adopted the internationally recommended Directly Observed Treatment Short-course (DOTS) strategy, as the most systematic and costeffective approach [8]. It started with as a pilot in 1993 and was launched countrywide as a national programme in 1997. Rapid expansion of NTEP began in late 1998. Thirty percent of the country’s population was covered by the end of 2000, and by the end of 2002, 50%of the country’s population was covered under the NTEP. By December 2005, around 97% (about 1080 million) of the population had been covered, and the entire country was covered under DOTS by 24th March 2006 [11]. NTEP was set in motion in Uttar Pradesh (UP) way back in 2006 when in other state it was already attaining maturity [12]. UP being the most populous and vast state in the country contributes to the highest number of TB cases. It is the vastest state in India in terms of demography as well as geography making it challenging to manage the program with 75 districts [13]. UP contributes to 20% of the total notified TB cases in India [2]. Hence, it was decided to review the existing situation of TB in UP and new innovations undertaken to combat TB in UP.
Methodology
Uttar Pradesh is bounded by Nepal on the North, Himachal Pradesh on the north-west, Haryana on the west, Rajasthan on the southwest, Madhya Pradesh on the south and south- west and Bihar on the east. Situated between 23o 52’N and 31o 28 N latitudes and 77o 3’ and 84o 39’E longitudes, this is the fourth largest state in the country [14]. Uttar Pradesh is the densely populous state in the country accounting for 16.4 per cent of the country’s population. It is also the fourth largest state in geographical area covering 9.0 per cent of the country’s geographical area, encompassing 2, 94,411 square kilometers and comprising of 75 districts, 18 divisions, 901 development blocks and 200 million inhabited villages. The density of population in the state is 829 person per square kilometers as against 382 for the country [15]. This case study analyzes the current situation of the NTEP in UP. New initiatives were studied to understand their potential. The case study is based on the analysis of secondary data from the management information systems of the national, state and district levels. Information regarding health infrastructure and human resources was collected from Annual TB report, 2021. Data and information were also obtained from official website of the TBC-India.
Current Scenario
Infrastructure
In NTEP infrastructure, UP is headed by State TB cell (STC) located at Lucknow. The State TB Training and Demonstration Centre (STDC) is situated at Agra. STDC was built to effectively monitor and supervise the program. It is a premier institute in the state to impart quality training and workshops to all the key managers and supervisors in the state. The state has established five Regional TB programmatic Monitoring Units (RTPMUs) for better programmatic monitoring [12]. The state has 75 District Tuberculosis Centers (DTC), 993 Tuberculosis units (TU) and 2063 Designated Microscopy Centers (DMC) [2]. In laboratory infrastructure, there are 11 Culture & Drug Susceptibility Testing (C & DST) laboratories out of which 5 are having LPA facility, including 2 Intermediate Reference Laboratory (IRL) and 148 CBNAAT/ TrueNAT sites are operational in the state [2]. A total of 23 DR-TB centers have been established for the management of DR-TB [2].
Case Finding
Since the programme Implementation in 2006, the state has seen noticeable achievement in improving the prevailing situation of TB and thus contributing to the achievement of Millennium Development Goal [12]. UP being the most populous and vast state in the country, it contributes to the highest number of TB cases, and it has made significant efforts in achieving these targets. The New Smear Positive case detection rate in the year 2007 which was the initial phase of implementation of NTEP in UP was 99606 per lakh population [12]. The Annual Case Notification Rate achieved in the year 2020 against target was 61% [2]. Although the state is struggling to achieve the expected rate of more than 70%, the improvement in terms of number is worth noticing. The treatment success rate of UP of 2019 cohort was 83% as compared to the national average of 82%. In the present study, Presumptive TB examination rate (erstwhile Suspect examination rate) and case notification rate (CNR) were examined for the past 10 years.
Presumptive TB examination refers to a person with any of the symptoms and signs suggestive of TB including cough for more than two weeks, significant weight loss, hemoptysis, any abnormality in chest radiograph [16]. As seen from Table 1, Presumptive TB examination per lakh population has increased which relates to a more robust and strengthened case finding activities. Presumptive TB examination rate is the number of presumptive TB cases who have undergone sputum examination per lakh population per year while case notification rate is the number of tuberculosis cases registered in a specified time period (per year) in unit population (per lakh) in a defined area (e.g., TU/district/state) [16]. This depends on the extent to which patients utilize the health services. CNR is remaining steady/decreasing which denotes that even though case finding efforts are accelerated (which is reflected from Presumptive TB examination over the years), case load remains unaffected which is also one of the achievements of NTEP-UP (Tables 1 & 2).
Table 1: Key indicators of case finding activities of NTEP – UP.
Table 2: Physical infrastructure of NTEP in UP.
NTEP was implemented in Gujarat state in 1998 and it is one of the better performing states as far as control of TB is concerned [17]. There are other states in India who have better indicators, but they are small states. Gujarat is demographically comparable to UP state [18], and its key indicators of case finding are much higher compared to UP [2]. In the year 2015, which is considered as benchmark for TB free certification [2] the presumptive TB examination rate in Gujarat was 884 per lakh population which increased to 1164 in 2020 along with increase in CNR from 128 to 173 per lakh population in 2020 while Presumptive TB examination of UP was 624 per lakh population in 2015 which decrease to 482 in 2020 along with increase in CNR from 115 to 158 per lakh population which suggests that despite a decrease efforts for case detection, case notification has increase as compared to 2015 [2,19]. Hence, more of vigorous active case finding strategies are required.
UP is one of the five states besides Maharashtra, Madhya Pradesh, Gujarat and Rajasthan that contributes half of the total notified TB cases in India [2]. The annual TB case notification is increase during the last 10 years. It is evident from, there is a doubling observed in case notification rate from 2011 to 2019 with a fall in 2020 probably due to COVID-19 pandemic situation in the country. Apart from Ladakh, Lakshadweep, Mizoram and Sikkim, all the states and UTs in India presented a decrease in TB notification rates in the March-April 2020 [2]. The same was observed in UP with the first half of 2020 witnessing a 50% fall in TB notification due to vast hampering of the nationwide health system and restriction of movement due to lockdown situation [2]. But the state took vigorous steps like Active case finding and TB-COVID bi- directional screening which helped in increasing the TB notification by 26% in the last half of 2020 [2]. A well-planned screening for active TB among the high-risk groups is an established effective strategy to improve early case detection [2]. Active case finding activities were being implemented in NTEP since 2017 [20,21]. UP conducted ACF activities with 10121 patients diagnosed of TB among 43 million population mapped in 20202 and 14000 TB patients diagnosed among 56 million population mapped in 2019 [22] with the help of mobile TB diagnostic van enabling early TB diagnosis especially in hard-to-reach areas.
One of the major hindrances in TB detection is poorly established specimen collection and transportation systems in India [23]. Even though UP piloted the use of public postal service for sample transportation in 2019 when nationwide efforts were being made to link the sputum transport with India postal services28, it still needs to strengthen and monitor the engagement of public postal service for sample transportation. Figure 1 reveals that private TB case notification have increased over the past 10 years. Much of this increase in notification is credited to the directly transferred benefit (DBT) scheme of NTEP2 and the fact that the TB was declared as a notifiable disease in May 2012 [24]. UP has shown a considerable achievement in private case notification rate over a period of last 7 years since private sector started notifying TB cases.
Figure 1: Comparison of Private Sector notification of NTEP-UP and India.
Multi-Drug Resistant TB
Drug resistant TB is one of the major impediments to achieving the National strategic plan (NSP) goal of ending TB in India [10]. India bears 27% of the global burden of multi-drug resistant TB (MDR-TB) cases [2] An estimated 1,24,000 people developed MDRTB in India in 2019, i.e., 9.1 cases per one lakh population [2]. The first national anti-TB drug resistance survey reported 28% of TB patients resistant to any drugs and 6.2% having MDR TB. India is one of the countries with highest burden of MDR-TB in the world and UP is the one state which contributes to the maximum load of MDR-TB in India [2]. UP has introduced Programmatic management of drug resistant TB services in all 75 districts in 2013 [12]. It has 23 nodal DR-TB centers operationalized by airborne infection control measures [2]. UP contributes to 25% of total DRTB case notification of India [2] (Figure 2) In 2020, Universal drug susceptibility testing. was offered to 60% of notified TB patients in. DR-TB Case notification rate in UP is 5.3 per lakh population in 2020 Thus, more intensive efforts are required to offered UDST to all the eligible DR-TB patients [2]. (Figure 2) reveals an increasing trend of DR-TB cases in the last 10 years with a fall observed in the year 2020 due to COVID-19 pandemic when the overall case notification was reduced.
Figure 2: Trend of Drug resistant TB in NTEP-UP.
TB-HIV
Human Immunodeficiency Virus (HIV) is a risk factor for TB which not only increases the risk of reactivating latent TB infection but also increases the risk of rapid TB progression soon after the TB infection or reinfection. TB in people living with HIV is very difficult to diagnose and treat owing to challenges related to comorbidity, pill burden, co-toxicity and drug interactions [25]. India accounts for the highest burden of TB-HIV co-infected cases [2] India initiated provider-initiated testing and counselling among presumptive TB cases for early detection of HIV [2]. UP is a low HIV prevalence state. Out of the total TB-HIV burden, UP contributes about 6.95% of the total TB-HIV burden in India.2 In 2020, there were 2356 TB HIV co-infected patients diagnosed with HIV among those tested. Guidelines on prevention and management of TB in people living with HIV at ART centers recommended all TB-HIV coinfected patients should receive cotrimoxazole prophylactic therapy to prevent development of other common opportunistic infections [26].
In 2020, 94% of the total diagnosed HIV patients with TB were initiated on CPT whereas 92% were initiated on ART.2 UP reported high coverage of HIV testing among TB patients notified in 2019 especially in the public sector (85%) [27]. In UP, State TBHIV coordination committee (STCC) and State Technical Working Group (STWG) monitors key policy related to TB-HIV collaborative activities. District TB officers were given the charge of District HIV Nodal officers in 2008 making them the focal point for both TB and HIV related activities and better implementation of policy decisions [12,27-30].
Regional TB Programme Management Units: An Innovative Idea
Over the years India has been trying to initiate and implement new ideas of controlling and eliminating Tuberculosis from the country. Thus, in line with the Country’s view the State of Uttar Pradesh is working on the same path and has taken new initiatives to achieve the goals. Though the complete implementation of NTEP in the state was in the year 2006, in year 2014 an innovation through National Health Mission was conceived which lead to the establishment of four Regional TB Program Management Unit (RTPMU) at Agra, Bareilly, Lucknow and Varanasi. Recently, fifth RTPMU was inaugurated at Gorakhpur, UP [12]. Because of the fact that UP being a large state with 75 districts thus NTEP-UP has always faced a challenge of intensive monitoring, supervision and evaluation of all the districts in the programme from one State unit which is the State TB Cell at Lucknow [12]. Thus, a felt need for decentralization of the State Program Management, Supervision & Monitoring from State Head Quarter to the Regional levels units was seen.
The vision of RTPMU is handholding of districts with supportive supervision Each RTPMU is working as a satellite unit of both STC (State TB Cell) at Lucknow & STDC (States NTEP training and quality assurance establishment located) at Agra and are performing their key roles while supporting the districts linked to them which has led to a more effective Administration, Supervision, Monitoring, Training, External Quality Assurance, Reviews, Logistic management etc. [12]. Functions of RTPMU are to share the responsibilities of STC and STDC to effectively supervise, monitor and provide training as well as feedback to their linked districts for TB control. RTPMU is managed by a regional TB program management officer (RTPMO), 2 Deputy RTPMO, Consultant, Data entry operator and office assistant [12]. Thus, since the establishment of the five RTPMU’s state has achieved a noteworthy improvement in the key indicators and had shown the National Program Managers at Government of India & WHO that the preconceived notion of UP being a nonperforming state is gradually negated [31].
Conclusion
UP contributes to the maximum case load of drug sensitive TB (20%) and DR-TB (25%) in India. Being a vast and populous state with 75 districts, it has a mammoth task lying ahead to eliminate TB by 2025. The usual notion of UP being a nonperforming state is gradually changing. This is reflected in the efforts put by the NTEPUP and the achievements attained so far be it in terms of active case finding of TB cases, increase in private sector notification, using Indian postal service to improved sputum specimen transportation, mobile medical van facilities in hard-to-reach area and better monitoring of the program in the state. The RTPMUs established shows the decentralization efforts of the state linking each district to a particular RTPMU and increasing the accountability for TB. And these efforts are on-going, be it the recent establishment of RTPMU Gorakhpur or the Chief Minister of UP urging ministers and lawmakers to adopt one TB patient each to achieve the target of making UP free of TB which shows the hardcore commitment of the state to eliminate TB. Private sector notification and the proportion of UDST offered to TB patients needs to be further increased in UP. A more focused approach is required for each and every component of the TB program in UP. as a slight change in TB situation in UP will have a huge impact on the nation’s TB status and thus will pave way for eliminating TB from India by 2025.
Intradural Pressure Profile after Administration of Totilac® Compared to Mannitol® for Patients Undergoing Hematomal Evacuation Craniotomy
Background
Hemmorhage cerebral injury requires management to control the increase in intracranial pressure (ICP), including the surgical strategy and administration of hyperosmolar solution [1]. The hyperosmolar solution that has been widely used is mannitol 20% (Mannitol®). Mannitol® increase diuresis directly in the loop of Henle. Hypertonic sodium lactate (Totilac®), a relatively new hyperosmolar solution, can be used as an alternative in the management of increased ICP [2]. Besides having an higher osmotic reflection coefficient (σ), [3] the lactate content can theoretically be an energy source for ischemic brain cells [4]. Totilac® has the potential to increase diuresis indirectly by increasing intravascular volume [5]. From these properties, totilac® with the basic component of hypertonic saline, is considered superior in maintaining intravascular volume compared to mannitol®. Therefore, we want to compare the intradural pressure profile after administration of Totilac® and Mannitol® in patients undergoing hematomal evacuation craniotomy.
Methods
The study was conducted at a tertiary care hospital during April-July 2018. The study was approved by the Medical and Health Research Ethics Committee of FKKMK UGM and Dr. Sardjito Hospital. Informed consents were acquired from all subjects before participating in this study. The patients included for the study aged 18-65 years and who underwent emergency hematomal evacuation craniotomy for indications of intracerebral hematoma (ICH) or subdural hematoma (SDH). The exclusion criteria were unresolved shock, ongoing massive bleeding, allergic to lactate, impaired renal function, hyponatremia [Na+] <130 meq / L, hypernatremia [Na+]> 150 meq / L, history of uncontrolled diabetes mellitus, history of uncontrolled hypertension. The study subjects were allocated into two groups using permuted block techniques randomization. Group M received mannitol®, whereas group T had Totilac®. The allocated group information was given in a sealed envelope when the patient arrived at the surgery room. In operating room, Anaesthesia was induced with 2.5 mg of midazolam, fentanyl 2 mcg/kg, propofol 2 mg/kg, lidocaine 1.5 mg/kg, and rocuronium 0.6-1 mg/kg for tracheal intubation.
Anaesthesia was maintained with sevoflurane 2% with delivery gas of FiO2 50%. The depth of anesthesia was monitored by maintaining bispectral index value between 40-60. Controlled ventilation was set with a tidal volume of 6-8 ml/kg, PEEP 3-5, a minute volume of 80-120 ml/kgBW/ minute and a maximum peak inspiratory pressure of 30 mmHg. Maintenance fluid was given according to the needs of patients with a composition of 0.9% NaCl:RL = 3: 1. Blood lost was replaced with colloids with the same volume. Blood component was given if the bleeding exceeded maximum allowable blood lost. Another crystalloid was given to replace the urine output with 2/3 of the volume of it. Baseplate of invasive monitor were placed at the level of the tragus, following changes in the position of the patient. Invasive monitors were prepared with CVP mode on a scale of 0-30 and being zeroed every time a subject changes position. Intradural pressure measurement was performed by the surgeon through puncture using needle no.23 when the duramater was still intact.
The needle was placed in the subdural space parallel to the duramater then was connected to an invasive monitor device. The intradural pressure, hemodynamic and other parameters are measured when opening the cranium as a baseline, 5th, 10th and 15th minutes after hypertonic solution administered by rezeroing before recording the value. Analyses were done on all subjects who had received treatment according to the protocol. Data were expressed in terms of numbers and percentages, mean and standard deviations. The data between the two groups were analyzed for differences using independent t‑tests or paired t-test for numerical data and Chi square tests for categorical data. Data were analysed using SPSS 24 software computer program.
Results
A total of 27 patients were assessed for eligibility for this study. Randomization was performed on 27 patients. As shown in Figure 1, 3 subjects were excluded from analysis because of unable to follow the study procedure due to laceration of duramater during craniotomy. One-third of subjects are women as shown in Table 1. The average age of the subjects in group M was 50.75 + 13.4 years and in the T group it was 47.75 + 12.07, which was not difference significantly. There was no difference in the ratio of BMI and physical status based on ASA physical status (p= 0.667 and 0.155, consecutively). The distribution of trauma and non-trauma cases was also balanced in both groups. The level of brain relaxation was assessed in this study by measuring intradural pressure. Table 2 shows significant decreases of intradural pressure in the 5th, 10th and 15th minute after hypertonic solution administered in each group compared to baseline when the cranium was opened. Table 3 shows the change from baseline in intradural pressure between groups at 5th, 10th, 15th minute after hypertonic solution administered were similar. The difference in MAP between groups was found to be significant at all periods of measurement, as shown in Table 4. Group M has higher change from baseline of urine production at the end of observation compared to group T, as shown in Table 4.
Table 1: Demographic Data.
Table 2: Mean of intradural pressure compared to baseline.
Figure 1: Study sample.
Table 3: Mean of intradural pressure change from baseline.
Table 4: MAP and urine output.
Discussion
In this study, there was a significant decrease in intradural pressure in each group. It is well known that Mannitol® and hypertonic sodium lactate solutions with its hyperosmolar properties are part of ICP control management. The most significant decrease in group M occurred in the 10th minute after the cranium was opened, whereas the T group experienced the highest difference in the 5th minute after the cranium opened. This shows a different peak onset difference in each solution, although it is stated that Mannitol® peak onset and hypertonic sodium lactate solution are almost correspondent (15-20 minutes) [5]. Properties of hypertonic sodium lactate solutions that draw fluids from interstitial to intravascular be superior in controlling cerebral edem because its reflection coefficient is greater than Mannitol [5]. A study by Hisam, et al. showed hypertonic sodium lactate had a significantly better brain relaxation effect than Mannitol® assessed from a comparison of brain relaxation assessed subjective when an open cranium with BRS in COT [6].
Sokhal, et al. found that there was a significant difference in the decrease of intradural pressure in both groups with tumor removal craniotomy, but brain relaxation assessed by operators with the BRS method in the study did not differ significantly between the two groups. In this study, the difference in intradural pressure was not linearly related to brain relaxation that occurred, because the determinant component of ICT was not only from brain relaxation, where large tumor mass and intravascular volume also played a role in determining intradural pressure [7]. Previous studies conducted by Sharma, et al. the number of samples of 31 subjects who underwent aneurysm repair surgery also showed a meaningless difference in the decrease in intracranial pressure between groups M and T [8] this result is due to the aneurysm surgery itself the incidence of extravasation of fluid is not promising. Wirawijaya, et al. revealed no significant differences in brain relaxation in patients with craniotomy surgery to remove tumors that received 3% NaCl, Mannitol, and hypertonic sodium lactate [9].
In addition, nutritional support in the form of exogenous lactate that can be a source of energy in injured cells also decreases the progression of intersective edema resulting from cell death [2,10]. The study conducted by A Daniel (2014) states that lactate supplementation is an important component in brain metabolism that is experiencing injury, especially in the penumbra region that has the potential to experience cellular death [11]. Hamzah, et al. showed that ATP biomarkers in experimental animal models that experienced ICH experienced a significant increase in the administration of hypertonic sodium lactate solution compared to Mannitol® and NaCl 3%. The study also suggested that the comparison of the area of necrosis in the animal brain was significantly different, whereas in the hypertonic sodium lactate group it was much smaller than in the Mannitol® group, with p = 0,000.10 but they did not mention the correlation between the two findings.
The effect of diuretic Totilac® solution on the results of the study was significantly lower than Mannitol®. Previous research also showed similar results [6-9]. This was due to the Mannitol® properties acting in the loop Henle which resulted in increased urine production. In contrast to hypertonic sodium lactate, the diuretic effect is a result of increased intravascular volume, so that increased urine production is not a direct influence on the organ of urine formation. Based on this, hypertonic sodium lactate is a better choice in patients with intravascular volume disorders, because the diuretic effect of hypertonic sodium lactate will not appear in conditions of hypovolemia or dehydration [5]. The results of the insignificant decrease of intradural pressure in this study can be caused by the duration of the onset of the incident until the intervention was performed. In addition, the possibility of still active bleeding also affects intradural pressure. Even though brain relaxation has been achieved, the addition of volume in the third space can also increase intradural pressure. We could not manage this parameter and analyze it because we could not evaluate hematoma enhancement during surgery.
For the next research, it is necessary to do a comparative test of quantitative assessment methods using invasive monitors with BRS. A comparative study of the size of the needles used also needs to be done, so that it can avoid the possibility of blockages and clinging during the measurement period while not causing premature trauma to the dura mater. The use of invasive monitor equipment in this study is still relatively new even though it has been proven to determine the magnitude of pressure on other body locations. The use of needle number 23 can still allow for blockages and slacking during the measurement period.
Conclusion
Totilac® administration had similar intradural pressure profile effect compared to Mannitol® in hematomal evacuation craniotomy case.
Extensive Proof-of-Concept Studies in TNF-Alpha Antagonists might be Responsible for A Delay of Patient Access in Pediatric Rheumatology
Introduction
In order to improve the route to market for approved pediatric therapeutics, the current Pediatric Regulation in the EU and the Food and Drug Administration (FDA) Amendments Act (FDAAA) were both adopted in 2007. These include incentives for the pharmaceutical industry to perform pediatric clinical studies, for example granting an extended patent protection time or marketing exclusivity for orphan medicinal products for a limited period. Between 2007 and 2013, the European Medicines Agency (EMA) and its Pediatric Committee assessed more than 600 pediatric investigation plans (PIPs) with an aim to provide data on the efficacy and safety of medicines for diseases of children. After almost a decade of experience of PIPs, it seemed important to evaluate the usability of data derived from clinical trials for new medicinal products in children for marketing authorization. This is particularly important in order to understand the need for, and extent of, clinical studies for new drugs in children in the future. The aim of this study is to evaluate whether proof-of-concept clinical trials need to be carried out at the existing rate and frequency, and whether data to support the use of new drugs in children can be extrapolated from adult trials of equivalent indications with focus on rheumatology. This evaluation should help to outline new guidance for clinical trials for new drugs in children to prevent unnecessary extensive trials of ‘me-too’ drugs.
Strategy
The review compared the effects of immune-modulatory drugs in adults and children, selected using the following criteria: a) Biologics in the same class to treat arthritis b) Clinically tested for the same or a similar indication in children and adults c) Subject to a PIP in children and approved for use in adults. Drugs selected for this review are biologics targeting TNF-α including adalimumab, etanercept, golimumab, and infliximab.
TNF-α Inhibitors Tested in Adults and Children
Etanercept (Enbrel, Pfizer) is a soluble decoy receptor for TNF. It was the first TNF-α inhibitor launched for treatment of RA. The drug was FDA-approved in November 1998, and by the EMA in February 2000. It is approved for the treatment of RA, JIA, psoriatic arthritis, plaque psoriasis and ankylosing spondylitis [1] as the first biologic to treat JIA. Adalimumab (Humira, Abbot [now: AbbVie]) is a monoclonal anti-TNF-α inhibitor. It was the first fully human IgG1 protein to be approved by the FDA in December 2002. It was approved by the EMA in September 2003. Adalimumab is indicated for the treatment of RA, JIA, psoriatic arthritis, ankylosing spondylitis, Crohn’s disease, psoriasis and ulcerative colitis [2]. It was approved for JIA in 2008. Golimumab (Simponi, Janssen Biotech) is a human anti-TNFα IgG1κ monoclonal antibody. Golimumab was approved in US and Canada as a treatment for RA, psoriatic arthritis, and spondylitis, and is undergoing regulatory review in the EU [3] for these indications. Golimumab missed the primary endpoint in JIA. Infliximab (Remicade, Janssen Biotech) is a chimeric monoclonal antibody directed against TNF-α which induces apoptosis in TNF-α-receptor + cells. Infliximab is only approved for RA. It failed to meet primary endpoint in JIA and therefore has not been approved by the FDA in children for JIA. A waiver for the PIP was agreed in the EU. Infliximab is used off label in JIA as it has not been approved for this indication.
Search Strategy
The search was focused on RA in adults and on JIA, prescribing information, clinical trials websites and the FDA and EMA websites in order to identify relevant study information [4-16]. Keywords employed for the searches: Adalimumab, etanercept, golimumab, infliximab; juvenile idiopathic arthritis, JIA, juvenile rheumatoid arthritis, JRA, systemic juvenile idiopathic arthritis, SJIA, polyarticular juvenile idiopathic arthritis, PJIA; pediatrics, children, adults; tumor necrosis factor inhibitors, TNF-α, phase III.
Statistical Meta-Analysis
Statistical analysis was performed using a logistic regression with random effects. The primary outcomes are the ACR50 and ACR70. The dependent variable is the number of patients who reach ACR50 or ACR70 based on the total number of patients treated. Independent variables are treatment, age group (children vs. adults) and time. Treatment is a categorical variable, which compares several treatment regimens with placebo. As not every study has a placebo control arm, we therefore performed an implicit comparison with placebo. The variance of the random effects takes the variability between studies into account. Moreover, as several time points within a study are considered, this model takes also within study correlation into account. The comparison aimed to reveal different treatment responses in children compared to adults. This comparison is quantified using the odds ratio with a 95% confidence interval. Additionally, the response probability adjusted for treatment and time is given with a 95% confidence interval for each group. Calculations were performed with prpc glimmix, SAS 9.4.
Results
A comparative analysis using clinical and pharmacokinetic data was performed, based on data obtained from pivotal studies of biologics for the treatment of inflammation in children vs. adults and evaluated in terms of efficacy, safety and dose used. In total, one or two pivotal pediatric trials, and four to seven pivotal studies in adults for all biologics were identified. All drugs were given as either monotherapy or in combination with methotrexate, and either placebo-controlled or without control. The following section summarizes results (Tables 1-6) obtained from meta-analyses.
Table 1a: Comparison of clinical trials with etanercept in children and adults.
Table 1b: Pharmacology data of clinical trials with etanercept in children and adults.
Abbreviations: PD: Pharmacodynamics PK: Pharmacokinetics ka: First-order absorption rate constant Css, trough: steady-state trough concentration Cmax: Maximum serum concentration Cmin: Minimum serum concentration Tmax: Time to reach the maximum concentration Vss: Distribution volume Vc: Volume of distribution in the central compartment Vp: Volume of distribution in the peripheral compartment Cl: Clearance Q: Intercompartment clearance
Table 2a: Comparison of clinical trials with adalimumab in children and adults.
Table 2b: Pharmacology data of clinical trials with adalimumab in children and adults.
Table 3a: Comparison of clinical trials with infliximab in children and adults.
Table 3b: Pharmacology data of clinical trials with infliximab in children and adults.
Table 4: Meta-Analysis: Results on ACR50 and ACR70 for etanercept showed a treatment effect for etanercept.
Table 5: Meta-analysis: Results on ACR50 and ACR70 for Adalimumab. Comparative data for adalimumab studies in children and adults confirmed a treatment effect in both groups.
However, there is no statistically significant treatment difference effect in the between-age or study-duration group for the endpoints ACR 50 and ACR 70.
Table 6: Meta-Analysis: Results on ACR50 and ACR70 for infliximab. Meta analysis of study data on infliximab shows no statistically significant treatment effect between adults and children.
We do not present forest plots for infliximab due to numerically instable results.
Etanercept
A single pediatric clinical trial (JIA-I [17]) in 2000 was identified from the drug prescribing information (Table 1a). This trial involved a total of 120 patients; 51 were part of a double-blind, placebo-controlled study with a nearly 1:1 ratio (26:25), and 69 participated in an open-label trial with etanercept only. A total of four studies in RA in adults, two in 1999 (Study I [18] and II [19]), one in 2000 (Study III [20, 21]) and one in 2004 (Study IV [22, 23]) were identified. Two compared etanercept with placebo, and two compared etanercept with methotrexate.
Dosage and Study Duration
Children were dosed for three to four months with 0.4 mg/ kg bw etanercept, and a maximum of 25 mg per dose. Across all studies, adults received 10 or 25 mg etanercept over a period of six or twelve months. Only two trials [17, 24] included a placebo in the control arm and etanercept only in the study drug arm. All other trials in adults were performed in combination with methotrexate in experimental and placebo groups (Table 1a).
ACR Response
Assessment of the ACR study data differed between children and adults. The pediatric studies used the ACR30, ACR50 and ACR70 criteria and the adult studies the ACR20, ACR50 and ACR70 criteria. Thus, only the data for ACR50 and ACR70 could be considered for direct comparison (Table 1a and Figure 1). In addition, the selected time schedule for ACR assessment differed greatly between studies. While ACR50 and ACR70 were evaluated in week 12 or 16 in children, these were evaluated in week 4, 24 or week 48 in adults. Only Study II and Study IV showed an assessment in week 12. The respective numbers had to be estimated from figures in the publication. In the JIA study of Lovell et al., 64% of the 69 patients met the definition of 50% improvement, and 36% the definition of 70% improvement at the end of the study [17]. There was a similar rate in the Moreland et al., study (59% of the 25 mg group achieved an ACR20 response and 40% achieved an ACR50 response) at 24 weeks [24].
The response rate achieved with etanercept treatment in combination with methotrexate varied between 39-59% for ACR50 at 25 mg and 15-36% for ACR70 at 24 weeks in all other three studies in adults. Meta-analysis showed a treatment effect for etanercept in both, adults and children. However, no effect of age or study duration on the treatment effect could be measured (Table 4 and Figure 1). Thus, the results obtained on drug efficacy and dose showed no difference in adults and children.
Figure 1: Forest plot results on ACR50 (A) and ACR70 (B) ETANERCEPT as graphical representation of the meta-analysis here includes five studies [17-20]. The first column shows names of the covariates in the model. Odds ratios for dose levels are reported with placebo as the reference. Results are shown together with 95% confidence interval. The black dot on each line shows you the odds ratio for each variable.
Meta-Analysis Results of ACR50 AND ACR70
Results of mixed-effects logistic regression for adults and children concerning treatment effects, age group (adults vs children) and study duration (time in weeks) can be viewed in the following tables. numDF, degrees of freedom of term; denDF, degrees of freedom of error term; F, variance ratio; P, error probability; critical value of significance: p<0.05.
Adverse Events
Most frequent adverse events (AEs) in both children and adults were injection site reaction, upper respiratory tract infection, headache, rhinitis, nausea and rash. The drug demonstrated a favorable risk-benefit profile in children and adults. No lifethreatening events were observed (Table 1a).
Pharmacokinetics
The population pharmacokinetic analysis by Yim et al. confirmed that 0.8 mg/kg once weekly and 0.4 mg/kg twice-weekly subcutaneous regimens of etanercept had equivalent clinical outcomes. This served as a basis for the recent FDA approval of the 0.8 mg/kg once-weekly regimen in pediatric patients with JRA [25] (Table 1b).
Adalimumab
Two pediatric clinical trials, PJIA-I [26] and PJIA-II [27], were identified in the prescribing information. These were carried out in 2008 and 2014 and involved a total of 336 patients; 133 as part of a double-blind, placebo-controlled study (75 received methotrexate as supplemental therapy, 58 did not) and 203 in an open-label trial with adalimumab with or without methotrexate (112 and 91, respectively) (Table 2a). In comparison, five pivotal studies in adults, two in 2003 (RA-I [28] and RA-IV [29]), two in 2004 (RA-II [30] and RA-III [31]) and one in 2006 (RA-V [32]) were identified. Two compared adalimumab to placebo, and two were placebocontrolled plus methotrexate. One study compared adalimumab to methotrexate only, as well as to adalimumab plus methotrexate.
Dosage and Study Duration
The studies in children were carried out over 12 to 30 months with 24 mg/m² adalimumab, and a maximum of 20 or 40 mg per dose. Adults received 20, 40 or 80 mg over a period of six, six and a half or 13-24 months. The drug was given subcutaneously in all cases. The PI allows 10, 20 or 40 mg for children, depending on the body weight, and 40 mg is the approved dosage for adults as described in PI (Table 2a).
ACR response
Assessment of ACRs included were ACR30, ACR50, ACR70 and ACR90 for children, and ACR20, ACR50 and ACR70 for adults. Children were evaluated in week 12, 16, 24, 48, 60 and/or 96, and adults in week 24, 26, 52 and/or week 104. Thus, only ACR50 and ACR70 at 24 weeks are comparable (Table 2a and Figure 2). PJIA-II and RA-I, RA-III and RA-IV assessed ACR50 and ACR70 in week 24. However, these studies are not well comparable as their design differs considerably. PJIA-II was a placebo-controlled study, while RA-II and RA-III tested placebo plus methotrexate. RA-IV was also placebo-controlled, but allowed DMARDs during the study, whereas PJIA-II did not. Only studies with adalimumab in combination with methotrexate at week 24 were eligible for ACR50 and ACR70 comparative analyses. In the pediatric study PJIA-II, 83% of patients achieved ACR50, and in the adult RA-I study, 22% reached ACR50 at week 24 with 20 mg maximum dose treatment. In the PJIA-I study, ACR50 was achieved in 64% of the children at the 40 mg maximum dose compared with 37% in the RA-I study, 86% in the RA-III study and 59% in the RA-V study, respectively. 73% of children achieved ACR70 in the PJIA-II study, whereas only 7% and 9% of adult patients using 20 mg at 24 weeks were comparable as demonstrated in the RA-I and RA-II studies, respectively. At a 40 mg dose of adalimumab the response varied between 46% and 71% at weeks 16-48 in the PJIA-I study compared with 37%, 23%, 86% and 59% with the combination of adalimumab and methotrexate in adults in RA-I, RA-II, RA-III and RA-V studies, respectively.
Figure 1: Forest plot results on ACR50 (A) and ACR70 (B) ADALIMUMAB, includes seven studies in the meta-analysis [25-31]. The first column shows names of the covariates in the model. Odds ratios for dose levels are reported with placebo as the reference. Results are shown together with 95% confidence interval. Odds ratios for dose levels are reported with placebo as the reference. Results are shown together with 95% confidence interval.
Meta analysis of ACR50/70 revealed that comparative data for adalimumab studies in children and adults confirmed a treatment effect in both groups. However, there is no statistically significant treatment difference effect in the study duration for the endpoints ACR 50 and ACR 70 (Table 5 and Figure 2). Similar to etanercept, results obtained on adalimulab on efficacy and dose showed no difference in adult and children.
Adverse Events
The most common event was injection site reactions. The most common AEs leading to discontinuation of adalimumab treatment were clinical flare reaction, rash and pneumonia. The rate of serious infections was 4.6 per 100 patients (Table 2a).
Pharmacokinetics
A higher apparent clearance of adalimumab in the presence of Neutralizing anti-adalimumab antibody (AAA) and lower clearance with increasing age in patients aged 40 to >75 years was observed in population pharmacokinetic analyses in patients with RA. No gender-related pharmacokinetic differences were observed after correction for a patient’s body weight. Healthy volunteers and patients with rheumatoid arthritis displayed similar adalimumab pharmacokinetics. Cmax, Tmax, bioavailability and elimination values are only available for adults as described in the PI (Table 2b).
Golimumab
Golimumab has been confirmed to be an effective treatment for patients with RA in phase III clinical trials as evaluated by traditional measures of disease activity. The efficacy and safety profile of golimumab appears to be similar to other anti-TNF agents. However, golimumab has the potential advantage of once monthly subcutaneous administration and the possibility of both subcutaneous and intravenous administration. A study of CNTO 148 (golimumab) in children with juvenile idiopathic arthritis (GO-KIDS trial) to evaluate the efficacy and safety of golimumab is ongoing. This study enrolls patients who have active JIA and at least five joints with active arthritis that have poor response to methotrexate. The GO-KIDS trial consists of three parts and aims to assess the efficacy and safety of golimumab in pediatric patients aged 2 to <18 years with active JIA with a polyarticular course (at least five joints) despite therapy with methotrexate (10 to 30 mg/m²/week) for at least 6 months [33]. The trial involved 173 patients (87.9% white, 75.7% female; median age 12 years, age 2 to 17 years) with moderately active disease. Nineteen (11%) patients discontinued in part 1 of the trial due to lack of efficacy (n=14), adverse effects (n=4), and withdrawal of consent (n=1).
Dosage and Study Duration
The drug (the usual adult dose for RA of an initial dose of 50 mg subcutaneously once a month or 2 mg per kg iv infusion over 30 minutes at weeks 0 and 4, then every 8 weeks thereafter. It should be given in combination with methotrexate. Corticosteroids, nonbiologic DMARDs, analgesics and/or NSAIDs may be continued during treatment with this drug [33].
ACR Response
During the first phase of the trial, 151 of the remaining 173 (87.3%) patients achieved a 30% improvement from baseline in 3 of the 6 assessed criteria (active joint count, limitation of motion joint count, physician global assessment, patient/parent global assessment, Childhood Health Assessment Questionnaire, and acute-phase reactant level) without worsening of the remaining criteria, and 36.1% of patients displayed inactive disease status. The investigators randomized 154 patients to part 2 of the trial. The primary endpoint was not met; at week 48 the flare rates were comparable in those receiving placebo and golimumab (52.6% vs. 59.0%; P=0.41). The major secondary endpoints were also comparable between the placebo and treatment groups. The rates of inactive disease/clinical remission in patients receiving placebo + methotrexate or golimumab + methotrexate, for example, were 27.6%/11.8% and 39.7%/12.8%, respectively. Children with JIA in at least five joints displayed a rapid response to golimumab during the open-label, part 1 portion of the trial. During this portion of the trial, 36% of patients displayed inactive disease following the golimumab injection schedule. The sustained improvement in JIR was maintained in the placebo and treatment groups compared with baseline.
Adverse Events
Through week 48, adverse events, serious adverse events, and serious infections were reported in 87.9%, 13.3%, and 2.9% of all randomized patients, respectively. The most frequent serious adverse event was exacerbation of JIR. Death, active tuberculosis, or malignancy did not occur. Golimumab missed the primary endpoint in JIA. The reasons for the similarity in flare rates between the arms is unclear, and further study is needed if the regimen ultimately proves worthy of clinical use [33]. No Meta analysis for Golimumab on adult and pediatric data could be performed, as the data from the study in JIA is not publically available.
Infliximab
Study Description: A multicenter randomized doubleblind placebo-controlled trial of infliximab in 117 children with polyarticular JIA did not find a statistically significant effect of infliximab 3 mg/kg intravenous infusion therapy plus methotrexate on ACR-Pedi responses as compared with placebo at 14 weeks [34]. The open-label extension (OLE, 52–204 weeks) of the study involved 78 patients. However, 34% discontinued infliximab prematurely, mostly by withdrawing consent due to lack of efficacy [35]. Overall, 30% of the children continued the study up to week 204 (Table 3a). The two pivotal studies in RA in adults were performed in 1999 (Study RA I, ATTRACT, [36]) and 2004 (Study RA II, ASPIRE, [37]). Both trials were placebo-controlled and allowed methotrexate. They worked with 3, 6 or 10 mg/kg i.v. application of infliximab.
ACR Response: After 14 weeks, following crossover from placebo to infliximab 6 mg/kg, ACR50 and ACR70 responses at week 52 were achieved in 70% and 52% of the children. However, there was no statistically significant difference between the placebo group and the treatment group. Meta analysis supports that study data on infliximab shows no statistically significant treatment effect in children compared to adults. Also, the impact of age and study duration did not play a significant role (Table 6).
Adverse Events: The pediatric trial demonstrated that infliximab was safe, though the 3 mg/kg group had a less favorable safety profile, with a higher incidence of injection-site reactions and more serious infections. As the efficacy of infliximab in a pivotal study has not revealed a superior effect compared with placebo [34], the FDA did not approve infliximab for JIA, although it is still used in children. It is recommended as backup drug to treat JIA in the guidelines for JIA treatment [38] at the usual pediatric dose for JIA: 10 years or older: 3 mg/kg via iv infusion at weeks 0, 2, and 6, followed by infusions every 8 weeks [39]. Moreover, infliximab is approved for the therapy of refractory Crohn’s disease in children over 6 years (Table 3a).
Pharmacokinetics: The childrens’ trial observed formation of antibodies to infliximab, antinuclear antibody or anti-dsDNA antibodies in greater proportion in the 3 mg/kg group [34,35]. This confirmed results from one adult study [37], although other studies could not detect anti-chimeric antibodies, or only below detection limit [36,40,41] (Table 3b).
Discussion
The introduction of PIPs aimed to initiate a formal approval process for new medicinal products to avoid unauthorized use in children. In this review, the JIA indication in children, with RA as a counterpart in adults, and TNF-α blocking agents were selected as model diseases and drugs for comparison and evaluation of the data obtained from clinical studies in the new immunomodulatory drug space. TNF blocking agents are currently the only drug group with a number of compounds authorized in children and adults to treat JIA and in adults in RA, thus providing most experience in this drug class. Studies with etanercept in children showed the utility of TNF-α blocking agents in JIA for the first time. The PI for etanercept allows a dose of 0.8 mg/kg for children <63 kg and up to 50 mg for children ≥63 kg. 50 mg is also the approved dose for adults. The detailed PK parameters to support the dose selection in either population could not be identified and were addressed in only a few studies. A direct comparison of ACR response between children and adults was only partially possible as the time points for assessments differed considerably between both groups. Thus, it is unclear how the dose for children was selected. However, as the dose is set at a similar level for adults and children, these studies supported the idea that the dose for children could potentially have been extrapolated from the adult studies. Furthermore, no new safety issues or efficacy data were identified in proof-of-concept trials with children. Thus, the pediatric study results did not lead to any significant differences in dosage or safety profile compared with those in adults but confirmed the efficacy in JIA. Meta-analysis showed no difference on the treatment effect for etanercept in adults and children.
Similar findings were true for the comparison of dosage between adult and children for adalimumab. The PI shows a dose of 10, 20 or 40 mg for children, depending on the body weight; 40 mg is the approved dosage for adults. Thus, the pediatric study results did not lead to any significant differences in dosage that could not have been predicted from the adult studies. ACR response data was also only partially directly comparable due to difference in assessment values and schedules. In addition, no new safety and efficacy data was obtained by these studies. However, no statistically significant treatment difference effect in the beween-age or study-duration group for the endpoints ACR 50 and ACR 70 (Table 5) could be observed. Golimumab was used in trials described above in JIA or RA. So far, no new safety and efficacy aspects have been identified in the JIA study, but the primary endpoint was not met in children. Adverse effects with anti-TNF-α blockers are generally mild e.g. local skin reactions/infusion reactions, and are mostly transient. Minor infections e.g. upper respiratory tract infections are common. The risk of developing tuberculosis seems higher with the monoclonal antibody’s infliximab and adalimumab, compared with etanercept [42,43]. Autoimmune phenomena such as drug-induced lupus, demyelinating disease, uveitis, psoriasis and inflammatory bowel disease were rather rare.
The risk of malignancies was reported to be increased in children. The post-marketing surveillance data on anti- TNF-α agents collected by the FDA reported 48 malignancies developing in children, of which 20 occurred in children with rheumatic conditions [44]. However, 88% of these children were also receiving other immunosuppressive drugs, including corticosteroids, azathioprine and methotrexate. Approximately 50% of the malignancies reported were lymphomas, leukemia and melanoma. The FDA and EMA added a boxed warning with regard to the possible increased risk of malignancy, especially lymphomas, in children treated with anti-TNF-α agents. Despite this, a recent summary of worldwide pediatric malignancies in children treated with etanercept did not find an overall increased risk. However, the authors acknowledged that it is difficult to assess the actual risk due to the rarity of malignant events, the underlying higher risk of lymphomas and leukemias in children with JIA and the confounding use of other immunosuppressants [45].
The time before the marketing approval of drugs is particularly important, as the overall aim of drug development in clinical trials should focus on patient benefit to make sure that access of drugs to patients is as simple and fast as possible. However, the studies performed to support marketing approvals in children does not seem to support this overall aim, as shown in the model based on TNF-α blocking agents. Therefore, prolonging the drug approvals process does not benefit children, and promotes off-label pediatric used as these drugs are already marketed for use in adults. All four TNF-α blocking agents discussed here are approved in adults for RA, and all have been tested in children for JIA. The results broadly confirm the findings in adult studies other than infliximab, which has not been approved at a dose of 3 mg/kg for JIA (although it is continued to be used in children). Based on the similarity of dose administered in adults and children, the assumption is that the key parameters are likely to be similar across age groups for a range of biologics. Therefore, the question arises – is it important to carry out confirmatory studies in children? Are these studies really necessary or can the data for biologics be extrapolated if the expression of the respective target is the same in adults and children? The data reviewed suggests that the results obtained in adult RA studies are likely to be useful in predicting the dose, efficacy and safety for children with JIA. It therefore does not support further performance of extensive proof-of-concept studies in children.
Conclusions
The overall aim of drug development in clinical trials should focus on patient benefit, making sure that patient access to drugs is as simple and fast as possible. However, the studies performed to support marketing approvals in children do not seem to support this overall aim, and actually prolong the approvals process. They also promote off-label paediatric use as the drugs are already marketed for use in adults. All four of the TNF-α blocking agents discussed here are approved in adults for RA, and all have been tested in children in JIA. Based on the similarity of dose administered in adults and children for the two biologics approved in children, the assumption is that the key parameters are likely to be similar across age groups for a range of biologics. Therefore, the question arises – is it important to carry out confirmatory studies in children? Are large pivotal studies really necessary or can the data for biologics be extrapolated if the expression of the respective target is the same in adults and children? Our review of the data suggests that the results obtained in adult RA studies are likely to be useful in predicting the dose, efficacy and safety for children with JIA. It therefore does not support further performance of extensive proof-of-concept studies in children in specific targeted indications and based on mode of actions of a medicinal product.
However, infliximab and golimumab missed the primary endpoint for efficacy in JIA. The failure of these two drugs suggests that the differences in PK/PD parameters might play an important role in children’s immune responses to biologic drugs, especially those expressed as chimeric or pegylated proteins. This differing immune response may have a bigger role in children than in adults, with higher levels of immunogenicity and neutralizing antibodies reducing the efficacy of the drugs. It is interesting to note that there were no studies identified in the public domain that looked at these drugs in terms of target expression in lymphocytes, or PK/ PD studies in children. The data reviewed suggests that the results obtained in adult RA studies are likely to be useful in predicting the dose, efficacy and safety for children with JIA for certain products, however, the results from the two unapproved drugs might indicate that expression studies of the target and PK/PD studies are important to translate adult studies successfully in children. The need for further extensive efficacy and safety studies in children is therefore challenged. PK/PD studies plus modelling and simulation based on adult dose may be needed in children to help in finding optimal dose for children and to confirm a PD effect. In certain situations, for example in drugs of the same class, an extrapolation approach could avoid unnecessary further studies in the pediatric population.
Prevalence and Socio-Demographic Correlates of Substance Use Among Patients Attending the drug Unit of the University of Port Harcourt Teaching Hospital
Introduction
According to the World Health Organization [1], substance use refers to the use of any psychoactive substances or drugs, which include licit and illicit drugs, other than which are medically indicated. The United Nations Organizations on Drug Council [2] stated that substance use is a major public health problem all over the world. In 2011, it was estimated that 167 to 315 million people aged 15 to 64 years globally had used an illicit substance in the preceding year [3]. The estimated global burden of alcohol and illicit drugs use is 5.4% while tobacco is 3.7% [4]. Psychoactive substance use poses a threat to the health, social and economic fabric of families, communities and nations [5]. Drug dependence is a growing public health problem and consequences of drug dependence cost the community heavily [6]. This habit not only affects health, education and occupational career, but it also incurs a huge financial and social burden on the society. A national survey of substance use conducted among 10,609 Nigerians aged 15-64 years in the six geopolitical zones of the country recorded a lifetime prevalence of 39% for alcohol, 6.6% for cannabis and 12.2% for cigarettes [7]. In Nigeria, the most common types of used substances include stimulants and amphetamines such as caffeine, tobacco, nicotine, ephedrine; hallucinogens such as marijuana and narcotics such as heroine and codeine. Others include alcohol and sedatives [8]. These substances are largely used due to the belief that they relieve stress and anxiety, and some of them induce sleep, ease tension, cause relaxation or help users to forget their problems. The consequences of their abuse could result in physical dependence [8]. The United Nations Organizations on Drug Council [2] submitted that prevalence of any drug use in Nigeria is estimated at 14.4 per cent or 14.3 million people aged between 15 and 64 years; a situation which implies that the extent of drug use in Nigeria is comparatively high when compared with the 2016 global annual prevalence of any drug use of 5.6 per cent among the adult population. Accordingly, one in seven persons aged 15-64 years in Nigeria had used a drug (other than tobacco and alcohol) in the past year [2]. The social consequences of drug use are also evident in Nigeria. Some of which include disruption in family lives, loss in productivity and legal problems as a consequence of drug use in their communities. Also, some individuals in the general population had experienced negative consequences due to other peoples’ drug use in their families, workplace and communities [5]. Despite the highly reported consequences of substance use, in different parts of the world including Nigeria, a good number of individuals’ reports being addicted to specific drugs and presents at healthcare facilities for medical assistance [4]. In fact, in University of Port Harcourt Teaching Hospital, Rivers State Nigeria, some people who have willingly presented themselves for clinical counseling are currently on drug rehabilitation. Nonetheless, there is dearth of evidence on the prevalence of substance use disorders in Nigerian communities, a situation which justifies the need for this study on the prevalence and socio-demographic correlates of substance use disorders among individuals on drug rehabilitation in University of Port Harcourt Teaching Hospital.
Methodology (Materials and Method)
Study Design
Descriptive retrospective design was used in this study.
Study Subjects
The target population consisted of all adult males and females on drug rehabilitation in University of Port Harcourt Teaching. Only subjects who been on drug rehabilitation for a minimum period of six months and were willing to participate were included in the study. The study was conducted from January 2018 to February 2020. A sample size of 104 subjects was selected using the purposive sampling technique. Sample size determination was done using sample size determination formula by Cochran as shown below: N= Z2P (1-P)/d2 Where N= Sample size P= Prevalence of drug use = (6.6%) = [0.066] [7]. d= Sampling error that can be tolerated (0.05) Z= Level of Significance N= 1.962 0.066(1-0.066)/0.0025 = 0.2368115904 (0.856)/0.0025 =94.725 =94.7 10% non-respondent= 94.7 of 10% =9.47 N=94.7+9.47=104.17
Data Collection
The Nigerian Epidemiological Network on Drug use for drug patients who attended UPTH treatment facility from January 2018 to February 2020 were retrieved and used in the study following ethical clearance.
Data Analysis
Analysis of data was done using the Statistical Package for Social Sciences (SPSS) software version 20.
Results
Table 1 shows that majority of the respondents were males, 94.2%, had tertiary education, 75.0% and were single, 89.4%. Table 2 shows that sex of individuals influences their substance use behaviour, as majority of the respondents that uses substances/ drugs were males (P<0.05). Table 3 shows that marital status of individuals influences their substance use behaviour, as majority of the respondents that uses substances/drugs were singles (P<0.05). Table 4 shows that educational status of individuals influence their substance use behaviour, as majority of the respondents that uses substances/drugs had tertiary education (P<0.05). Table 5 shows the prevalence of substance use disorders among individuals on drug rehabilitation in University of Port Harcourt Teaching Hospital. Out of the 104 respondents, 42.3% use cannabis, 13.5% consume alcohol, 11.5% use tobacco, 9.62% use opioids, 7.69% use Tramadol, 4.81% use cocaine, 3.85% use codeine, 2.88% use Pentazocine,1.98% use cracked cocaine, while 0.96% use sedative hypnotics and hallucinogens.
Table 1: Socio-Demographic Characteristics of the Subjects (n=104).
Table 2: Sex of Subjects and Use of Substances among Individuals on Drug Rehabilitation in University of Port Harcourt Teaching Hospital (n=104).
Table 3: Marital Status of Subjects and Use of Substances among Individuals on Drug Rehabilitation in University of Port Harcourt Teaching Hospital (n=104).
Table 4: Educational Status of Subjects and Use of Substances among Individuals on Drug Rehabilitation in University of Port Harcourt Teaching Hospital (n=104).
Table 5: Prevalence of Substance Use Disorders among Individuals on drug Rehabilitation in University of Port Harcourt Teaching Hospital (N=104).
Discussion
The study findings revealed an increasing prevalence of substance use. Out of the 104 respondents, 42.3% used cannabis, 13.5% consumed alcohol, 11.5% used tobacco, 9.62% used opioids, 7.69% used Tramadol, 4.81% used cocaine, 3.85% used codeine, 2.88% used Pentazocine, 1.98% used cracked cocaine, while 0.96% used sedative hypnotics and hallucinogens. These results agree with the findings of Oshodin [8], Adamson et al. [7], Morello et al. [9] and Jegede et al. [10]. Generally, cannabis, alcohol and tobacco appear cheaper and more readily available to the average Nigerian drug user than the other substances, a situation that explains why they are more prevalent. This may not be the case in other sub- Saharan African countries and the rest of the world. It was also discovered that sex, marital and educational status of individuals influence their substance use behaviour, as majority of the subjects were males 98 (94.2%), singles 93 (89.4%), and had tertiary education 73 (75.0%). These results are in consonance with the assertion of Okpataku [11]. The married ones were less likely to use drugs etc. A possible reason for this socio-demographic correlate could be that males are usually more adventurous than the female folks! Although this assertion may be considered true to a large extent, it is actually not absolute as Adolfo et al. [12] in their study reported otherwise. They found out that drug use was more prevalent among women. The possible reason for this difference could be that of setting and culture. Whereas this present study was conducted in Port Harcourt, South-South Nigeria, Adolfo et al. [12] conducted theirs in Spain, Europe. On the other hand, drug use being more prevalent among singles could be due to the fact that they generally have more freedom and less restriction in the adventures of life more than the married, divorced and widowed etc. Also, the fact that most of the drug users had tertiary education explains the fact that growth, peer pressure or exposure to a higher degree of thinking/learning could actually predispose one to certain habits such as drug abuse etc. This may actually not be absolute globally as some other studies have identified substantial drug use among high school students, dropouts and street hustlers [2].
Conclusion
In conclusion, there is a high prevalence of drug use in the society; cannabis and alcohol are the most substances of use/ misuse. There is a significant relationship between socialdemographic characteristics of individuals and their potential to use substances as sex, marital and educational status of individuals influences the extent to which they use drugs and related items. A substantial proportion of the subjects that use substances/drugs were males’ singles and had tertiary education.
Pulsatile Vs Non-Pulsatile Intracranial Blood Flow: Animal Model of Blood Flow Restoration in Brain Tamponade
Introduction
In neurosurgical practice brain tamponade represents the ultimate limit for treatment. It is defined as a progressive intracranial pressure (ICP) increase up to values close to arterial blood pressure producing a reverberating flow pattern in the cerebral arteries with no net flow [1-3]. Nowadays, patients reaching such a condition are labeled as untreatable due to the lack of effective treatment. Decompressive craniectomy might in peculiar conditions, such as in very little children, overcome the aforementioned limit thanks to the incredible capability of a still growing brain to recover from extensive injuries but that is not the case in adult or elder patient. Throughout the literature there are several papers addressing the matter but still no clear advance was proposed. In fact, many of the papers are still at the animal levels also due to the actual difficulties in creating an ethically approvable human model. This aspect is linked to the fact the patients near brain tamponade conditions have to be rapidly treated whenever possible being hard to create a double group-controlled study. Furthermore, it is not so easy to define the actual limit in which brain tamponade become irreversible. The authors themselves, in previous papers, highlighted how even in prolonged brain tamponade conditions, metabolism inside the neuronal cells still continue even after prolonged ischemia time [4,5]. The idea of overcoming the blockage in cerebral blood flow modifying its modality derived from a previous report of residual arterial and venous pulsation even in tamponade brains [1]. In order to do so, we hereby present an animal model in which changing the modalities of brain blood supply from pulsatile to continuous it might be possible to maintain cerebral perfusion even in conditions of highly elevated intracranial pressure.
Material and Methods
Five male sheeps (30-35 Kg) were sedated using intramuscular Atropine (0,5-1 mg) and Ketamine (10 mg/Kg). Each animal was placed supine on the operating table, intubated and anesthetized with Halothane (0,8-1%) and Pancuronium Bromide (0,5 mg/h intravenously administrated). These sheeps were evaluated for the whole duration of the procedure using: a) Electrocardiogram b) Systemic arterial bold pressure (measured through a line in the obturator artery) (SAP) c) Carotid arterial blood pressure (CAP) d) Middle cerebral artery blood flow measured using doppler ultrasound (placed to an ad-hoc craniotomic window) e) ICP measured using an intra-parenchymal sensor (ICP Express Codman) placed using a parietal burr hole. Once sedated each animal was prepared in the following way. Two inguinal incisions were made to isolate the femoral arteries that were exposed trough blunt dissection and cannulated. Similarly, through a neck midline incision the carotid arteries were found and prepared. In the meanwhile, a hydraulic circuit was created to ensure extracorporeal circulation. Such a circuit was composed by sylastic tubes, a peristaltic pump, a three-liter reservoir placed at 3-meter height from the ground and lastly from a mechanism granting pulsatility in order to mimic cardiac output. This mechanism is composed by an electric engine connected to a piston compressing the elastic portion of the tube exiting the reservoir. By doing so modifying the compression speed and the distance of the piston from the tube is possible to modify pulsation frequency and amplitude. The described circuit has three terminals, one for each femoral artery and the remaining one for the left carotid artery (the terminal ends with a Y connector). The whole circuit is replenished before starting with saline solution added with 25000 unit of heparin in order to avoid clotting inside it. To avoid animal hypovolemic state, the reservoir is filled with a liter of saline solution before starting. To create a condition of intracranial hypertension saline solution will be sent into the subdural space using a 20 Gauge needle inserted through a small, angulated burr hole which is also sealed with acrylic resin in order not to let the fluid escape around the needle. Infusion flow speed was regulated according to the parameter measure by the intra-parenchymal sensor. After clamping of the brachiocephalic trunk, the circuit can be activated. Whenever doing so, the blood taken from the femoral arteries is aspirated and carried into the reservoir from where, thanks to gravity, it flows into the left carotid artery. Thanks to the Y connector the blood in the left carotid artery can flow both toward the brain and towards the base of the brachiocephalic trunk granting blood supply to the whole brachiocephalic territory. The pulsation machine intervenes in this setting in order to transform a pulsatile flow into a continuous one without creating relevant changes in medium arterial pressure. Once completed animal preparation, three different experimental conditions were evaluated in order to measure the cerebral perfusion pressure (CPP=CAP-ICP) value at which cerebral blood flow (CBF) blockage appear in each of them. The aforementioned conditions are: a) Normal condition b) Continuous laminar flow created using EC c) Combined model. In this model the brain is submitted to pulsatile circulation created with the aforementioned pulsatile machine in EC switching in a second moment to continuous flow in order to evaluate differential response to flow modifications. At the end of the experiment the animals were sacrificed being still under general anesthesia using an intravenous administration of 10 mEq potassium chloride. The whole experiment was carried on in accordance with the EU Directive 2010/63/EU for animal experiments.
Results
A. Model 1: mean CAP value is 110 mmHg (ranging from 100 to 130 mmHg) while mean ICP value is 15 mmHg (ranging from 12 to 18 mmHg) and mean MCA speed is about 10 cm/sec. Starting saline subdural infusion, ICP value start increasing while CBF progressively decrease. This process continues until ICP reaches 70 mmHg with consequential CBF blockage. Even though no blood flow can be measured at this moment, CPP is still present and greater than 40 mmHg. At the same moment, a different behavior of CBF velocity can be observed. In fact, even if CPP is still present flow velocity reaches zero concomitantly wit tamponade. Both observations tend to recover baseline condition once stopped infusion. B. Model 2: the initial increase in ICP and decrease in CBF speed is the same of model 1 but, unlike with pulsatile flow, CBF arrest is reached with higher ICP value. In fact, ICP values similar to CAP are needed in this case with a residual CPP of 15-16 mmHg to observe cerebral tamponade. The observation concerning CBF speed overlaps what seen in model 1. As in model 1 this condition is reversible after infusion arrest. C. Model 3: the combined model shows firstly how normal cardiac circulation can be achieved using pulsatile EC with similar results on CPP and CBF speed. On the other hand, it shows how, switching from pulsatile to continuous flow in absence of relevant changes in CPP, a gradual and stable intracranial circulation can be obtained as documented by doppler ultrasound. The aforementioned results are summarized in Figure 1.
Figure 1: Blood flow velocity in different circulations.
Discussion
Throughout the literature, there are very few reports regarding flow typology in intracranial circulation. Such papers are mostly related to intracranial changes after ischemic heart failure. Reviewing the literature trying to select the most fitting papers, only two authors slightly address the problem. the first one only mentions non pulsatile blood flow as something unclear as well as a potential sign for proximal arterial occlusion [6], while the other one, suggests the importance of pulsatile flow during reperfusion without addressing at all flow modifications during tamponade [7]. To overcome such a lack of evidence on the matter, the authors devised the presented experiment. The aim was to analyze whether changing cerebral blood flow from pulsatile to non-pulsatile was possible to overcome brain tamponade. Such an experiment was founded on the idea that the very “normal” blood pulsation coupled with Starling resistor functioning is at the base of cerebral tamponade. Physical laws states that flow is driven by the presence of a pressure gradient between two compartments connected by a channel. Thus, as long there is a gradient there will be flow, no matter how small the caliber of the channel will become. Flow stops then after the closure of the channel or after disappearance of the gradient. The application of such physical law to the intracranial system were evaluated for the first time by Chopp et al. who created a model simulating the intracranial space and its modifications during infusion tests [8]. In order to describe what happen in normal conditions, it is important to remember that intracranial circulation is pulsatile and that pressure wave propagation speed inside the vascular system is slower than the liquoral one due to the resistance in capillaries and veins. Thus, whenever there is an increase in intracranial pressure, the aforementioned difference in transient propagation speed lead to an early closure of the veins and of the Starling resistor before intravasal pressure could match outer one maintaining positive flow. When the vein walls contact each other the possibility to re-open is lost leading to tamponade. On the other hand, if the circulation were non-pulsatile a net flow would be always present thanks to the persistence of pressure gradient. Such persistence is granted by the absence of a pulsation wave preventing the previously described vein closure mechanism. The channels will become smaller in an asymptotic way never actually closing and preventing the reach of zero net flow. Obviously, this situation is theoretical and in reality, the channels will eventually close, but a greater intracranial pressure would be needed. In order to demonstrate such an assumption, we have created a model of selective extracorporeal brachiocephalic circulation in order to send laminar flow to the brain without affecting body circulation. The selection of the sheep as animal model was made in order to simplify the experiment having this animal a peculiar anatomy of the brachiocephalic trunk. In fact, in this setting all of the vessels, emerging in the human from the aortic arch, start from this trunk. From left to right it emerges first the left subclavian artery the two carotid arteries and last the right subclavian artery. Such conformation simplifies the experiment granting the selectivity control of the cerebral blood flow through the manipulation of a single vessel. Nonetheless, it is important to remember that collateral circulation might be present in selected cases reducing the power of the experimental model. In the sheep model though, such collaterals disperse most of their contribution to the spinal roots and to the neck muscle making the amount of cerebral distribution negligible. Dividing the experiment into three moments granted us the possibility not to miss biases in the model. In model 1 the authors confirmed a similar trend between sheeps and humans regarding brain tamponade. Blood flow ceases concomitantly with an increase of ICP over CPP reaching brain tamponade even in condition of persistent low CPP. Model 2 differs from model 1 in the need for a higher ICP value to reach tamponade and flow absence. Such a finding suggests a higher threshold to be reached in order to cause it. Finally, model 3 unites the previous ones and improves them showing how a change in flow type might overcome a preexisting tamponade situation offering a possible novel treatment strategy. The most striking data reside in the reappearance of blood flow during tamponade after the change from pulsatile flow to continuous one.
Conclusion
Brain tamponade in neurosurgery represents nowadays the terminal line for treatment. Every effort has to be made in order to find a way to overcome such a limit. Our data might represent the first step in that direction showing how changing cerebral flow even tamponade can temporarily overcome. Even though this is only an animal experiment it might open the way to further animal experiment and thus to human ones.