Biomedical Journal of Scientific & Technical Research (BJSTR) is a multidisciplinary, scholarly Open Access publisher focused on Genetic, Biomedical and Remedial missions in relation with Technical Knowledge as well.
Author: biomedicalopenaccessjournals
The only motto of Biomedical Journal of Scientific & Technical Research (BJSTR) Publishers is accelerating the scientific and technical research papers, considering the importance of technology and the human health in the advanced levels and several emergency medical and clinical issues associated with it, the key attention is given towards biomedical research. Thus, asserting the requirement of a common evoked and enriched information sharing platform for the craving readers.
BJSTR is such a unique platform to accumulate and publicize scientific knowledge on science and related discipline. This multidisciplinary open access publisher is rendering a global podium for the professors, academicians, researchers and students of the relevant disciplines to share their scientific excellence in the form of an original research article, review article, case reports, short communication, e-books, video articles, etc.
Intradural Pressure Profile after Administration of Totilac® Compared to Mannitol® for Patients Undergoing Hematomal Evacuation Craniotomy
Background
Hemmorhage cerebral injury requires management to control the increase in intracranial pressure (ICP), including the surgical strategy and administration of hyperosmolar solution [1]. The hyperosmolar solution that has been widely used is mannitol 20% (Mannitol®). Mannitol® increase diuresis directly in the loop of Henle. Hypertonic sodium lactate (Totilac®), a relatively new hyperosmolar solution, can be used as an alternative in the management of increased ICP [2]. Besides having an higher osmotic reflection coefficient (σ), [3] the lactate content can theoretically be an energy source for ischemic brain cells [4]. Totilac® has the potential to increase diuresis indirectly by increasing intravascular volume [5]. From these properties, totilac® with the basic component of hypertonic saline, is considered superior in maintaining intravascular volume compared to mannitol®. Therefore, we want to compare the intradural pressure profile after administration of Totilac® and Mannitol® in patients undergoing hematomal evacuation craniotomy.
Methods
The study was conducted at a tertiary care hospital during April-July 2018. The study was approved by the Medical and Health Research Ethics Committee of FKKMK UGM and Dr. Sardjito Hospital. Informed consents were acquired from all subjects before participating in this study. The patients included for the study aged 18-65 years and who underwent emergency hematomal evacuation craniotomy for indications of intracerebral hematoma (ICH) or subdural hematoma (SDH). The exclusion criteria were unresolved shock, ongoing massive bleeding, allergic to lactate, impaired renal function, hyponatremia [Na+] <130 meq / L, hypernatremia [Na+]> 150 meq / L, history of uncontrolled diabetes mellitus, history of uncontrolled hypertension. The study subjects were allocated into two groups using permuted block techniques randomization. Group M received mannitol®, whereas group T had Totilac®. The allocated group information was given in a sealed envelope when the patient arrived at the surgery room. In operating room, Anaesthesia was induced with 2.5 mg of midazolam, fentanyl 2 mcg/kg, propofol 2 mg/kg, lidocaine 1.5 mg/kg, and rocuronium 0.6-1 mg/kg for tracheal intubation.
Anaesthesia was maintained with sevoflurane 2% with delivery gas of FiO2 50%. The depth of anesthesia was monitored by maintaining bispectral index value between 40-60. Controlled ventilation was set with a tidal volume of 6-8 ml/kg, PEEP 3-5, a minute volume of 80-120 ml/kgBW/ minute and a maximum peak inspiratory pressure of 30 mmHg. Maintenance fluid was given according to the needs of patients with a composition of 0.9% NaCl:RL = 3: 1. Blood lost was replaced with colloids with the same volume. Blood component was given if the bleeding exceeded maximum allowable blood lost. Another crystalloid was given to replace the urine output with 2/3 of the volume of it. Baseplate of invasive monitor were placed at the level of the tragus, following changes in the position of the patient. Invasive monitors were prepared with CVP mode on a scale of 0-30 and being zeroed every time a subject changes position. Intradural pressure measurement was performed by the surgeon through puncture using needle no.23 when the duramater was still intact.
The needle was placed in the subdural space parallel to the duramater then was connected to an invasive monitor device. The intradural pressure, hemodynamic and other parameters are measured when opening the cranium as a baseline, 5th, 10th and 15th minutes after hypertonic solution administered by rezeroing before recording the value. Analyses were done on all subjects who had received treatment according to the protocol. Data were expressed in terms of numbers and percentages, mean and standard deviations. The data between the two groups were analyzed for differences using independent t‑tests or paired t-test for numerical data and Chi square tests for categorical data. Data were analysed using SPSS 24 software computer program.
Results
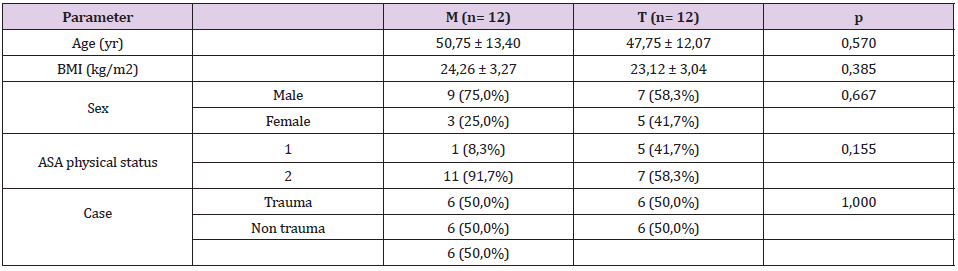
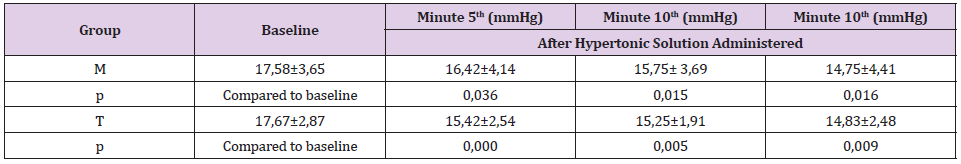
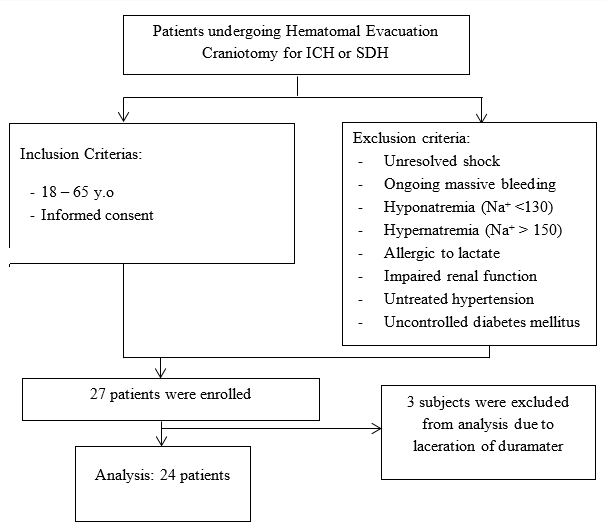
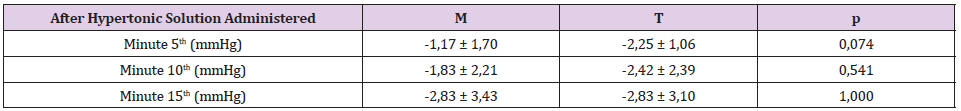
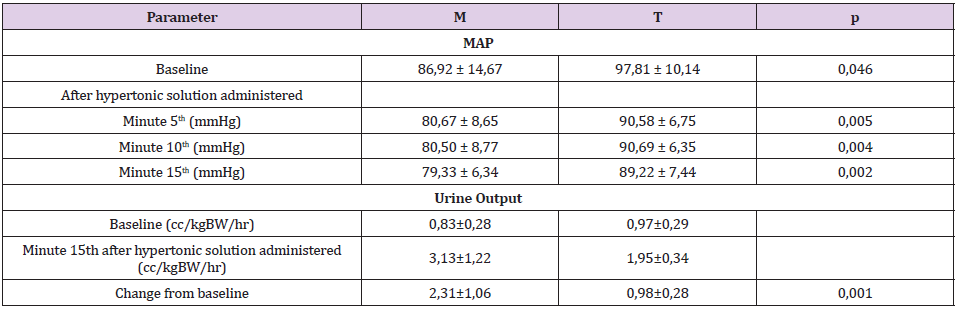
A total of 27 patients were assessed for eligibility for this study. Randomization was performed on 27 patients. As shown in Figure 1, 3 subjects were excluded from analysis because of unable to follow the study procedure due to laceration of duramater during craniotomy. One-third of subjects are women as shown in Table 1. The average age of the subjects in group M was 50.75 + 13.4 years and in the T group it was 47.75 + 12.07, which was not difference significantly. There was no difference in the ratio of BMI and physical status based on ASA physical status (p= 0.667 and 0.155, consecutively). The distribution of trauma and non-trauma cases was also balanced in both groups. The level of brain relaxation was assessed in this study by measuring intradural pressure. Table 2 shows significant decreases of intradural pressure in the 5th, 10th and 15th minute after hypertonic solution administered in each group compared to baseline when the cranium was opened. Table 3 shows the change from baseline in intradural pressure between groups at 5th, 10th, 15th minute after hypertonic solution administered were similar. The difference in MAP between groups was found to be significant at all periods of measurement, as shown in Table 4. Group M has higher change from baseline of urine production at the end of observation compared to group T, as shown in Table 4.
Table 1: Demographic Data.
Table 2: Mean of intradural pressure compared to baseline.
Figure 1: Study sample.
Table 3: Mean of intradural pressure change from baseline.
Table 4: MAP and urine output.
Discussion
In this study, there was a significant decrease in intradural pressure in each group. It is well known that Mannitol® and hypertonic sodium lactate solutions with its hyperosmolar properties are part of ICP control management. The most significant decrease in group M occurred in the 10th minute after the cranium was opened, whereas the T group experienced the highest difference in the 5th minute after the cranium opened. This shows a different peak onset difference in each solution, although it is stated that Mannitol® peak onset and hypertonic sodium lactate solution are almost correspondent (15-20 minutes) [5]. Properties of hypertonic sodium lactate solutions that draw fluids from interstitial to intravascular be superior in controlling cerebral edem because its reflection coefficient is greater than Mannitol [5]. A study by Hisam, et al. showed hypertonic sodium lactate had a significantly better brain relaxation effect than Mannitol® assessed from a comparison of brain relaxation assessed subjective when an open cranium with BRS in COT [6].
Sokhal, et al. found that there was a significant difference in the decrease of intradural pressure in both groups with tumor removal craniotomy, but brain relaxation assessed by operators with the BRS method in the study did not differ significantly between the two groups. In this study, the difference in intradural pressure was not linearly related to brain relaxation that occurred, because the determinant component of ICT was not only from brain relaxation, where large tumor mass and intravascular volume also played a role in determining intradural pressure [7]. Previous studies conducted by Sharma, et al. the number of samples of 31 subjects who underwent aneurysm repair surgery also showed a meaningless difference in the decrease in intracranial pressure between groups M and T [8] this result is due to the aneurysm surgery itself the incidence of extravasation of fluid is not promising. Wirawijaya, et al. revealed no significant differences in brain relaxation in patients with craniotomy surgery to remove tumors that received 3% NaCl, Mannitol, and hypertonic sodium lactate [9].
In addition, nutritional support in the form of exogenous lactate that can be a source of energy in injured cells also decreases the progression of intersective edema resulting from cell death [2,10]. The study conducted by A Daniel (2014) states that lactate supplementation is an important component in brain metabolism that is experiencing injury, especially in the penumbra region that has the potential to experience cellular death [11]. Hamzah, et al. showed that ATP biomarkers in experimental animal models that experienced ICH experienced a significant increase in the administration of hypertonic sodium lactate solution compared to Mannitol® and NaCl 3%. The study also suggested that the comparison of the area of necrosis in the animal brain was significantly different, whereas in the hypertonic sodium lactate group it was much smaller than in the Mannitol® group, with p = 0,000.10 but they did not mention the correlation between the two findings.
The effect of diuretic Totilac® solution on the results of the study was significantly lower than Mannitol®. Previous research also showed similar results [6-9]. This was due to the Mannitol® properties acting in the loop Henle which resulted in increased urine production. In contrast to hypertonic sodium lactate, the diuretic effect is a result of increased intravascular volume, so that increased urine production is not a direct influence on the organ of urine formation. Based on this, hypertonic sodium lactate is a better choice in patients with intravascular volume disorders, because the diuretic effect of hypertonic sodium lactate will not appear in conditions of hypovolemia or dehydration [5]. The results of the insignificant decrease of intradural pressure in this study can be caused by the duration of the onset of the incident until the intervention was performed. In addition, the possibility of still active bleeding also affects intradural pressure. Even though brain relaxation has been achieved, the addition of volume in the third space can also increase intradural pressure. We could not manage this parameter and analyze it because we could not evaluate hematoma enhancement during surgery.
For the next research, it is necessary to do a comparative test of quantitative assessment methods using invasive monitors with BRS. A comparative study of the size of the needles used also needs to be done, so that it can avoid the possibility of blockages and clinging during the measurement period while not causing premature trauma to the dura mater. The use of invasive monitor equipment in this study is still relatively new even though it has been proven to determine the magnitude of pressure on other body locations. The use of needle number 23 can still allow for blockages and slacking during the measurement period.
Conclusion
Totilac® administration had similar intradural pressure profile effect compared to Mannitol® in hematomal evacuation craniotomy case.
Extensive Proof-of-Concept Studies in TNF-Alpha Antagonists might be Responsible for A Delay of Patient Access in Pediatric Rheumatology
Introduction
In order to improve the route to market for approved pediatric therapeutics, the current Pediatric Regulation in the EU and the Food and Drug Administration (FDA) Amendments Act (FDAAA) were both adopted in 2007. These include incentives for the pharmaceutical industry to perform pediatric clinical studies, for example granting an extended patent protection time or marketing exclusivity for orphan medicinal products for a limited period. Between 2007 and 2013, the European Medicines Agency (EMA) and its Pediatric Committee assessed more than 600 pediatric investigation plans (PIPs) with an aim to provide data on the efficacy and safety of medicines for diseases of children. After almost a decade of experience of PIPs, it seemed important to evaluate the usability of data derived from clinical trials for new medicinal products in children for marketing authorization. This is particularly important in order to understand the need for, and extent of, clinical studies for new drugs in children in the future. The aim of this study is to evaluate whether proof-of-concept clinical trials need to be carried out at the existing rate and frequency, and whether data to support the use of new drugs in children can be extrapolated from adult trials of equivalent indications with focus on rheumatology. This evaluation should help to outline new guidance for clinical trials for new drugs in children to prevent unnecessary extensive trials of ‘me-too’ drugs.
Strategy
The review compared the effects of immune-modulatory drugs in adults and children, selected using the following criteria: a) Biologics in the same class to treat arthritis b) Clinically tested for the same or a similar indication in children and adults c) Subject to a PIP in children and approved for use in adults. Drugs selected for this review are biologics targeting TNF-α including adalimumab, etanercept, golimumab, and infliximab.
TNF-α Inhibitors Tested in Adults and Children
Etanercept (Enbrel, Pfizer) is a soluble decoy receptor for TNF. It was the first TNF-α inhibitor launched for treatment of RA. The drug was FDA-approved in November 1998, and by the EMA in February 2000. It is approved for the treatment of RA, JIA, psoriatic arthritis, plaque psoriasis and ankylosing spondylitis [1] as the first biologic to treat JIA. Adalimumab (Humira, Abbot [now: AbbVie]) is a monoclonal anti-TNF-α inhibitor. It was the first fully human IgG1 protein to be approved by the FDA in December 2002. It was approved by the EMA in September 2003. Adalimumab is indicated for the treatment of RA, JIA, psoriatic arthritis, ankylosing spondylitis, Crohn’s disease, psoriasis and ulcerative colitis [2]. It was approved for JIA in 2008. Golimumab (Simponi, Janssen Biotech) is a human anti-TNFα IgG1κ monoclonal antibody. Golimumab was approved in US and Canada as a treatment for RA, psoriatic arthritis, and spondylitis, and is undergoing regulatory review in the EU [3] for these indications. Golimumab missed the primary endpoint in JIA. Infliximab (Remicade, Janssen Biotech) is a chimeric monoclonal antibody directed against TNF-α which induces apoptosis in TNF-α-receptor + cells. Infliximab is only approved for RA. It failed to meet primary endpoint in JIA and therefore has not been approved by the FDA in children for JIA. A waiver for the PIP was agreed in the EU. Infliximab is used off label in JIA as it has not been approved for this indication.
Search Strategy
The search was focused on RA in adults and on JIA, prescribing information, clinical trials websites and the FDA and EMA websites in order to identify relevant study information [4-16]. Keywords employed for the searches: Adalimumab, etanercept, golimumab, infliximab; juvenile idiopathic arthritis, JIA, juvenile rheumatoid arthritis, JRA, systemic juvenile idiopathic arthritis, SJIA, polyarticular juvenile idiopathic arthritis, PJIA; pediatrics, children, adults; tumor necrosis factor inhibitors, TNF-α, phase III.
Statistical Meta-Analysis
Statistical analysis was performed using a logistic regression with random effects. The primary outcomes are the ACR50 and ACR70. The dependent variable is the number of patients who reach ACR50 or ACR70 based on the total number of patients treated. Independent variables are treatment, age group (children vs. adults) and time. Treatment is a categorical variable, which compares several treatment regimens with placebo. As not every study has a placebo control arm, we therefore performed an implicit comparison with placebo. The variance of the random effects takes the variability between studies into account. Moreover, as several time points within a study are considered, this model takes also within study correlation into account. The comparison aimed to reveal different treatment responses in children compared to adults. This comparison is quantified using the odds ratio with a 95% confidence interval. Additionally, the response probability adjusted for treatment and time is given with a 95% confidence interval for each group. Calculations were performed with prpc glimmix, SAS 9.4.
Results
A comparative analysis using clinical and pharmacokinetic data was performed, based on data obtained from pivotal studies of biologics for the treatment of inflammation in children vs. adults and evaluated in terms of efficacy, safety and dose used. In total, one or two pivotal pediatric trials, and four to seven pivotal studies in adults for all biologics were identified. All drugs were given as either monotherapy or in combination with methotrexate, and either placebo-controlled or without control. The following section summarizes results (Tables 1-6) obtained from meta-analyses.
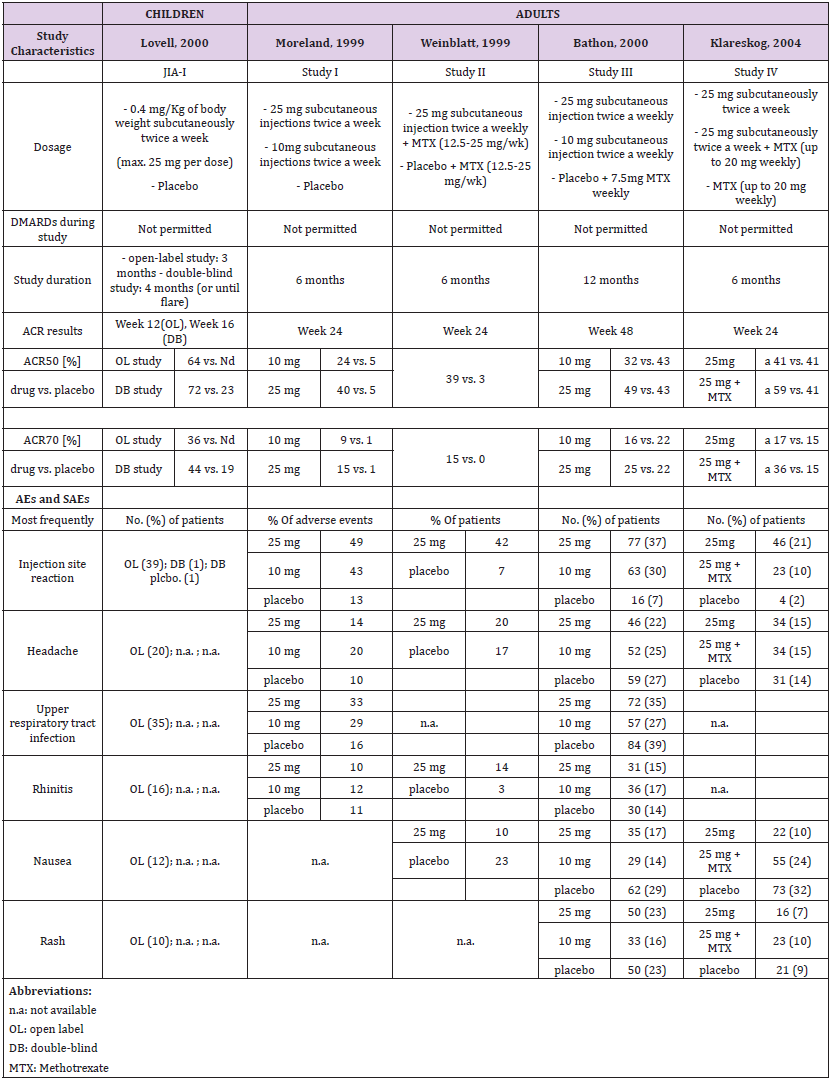
Table 1a: Comparison of clinical trials with etanercept in children and adults.
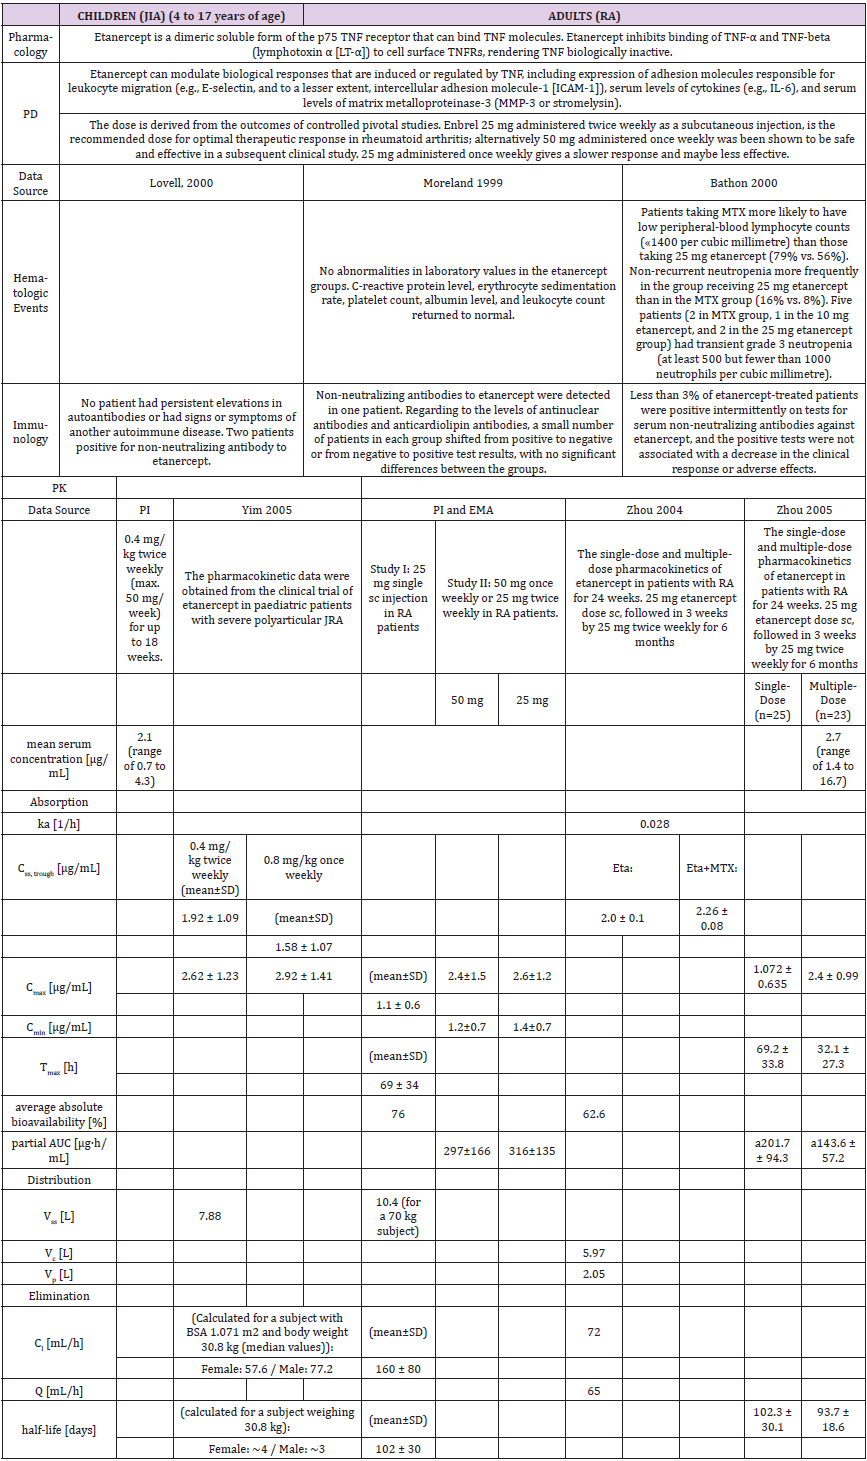
Table 1b: Pharmacology data of clinical trials with etanercept in children and adults.
Abbreviations: PD: Pharmacodynamics PK: Pharmacokinetics ka: First-order absorption rate constant Css, trough: steady-state trough concentration Cmax: Maximum serum concentration Cmin: Minimum serum concentration Tmax: Time to reach the maximum concentration Vss: Distribution volume Vc: Volume of distribution in the central compartment Vp: Volume of distribution in the peripheral compartment Cl: Clearance Q: Intercompartment clearance
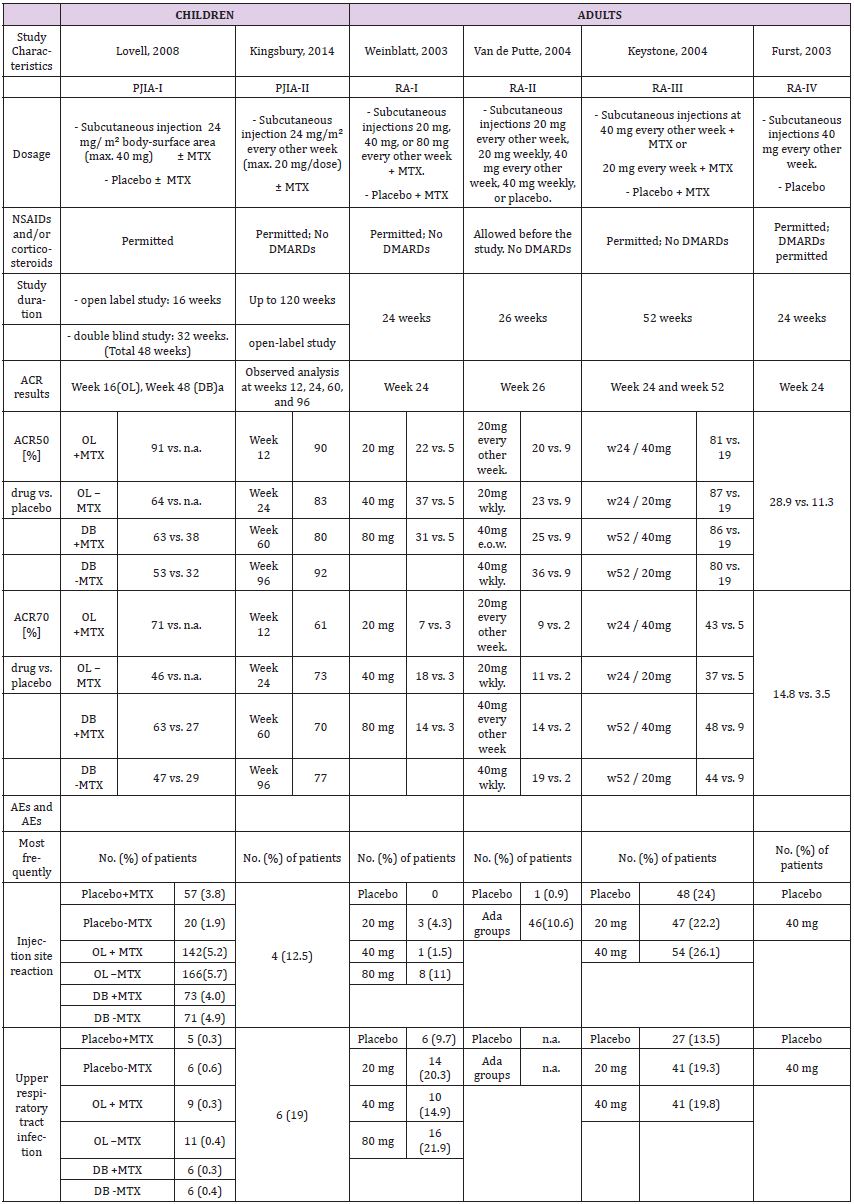
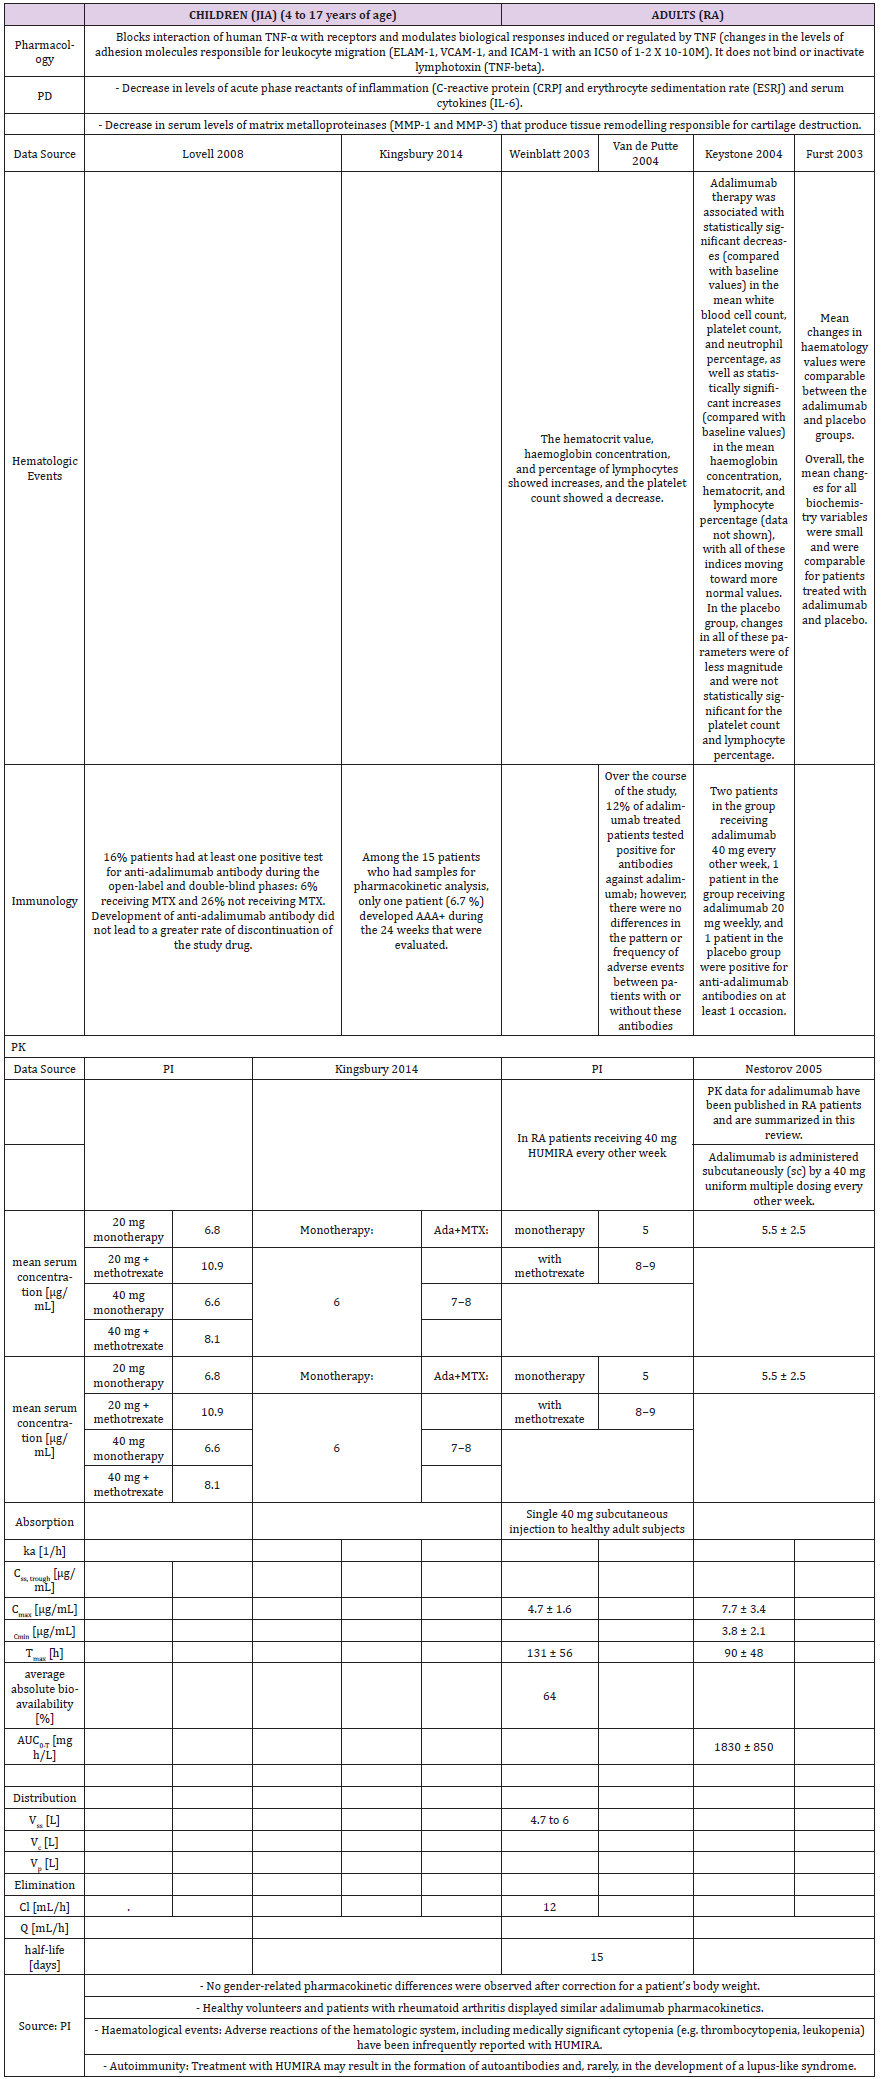
Table 2a: Comparison of clinical trials with adalimumab in children and adults.
Table 2b: Pharmacology data of clinical trials with adalimumab in children and adults.
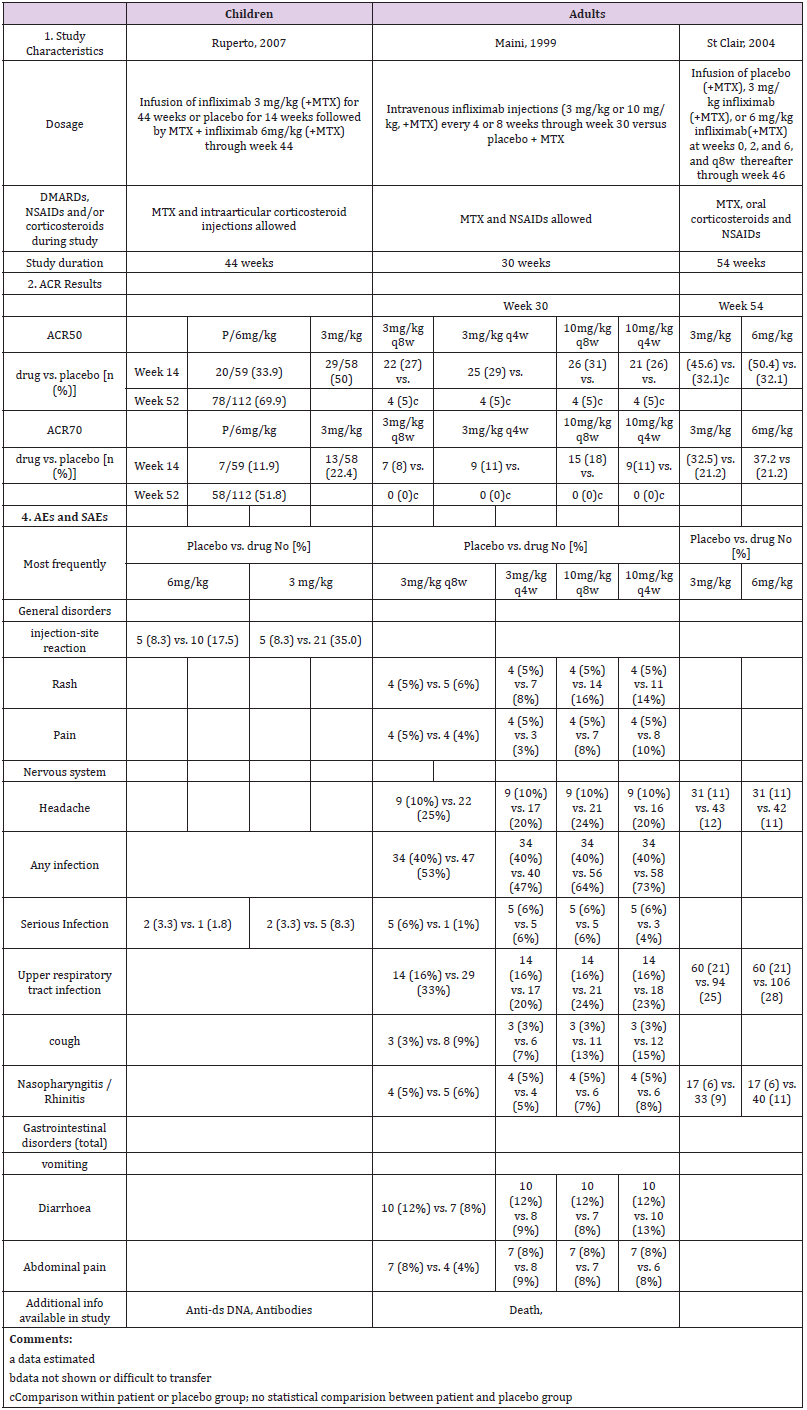
Table 3a: Comparison of clinical trials with infliximab in children and adults.
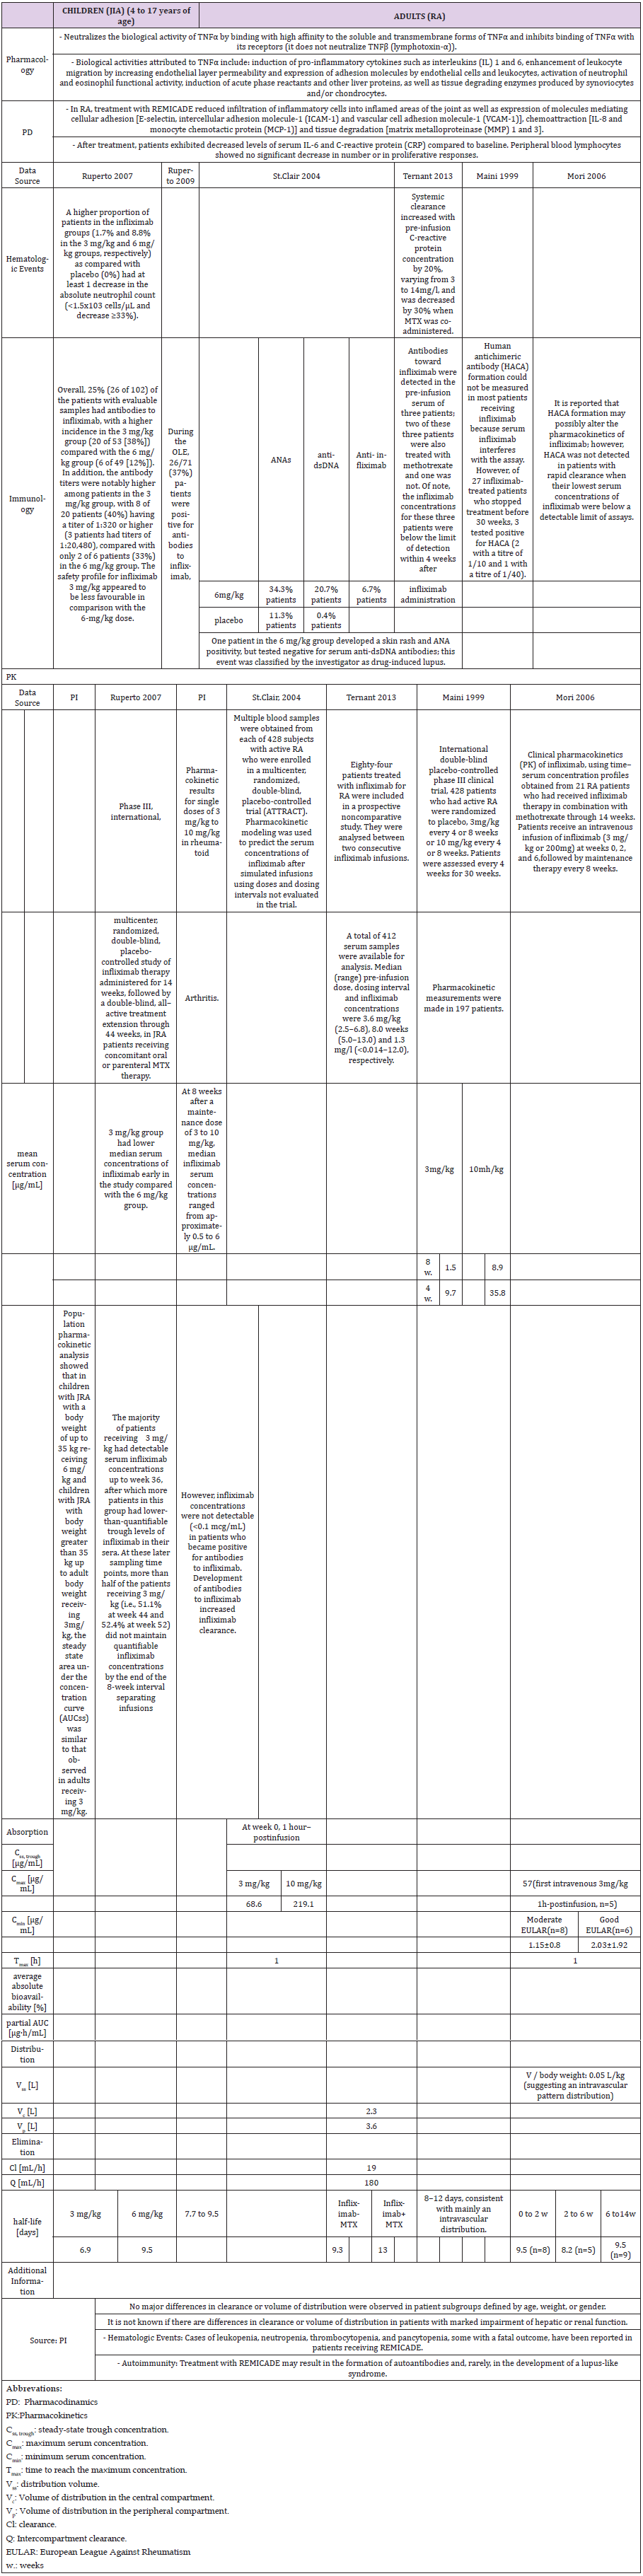
Table 3b: Pharmacology data of clinical trials with infliximab in children and adults.
Table 4: Meta-Analysis: Results on ACR50 and ACR70 for etanercept showed a treatment effect for etanercept.
Table 5: Meta-analysis: Results on ACR50 and ACR70 for Adalimumab. Comparative data for adalimumab studies in children and adults confirmed a treatment effect in both groups.
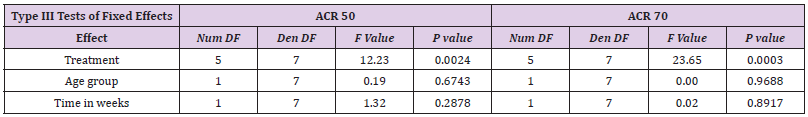
However, there is no statistically significant treatment difference effect in the between-age or study-duration group for the endpoints ACR 50 and ACR 70.
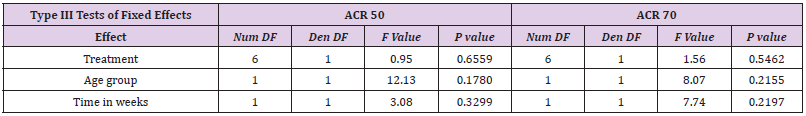
Table 6: Meta-Analysis: Results on ACR50 and ACR70 for infliximab. Meta analysis of study data on infliximab shows no statistically significant treatment effect between adults and children.
We do not present forest plots for infliximab due to numerically instable results.
Etanercept
A single pediatric clinical trial (JIA-I [17]) in 2000 was identified from the drug prescribing information (Table 1a). This trial involved a total of 120 patients; 51 were part of a double-blind, placebo-controlled study with a nearly 1:1 ratio (26:25), and 69 participated in an open-label trial with etanercept only. A total of four studies in RA in adults, two in 1999 (Study I [18] and II [19]), one in 2000 (Study III [20, 21]) and one in 2004 (Study IV [22, 23]) were identified. Two compared etanercept with placebo, and two compared etanercept with methotrexate.
Dosage and Study Duration
Children were dosed for three to four months with 0.4 mg/ kg bw etanercept, and a maximum of 25 mg per dose. Across all studies, adults received 10 or 25 mg etanercept over a period of six or twelve months. Only two trials [17, 24] included a placebo in the control arm and etanercept only in the study drug arm. All other trials in adults were performed in combination with methotrexate in experimental and placebo groups (Table 1a).
ACR Response
Assessment of the ACR study data differed between children and adults. The pediatric studies used the ACR30, ACR50 and ACR70 criteria and the adult studies the ACR20, ACR50 and ACR70 criteria. Thus, only the data for ACR50 and ACR70 could be considered for direct comparison (Table 1a and Figure 1). In addition, the selected time schedule for ACR assessment differed greatly between studies. While ACR50 and ACR70 were evaluated in week 12 or 16 in children, these were evaluated in week 4, 24 or week 48 in adults. Only Study II and Study IV showed an assessment in week 12. The respective numbers had to be estimated from figures in the publication. In the JIA study of Lovell et al., 64% of the 69 patients met the definition of 50% improvement, and 36% the definition of 70% improvement at the end of the study [17]. There was a similar rate in the Moreland et al., study (59% of the 25 mg group achieved an ACR20 response and 40% achieved an ACR50 response) at 24 weeks [24].
The response rate achieved with etanercept treatment in combination with methotrexate varied between 39-59% for ACR50 at 25 mg and 15-36% for ACR70 at 24 weeks in all other three studies in adults. Meta-analysis showed a treatment effect for etanercept in both, adults and children. However, no effect of age or study duration on the treatment effect could be measured (Table 4 and Figure 1). Thus, the results obtained on drug efficacy and dose showed no difference in adults and children.
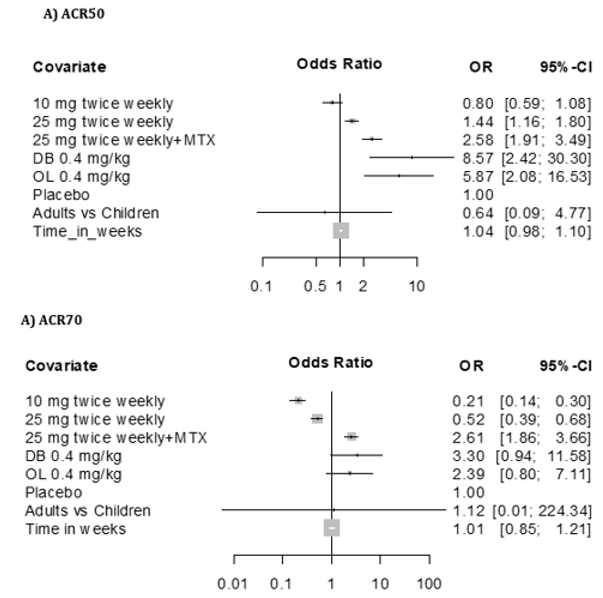
Figure 1: Forest plot results on ACR50 (A) and ACR70 (B) ETANERCEPT as graphical representation of the meta-analysis here includes five studies [17-20]. The first column shows names of the covariates in the model. Odds ratios for dose levels are reported with placebo as the reference. Results are shown together with 95% confidence interval. The black dot on each line shows you the odds ratio for each variable.
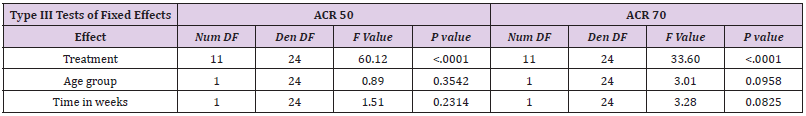
Meta-Analysis Results of ACR50 AND ACR70
Results of mixed-effects logistic regression for adults and children concerning treatment effects, age group (adults vs children) and study duration (time in weeks) can be viewed in the following tables. numDF, degrees of freedom of term; denDF, degrees of freedom of error term; F, variance ratio; P, error probability; critical value of significance: p<0.05.
Adverse Events
Most frequent adverse events (AEs) in both children and adults were injection site reaction, upper respiratory tract infection, headache, rhinitis, nausea and rash. The drug demonstrated a favorable risk-benefit profile in children and adults. No lifethreatening events were observed (Table 1a).
Pharmacokinetics
The population pharmacokinetic analysis by Yim et al. confirmed that 0.8 mg/kg once weekly and 0.4 mg/kg twice-weekly subcutaneous regimens of etanercept had equivalent clinical outcomes. This served as a basis for the recent FDA approval of the 0.8 mg/kg once-weekly regimen in pediatric patients with JRA [25] (Table 1b).
Adalimumab
Two pediatric clinical trials, PJIA-I [26] and PJIA-II [27], were identified in the prescribing information. These were carried out in 2008 and 2014 and involved a total of 336 patients; 133 as part of a double-blind, placebo-controlled study (75 received methotrexate as supplemental therapy, 58 did not) and 203 in an open-label trial with adalimumab with or without methotrexate (112 and 91, respectively) (Table 2a). In comparison, five pivotal studies in adults, two in 2003 (RA-I [28] and RA-IV [29]), two in 2004 (RA-II [30] and RA-III [31]) and one in 2006 (RA-V [32]) were identified. Two compared adalimumab to placebo, and two were placebocontrolled plus methotrexate. One study compared adalimumab to methotrexate only, as well as to adalimumab plus methotrexate.
Dosage and Study Duration
The studies in children were carried out over 12 to 30 months with 24 mg/m² adalimumab, and a maximum of 20 or 40 mg per dose. Adults received 20, 40 or 80 mg over a period of six, six and a half or 13-24 months. The drug was given subcutaneously in all cases. The PI allows 10, 20 or 40 mg for children, depending on the body weight, and 40 mg is the approved dosage for adults as described in PI (Table 2a).
ACR response
Assessment of ACRs included were ACR30, ACR50, ACR70 and ACR90 for children, and ACR20, ACR50 and ACR70 for adults. Children were evaluated in week 12, 16, 24, 48, 60 and/or 96, and adults in week 24, 26, 52 and/or week 104. Thus, only ACR50 and ACR70 at 24 weeks are comparable (Table 2a and Figure 2). PJIA-II and RA-I, RA-III and RA-IV assessed ACR50 and ACR70 in week 24. However, these studies are not well comparable as their design differs considerably. PJIA-II was a placebo-controlled study, while RA-II and RA-III tested placebo plus methotrexate. RA-IV was also placebo-controlled, but allowed DMARDs during the study, whereas PJIA-II did not. Only studies with adalimumab in combination with methotrexate at week 24 were eligible for ACR50 and ACR70 comparative analyses. In the pediatric study PJIA-II, 83% of patients achieved ACR50, and in the adult RA-I study, 22% reached ACR50 at week 24 with 20 mg maximum dose treatment. In the PJIA-I study, ACR50 was achieved in 64% of the children at the 40 mg maximum dose compared with 37% in the RA-I study, 86% in the RA-III study and 59% in the RA-V study, respectively. 73% of children achieved ACR70 in the PJIA-II study, whereas only 7% and 9% of adult patients using 20 mg at 24 weeks were comparable as demonstrated in the RA-I and RA-II studies, respectively. At a 40 mg dose of adalimumab the response varied between 46% and 71% at weeks 16-48 in the PJIA-I study compared with 37%, 23%, 86% and 59% with the combination of adalimumab and methotrexate in adults in RA-I, RA-II, RA-III and RA-V studies, respectively.
Figure 1: Forest plot results on ACR50 (A) and ACR70 (B) ADALIMUMAB, includes seven studies in the meta-analysis [25-31]. The first column shows names of the covariates in the model. Odds ratios for dose levels are reported with placebo as the reference. Results are shown together with 95% confidence interval. Odds ratios for dose levels are reported with placebo as the reference. Results are shown together with 95% confidence interval.
Meta analysis of ACR50/70 revealed that comparative data for adalimumab studies in children and adults confirmed a treatment effect in both groups. However, there is no statistically significant treatment difference effect in the study duration for the endpoints ACR 50 and ACR 70 (Table 5 and Figure 2). Similar to etanercept, results obtained on adalimulab on efficacy and dose showed no difference in adult and children.
Adverse Events
The most common event was injection site reactions. The most common AEs leading to discontinuation of adalimumab treatment were clinical flare reaction, rash and pneumonia. The rate of serious infections was 4.6 per 100 patients (Table 2a).
Pharmacokinetics
A higher apparent clearance of adalimumab in the presence of Neutralizing anti-adalimumab antibody (AAA) and lower clearance with increasing age in patients aged 40 to >75 years was observed in population pharmacokinetic analyses in patients with RA. No gender-related pharmacokinetic differences were observed after correction for a patient’s body weight. Healthy volunteers and patients with rheumatoid arthritis displayed similar adalimumab pharmacokinetics. Cmax, Tmax, bioavailability and elimination values are only available for adults as described in the PI (Table 2b).
Golimumab
Golimumab has been confirmed to be an effective treatment for patients with RA in phase III clinical trials as evaluated by traditional measures of disease activity. The efficacy and safety profile of golimumab appears to be similar to other anti-TNF agents. However, golimumab has the potential advantage of once monthly subcutaneous administration and the possibility of both subcutaneous and intravenous administration. A study of CNTO 148 (golimumab) in children with juvenile idiopathic arthritis (GO-KIDS trial) to evaluate the efficacy and safety of golimumab is ongoing. This study enrolls patients who have active JIA and at least five joints with active arthritis that have poor response to methotrexate. The GO-KIDS trial consists of three parts and aims to assess the efficacy and safety of golimumab in pediatric patients aged 2 to <18 years with active JIA with a polyarticular course (at least five joints) despite therapy with methotrexate (10 to 30 mg/m²/week) for at least 6 months [33]. The trial involved 173 patients (87.9% white, 75.7% female; median age 12 years, age 2 to 17 years) with moderately active disease. Nineteen (11%) patients discontinued in part 1 of the trial due to lack of efficacy (n=14), adverse effects (n=4), and withdrawal of consent (n=1).
Dosage and Study Duration
The drug (the usual adult dose for RA of an initial dose of 50 mg subcutaneously once a month or 2 mg per kg iv infusion over 30 minutes at weeks 0 and 4, then every 8 weeks thereafter. It should be given in combination with methotrexate. Corticosteroids, nonbiologic DMARDs, analgesics and/or NSAIDs may be continued during treatment with this drug [33].
ACR Response
During the first phase of the trial, 151 of the remaining 173 (87.3%) patients achieved a 30% improvement from baseline in 3 of the 6 assessed criteria (active joint count, limitation of motion joint count, physician global assessment, patient/parent global assessment, Childhood Health Assessment Questionnaire, and acute-phase reactant level) without worsening of the remaining criteria, and 36.1% of patients displayed inactive disease status. The investigators randomized 154 patients to part 2 of the trial. The primary endpoint was not met; at week 48 the flare rates were comparable in those receiving placebo and golimumab (52.6% vs. 59.0%; P=0.41). The major secondary endpoints were also comparable between the placebo and treatment groups. The rates of inactive disease/clinical remission in patients receiving placebo + methotrexate or golimumab + methotrexate, for example, were 27.6%/11.8% and 39.7%/12.8%, respectively. Children with JIA in at least five joints displayed a rapid response to golimumab during the open-label, part 1 portion of the trial. During this portion of the trial, 36% of patients displayed inactive disease following the golimumab injection schedule. The sustained improvement in JIR was maintained in the placebo and treatment groups compared with baseline.
Adverse Events
Through week 48, adverse events, serious adverse events, and serious infections were reported in 87.9%, 13.3%, and 2.9% of all randomized patients, respectively. The most frequent serious adverse event was exacerbation of JIR. Death, active tuberculosis, or malignancy did not occur. Golimumab missed the primary endpoint in JIA. The reasons for the similarity in flare rates between the arms is unclear, and further study is needed if the regimen ultimately proves worthy of clinical use [33]. No Meta analysis for Golimumab on adult and pediatric data could be performed, as the data from the study in JIA is not publically available.
Infliximab
Study Description: A multicenter randomized doubleblind placebo-controlled trial of infliximab in 117 children with polyarticular JIA did not find a statistically significant effect of infliximab 3 mg/kg intravenous infusion therapy plus methotrexate on ACR-Pedi responses as compared with placebo at 14 weeks [34]. The open-label extension (OLE, 52–204 weeks) of the study involved 78 patients. However, 34% discontinued infliximab prematurely, mostly by withdrawing consent due to lack of efficacy [35]. Overall, 30% of the children continued the study up to week 204 (Table 3a). The two pivotal studies in RA in adults were performed in 1999 (Study RA I, ATTRACT, [36]) and 2004 (Study RA II, ASPIRE, [37]). Both trials were placebo-controlled and allowed methotrexate. They worked with 3, 6 or 10 mg/kg i.v. application of infliximab.
ACR Response: After 14 weeks, following crossover from placebo to infliximab 6 mg/kg, ACR50 and ACR70 responses at week 52 were achieved in 70% and 52% of the children. However, there was no statistically significant difference between the placebo group and the treatment group. Meta analysis supports that study data on infliximab shows no statistically significant treatment effect in children compared to adults. Also, the impact of age and study duration did not play a significant role (Table 6).
Adverse Events: The pediatric trial demonstrated that infliximab was safe, though the 3 mg/kg group had a less favorable safety profile, with a higher incidence of injection-site reactions and more serious infections. As the efficacy of infliximab in a pivotal study has not revealed a superior effect compared with placebo [34], the FDA did not approve infliximab for JIA, although it is still used in children. It is recommended as backup drug to treat JIA in the guidelines for JIA treatment [38] at the usual pediatric dose for JIA: 10 years or older: 3 mg/kg via iv infusion at weeks 0, 2, and 6, followed by infusions every 8 weeks [39]. Moreover, infliximab is approved for the therapy of refractory Crohn’s disease in children over 6 years (Table 3a).
Pharmacokinetics: The childrens’ trial observed formation of antibodies to infliximab, antinuclear antibody or anti-dsDNA antibodies in greater proportion in the 3 mg/kg group [34,35]. This confirmed results from one adult study [37], although other studies could not detect anti-chimeric antibodies, or only below detection limit [36,40,41] (Table 3b).
Discussion
The introduction of PIPs aimed to initiate a formal approval process for new medicinal products to avoid unauthorized use in children. In this review, the JIA indication in children, with RA as a counterpart in adults, and TNF-α blocking agents were selected as model diseases and drugs for comparison and evaluation of the data obtained from clinical studies in the new immunomodulatory drug space. TNF blocking agents are currently the only drug group with a number of compounds authorized in children and adults to treat JIA and in adults in RA, thus providing most experience in this drug class. Studies with etanercept in children showed the utility of TNF-α blocking agents in JIA for the first time. The PI for etanercept allows a dose of 0.8 mg/kg for children <63 kg and up to 50 mg for children ≥63 kg. 50 mg is also the approved dose for adults. The detailed PK parameters to support the dose selection in either population could not be identified and were addressed in only a few studies. A direct comparison of ACR response between children and adults was only partially possible as the time points for assessments differed considerably between both groups. Thus, it is unclear how the dose for children was selected. However, as the dose is set at a similar level for adults and children, these studies supported the idea that the dose for children could potentially have been extrapolated from the adult studies. Furthermore, no new safety issues or efficacy data were identified in proof-of-concept trials with children. Thus, the pediatric study results did not lead to any significant differences in dosage or safety profile compared with those in adults but confirmed the efficacy in JIA. Meta-analysis showed no difference on the treatment effect for etanercept in adults and children.
Similar findings were true for the comparison of dosage between adult and children for adalimumab. The PI shows a dose of 10, 20 or 40 mg for children, depending on the body weight; 40 mg is the approved dosage for adults. Thus, the pediatric study results did not lead to any significant differences in dosage that could not have been predicted from the adult studies. ACR response data was also only partially directly comparable due to difference in assessment values and schedules. In addition, no new safety and efficacy data was obtained by these studies. However, no statistically significant treatment difference effect in the beween-age or study-duration group for the endpoints ACR 50 and ACR 70 (Table 5) could be observed. Golimumab was used in trials described above in JIA or RA. So far, no new safety and efficacy aspects have been identified in the JIA study, but the primary endpoint was not met in children. Adverse effects with anti-TNF-α blockers are generally mild e.g. local skin reactions/infusion reactions, and are mostly transient. Minor infections e.g. upper respiratory tract infections are common. The risk of developing tuberculosis seems higher with the monoclonal antibody’s infliximab and adalimumab, compared with etanercept [42,43]. Autoimmune phenomena such as drug-induced lupus, demyelinating disease, uveitis, psoriasis and inflammatory bowel disease were rather rare.
The risk of malignancies was reported to be increased in children. The post-marketing surveillance data on anti- TNF-α agents collected by the FDA reported 48 malignancies developing in children, of which 20 occurred in children with rheumatic conditions [44]. However, 88% of these children were also receiving other immunosuppressive drugs, including corticosteroids, azathioprine and methotrexate. Approximately 50% of the malignancies reported were lymphomas, leukemia and melanoma. The FDA and EMA added a boxed warning with regard to the possible increased risk of malignancy, especially lymphomas, in children treated with anti-TNF-α agents. Despite this, a recent summary of worldwide pediatric malignancies in children treated with etanercept did not find an overall increased risk. However, the authors acknowledged that it is difficult to assess the actual risk due to the rarity of malignant events, the underlying higher risk of lymphomas and leukemias in children with JIA and the confounding use of other immunosuppressants [45].
The time before the marketing approval of drugs is particularly important, as the overall aim of drug development in clinical trials should focus on patient benefit to make sure that access of drugs to patients is as simple and fast as possible. However, the studies performed to support marketing approvals in children does not seem to support this overall aim, as shown in the model based on TNF-α blocking agents. Therefore, prolonging the drug approvals process does not benefit children, and promotes off-label pediatric used as these drugs are already marketed for use in adults. All four TNF-α blocking agents discussed here are approved in adults for RA, and all have been tested in children for JIA. The results broadly confirm the findings in adult studies other than infliximab, which has not been approved at a dose of 3 mg/kg for JIA (although it is continued to be used in children). Based on the similarity of dose administered in adults and children, the assumption is that the key parameters are likely to be similar across age groups for a range of biologics. Therefore, the question arises – is it important to carry out confirmatory studies in children? Are these studies really necessary or can the data for biologics be extrapolated if the expression of the respective target is the same in adults and children? The data reviewed suggests that the results obtained in adult RA studies are likely to be useful in predicting the dose, efficacy and safety for children with JIA. It therefore does not support further performance of extensive proof-of-concept studies in children.
Conclusions
The overall aim of drug development in clinical trials should focus on patient benefit, making sure that patient access to drugs is as simple and fast as possible. However, the studies performed to support marketing approvals in children do not seem to support this overall aim, and actually prolong the approvals process. They also promote off-label paediatric use as the drugs are already marketed for use in adults. All four of the TNF-α blocking agents discussed here are approved in adults for RA, and all have been tested in children in JIA. Based on the similarity of dose administered in adults and children for the two biologics approved in children, the assumption is that the key parameters are likely to be similar across age groups for a range of biologics. Therefore, the question arises – is it important to carry out confirmatory studies in children? Are large pivotal studies really necessary or can the data for biologics be extrapolated if the expression of the respective target is the same in adults and children? Our review of the data suggests that the results obtained in adult RA studies are likely to be useful in predicting the dose, efficacy and safety for children with JIA. It therefore does not support further performance of extensive proof-of-concept studies in children in specific targeted indications and based on mode of actions of a medicinal product.
However, infliximab and golimumab missed the primary endpoint for efficacy in JIA. The failure of these two drugs suggests that the differences in PK/PD parameters might play an important role in children’s immune responses to biologic drugs, especially those expressed as chimeric or pegylated proteins. This differing immune response may have a bigger role in children than in adults, with higher levels of immunogenicity and neutralizing antibodies reducing the efficacy of the drugs. It is interesting to note that there were no studies identified in the public domain that looked at these drugs in terms of target expression in lymphocytes, or PK/ PD studies in children. The data reviewed suggests that the results obtained in adult RA studies are likely to be useful in predicting the dose, efficacy and safety for children with JIA for certain products, however, the results from the two unapproved drugs might indicate that expression studies of the target and PK/PD studies are important to translate adult studies successfully in children. The need for further extensive efficacy and safety studies in children is therefore challenged. PK/PD studies plus modelling and simulation based on adult dose may be needed in children to help in finding optimal dose for children and to confirm a PD effect. In certain situations, for example in drugs of the same class, an extrapolation approach could avoid unnecessary further studies in the pediatric population.
Prevalence and Socio-Demographic Correlates of Substance Use Among Patients Attending the drug Unit of the University of Port Harcourt Teaching Hospital
Introduction
According to the World Health Organization [1], substance use refers to the use of any psychoactive substances or drugs, which include licit and illicit drugs, other than which are medically indicated. The United Nations Organizations on Drug Council [2] stated that substance use is a major public health problem all over the world. In 2011, it was estimated that 167 to 315 million people aged 15 to 64 years globally had used an illicit substance in the preceding year [3]. The estimated global burden of alcohol and illicit drugs use is 5.4% while tobacco is 3.7% [4]. Psychoactive substance use poses a threat to the health, social and economic fabric of families, communities and nations [5]. Drug dependence is a growing public health problem and consequences of drug dependence cost the community heavily [6]. This habit not only affects health, education and occupational career, but it also incurs a huge financial and social burden on the society. A national survey of substance use conducted among 10,609 Nigerians aged 15-64 years in the six geopolitical zones of the country recorded a lifetime prevalence of 39% for alcohol, 6.6% for cannabis and 12.2% for cigarettes [7]. In Nigeria, the most common types of used substances include stimulants and amphetamines such as caffeine, tobacco, nicotine, ephedrine; hallucinogens such as marijuana and narcotics such as heroine and codeine. Others include alcohol and sedatives [8]. These substances are largely used due to the belief that they relieve stress and anxiety, and some of them induce sleep, ease tension, cause relaxation or help users to forget their problems. The consequences of their abuse could result in physical dependence [8]. The United Nations Organizations on Drug Council [2] submitted that prevalence of any drug use in Nigeria is estimated at 14.4 per cent or 14.3 million people aged between 15 and 64 years; a situation which implies that the extent of drug use in Nigeria is comparatively high when compared with the 2016 global annual prevalence of any drug use of 5.6 per cent among the adult population. Accordingly, one in seven persons aged 15-64 years in Nigeria had used a drug (other than tobacco and alcohol) in the past year [2]. The social consequences of drug use are also evident in Nigeria. Some of which include disruption in family lives, loss in productivity and legal problems as a consequence of drug use in their communities. Also, some individuals in the general population had experienced negative consequences due to other peoples’ drug use in their families, workplace and communities [5]. Despite the highly reported consequences of substance use, in different parts of the world including Nigeria, a good number of individuals’ reports being addicted to specific drugs and presents at healthcare facilities for medical assistance [4]. In fact, in University of Port Harcourt Teaching Hospital, Rivers State Nigeria, some people who have willingly presented themselves for clinical counseling are currently on drug rehabilitation. Nonetheless, there is dearth of evidence on the prevalence of substance use disorders in Nigerian communities, a situation which justifies the need for this study on the prevalence and socio-demographic correlates of substance use disorders among individuals on drug rehabilitation in University of Port Harcourt Teaching Hospital.
Methodology (Materials and Method)
Study Design
Descriptive retrospective design was used in this study.
Study Subjects
The target population consisted of all adult males and females on drug rehabilitation in University of Port Harcourt Teaching. Only subjects who been on drug rehabilitation for a minimum period of six months and were willing to participate were included in the study. The study was conducted from January 2018 to February 2020. A sample size of 104 subjects was selected using the purposive sampling technique. Sample size determination was done using sample size determination formula by Cochran as shown below: N= Z2P (1-P)/d2 Where N= Sample size P= Prevalence of drug use = (6.6%) = [0.066] [7]. d= Sampling error that can be tolerated (0.05) Z= Level of Significance N= 1.962 0.066(1-0.066)/0.0025 = 0.2368115904 (0.856)/0.0025 =94.725 =94.7 10% non-respondent= 94.7 of 10% =9.47 N=94.7+9.47=104.17
Data Collection
The Nigerian Epidemiological Network on Drug use for drug patients who attended UPTH treatment facility from January 2018 to February 2020 were retrieved and used in the study following ethical clearance.
Data Analysis
Analysis of data was done using the Statistical Package for Social Sciences (SPSS) software version 20.
Results
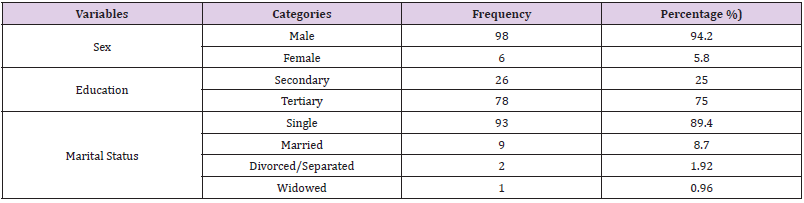
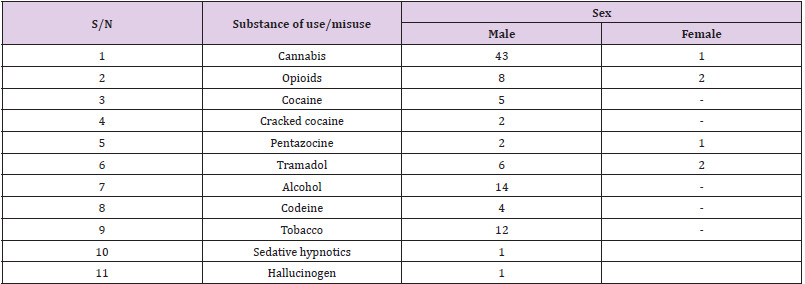
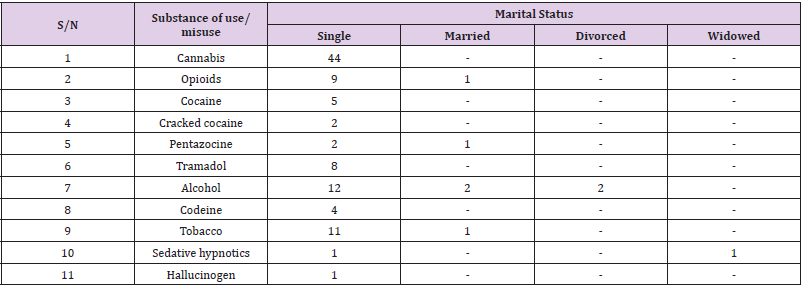
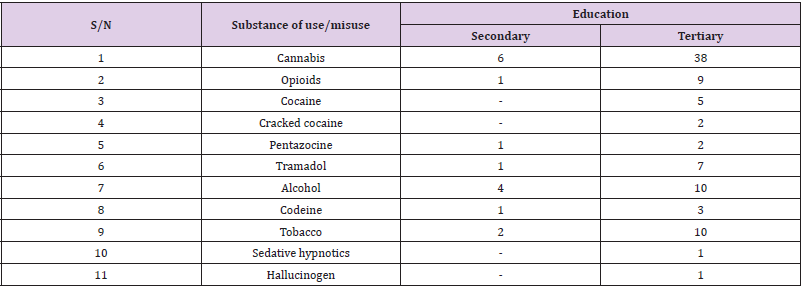
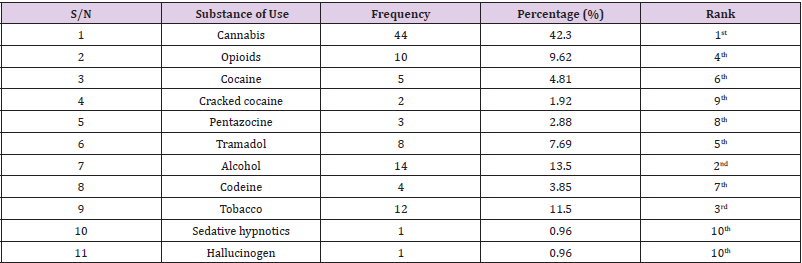
Table 1 shows that majority of the respondents were males, 94.2%, had tertiary education, 75.0% and were single, 89.4%. Table 2 shows that sex of individuals influences their substance use behaviour, as majority of the respondents that uses substances/ drugs were males (P<0.05). Table 3 shows that marital status of individuals influences their substance use behaviour, as majority of the respondents that uses substances/drugs were singles (P<0.05). Table 4 shows that educational status of individuals influence their substance use behaviour, as majority of the respondents that uses substances/drugs had tertiary education (P<0.05). Table 5 shows the prevalence of substance use disorders among individuals on drug rehabilitation in University of Port Harcourt Teaching Hospital. Out of the 104 respondents, 42.3% use cannabis, 13.5% consume alcohol, 11.5% use tobacco, 9.62% use opioids, 7.69% use Tramadol, 4.81% use cocaine, 3.85% use codeine, 2.88% use Pentazocine,1.98% use cracked cocaine, while 0.96% use sedative hypnotics and hallucinogens.
Table 1: Socio-Demographic Characteristics of the Subjects (n=104).
Table 2: Sex of Subjects and Use of Substances among Individuals on Drug Rehabilitation in University of Port Harcourt Teaching Hospital (n=104).
Table 3: Marital Status of Subjects and Use of Substances among Individuals on Drug Rehabilitation in University of Port Harcourt Teaching Hospital (n=104).
Table 4: Educational Status of Subjects and Use of Substances among Individuals on Drug Rehabilitation in University of Port Harcourt Teaching Hospital (n=104).
Table 5: Prevalence of Substance Use Disorders among Individuals on drug Rehabilitation in University of Port Harcourt Teaching Hospital (N=104).
Discussion
The study findings revealed an increasing prevalence of substance use. Out of the 104 respondents, 42.3% used cannabis, 13.5% consumed alcohol, 11.5% used tobacco, 9.62% used opioids, 7.69% used Tramadol, 4.81% used cocaine, 3.85% used codeine, 2.88% used Pentazocine, 1.98% used cracked cocaine, while 0.96% used sedative hypnotics and hallucinogens. These results agree with the findings of Oshodin [8], Adamson et al. [7], Morello et al. [9] and Jegede et al. [10]. Generally, cannabis, alcohol and tobacco appear cheaper and more readily available to the average Nigerian drug user than the other substances, a situation that explains why they are more prevalent. This may not be the case in other sub- Saharan African countries and the rest of the world. It was also discovered that sex, marital and educational status of individuals influence their substance use behaviour, as majority of the subjects were males 98 (94.2%), singles 93 (89.4%), and had tertiary education 73 (75.0%). These results are in consonance with the assertion of Okpataku [11]. The married ones were less likely to use drugs etc. A possible reason for this socio-demographic correlate could be that males are usually more adventurous than the female folks! Although this assertion may be considered true to a large extent, it is actually not absolute as Adolfo et al. [12] in their study reported otherwise. They found out that drug use was more prevalent among women. The possible reason for this difference could be that of setting and culture. Whereas this present study was conducted in Port Harcourt, South-South Nigeria, Adolfo et al. [12] conducted theirs in Spain, Europe. On the other hand, drug use being more prevalent among singles could be due to the fact that they generally have more freedom and less restriction in the adventures of life more than the married, divorced and widowed etc. Also, the fact that most of the drug users had tertiary education explains the fact that growth, peer pressure or exposure to a higher degree of thinking/learning could actually predispose one to certain habits such as drug abuse etc. This may actually not be absolute globally as some other studies have identified substantial drug use among high school students, dropouts and street hustlers [2].
Conclusion
In conclusion, there is a high prevalence of drug use in the society; cannabis and alcohol are the most substances of use/ misuse. There is a significant relationship between socialdemographic characteristics of individuals and their potential to use substances as sex, marital and educational status of individuals influences the extent to which they use drugs and related items. A substantial proportion of the subjects that use substances/drugs were males’ singles and had tertiary education.
Pulsatile Vs Non-Pulsatile Intracranial Blood Flow: Animal Model of Blood Flow Restoration in Brain Tamponade
Introduction
In neurosurgical practice brain tamponade represents the ultimate limit for treatment. It is defined as a progressive intracranial pressure (ICP) increase up to values close to arterial blood pressure producing a reverberating flow pattern in the cerebral arteries with no net flow [1-3]. Nowadays, patients reaching such a condition are labeled as untreatable due to the lack of effective treatment. Decompressive craniectomy might in peculiar conditions, such as in very little children, overcome the aforementioned limit thanks to the incredible capability of a still growing brain to recover from extensive injuries but that is not the case in adult or elder patient. Throughout the literature there are several papers addressing the matter but still no clear advance was proposed. In fact, many of the papers are still at the animal levels also due to the actual difficulties in creating an ethically approvable human model. This aspect is linked to the fact the patients near brain tamponade conditions have to be rapidly treated whenever possible being hard to create a double group-controlled study. Furthermore, it is not so easy to define the actual limit in which brain tamponade become irreversible. The authors themselves, in previous papers, highlighted how even in prolonged brain tamponade conditions, metabolism inside the neuronal cells still continue even after prolonged ischemia time [4,5]. The idea of overcoming the blockage in cerebral blood flow modifying its modality derived from a previous report of residual arterial and venous pulsation even in tamponade brains [1]. In order to do so, we hereby present an animal model in which changing the modalities of brain blood supply from pulsatile to continuous it might be possible to maintain cerebral perfusion even in conditions of highly elevated intracranial pressure.
Material and Methods
Five male sheeps (30-35 Kg) were sedated using intramuscular Atropine (0,5-1 mg) and Ketamine (10 mg/Kg). Each animal was placed supine on the operating table, intubated and anesthetized with Halothane (0,8-1%) and Pancuronium Bromide (0,5 mg/h intravenously administrated). These sheeps were evaluated for the whole duration of the procedure using: a) Electrocardiogram b) Systemic arterial bold pressure (measured through a line in the obturator artery) (SAP) c) Carotid arterial blood pressure (CAP) d) Middle cerebral artery blood flow measured using doppler ultrasound (placed to an ad-hoc craniotomic window) e) ICP measured using an intra-parenchymal sensor (ICP Express Codman) placed using a parietal burr hole. Once sedated each animal was prepared in the following way. Two inguinal incisions were made to isolate the femoral arteries that were exposed trough blunt dissection and cannulated. Similarly, through a neck midline incision the carotid arteries were found and prepared. In the meanwhile, a hydraulic circuit was created to ensure extracorporeal circulation. Such a circuit was composed by sylastic tubes, a peristaltic pump, a three-liter reservoir placed at 3-meter height from the ground and lastly from a mechanism granting pulsatility in order to mimic cardiac output. This mechanism is composed by an electric engine connected to a piston compressing the elastic portion of the tube exiting the reservoir. By doing so modifying the compression speed and the distance of the piston from the tube is possible to modify pulsation frequency and amplitude. The described circuit has three terminals, one for each femoral artery and the remaining one for the left carotid artery (the terminal ends with a Y connector). The whole circuit is replenished before starting with saline solution added with 25000 unit of heparin in order to avoid clotting inside it. To avoid animal hypovolemic state, the reservoir is filled with a liter of saline solution before starting. To create a condition of intracranial hypertension saline solution will be sent into the subdural space using a 20 Gauge needle inserted through a small, angulated burr hole which is also sealed with acrylic resin in order not to let the fluid escape around the needle. Infusion flow speed was regulated according to the parameter measure by the intra-parenchymal sensor. After clamping of the brachiocephalic trunk, the circuit can be activated. Whenever doing so, the blood taken from the femoral arteries is aspirated and carried into the reservoir from where, thanks to gravity, it flows into the left carotid artery. Thanks to the Y connector the blood in the left carotid artery can flow both toward the brain and towards the base of the brachiocephalic trunk granting blood supply to the whole brachiocephalic territory. The pulsation machine intervenes in this setting in order to transform a pulsatile flow into a continuous one without creating relevant changes in medium arterial pressure. Once completed animal preparation, three different experimental conditions were evaluated in order to measure the cerebral perfusion pressure (CPP=CAP-ICP) value at which cerebral blood flow (CBF) blockage appear in each of them. The aforementioned conditions are: a) Normal condition b) Continuous laminar flow created using EC c) Combined model. In this model the brain is submitted to pulsatile circulation created with the aforementioned pulsatile machine in EC switching in a second moment to continuous flow in order to evaluate differential response to flow modifications. At the end of the experiment the animals were sacrificed being still under general anesthesia using an intravenous administration of 10 mEq potassium chloride. The whole experiment was carried on in accordance with the EU Directive 2010/63/EU for animal experiments.
Results
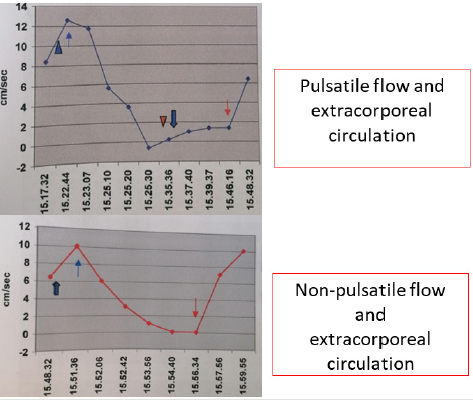
A. Model 1: mean CAP value is 110 mmHg (ranging from 100 to 130 mmHg) while mean ICP value is 15 mmHg (ranging from 12 to 18 mmHg) and mean MCA speed is about 10 cm/sec. Starting saline subdural infusion, ICP value start increasing while CBF progressively decrease. This process continues until ICP reaches 70 mmHg with consequential CBF blockage. Even though no blood flow can be measured at this moment, CPP is still present and greater than 40 mmHg. At the same moment, a different behavior of CBF velocity can be observed. In fact, even if CPP is still present flow velocity reaches zero concomitantly wit tamponade. Both observations tend to recover baseline condition once stopped infusion. B. Model 2: the initial increase in ICP and decrease in CBF speed is the same of model 1 but, unlike with pulsatile flow, CBF arrest is reached with higher ICP value. In fact, ICP values similar to CAP are needed in this case with a residual CPP of 15-16 mmHg to observe cerebral tamponade. The observation concerning CBF speed overlaps what seen in model 1. As in model 1 this condition is reversible after infusion arrest. C. Model 3: the combined model shows firstly how normal cardiac circulation can be achieved using pulsatile EC with similar results on CPP and CBF speed. On the other hand, it shows how, switching from pulsatile to continuous flow in absence of relevant changes in CPP, a gradual and stable intracranial circulation can be obtained as documented by doppler ultrasound. The aforementioned results are summarized in Figure 1.
Figure 1: Blood flow velocity in different circulations.
Discussion
Throughout the literature, there are very few reports regarding flow typology in intracranial circulation. Such papers are mostly related to intracranial changes after ischemic heart failure. Reviewing the literature trying to select the most fitting papers, only two authors slightly address the problem. the first one only mentions non pulsatile blood flow as something unclear as well as a potential sign for proximal arterial occlusion [6], while the other one, suggests the importance of pulsatile flow during reperfusion without addressing at all flow modifications during tamponade [7]. To overcome such a lack of evidence on the matter, the authors devised the presented experiment. The aim was to analyze whether changing cerebral blood flow from pulsatile to non-pulsatile was possible to overcome brain tamponade. Such an experiment was founded on the idea that the very “normal” blood pulsation coupled with Starling resistor functioning is at the base of cerebral tamponade. Physical laws states that flow is driven by the presence of a pressure gradient between two compartments connected by a channel. Thus, as long there is a gradient there will be flow, no matter how small the caliber of the channel will become. Flow stops then after the closure of the channel or after disappearance of the gradient. The application of such physical law to the intracranial system were evaluated for the first time by Chopp et al. who created a model simulating the intracranial space and its modifications during infusion tests [8]. In order to describe what happen in normal conditions, it is important to remember that intracranial circulation is pulsatile and that pressure wave propagation speed inside the vascular system is slower than the liquoral one due to the resistance in capillaries and veins. Thus, whenever there is an increase in intracranial pressure, the aforementioned difference in transient propagation speed lead to an early closure of the veins and of the Starling resistor before intravasal pressure could match outer one maintaining positive flow. When the vein walls contact each other the possibility to re-open is lost leading to tamponade. On the other hand, if the circulation were non-pulsatile a net flow would be always present thanks to the persistence of pressure gradient. Such persistence is granted by the absence of a pulsation wave preventing the previously described vein closure mechanism. The channels will become smaller in an asymptotic way never actually closing and preventing the reach of zero net flow. Obviously, this situation is theoretical and in reality, the channels will eventually close, but a greater intracranial pressure would be needed. In order to demonstrate such an assumption, we have created a model of selective extracorporeal brachiocephalic circulation in order to send laminar flow to the brain without affecting body circulation. The selection of the sheep as animal model was made in order to simplify the experiment having this animal a peculiar anatomy of the brachiocephalic trunk. In fact, in this setting all of the vessels, emerging in the human from the aortic arch, start from this trunk. From left to right it emerges first the left subclavian artery the two carotid arteries and last the right subclavian artery. Such conformation simplifies the experiment granting the selectivity control of the cerebral blood flow through the manipulation of a single vessel. Nonetheless, it is important to remember that collateral circulation might be present in selected cases reducing the power of the experimental model. In the sheep model though, such collaterals disperse most of their contribution to the spinal roots and to the neck muscle making the amount of cerebral distribution negligible. Dividing the experiment into three moments granted us the possibility not to miss biases in the model. In model 1 the authors confirmed a similar trend between sheeps and humans regarding brain tamponade. Blood flow ceases concomitantly with an increase of ICP over CPP reaching brain tamponade even in condition of persistent low CPP. Model 2 differs from model 1 in the need for a higher ICP value to reach tamponade and flow absence. Such a finding suggests a higher threshold to be reached in order to cause it. Finally, model 3 unites the previous ones and improves them showing how a change in flow type might overcome a preexisting tamponade situation offering a possible novel treatment strategy. The most striking data reside in the reappearance of blood flow during tamponade after the change from pulsatile flow to continuous one.
Conclusion
Brain tamponade in neurosurgery represents nowadays the terminal line for treatment. Every effort has to be made in order to find a way to overcome such a limit. Our data might represent the first step in that direction showing how changing cerebral flow even tamponade can temporarily overcome. Even though this is only an animal experiment it might open the way to further animal experiment and thus to human ones.
Fungal Skin Diseases and Related Factors in Outpatients of Three Tertiary Care Hospitals of Dhaka, an Urban City of Bangladesh: Cross-Sectional Study
Introduction
Globally, fungal skin diseases are very common in human. As a densely populated developing country and having poor hygiene, sanitation practice, Bangladesh is no different to fungal skin infections. The skin protects us from microbes and the elements of skin help in regulating body temperature and permit the sensations of touch, heat, and cold. As it interfaces with the environment, skin plays an important immunity role in protecting the body against pathogens. It is subject to a wide range of medical conditions and infections ranging from simple manifestations to complicated ones like skin cancer. Symptoms and severity of skin disorders vary greatly. They can be temporary or permanent and may be painless or painful. Some have situational causes, while others may be genetic. Some skin conditions are minor, and others can be life-threatening. However, fungal, bacterial, parasitic and viral infections are very common in the healthy people. Several types of parasitic, bacterial and fungal infections are found which causes negligible mortality but most of the diseases have chronic course and sufferings [1]. The skin is the body’s initial defense against parasites, fungi, bacteria, viruses and other microbes. But skin and venereal diseases cause a large part of illness. About 50% of people in Bangladesh suffer from skin disorders in their lifetime. Incidence of infection on skin is very frequent due to some environmental, natural, occupational and individual habitat variations. It increases when people are herded together and facilities for washing the body and clothing are reduced. Recurrence, excessive use of chemicals and cosmetics, environmental pollution, delayed marriage etc is the major leading factors for the initiation and transmission of the diseases. About 80% of population in Bangladesh live in the rural areas, where poverty, literacy, ignorance, high family members, disease and disasters are the constant companion of them. Increasing population, socio economic conditions have become poor and due to this population explosion, all the reversible socio-demographic conditions go in favor of disease occurrence, recurrence, and complications. In addition, overcrowding, urbanization, industrialization, migration, excessive use of chemicals and cosmetics, environmental pollution, greenhouse effect, education, delayed marriage and use of multiple partners are also the major leading factors for inflation and transmission of diseases. Skin and venereal diseases are one of the major public health problems in developing countries. Though it occurs in all class of society but people living in insanitary and poor housings conditions suffer more from the disease, poverty-stricken people with poor hygienic habits and unclean clothing are the usual victims of these diseases. Symptoms of infection depends on the type of organisms that has caused the infection and both symptom and appearance also depend on the part of the body infected. In many studies it has been shown that 30-40% of our population is suffering from skin diseases. Of which about 80% are scabies and pyogenic infections. Children are the worst sufferers from these diseases (Khanum and Alam 2010). The relation between the skin and venereal diseases of the diabetic patients of different age group and sociodemographic characteristics is very complicated. The sociodemographic aspects are very important to know because in different societies and social groups explain the causes of illness, the type of treatment they believe and to whom they turn if they go get ill (Khanum et al. 2007). In human anatomy, the largest outer organ, covering throughout the whole body is skin. Skin performs a very significant role in immunization by defending against outer microbes and pathogens. Moreover, the elements of skin help the body to regulate the temperature throughout the body and create the feelings of heat, cold and touch. However, this important organ of the body has been exposed to a variety of infections and medical sufferings varying from simple acne to very intricating skin cancer types. Worldwide, among human diseases, the most common is skin disease. It can affect individuals anytime during their lifetime [1], can strike at any age, can spread over all societies and cultures. In time skin disease can lead to systematic disorders. Its damaging effects lead to physical disability even death [2]. In 2010, the global burden of disease [GBD] published that skin diseases ranked fourth as the prominent reason for non-fatal disease burden affecting both high- and low-income countries [3]. In 2013, GBD published that skin diseases are responsible for 39 million years lived with disability [YLDs] and in case of disabilityadjusted life years [DALYs] sit has attributed 1.79% to the global burden of diseases [4].
Fungal Disease: Ringworm (Dermatophytosis)
Ringworm, also known as dermatophytosis or Tinea, is a fungal infection of the skin. The name “ringworm” is a misnomer, since the infection is caused by a fungus, not a worm. Ringworm infection can affect both humans and animals. The infection initially presents with red patches on affected areas of the skin and later spreads to other parts of the body. The infection may affect the skin of the scalp, feet, groin, beard, or other areas. Ringworm can go by different names depending on the part of the body affected. 1. Tinea capitis [Ringworm of the scalp] is a fungal infection affecting on scalp. 2. Tinea corporis [Ringworm of the body] is a fungal infection that affects the skin of body. 3. Tinea cruris [Jock itch] is a fungal infection that affects the warm and moist area such as buttocks, groin, inner thighs etc. 4. Tinea pedis [Athlete’s foot] is a fungal infection that affects the skin of feet. 5. Tineaunguium [Onychomycosis] is a fungal infection that affects either the fingernails or toenails. 6. Tinea facie is a fungal infection that affects the face. 7. Tinea barbae is a fungal infection that affects the beard area of men. 8. Tinea mannum is a fungal infection that affects the area of hands. 9. Tinea versicoloris a fungal infection that affects the whole body as the form of discolored patches of skin. Dermatophytosis tends to get worse during summer, with symptoms alleviating during the winter. The disease can be transmitted between animals and humans [zoonotic disease]. Three different types of fungi can cause this infection. They are called Trichophyton, Microsporum and Epidermophyton. It’s possible that these fungi may live for an extended period as spores in soil. Humans and animals can contract ringworm after direct contact with this soil. The infection can also spread through contact with infected animals or humans. The infection is commonly spread among children and by sharing items that may not be clean. Fungi thrive in moist, warm areas, such as locker rooms, tanning beds, swimming pools and in skin folds. It can be spread by sharing sport goods, towels, and clothing. Symptoms and severity of skin disorders vary greatly. The consequence of this problem is serious for the patient as well as for the society. Among skin diseases, fungal, bacterial, parasitic and viral infections are very common. The distributional pattern of skin diseases varies widely from country to country, even within the country itself [1]. Although they are attributable to a very insignificant mortality rate but most of the skin diseases comes with a possibility of prolonged sufferings thus raising public health concerns in developing countries. Bangladesh is a densely populated country with 164.69 million population and 24% of people live under the poverty line [5] and the majority of the population suffer from different infections and contagious diseases. Study conducted by Khanum and Alam, it has been shown that 30-40% of our population is suffering from skin diseases [6]. Approximately, 40% of people live in urban cities and the highest 10.3 million people live in Dhaka city [7]. Several papers have studied common skin and venereal diseases in Bangladesh [8-14] but our paper is specifically concerned about fungal skin diseases and their associated factors in three tertiary care hospitals of an urban city, Dhaka, Bangladesh. According to the 2010 GBD, fungal skin infections were among the top 10 most dominant diseases globally [3]. According to the 2013 GBD, 0.15% of DALYs of the global burden of skin diseases are contributed by fungal skin diseases [4]. In rural areas of Bangladesh fungal skin infections are very common [15]. A study on the common skin diseases revealed that out of 440 patients 13% had fungal infections [11]. Other studies of Bangladesh showed prevalence ranging from 15.5%- 26.7% [12-14]. India, neighboring country to Bangladesh also reported that Fungal diseases were the highest group of all skin diseases with 18.74% prevalence [16] and second highest with 17.19% prevalence [17]. In Pakistan, a study conducted in 2017 showed 34.80% prevalence of fungal skin infections out of 95983 patients in a tertiary care hospital of Karachi [18]. A community-based survey studying the skin diseases of South Asian Americans found that fungal had 11% prevalence after Acne and Eczema [19]. Numerous factors can influence the prevalence of skin infections mentioning geographical and cultural factors [20-21], educational status, nutritional status, socio-economic status, as well as seasons, overcrowding, unhygienic habits, and environments are significant factors of defining the distribution of skin diseases in developing countries [1,22-24]. The socio-demographic aspects are very significant to know because in different societies and social clusters rationalize the reasons of illness, what types of treatments and whom they believe in case of their treatments [5].
Materials and Methods
This research study was performed at the Dermatology Department of the Bangladesh Institute of Research and Rehabilitation in Diabetes, Endocrine and Metabolic Disorders [BIRDEM], Dhaka Medical College and Hospital [DMCH] and Uttara Adhunik Medical College and Hospital [UAMCH]. The study was undertaken from 25th March 2018 to 10th February 2019. A total of 800 outdoor patients were randomly selected of all genders, ages, sexes, with different occupations irrespective of their skin problems during the data collection period of BIRDEM, DMCH, and UAMCH. The present study was conducted in two steps, firstly collecting samples and data through personal interviews and secondly laboratory confirmation of the diseases and their pathogens. A literature review was carried out about the factors relating to skin diseases before a structured questionnaire was prepared for interviewing the patients about their demographics and socio-economical aspects.
Statistical Analysis
Analysis of the data has been achieved by using the statistical software SPSS [version-20.0] and the results were presented in percentages. We have matched our results with comparable studies of other cities of the country and nearby countries through similar hospital attendance-based studies.
Ethical Approval
We informed each and every patient about our study aims, methods as well as we assured them about their privacy and confidentiality at any stage of the study [at the time of data, sample collection and laboratory diagnosis] before including them into our study. We also made it flexible to the patients to enter the study and also to withdraw their consent.
Results
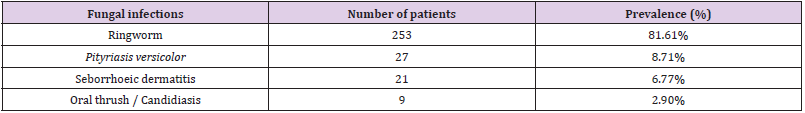
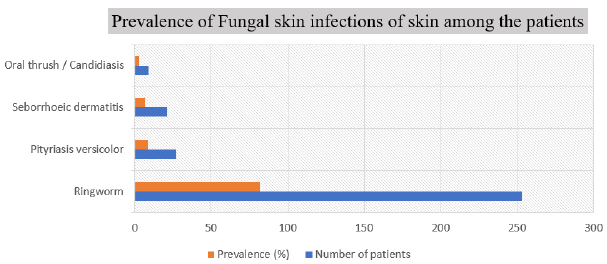
In the present observation cross-sectional study has been outlined to determine the prevalence of the fungal skin diseases of tertiary care hospitals in an urban city. The present study also provides a descriptive profile of factors related to the fungal skin diseases including demographical, personal hygiene aspect and socio-economic status of the outpatients attending the Dermatology Department of major three tertiary care hospitals in Dhaka city, Bangladesh. There were a combination of skin infections including fungal, viral, bacterial, parasitic, sexually transmitted diseases [STD] but maximum patients had fungal skin infections. Among the 800 patients, 310 patients were infected with fungal infections [38.75%]. It was observed, of those 310 patients 183 [59%] were male patients and 127 [41%] were female patients. Out of 310 fungal infected patients, most of the patients, were infected by ringworm [81.61%] and the lowest prevalence was found in case of Oral thrush [2.9%] (Table 1). Besides, ringworm patients were infected by Pityriasis versicolor, Seborrhoeic dermatitis. Among 253 patients of ringworm patients the highest prevalence was found in case of Onchomycosis [21.94%] and the lowest prevalence was found in case of Tinea capitis [0.97%] (Figure 1).
Table 1: Prevalence of fungal skin infections of skin among the patients.
Figure 1: Prevalence of ringworm causing agents among the patients.
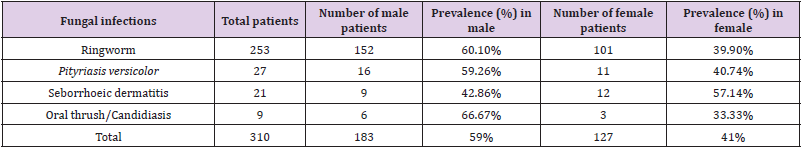
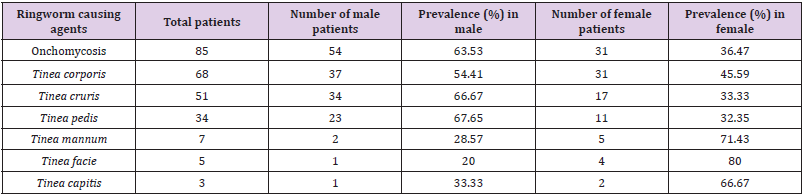
Among the 183 male patients highest 66.67% were infected by Oral thrush/ Candidiasis and lowest 42.86% were infected by Seborrhoeic dermatitis whereas, among the 127 female patients highest 57.14% were infected by Seborrhoeic dermatitis and 33.33% were infected by Oral thrush/ Candidiasis] (Table 2). Moreover, in ringworm causing agents highest 67.65% male were infected by Tinea pedis and lowest 20% males were infected by Tinea facie while in female group highest 80% were infected by Tinea facie and lowest 32.35% were infected by Tinea pedis (Table 3).
Table 2: Prevalence of fungal skin diseases according to the gender of patients.
Table 3: Prevalence of ringworm causing agents according to gender of patients.
It was also observed that out of total 310 fungal infected patients, the highest burden of fungal infections was present among the patients of age group of 31-45 [32.26%] and the lowest burden of infections was belonged to the patients of age group of 0-15 [6.13%] (Table 4). This was also similar for the prevalence of the specific ringworm causing agents. Age group of 31-45 years had highest prevalence [32.81%] and 0-15 years group had lowest prevalence [4.74%] (Table 5). Finally, we observed the factors from the personal interviews of the 310 patients mentioning marital status, socio-economic status, educational status, monthly income, occupation, seasons, religions, sources of water, residence location, regular bath, regular types of clothes, personal items sharing, history of recurrent infections, times of recurrent infections, overcrowding of family (Table 6).
Table 4: Prevalence of fungal infections in different age groups.
Table 5: Prevalence of ringworm causing agents in different age groups.
Table 6: Prevalence of fungal infections according to considered factors.
Discussion
In the present investigation, out of total 800 patients, 310 patients had fungal infections with the highest prevalence [38.75%] followed by other fungal skin problems. Out of fungal infections ringworm had highest prevalence [81.61%] followed by Pityriasis versicolor, Seborrhoeic dermatitis and Oral thrush/ Candidiasis. Among the ringworm, onchomycosis [27.42%], Tinea corporis [21.94%], Tinea cruris [16.45%] had the highest prevalence. It was also observed were male patients had high prevalence [59%] than female patients [41%]. In case of age group patients contained among the age group of 31-45 had the highest [32.26%] and the lowest prevalence of patients belonged to the age group of 0-15 [6.13%]. Outcomes of this study are similar to results of some studies while contradicts to some. In 1993, a study performed by Hossain [25] found that fungal infection [20.19%], and seborrhoeic dermatitis [8.80%] were most common among the skin diseases [25]. In 1995, Bahmadan et al. [22] reported that in Abha city from Saudi Arabia among the fungal disease developing pathogens, Tinea capitis [9.6%] and Tinea pedis [1.9%] were most common [22] but we found Tinea corporis [21.94%], Tinea cruris [16.45%] had the highest prevalence. In 2011, a study conducted by Rahman et al. found Tinea corporis [22.63%] was the most frequent infection as well as males were mostly infected with fungal infections which is similar to the results of this present study [15]. In 2007, study by Khanam et al. informed that among the fungal infected patient’s majority [42.7%] were infected by ringworm, 45.36% by Pityrious versicolor and lowest [12%] were infected by Candidiasis. Khanum also reported that the prevalence of fungal infection was in highest in 40-49 age group [25.33%] and less in 20-29 age group [14.66%] and prevalence in male was highest [61.33%] than female [38.66%] [8]. In 2012, one study from a Dhamrai area near Dhaka performed by Nafiza et al. had reported that among the patients with cutaneous skin diseases, fungal infections were the commonest and highest [22.9%] and males had high prevalence [63.4%] than females [36.6%] [12]. In 2017, Haque et al. revealed among the 504 patients who were surveyed from Rajshahi, an unbar city of Bangladesh with different types of skin disease, male had highest prevalence of fungal infections [26]. In this present study we had explored not only the demographical and socio-economic aspects but also seasonal aspect and the hygiene habits of the patients to better understand the factors related to the fungal skin diseases. It has been witnessed in. this study, that among the fungal infected patients who were married [71.93%], had secondary education [36.45%], earned 12000-20000tk monthly [38.06%] and had upper-middle class status [38.06%] had higher prevalence. Moreover, patients who were Muslims [86.13%], had businesses [39.73%], lived in urban areas [69.35%], used tap water as the source of water [69.35%] also had higher prevalence of fungal infections of skin. In case of personal hygiene of the patients, who wears cotton clothes regularly [27.74%], baths regularly [60%], shares personal items [63.87%], had recurrent infections [62.9%] and had overcrowding of family [66.13%] had higher prevalence. Additionally, in summer season fungal infections had higher prevalence [59.68%]. This study had found high prevalence in Muslims as the study was conducted in an Islamic country. There are several studies conducted in Bangladesh had found different results than ours. According to them, the prevalence was higher is rural areas [15], among students [10], patients from low socio-economic status [9], among illiterate patients [9,10], in rainy season [8]. According to Khanum et al. 52.16% of the patients with low socio-economic status showed a high reoccurrence of skin disease which contradicts our study result [8]. From these observations it can be said that skin infections in patients is very frequent in urban regions even if the urban cities of the country have improved standard of living, hygiene and sanitation, better quality healthcare facilities, education, and nutritious food to lessen the fungal skin diseases rather than the rural part of country. So, the present study has tried to give an approximate fungal skin disease prevalence scenario with related factors of the whole country.
Conclusion
Present cross-sectional study has provided some unique results and findings which would add to the scientific literature and health policies as it is first of its kind. No other research work has evaluated the prevalence of fungal skin diseases of an urban city with associated factors in Bangladesh. Moreover, this work can also be scaled up to other pathogens of skin diseases. However, there is no vaccine against skin diseases it is very difficult to control its transmission so to control this disease is to improve socioeconomic condition, change the personal hygiene behaviour and taking appropriate preventive measures.
Hyper Prevalence of Malnutrition in Nigerian Context
Introduction
Diet is the number one risk factor for disease in the world; carrying a superior risk of ill health than smoking or drinking alcohol Mills, et al. [1]. According to the World Health Organization (WHO), 462 million adults are underweight, while 1.9 billion adults are overweight and obese. In children under 5 years of age, 155 million are stunted, 52 million are wasted, 17 million are severely wasted and 41 million are overweight or obese [2]. The importance of nutrition cannot be over emphasized in any country of the world, be it developed, developing or under developed. This is because nutrition determines the social, economic, intellectual and technological advancement of any nation. While the significance of nutrition for growth, development and advancement is globally recognized, universal efforts in battling hunger and malnutrition have not really been achieved on a global scale [3,4]. Globally, there is hunger and malnutrition ravaging the world with a current estimated value of 1 in 9 people out of the 820 million people who are hungry or undernourished. A study conducted by [4] states that there has been a perpetual increase in these figures since 2015, especially in Africa, West Asia and Latin America. Similarly, approximately 113 million people across 53 countries experience acute hunger, as a result of conflict and food insecurity, climate shocks and economic instability [5]. However, more than onethird of the world’s adult population is overweight or obese, with growing trends over the past twenty years Ng, et al. [6]. The 2020 Global Nutrition Report presents the latest data and evidence on the state of global nutrition. Among children under 5 years of age, 149.0 million are stunted, 49.5 million are wasted and 40.1 million are overweight, and there are 677.6 million obese adults. It further states that there is now an increased global recognition that poor diet and resultant malnutrition are among the greatest health and societal challenges of our time. In addition, malnutrition continues at unacceptably high levels on a universal scale despite the little improvements that has been made to combat it. [7] emphasises that countries affected by conflict or other forms of fragility are at a higher risk for malnutrition. Moreover, it further illustrates that in 2016, 1.8 billion people (24% of the world’s population) were living in fragile or extremely delicate countries. This digit is projected to grow to 2.3 billion people by 2030 and 3.3 billion by 2050. International Food Policy Research Institute, [8] notes that the prevalence of stunting or restricted growth among children under five years reduced to 23.8% from 36.9% between 1990 and 2015. Nonetheless, the Food and Agricultural Organization of the United Nations [9] indicated that in 2017, the number of undernourished people increased from 777 million to 815 million between 2015 and in 2016, about 155 million children below the age of 5 were too short for their age. Furthermore, approximately 52 million did not weigh enough for their height while about 41 million was overweight. Previous researches like Black, et al. [8,10], and [11] indicated that malnutrition is connected to nearly half of all deaths among children under the age of five. On the contrary, more than 28 million adults and children in the United Kingdom (UK) are overweight or obese, which is catalysing a diet related health problem with escalating rates of noncommunicable diseases, including type 2 diabetes, cardiovascular disease and certain forms of cancer [12]. The treatment of obesity and its consequences in England alone currently costs the NHS £16 billion every year, the majority of which is spent on type 2 diabetes, [13]. This is more than the £13.6 billion per year spent on the fire and police services combined. The wider economic toll of obesity and related conditions is estimated to be the equivalent of 3% of the GDP Dobbs, et al. [14]. The most common form of malnutrition in the developing countries is under nutrition whilepresently Nigeria is one of the African countries listed among the 20 countries responsible for 80% of global malnutrition. Out of the sum of 233 million undernourished people in Africa, 220 million are from the Sub Saharan. Whereas South Sudan is lacking of globally comparable data, estimates show that the food and nutritional shortfalls are dreadful. For example, by January-March 2019, 5.2 million South Sudanese (49% of the total population) continued to face acute food insecurity Black, et al. [15]. Within this context, this paper seeks to evaluate hyper prevalence of malnutrition in Nigerian context. The Basic Tools of Scientific Enquiry 1. What are the factors or causes of hyper prevalence of malnutrition in Nigeria? 2. What are the mental and intellectual effects of hyper prevalence of malnutrition in Nigeria of under five children? 3. What are the impacts of hyper prevalence of malnutrition on the future of the Nigeria economy?
Literature Review
A report by the Food and Agriculture Organization of the United Nations [16] indicates that more than 14% of the population in developing countries were undernourished in the period between 2011 and 2013. Malnutrition includes both nutrient deficiencies and excesses and is defined by the World Food Programme (WFP) as “a state in which the physical function of an individual is diminished or weakened to the point where the person can no longer maintain normal or adequate bodily performance processes such as growth, pregnancy, lactation, physical work, and resistance to and recovering from disease” [17]. Additionally, [18] states that malnutrition frequently begins at conception, and child malnutrition is connected to poverty, low levels of education, and poor access to health services, including reproductive health and family planning. Furthermore, the World Health Organization, [2] states that malnutrition occurs due to an imbalance in the body, whereby the nutrients required by the body and the amount used by the body do not balance. Additionally, it stipulated that there are several forms of malnutrition and these include two broad categories namely under nutrition and over nutrition. Under nutrition manifests as wasting or low weight for height (acute malnutrition), stunting or low height for age (chronic malnutrition), underweight or low weight for age, and mineral and vitamin deficiencies or excessiveness. While over nutrition includes overweight, obesity and dietrelated non-communicable diseases (NCDs) such as diabetes mellitus, heart disease, some forms of cancer and stroke. In the 21st century, malnutrition in children has three main strands. The first is the continuing plague of undernutrition. Despite its reduction in many parts of the world, undernutrition is still depriving many children of the energy and nutrients they need to grow well and is connected to the deaths of children from 6 months to under 5 of age each year [19]. The second strand is hidden hunger. This is as a result of the deficiencies in essential vitamins and minerals such as vitamins A and B, iron and zinc. It is often unseen, and often ignored; hidden hunger robs children of their health and vitality and even their lives. The third strand is overweight, which is also called obesity in its more severe form. It was formally regarded as a condition of the rich, overweight now afflicts more and more children, even in underdeveloped and developing countries. It is has also been considered as a threat to stimulating a rise in diet-related noncommunicable diseases (NCDs) later in life; such as heart disease, which is the leading cause of death worldwide [20]. World Health Organization (WHO) reported that 462 million adults are underweight, while 1.9 billion adults are overweight or obese. In children under 5 years of age, 155 million are stunted, 52 million are wasted, 17 million are severely wasted and 41 million are overweight or obese [2]. There is a diversemanifestation of malnutrition, but the pathways to addressing prevention are important and include exclusive breastfeeding for the first two years of life, diverse and nutritious foods during childhood, healthy environments, access to basic services such as water, hygiene, health and sanitation, as well as pregnant and lactating women having proper maternal nutrition before, during and after the respective phases (before pregnancy and after delivery) [21]. The smallest or least advantaged are the most likely to suffer from malnutrition and its longstanding consequences. A research report by Hancock, et al. [22] states that the most deprived white children measured across England in 2012-2013 were on average more than a centimetre shorter in height by the age of 10 years than the least deprived children. These children are not likely to catch up growth losses from their early years. Obese children in England are more than twice as likely to live in the most deprived areas compared with comfortable areas and this gap is increasing over time [23]. Poor children are also more likely than wealthy children to suffer from poor health as a result of food insecurity. In addition, over 60% of paediatricians surveyed throughout the UK in late 2016 said that food insecurity contributed to the unpleasant health among children they treat [24]. Currently, nearly one in three people in the world suffers from at least one form of malnutrition, including obesity, under nutrition or vitamin and mineral deficiencies. Due to the rise in obesity, high income countries are presently contributing to the greatest number of malnourished people, but low income and middle income countries are meeting up fast. Hence, in Africa, the number of children who are overweight or obese has nearly doubled from 5.4 million in 1990 to 10.6 million in 2014 (Global Panel on Agriculture and Food Systems for Nutrition, 2016). Despite this rise in figure, other forms of malnutrition have not gone away, as deficiencies in vitamins and minerals continue to affect billions of people worldwide.
Perspectives on Malnutrition in Nigeria
Over the years, two main types of malnutrition have been identified in Nigerian children: (1) protein-energy malnutrition and (2) micronutrient malnutrition. The protein-energy malnutrition is common among the preschool children and constitutes a major public health problem in the country. “Stunting” is usually defined as low height for age, however, it is a deficit of linear growth and failure to reach genetic potential that reflects long term and cumulative effects of inadequate dietary intake and poor health conditions [25]. Succinctly, underweight is low weight for age, stunting (low height for age) and wasting (low weight for height) are all manifestations of under nutrition. All these expose the child to health risks and in their severe forms; they constitute a threat to the child’s survival [26]. In 1983–1984, the National Health and Nutrition Survey (HANS) conducted by the Federal Ministry of Health estimated the prevalence of wasting to be around 20% (FGN 1983–1984). A research by the Demographic and Health Survey (DHS) in 1986 shows that children between the ages of 6–36 months in Ondo State (Southwestern Nigeria) suffered 6.8% prevalence of wasting, underweight of 28.1%, and stunting of 32.4%. In February 1990, an anthropometric survey of preschool children (2–5 years old) in seven states was conducted and found underweight prevalence ranging from 15% in Akure (Ondo State) to 52% in Kaduna (Kaduna State) while stunting prevalence ranged from 14% in Iyero-Ekiti (Ondo State) to 46% in Kaduna. Similarly, the 1990 DHS conducted by the Federal Office of Statistics estimated the prevalence of wasting at 9%, underweight at 36%, and stunting at 43% among the preschool children in Nigeria. These figures show a decline compared to the figures published in 1994 by UNICEF-Nigeria from a 1992 survey conducted among women and children in 10 states; the UNICEF reported the prevalence of wasting among women and children at 10.1%, underweight 28.3%, and stunting 52.3%. Furthermore, there was a decrease in prevalence of stunting in the 2003 NDHS with 11% of children wasting, 24% underweight, and 42% of children stunted [27]. As at 2008, prevalence of underweight had declined to 23% and stunting had reduced to 41% but wasting increased to 14% (NDHS, 2008). Similar trends were reported by the 2001–2003 Nigerian Food Consumption and Nutrition Survey (NFCNS). The study reported 9% wasting, 25% underweight, and 42% stunting, with significant variations across rural and urban areas, geopolitical zones, and agro-ecological zones Maziya-Dixon, et al. [28]. The study also shows that the prevalence of stunting was lowest in the southeast at 16%; it reached 18% in the south and 55% in the northwest of Nigeria. The result further shows that among the states, stunting was highest among children in Kebbi (61%). The 2003 report of NDHS also indicates that among the rural children (43% stunted) were disadvantaged compared to urban children (29% stunted). Children living in the Northwest geopolitical zone stood out as being particularly underprivileged at 55% compared to 43 % in the Northeast zone, 31% in North Central, 25% in the Southwest, 21% in the South-South, and 20 % in the Southeast. The Multiple Indicator Cluster Survey (MICS), reported that there was a decrease in the prevalence of malnutrition in Nigeria with 34 % of children under five stunted, 31 % underweight, and 16% wasted, while about 15% of children had low birth (at less than 2,500 grams at birth) [29]. It is obvious from the 2013 NDHS that the proportion of children who are stunted has been decreasing over the years. However, the degree of wasting has worsened, indicating a more recent nutritional deficiency among children in the country. Prevalence of stunting decreased to 37%, with a higher concentration among rural children (43%) than urban (26%). Nevertheless, there has been an increase in the proportion of children underweight (29 %) and the proportion wasting (18%) [30]. It is graphically clear based on the data from these different studies that, malnutrition of children under five has been a consistent problem in Nigeria over time, with just little improvement reported despite its escalation in the country. Malnutrition contributed to 53% of deaths among children under five in Nigeria, and levels of wasting and stunting are still very high [31].
Empirical Review
Malnutrition is a global public health problem in both children and adults universally [2]. Annually, malnutrition claims the lives of 3 million children under age five and costs the global economy billions of dollars in lost productivity and health care costs. However those losses are almost entirely preventable. A large body of scientific evidence like [32-34] show that improving nutrition during the critical 1,000 day period from a woman’s pregnancy to her child’s second birthday has the potential to save lives, help millions of children to fully develop and deliver greater economic prosperity. Furthermore, Shrimpton, et al. [35] stated that malnutrition is currently an important global problem; as it affects all people despite the geography, socioeconomic status, sex and gender, overlapping households, communities and countries. In addition, anyone can experience malnutrition but the most susceptible groups affected are children, adolescents, women, as well as people who are immunecompromised, or facing the challenges of poverty. Young malnourished children are affected by compromised immune systems by yielding to infectious diseases and are prone to cognitive development delays; damaging long term psychological and intellectual development effects, as well as mental and physical development that are compromised due to stunting [10,36]. A malnutrition cycle exists in populations experiencing chronic under nutrition and in this cycle, the nutritional requirements are not met in pregnant women. Thus, infants born to these mothers are of low birth weight, are unable to reach their full growth potential and may therefore be stunted, susceptible to infections, illness, and mortality early in life. The cycle is worsened when low birth weight females grow into malnourished children and adults, and are therefore more likely to give birth to infants of low birth weight as well [37]. Malnutrition is not just a health issue but also affects the global burden of malnutrition socially, economically, developmentally and medically, affecting individuals, their families and communities with serious and long lasting consequences [2]. It is very significant that malnutrition is addressed in children as it manifestations and symptoms begin to appear in the first 2 years of life [35]. Overlapping with the mental development and growth periods in children, protein energy malnutrition (PEM) is said to be a problem at the ages of 6 months to 2 years. Therefore, this age and period is considered a window period during which it is essential to prevent or manage acute and chronic malnutrition [38]. Furthermore, children less than 5 years of age have a disease burden of 35% Black, et al. [10]. In 2008, 8.8 million global deaths in children less than 5 years old were due to underweight, of which 93% occurred in Africa and Asia. Walton, et al. [39] stated that approximately one in every seven children faces mortality before their fifth birthday in Sub Saharan Africa (SSA) due to malnutrition. Nigeria is the most populous nation in Africa and has a population of almost 186 million people in 2016 UNICEF [40]. With a high fertility rate of 5.38 children per woman, the population is growing at an annual rate of 2.6 percent, escalating and worsening overcrowded conditions. Hence, by 2050, Nigeria’s population is expected to grow to an astounding 440 million, which will make it the third most populous country in the world, after India and China (Population Reference Bureau, 2013). A report by the Nigeria Federal Ministry of Health [41] states that scarcity of resources and land in rural areas has resulted in Nigeria having one of the highest urban growth rates in the world at 4.1 percent. Furthermore, out of the 157 countries in progress toward meeting the Sustainable Development Goals (SDGs), Nigeria ranks 145th Sachs, et al. [42]. Malnutrition in childhood and pregnancy has many adverse consequences for child survival and longstanding wellbeing. It also has extensive consequences for human capital, economic productivity, and national development generally. These consequences of malnutrition should be a significant concern for policy makers in Nigeria, which has the highest number of children under 5 years with chronic malnutrition (stunting or low height for age) in SubSaharan Africa at more than 11.7 million, according to the Demographic and Health Survey National Population Commission and ICF International [43]. According to the World Bank [44], Nigeria’s economy is the largest in Africa and is well positioned to play a leading role in the global economy. However, despite the strong economic growth over the last decade, poverty has remained significantly high, with increasing inequality and provincial disparities. In addition, it is estimated that 69 percent of Nigerians live below the relative poverty line (US$1.25 per day), compared to the 27 percent in 1980.
Theoretical Framework
This study is anchored on two theories, which include the Theory of Reasoned Action (TRA) and the Theory of Planned Behaviour (TBP). Theory of Reasoned Action was formulated by Martin Fishbein and IcekAjzen towards the end of the 1960s. On the other hand, IcerkAjzen proposed the Theory of Planned Behaviour in 1985; which was an extension from the TRA. The Theory of Reasoned Action and Theory of Behaviour Planned combine two sets of belief variables, which are ‘behavioural attitudes’ and ‘the subjective norms’. The behavioural attitudes are defined as the multiplicative sum of the individual’s relevant likelihood and evaluation related to behavioural beliefs. On the other hand, subjective norms are referent beliefs about what behaviours others expect and the degree to which the individual wants to comply with others’ expectations. The summary of the two theories suggest that a person’s health behavior is determined by their intention to perform a behavior (behavioural intention) it also is predicated by a person’s attitude toward the behavior, and the subjective norms regarding the behavior. The Theory of Reasoned Action has been criticised because it is said to ignore the social nature of human action Kippax, et al. [45]. These behavioral and normative beliefs are derived from individuals’ perceptions of the social world they inhabit, and are hence likely to reflect the ways in which economic or other external factors shape behavioral choices or decisions. In addition, there is a compelling logical case to the effect that the model is inherently biased towards individualistic, rationalistic, interpretations of human behavior. Its focus on subjective perception does not essentially permit it to take meaningful account of social realities. However individuals’ beliefs about such issues are unlikely going to reflect the accurate potential and observable social facts. As such, the Theory of Planned Behavior updated the Theory of Reasoned Action to include a component of perceived behavioral control, which brings about one’s perceived ability to enact the target behavior. Actually, perceived behavioral control was added to the model to extend its applicability beyond purely volitional behaviors. Previous to this addition, the model was relatively unsuccessful at predicting behaviors that were not mainly under volitional control. Therefore, the Theory of Planned Behavior proposed that the primary determinants of behavior are an individual’s behavioral intention and perceived behavioral control. A constructive use of the TRA and TBP in research and public health intervention programmes might well contribute valuably to understanding issues related to health inequalities and the roles that other environmental factors have in determining health behaviors and outcomes. In spite of the criticism, the general theoretical framework of the TRA and TPB has been widely used in the retrospective analysis of health behaviors and to a lesser extent in predictive investigations and the design of health interventions Hardeman, et al. [46]. This is why there is a connection between the study and the theory; since it is health related within theoretical postulations.
Methodology
The study uses secondary data such as significant texts, journals, newspapers, official publications, historical documents and the Internet. However, the research was strictly limited to available or recorded information about malnutrition, its prevalence, effects and impacts on the Nigeria economy that can be found in scholarly journals, books and the internet. The study adopts content analysis as its method of analysis, whereby the existing literature will be considered for the analysis.
Findings and Discussion
Based on the stated research questions, the findings and discussions are purely based on the research questions. The questions are discussed as follows:
RQ1: What are the Factors or Causes of Hyper Prevalence of Malnutrition in Nigeria?
The causes of malnutrition and food insecurity in Nigeria are multidimensional and include very poor infant and young child breastfeeding or feeding practices, which contribute to high rates of illness and poor nutrition among children under 2 years; lack of access to healthcare, water, and sanitation; armed conflict, mainly in the north; irregular rainfall and climate change; hyper unemployment level; and poverty Nigeria Federal Ministry of Health, Family Health Department [41]. While chronic and seasonal food insecurity occurs throughout the country, and is worsened by volatile and rising food prices, the impact of conflict and other shocks has resulted in acute levels of food insecurity in the North East zone FEWSNET [47]. Furthermore, an approximated 3.1 million people in the states of Borno, Yobe, and Adamawa received emergency food assistance and cash transfers in the first half of 2017 but, the numbers who need assistance is likely far bigger because much of the North East zone has been inaccessible to humanitarian or aid agencies FEWSNET [47]. World Bank [44] stated that the current administration, led by President Muhammadu Buhari, identifies fighting corruption, increasing security, tackling unemployment, diversifying the economy, enhancing climate resilience, and boosting the living standards of Nigerians as its core policy priorities. On the contrary, the country is seriously facing a major challenge of threat in the northeast because of the militant Islamic group, Boko Haram, which is destroying infrastructure and conducting assassinations and abductions. As of August 2017, conflict in northeastern Nigeria had displaced more than 1.7 million people within the country and forced nearly 205,000 people to flee into neighboring Cameroon, Chad, and Niger Republic, making it difficult to access food resources in the regions. In addition, violence has interrupted agricultural and income generating activities, reducing household purchasing power and access to food. Furthermore, populations in the regions of northeastern Nigeria are inaccessible to humanitarian assistance and markets are in terrible conditions USAID [48]. Hence, diet related non communicable diseases are also on the increase in Nigeria due to globalization, urbanization, lifestyle transition, socio cultural factors, and poor maternal, fetal, and infant nutrition Nigeria Federal Ministry of Health, Family Health Department [41]. Other factors include, those related to women’s empowerment, such as mothers’ working status, control over resources and educational attainment. In rural areas, children of working mothers are significantly less possible to be undernourished than children living in households where mothers do not work (Ajieroh, 2009). Hence, in Nigeria, children from the poorest households are almost 3 times more likely to be stunted and almost 4.3 times more likely to be severely stunted compared to children from the richest households. Similarly, according to NPC and ICF International (2014) the findings of a study of factors affecting Nigerian children’s nutritional status suggest that households’ economic status is significantly associated with their nutritional status. This is because the very poor and the poor constitute 74% of the population and cannot afford a nutritious diet. Furthermore, the analyses of regional differences in child malnutrition reveal important spatial inequalities. The prevalence of underweight, stunting and wasting is generally higher in the northern than the southern states. The highest proportions of malnourished children were found mainly in Bauchi, Jigawa, Kaduna, Katsina, Kebbi, Sokoto and Zamfara states. In all these states the occurrence of stunting exceeds 50%. In other states, such as Gombe, Taraba, Yobe and Kano, the prevalence of stunting exceeds 40%. All the states in the North West (except Jigawa and Zamfara) show higher figure than the national average prevalence of acute malnutrition (wasting). In addition, the North-Eastern states of Bauchi, Borno and Yobe have excessively high burden of wasting, with Kano State showing more than twice the national average (39.7%). Severe acute malnutritionis highest in Kaduna (27.6%) and Kano (25.1%) and lowest in Bayelsa (1.3%). Consequently, the UN Office for the Coordination of Humanitarian Affairs (2014) stated that Nigeria has the second highest acute malnutrition burden in the world, with an estimated 3.78 million children suffering from wasting.
RQ2: What are the Mental and Intellectual Effects of Hyper Prevalence of Malnutrition in Nigeria of Under Five Children?
The growth of the brain, including neurodevelopment begins in the womb within one week of conception. During this period of rapid growth, protein and energy (from carbohydrates and fat sources) are extremely important. A lack of these nutrients can have very damaging effects. Fuglestad, et al. [49] showed a higher occurrence of brain abnormalities at two years of age among children affected by foetal under nutrition. Furthermore, studies of young children with protein energy malnutrition alsoindicated brain atrophy; a shrinking of brain cells due to a lack of nutrients Blaack, et al. [10]. In addition, inadequate calories have continue to affect children’s brain growth and enlargement immediately in the first months after birth, which was supposed to be a time of fast neurodevelopment, including the establishment of the parts of the brain fundamental for memory (the hippocampal-prefrontal connections Fuglestad, et al. [49]. The deficiency of iron also complicates the growth period of a child. Iron deficiency before two to three years of age may results in intense and possibly permanent myelin (fatty lipids and lipoproteins, which surround the axon of a nerve) changes Fuglestad, et al. [48]. Iron also facilitates the production of neurotransmitters – the chemicals that pass messages between neurons, and it is involved in the function of neuroreceptors, which receive the neurotransmitters’ messages Jukes, et al. [50]. According to Allen [51], emergent evidence suggests that maternal iron deficiency in pregnancy reduces foetal iron stores, perhaps into the first year of life. This leads to greater risk of damages in future mental and physical development. Furthermore, the deficiency of iron is a strong risk factor for both short and long terms cognitive, motor and socio emotional deterioration Prado & Dewey [52]. Besides, longitudinal study like Grantham-McGregor, et al. [53] have indicated that children who are anaemic during infancy have poorer cognition, lower school achievement and are more likely to have behaviour problems in later childhood; an effect that could occur as a result of direct biological processes or as a consequence of the impact of anaemia on children’s education experiences. Iron deficiency is pervasive. Virtually half of children in low and middleincome countries, that is 47% of under 5 are affected by anaemia, and half of these cases are due to iron deficiency World Health Organization [54]. According to the World Health Organization (WHO), 42% of pregnant women (56 million) suffer from anaemia Goonewardene, et al. [55]. Iodine deficiency is known to be the world’s single greatest cause of preventable mental retardation. In 2007, WHO estimated that nearly 2 billion people had deficient iodine intake, and one third of them are children of school age The Lancet [56]. Iodine is indispensable to the production of thyroid hormones, which are essential for the development of the central nervous system. Serious iodine deficiency before and during pregnancy can lead to underproduction of thyroid hormones in the mother and cretinism (a condition of severely stunted and mental growth due to birth deficiency of thyroid hormones) in the child Prado, et al. [51]. Cretinism is characterized by mental retardation, deaf mutism (a psychological disorder in which it is difficult for the individual to speak in certain situations), partial deafness, facial deformities and cruelly stunted growth. It can lead on average to a loss of 10–15 intelligent quotient (IQ) points Morgane, et al. [57]. In addition, Fuglestad, et al. [48] stated that mild iodine deficiency can decrease motor skills. Zinc plays an important role in brain development and is known to be vital for efficiency of communication between neurons in the hippocampus, where learning and memory processes occur Duke University Medical Center [58]. It is also fundamental to other biological processes that affect brain development, including DNA and RNA synthesis and the metabolism of protein, carbohydrates and fat Prado, et al. [51]. Additionally, Hamadani, et al. [59] stated that although the results of studies on the impact of zinc supplementation on cognitive outcomes are inconsistent, there appears to be a relationship between zinc deficiency and children’s cognitive and motor development, including among low birth weight children Folate is prerequisite during initial foetal development to prevent neural tube defects and make sure that the neural tube forms accurately to create the brain and spinal cord. Iron folate supplementation is also significant for pregnant and breastfeeding mothers to prevent iron deficiency anaemia Black, [10]. Vitamin B12 and folate works together to produce red blood cells. Black [10] further stated that the deficiencies in both could affect brain development in infants. Like iron, vitamin B12 is also essential to the myelination process. Neurological symptoms of vitamin B12 deficiency appear to affect the central nervous system and in severe cases cause brain atrophy.
RQ3: What are the Impacts of Hyper Prevalence of Malnutrition on the Future of the Nigeria Economy?
According to Save the Child [60] the benefits of good nutrition do not stop with better educational results. By improving cognitive abilities, health, physical strength and stature, good nutrition in the early years can lead to greater wages in adulthood and hence promote the economic development of an entire country. In addition, Save the Child [60] presented evidence that stunted children earn as much as 20% less than their counterparts, and uses this to estimate that today’s malnutrition could potentially cost the global economy $125 billion when children born now reach working age. Hence, the interrelation between improved nutrition and economic growth is of great importance for human and economic development. It is a two way relationship. On the one hand, inclusive economic growth can contribute towards reductions in the prevalence of malnutrition. On the other hand, declines in malnutrition can have a transformative effect on the economic ability of individuals and the whole societies. Thus, by means of its impact both on children’s cognitive development and on their physical health and development, malnutrition can have momentous effects on an individual’s economic wellbeing in future. The World Bank (2006) suggests that malnutrition results in10% lower lifetime earnings, whilestudy like Save the Child [60], that modeled the impact of malnutrition in the first 2-5 years of life placed this figure at 20%. Lancet Series (2008) reviewed cohort studies from Brazil, Guatemala, India, the Philippines and South Africa that all monitored children into adulthood, and established that stunting is associated with reduced earnings in later life. Similarly, Victoria, et al. [61] stated that the same review discovered that less severe stunting in Brazil and Guatemala was associated with higher adult incomes among both men and women. Furthermore, models using proof from across these longitudinal studies, combined with evidence on the relationship between education and earnings taken from 51 countries, have estimated that children who are stunted at age five earn 22% less than their non stunted counterparts. In addition, data from the same study has been used to evaluate that individuals who were not stunted in early childhood were more likely, by 28 percentage points to work in higher paying skilled labour or white collar work and earned as much as 66% more as adults Hoddinott, et al. [62]. Part of the impact of malnutrition on earnings may be because of the influence on children’s physical development. Study like Morganeet, et al. [56] has confirmed the correlation between adult height and wages.For example, a large cross sectional study in Brazil found that a 1% increase in adults’ height was associated with a 2.4% increase in earnings. Francis and Iyare (2006) and Islam et al., (2006) stated that there is a flawless association between education levels, and individuals’ subsequent earnings. Very importantly, the latest evidence suggests that it is actual learning and the acquisition of skills that matter most, not just the number of years spent in school Hanushek, et al. [63]. This is another reason why early childhood development, boosted by good nutrition, is very vital. Hence, children need to start school ready to learn, rather than struggling to understand what the teacher is trying to teach and impart. Therefore, according to Currie, et al. [64] given the significance of cognitive and educational outcomes on wages, this is likely to be a key pathway that links nutrition to later economic wellbeing. In actual fact, nutrition’s relationships with cognitive and educational development may be the most important pathway in terms of its impacts on wages. Save the Child [59] reported that the economic impacts of malnutrition are larger for those working in more skilled jobs than for those in manual jobs. Baird, et al. [65] showed that among those working for wages or operating small businesses as adults, those who had received an intervention to improve nutrition as children worked on average five extra hours per week, and earned 20% more than those who didn’t. These impacts were much larger than increases seen for farm workers. Hence, nutrition is not only significant for increasing economic outcomes of individuals; it is important for nations’ economic development. Malnutrition also affects national economies by increasing healthcare costs, as people who were malnourished as children are more likely to fall ill to diseases Currie, et al. [64-78].
Conclusion
Diet is the number one risk factor for disease in the world; carrying a superior risk of ill health than smoking or drinking alcohol. According to the World Health Organization, 462 million adults are underweight, while 1.9 billion adults are overweight and obese. In children under 5 years of age, 155 million are stunted, 52 million are wasted, 17 million are severely wasted and 41 million are obese. Globally, there is hunger and malnutrition ravaging the world with a current estimated value of 1 in 9 people out of the 820 million people who are hungry or undernourished. Thus, the study found that presently Nigeria is one of the African countries listed among the 20 countries responsible for 80% of global malnutrition. The finding of the study also revealed that over the years, two main types of malnutrition have been identified in Nigerian children: protein-energy malnutrition and micronutrient malnutrition. The study discovered that the causes of malnutrition and food insecurity in Nigeria are multidimensional and include very poor infant and young child breastfeeding or feeding practices, which contribute to high rates of illness and poor nutrition among children under 2 years. The study discovered that young children with protein energy malnutrition suffer from brain atrophy; a shrinking of brain cells due to a lack of nutrients. The findings of the study revealed that stunted children earn as much as 20% less than their counterparts, and that today’s malnutrition could potentially cost the global economy $125 billion. The study concludes that nutrition is not only significant for increasing economic outcomes of individuals; it is important for nations’ economic development, especially for a developing country like Nigeria.
Effect of Operating Parameters and Particle Size of Calcium Carbonate on the Physical Properties of Latex Paint
Introduction
Paint is a liquid which spreads over a substrate in the form of thin layer and it is transformed into a solid adherent film [1]. There are two major functions of paint. One protection and other is decoration. The earliest known use of paints dates back more than 30,000 years to cave paintings in Spain [2]. These paints were simply mixtures of colored earth, soot, grease, and other natural substances. The ancient Greeks, Romans, and Egyptians used natural resins and raw materials to decorate and identify statues, tools, vessels, and buildings [2,3]. These natural ingredients include vegetable gums, starches, and amber. In China and India, shellac resins and beeswax were used over 2000 years ago as a decorative coating which also doubled as a protective function [4]. The earliest paint formulation dates back roughly 900 years to a German goldsmith and monk, Rodgerus von Helmershausen [2,3]. His formulation described the manufacturing of paint by mixing linseed oil and amber, referred to as paint boiling, which was further refined and developed into the Industrial Revolution [2,3]. Synthetic polymer chemistry also developed at this time with Carothers and others in the 1920s [5]. Paint is used to protect and color the substrate. Components of paint are solvent, pigment, filler, additives and binder. A coating is a product based on organic binders, which provides a cohesive, non-absorbent, protective film [2]. Differences in the composition of the various coatings systems are presented in (Tables 1 & 2).
Table 1: Typical composition of various coating systems.
Table 2: Differences between step-growth and chain-growth polymerization.
Common to all three coating systems are the resin and additive. Clear coats are optically inactive; therefore pigments and fillers are not present. Powder coatings are not in a liquid medium; therefore a solvent is not present. Paints are liquid materials that are optically opaque coatings that form when applied by brushing, rolling or spraying [2,3]. The technical definition of a binder is the non-volatile part of a paint excluding the pigments and filler, which includes the non-volatile additives [2]. Binder forms the film of the paint. Binder is a polymer which has impact on important properties of the paint like adhesion to the substrate, sheen, application properties, color acceptance, durability and flexibility. There are different types of binders like synthetic binders and natural binders. Water based paints binders include poly vinyl acetates, poly vinyl acrylic, styrene acrylic, pure acrylics, etc. Oil-based paints include alkyd resins, polyurethane resins, melamine resins, etc. Natural oils or fatty oils were important film forming agents which were able to convert a low viscosity liquid into a solid [3]. Synthetic resins came about in the 1920s with the advancements in polymer chemistry. The primary benefits of synthetic resins are that products can be tailored with specific properties with nearly unlimited availability. The different resin systems are mentioned above, all of which are either step-growth or chain-growth polymerization [6].
Chain-growth reactions typically have three reactions – initiation, propagation, and termination. Step-growth polymerizations are reactions between functional or multifunctional monomers without an initiation or termination step. Characteristics common in pigments include extreme optical characteristics, particles smaller than 10 μm, being insoluble in water and most organic solvents, and being chemically inert or chemically stable [7]. A comparison between the organic and inorganic pigments is presented in (Table 3) [2]. Colored inorganic pigments are typically variants of iron oxides [3]. Pigments are used for giving color contribution in paints. There are different types of pigments like natural or synthetic. Pigments give opacity to the paint film. There are many kinds of pigments like titanium dioxide, phthalocynine blue, pthalocyninered, iron oxide, etc. Common filler materials include carbonates, silicon dioxide, silicic acids, silicates, and sulfates [2,3,6]. Fillers are used to give toughness and lower the cost of the paint by increasing the density of the paint. The examples of natural fillers are grounded calcium carbonate, magnesium silicate, etc. The examples of synthetic fillers are precipitated calcium carbonate, aluminum silicate, etc. These pigments and extenders are commercially available in solid or slurry form. Slurry is an aqueous solution that contains dispersed pigments or extenders. In a paint application, the pigment and extenders are eventually dispersed in some sort of medium. The dispersion process involves 3 steps – wetting, separation, and stabilization [6]. The refractive index can be described as the degree of bending of light as it passes through a material. This value is a dimensionless value and is typically referenced to light traveling in a vacuum. Larger refractive indexes reflect a greater degree of bending of light. The refractive index of pigments and film formers are presented in (Table 4). TiO2 is not used as a biocide, but has some antimicrobial properties due to the photo catalytic reaction mentioned earlier [8,9]. Filler or extender particles such as calcium carbonate (CaCO3) primary serve as replacement for the binder material. Reasons include the lower cost of filler materials or formulation above critical pigment volume concentration. Pigment volume concentration (PVC) is the most widely accepted quantitative description of paint film composition [1]. PVC is expressed as volume percentage of the pigments and fillers to that of the volume of the dry film expressed as a whole number. Volume is used rather than weight because pigments scatter based on volume. PVC values are quantifiable between 0 – 100. Solvent is used to form a homogenized mixture by dissolving the polymer and pigments. Solvent also adjusts the viscosity of the paint. Solvent is a volatile part of the paint. Functions of solvent also include flow control flow, stability of paint liquid and improving application properties.
Table 3: Comparison between inorganic and organic pigments.
Table 4: Refractive Index (R.I.) of Common Materials in Paint.
The main solvent for water based paints is water. The solvent for oil-based paints can be white spirit, mineral turpentine oil, alcohols, ketones, etc. Additives are liquids which gives dramatic effect on paint quality. There are different functions of different additives. Some additives change the surface tension of the paint film; some additives enhance the flow pattern of the paint or improve the appearance of the paint. Different additives have different impact on the liquid paint or paint film like changing wet edge, increasing stability of the pigments used, ant freezing effect, low foaming, less skinning, etc. There are different types of paint additives like gelling agents, hydroxyethyl cellulose, emulsifiers, different biocides, UV stabilizers, etc. Emulsion paints are waterbased paints containing water, binder, additives and pigments. Curing of Emulsion latex paints is done by coalescence. Coalescence is a process in which the coalescing solvent draws together and the binder particles are soften to bind them together into irreversibly bound networked structures. Alkyd enamel are paints that cure by oxidative crosslinking. These paints need drier additives like cobalt naphthenate, calcium naphthenate and lead naphthenate to start oxidation process for drying. Some paints are one or two package coatings. These paints dry through a chemical reaction.
Materials and Methods
The following Instruments and Analyzers Were used to Analyze Various Properties of Paint Samples
1. Conventional Agitator, (laboratory mixer manufactured by BEVS Industrial Co. Ltd., China. Model: BEVS 2501/1) 2. Brookfield DV2T viscometer 3. Nano grinding machine (nano mill manufactured by Dongguan Longley Machinery Co. Ltd. China. Model no. NT-1L) 4. Spectrophotometer, model data color 110 5. Grind Gauge, sheen UK, range 0-100 μm 6. Hiding Power Charts, sheen UK, Coated, 255 x 140 mm 7. Automatic film applicator (manufactured by BEVS Industrial Co. Ltd., China. Model Number :BEVS1811/2) 8. Tri-Glossmaster , sheen UK, angles 20-60-85° 9. Wet abrasion scrub tester 10. Stop watch 11. Cryptometer , sheen UK, with K007 plates 12. Pyknometer, sheen UK 13. Malvern Mastersizer, Malvern Instruments Ltd. UK. 14. Brookfield KU-1+ viscometer 15. High speed agitator, rpm 1400
The Following Chemicals were used in the Preparation of Paint Samples
1. Water 2. Dispersant, solution of an ammonium salt of an acrylic polymer in water 3. Calcium carbonate, 400 mesh particle size 4. Hydroxyethyl cellulose thickener powder 5. Ammonium hydroxide solution (25% actives) 6. Latex binder, which is ter polymer of vinyl acrylic emulsion 7. Biocide A, a water based combination of chloromethyl-/ methylisothiazolone (CMI/ MI) and O-formal 8. Biocide B, a combination of two isothiazalone derivatives that can provide broad-spectrum micro-organism control in waterbased coatings
Sample Preparation
Determination of Dispersant Demand
The first step in sample preparation was to determine dispersant demand for current 400 mesh calcium carbonate sample. The complete covering of the surface is an indispensable prerequisite to achieve an ideal stabilization of the dispersed pigments. The fact that the viscosity of pigment slurry reaches a minimum when the pigment surface is completely covered with a dispersant is used to determine the dispersant demand. The dispersant is added in portions to the stirred pigment slurry. After the addition and mixing the viscosity is measured at low shear rates (e.g. with a Brookfield viscometer). The dispersant is added until a minimum of viscosity or constant viscosity is obtained in the viscosity measurements [10].
Procedure for Dispersant Determination
440 gm water was taken in 2500 mL agitated tank of laboratory mixer (Figure 1). Mixing at 500 rpm was started and 1500 gm calcium carbonate of particle size 400 mesh was added in mixing tank. Dispersion of calcium carbonate slurry was done for 05 minutes under 1000 rpm. Viscosity was measured at 25C using Brookfield KU-1+ viscometer following the standard ASTM D562. i.e. “Standard Test Method for Consistency of Paints Measuring Krebs Unit (KU) Viscosity Using a Stormer-Type Viscometer”. The effect of successive addition of 2 gm dispersant on the viscosity of the sample was observed under the same operating conditions as shown in the (Table 5). The procedure was continued till no significant change in viscosity was observed. (Figure 2) shows that optimum dispersant demand was 22 gm for 1500 gm CaCO3 of particle size 400 mesh after which no significant change in viscosity was observed.
Table 5: Dispersant requirement.
Figure 1: BEVS laboratory mixer.
Figure 2: Viscosity versus Dispersant quantity.
Calcium Carbonate Slurries Preparation
The composition of calcium carbonate slurry was prepared as shown in (Table 6) using nano mill (Figure 3) adjusting pneumatic pump pressure between 0.2 to 0.4 MPa. The speed of the nano shaft was adjusted at 2500rpm.Flow rate of calcium carbonate slurry coming out of the nano mill was adjusted around 3 gm/ sec. Dispersion was checked through ASTM-D 1210. i.e. “Standard Test Method for Fineness of Dispersion of Pigment-Vehicle Systems by Hegman-Type Gage”. The term ‘fineness of grind’ is defined as the reading obtained on a gauge under specified conditions of test and the reading indicates the depth of the gauge at which discrete solid particles are readily discernible. Dispersion of calcium carbonate slurry found on hegman guage was below 10 micron. The similar composition (Table 6) was prepared using laboratory mixer. Dispersion of calcium carbonate slurry found on hegman guage was 50 micron.
Table 6: Calcium carbonate slurry composition.
Figure 3: Nano mill.
Determination of Various Properties of Paint Samples
Panels Applications
Panels are applied on hiding power charts through Automatic Film Applicator following the standard ASTM D 823-95.i.e. “Producing Films of Uniform Thickness of Paint, Varnish, and Related Products on Test Panels” as shown in (Figure 4). This standard is under the jurisdiction of ASTM Committee D01 on Paint and Related Coatings, Materials, and Applications and are the direct responsibility of Subcommittee D01.23 on Physical Properties of Applied Paint Films. From the panels drawn, difference in physical properties of latex paints were observed in terms of viscosity, density, pH values, wet hiding, gloss, smoothness, drying time, whiteness, scrubs and opacity. The results so obtained are summarized in (Tables 7 & 8).
Table 7: Latex Paint composition.
Table 8: Specifications of paint samples manufactured through Nano Mill and Conventional Agitator.
Figure 4: Comparison of Wet panel (left) and Dried panel (right) for (a) nano mill (b) and conventional agitator.
Wet and Dry Opacity
Wet hiding was checked through Crypto meter. The Crypto meters offer a quick method to determine the wet opacity, hiding power and coverage in square meters per liter of liquid coating materials. A small sample of liquid coating (approximately 4ml) was applied on the joint line of the black and white base plate, the top plate (pins facing downwards) was placed across base plate joint line the sample forms a wedge of paint, (maximum thickness nearest the pins) by sliding the plate back and forth till the sample perfectly hides both the black and the white section of the base plate. At the position of hiding a reading was observed on the engraved scale of the Base Plate, this was then converted into covering power (Square meters/liter).Top Plates (number K007) were offered with each of the Crypto meter products to cover a range of film thickness.
Gloss Measurements
Gloss was tested through Tri-Gloss master following the standard ASTM D2457. i.e. “Standard Test Method for Specular Gloss of Plastic Films and Solid Plastics”.
Dry Hiding and Whiteness
Dry Opacity was checked through Spectrophotometer data color 110.
Drying Time
Drying time was measured through stop watch at ambient temperature.
Adhesion / Scrubs
Scrubs were checked through Wet abrasion scrub tester following the standard ASTM D 3450. i.e. “Standard Test Method for Wash ability Properties of Interior Architectural Coatings”.
Viscosity
Viscosity was tested through Brookfield DV2T latest viscometer following the standard ASTM D1084. i.e. “Standard Test Methods for Viscosity of Adhesives”.
Density
Densities of the samples were measured through Pyknometer following the standard ASTM D1475. i.e. “Standard Test Method for Density of Liquid Coatings, Inks, and Related Products”.
Specific Surface Area and Particle Size
Specific surface area and Particle size of calcium carbonate slurries manufactured through nano mill as well as through conventional agitator was tested with Malvern Mastersizer
PH Value
PH values of the samples were tested through pH meter following the standard ASTM ASTM E70 – 07(2015). i.e. “Standard Test Method for pH of Aqueous Solutions with the Glass Electrode”.
Discussion and Results
Paint in which calcium carbonate slurry processed from Nano mill showed brilliant results in terms of wet opacity, dry opacity, gloss, smoothness and drying time compared to the paint in which calcium carbonate slurry processed through laboratory mixer as shown in (Figure 4). All quality parameters were significantly increased in the paint in which calcium carbonate slurry processed from Nano mill.
Conclusion
It is observed that with the reduction of particle size of calcium carbonate, latex paint showed better results in terms of better hiding, better whiteness, higher gloss, more adhesion. Calcium carbonate slurry processed through Nano mill showed exceptionally good compared to conventional agitator. The slurry processed through Nano Mill reduced the particle size of calcium carbonate from 37.5 microns to 2.63 microns while the slurry processed through conventional agitator reduced the particle size of calcium carbonate from 37.5 microns to 18.05 microns. Furthermore, the paint manufactured with Nano mill slurry showed better Whiteness, wet hiding, dry hiding, adhesion and gloss than the paint manufactured with conventional agitator.
The Seroprevalence of SARS-CoV-2 Antibodies in Romania – First Prevalence Survey
Introduction
The infection with the new Coronavirus generated important socio-economic transformations, through social distancing measures, with profound economic implications, but also a lot of concern, due to evolutionary and clinical complications and lack of specific treatment. The severe acute respiratory syndrome coronavirus 2 (SARS-CoV-2) associated disease – 2019 (COVID-19) has spread globally, affecting in one year and half over 170 million people from more than 180 countries or regions, leading to a global pandemic with a fatality rate of 2.1% [1]. The laboratory diagnosis of suspected COVID-19 clinical / contact cases is based on the detection of SARS-CoV-2 viral genome by qRT-PCR assays. However, asymptomatic or mild COVID-19 infections remain undiagnosed, therefore the burden (incidence and spread) of SARS-CoV-2 infection can be underestimated, affecting the implementation and efficiency of infection control and prevention measures. Given this limitation, countries are seeking to assess the spread of the infection in the population through prevalence studies conducted on study groups which are representative for the general population [2,3].
The surveys conducted in the first half of the year 2020 in different countries or geographical regions on populations of different sizes revealed different seroprevalence rates, ranging from <0.1% to more than 20% and that it can increase over time during longitudinal follow-up. In Europe, the seroprevalence reported by different countries was in decreasing order Italy (11.0%) [4], Switzerland (weekly seroprevalence rate of 4.8% to 10.8% during five weeks) [5], France (between 3.8 and 10% in different regions) (2), Spain (4.6%) [6], Denmark (1.9%) [7], Greece (0.42%) [8]. In USA, a great variation of seroprevalence was reported for different geographical regions (1.0% – 31.5%) [9,10], while for Brazil the rate was 3.8% [11]. In South America, Chile reported a seroprevalence of 13,4 – 16% [12]. In Africa, Kenya reported a crude seroprevalence of 5,6% and a study done in Alzintan City of Libya presented a seroprevalence of 2,74% [13,14].
In Asia, the highest rates were reported for Pakistan (15.6- 37.7%) [15], Guilan province, Iran (22%) [16], in China different serological studies reported positivity rates ranging from 0.6% in Chengdu, Sichuan to 3.8% in Wuhan, Hubei [17], while the lowest rates were recorded in Malaysia (0.4 – 0.6%) [18] and South Korea (0.07%) [19]. Japan reported 3.3% seroprevalence in Kobe [20] and a cumulative case detection ratios (2.6 – 8.7%) at 3 prefecture-level seroprevalence (Tokyo, Osaka and Miyagi) [21]. All studies reported a higher seroprevalence rate in males, although the differences are not statistically significant [22]. Considering the large variation of seroprevalence among different populations, filling the gap with data from different geographical regions is needed in order to better evaluate the burden of COVID-19 pandemic. This study reports for the first time the results of a seroprevalence survey performed in the Romanian population, to estimate the degree of spread of SARSCoV- 2 infection and to substantiate the measures to respond to the COVID pandemic that will be adopted at the level of the Romanian health care system for the next period.
Material and Methods
In this study, people that presented themselves conjuncturally at selected laboratories have been invited to participate in the seroprevalence survey. The participating laboratories were selected from each of the 42 counties of Romania.
Study Design and Participants
A cross-sectional study was performed to assess the SARSCoV- 2 antibody seropositivity prevalence. The study used a nonprobability sampling method, known as convenience sampling. The sampling strategy had two steps: the selection of laboratories and the selection of persons. The inclusion criteria for the laboratories were the following: either public or private facilities, with high addressability (over 40000 samples per year) and serving ambulatory patients (non-hospitalized). Based on these criteria, each of the 42 County Public Health Directorates over the country selected between 3 and 5 laboratories to participate in the study (except Bucharest Public Health Directorate, which selected 9 laboratories). Inclusion and exclusion criteria for the enrolment of the study subjects were also defined. In order to be selected, people from all ages that presented themselves conjuncturally at the selected laboratories for check-ups were invited to participate in the study. They should not present signs of symptoms of respiratory infection or requested to be tested for Covid-19. The participants to the study were selected based on a sampling step, and only individuals who expressed their informed consent to participate in the study were enrolled.
If a person qualified in the sampling step did not agree to participate in the study, the next person was asked if willing to be enrolled. The data collection took place between July and October 2020. The participants had to sign an informed consent to be included in the study (for children the consent was signed by the parent/legal representative). The participants had also to provide their demographic information, that included age, gender, city of residence and personal pathologic history. The seroprevalence analysis involved residual serum obtained from these individuals. The size of the study sample was calculated using the EpiInfo 7 program, for obtaining regional and decadal age-group representation. The regional sample for a specific agegroup was proportionally allocated for the counties in the region, considering their total population for the corresponding age-group. The resident population of Romania from July 1, 2018, on decadal age groups was used, with an expected frequency of SARS-CoV-2 infection in Romania of 50% on each age group, an accuracy of 95% CI, error accepted 5 % and 5% losses accepted for each age group in the region.
Procedures
All the serum samples of the enrolled participants were analyzed by the National Institute of Public Health laboratory, using a chemiluminescent technology (CLIA) based assay to detect the anti-SARS CoV-2 antibodies of the IgG type. The samples were kept at temperatures between minus 12 and minus 20 degrees Celsius. Transportation of residual serum samples was done using refrigeration machines and, exceptionally, isothermal bags with ice packs. The quality criteria for the serum samples were the following: blood samples collected in biochemistry vacuums, without anticoagulant, with or without separating gel; samples with a serum volume of 0.5-1 ml for the age group 0-14 years and 1-2 ml in people over 14 years. The residual serum from people that were suspected of Covid-19 and those presenting jaundice, haemolysis or superinfection (with flakes or veil) were not considered.
Ethics Statement
The existing study protocol was reviewed and accepted by the Scientific Council of the National Institute of Public Health – Research Ethics Committee. The seroprevalence study was performed in full compliance with the principles of ethics and confidentiality of personal data. Written informed consent was obtained from all eligible for enrolment individuals, while all professionals involved in the collection, retrieval and storing of data have signed a confidentiality agreement.
Results
Of all the individuals that presented themselves at the selected laboratories across 8 regions of the country, 19738 agreed to participate in this study and 19597 provided a serum sample for which a CLIA result of anti-SARS-CoV-2 IgG specific antibodies was available. Males represented 36.2% of the total study population and this could be probably associated to the higher health-related concern of females in general, considering that the selection was conjunctural (people addressing themselves for different blood tests). The sample population had a mean age of 46.61±21.08 years and a median age of 48 years. The proportion of each decadal age-group is shown in Figure 1. As could be noticed, the young age-groups were seriously under-represented, meanwhile the agegroups 50-59y, 60-69y and 70-79 y were slightly over-represented (last-one in particular).
Figure 1: Proportion of the decadal age-groups in total population – sample versus country population.
Seroprevalence at National Level
Overall, we found 1213 positive IgG samples in the study population, resulting in a seroprevalence rate of 6.19% (95%CI: 5.85:6.53). The seroprevalence rate by age-groups at national level is shown in Table 1. The level of protection was similar in children and young adults (slightly higher in children, but statistical significance was not met). The middle aged adults, especially the age-group 40-49 years showed a significantly higher level of protection. Population aged 60+ years seemed to be less protected compared to both adults and children. A statistically lower level of seroprevalence was revealed between each elderly age-group compared to middle-age adult population. A slight difference in seroprevalence was found compared to children and young adults, but this did not meet the statistical significance. We found also differences within the elderly groups. The seroprevalence seemed to be lower over the age of 70 years, compared to age-group 60 – 69, but, again, this difference did not meet the statistical significance.
Table 1: The seroprevalence rate by age-group.
Seroprevalence by Regions
Romania is divided in eight region: North-East (NE), South- East (SE), South (S), South-West (SW), West (W), North-West (NW), Center (C) and Bucharest-Ilfov (BI) – the last-one including the capital city of Bucharest. By comparing the regions with the national rate, we found significantly higher prevalence in NE, S and SW, and significantly lower one in NW, C and BI (Table 2).
Table 2: The seroprevalence rate by regions.
Seroprevalence by Age-Groups – Regional Versus National Level
The seroprevalence by age-groups in the regions is shown in Table 3. Although the seroprevalence for each age group registered some variations among regions, significant differences compared to the national level were found only in limited cases. Thus, we found significantly lower seroprevalence rates compared to the national level in the regions NW (age-groups 10-19y and 30-59y) and Centre (age groups 30 – 39y and 40-49y). The only situation with a significantly higher level of protection was age-group 40-49y, in the NE region.
Table 3: Seroprevalence by age-groups in the regions.
Seroprevalence in the Capital Region (BI)
The enrolment rate in the Bucharest-Ilfov region was from far very poor (23% of planned). Table 4 provides details about the number and age of participants in Bucharest. Out of 845 participants, 30 tested positive for SARS-CoV-2-specific IgG antibodies, meaning a seroprevalence of 3.55% (2.30:4.80). A very limited number of cases was enrolled in the extreme age-groups (children and elderly population) and nonpositive case has been identified in age-groups 0-9y and 70-79y. The proportion of males was 33.3%, slightly lower compared to the national proportion (36.2%), but without statistical significance (p=0.081, Chi Square test). From the total positive cases, 18 were females and 12 were males. The enloled and positive cases are shown in Table 4.
Table 4: Seroprevalence by age-groups in the regions.
Discussion
Given that the vast majority of infection cases remains asymptomatic, countries are seeking to assess the spread of the infection in the population through seroprevalence studies with representation for the general public. The aim of this study was to estimate the degree of spread of SARS-CoV-2 infection in the Romanian population. In this purpose, we have assessed, using a chemiluminescence immunoassay, the anti-SARS-CoV-2 IgG antibodies, as they last longer than IgM and therefore, play a crucial role in assessing the real prevalence of the virus [23]. SARS-CoV-2 invades human cells by binding the spike protein to the membrane protein receptor of the cell. The genome of this virus encodes four key proteins – spike (S), nucleocapsid (N), envelope (E) and membrane (M) [24-27]. As the spike protein is involved in the first step of the infectious process, represented by the interaction with specific receptors, followed by virus internalization in the infected cells, there are many assays that detect the specific antibodies anti-S protein of SARS-CoV-2. Chemiluminescence immunoassay represents an indirect detection method of the anti-SARS-CoV-2 antibodies [28].
It can detect either IgM or IgG in serum [29]. Different countries tested the performance of CLIA, all indicating good specificity, sensitivity and its convenience for sampling [29-31]. Other studies used this method on a specific population to report the seroprevalence: private healthcare group in Fukushima Prefecture, Japan [32]; elite football players in Germany [33]; multicenter, primary care, and emergency care facilities in North Carolina [34]. The findings in this seroprevalence study for SARS-CoV-2 suggest that the prevalence of IgG antibodies against the Spike protein of SARS-CoV-2 is over 6% in Romania. However, according to the official data reported from the surveillance system, the cumulated notification rate for confirmed COVID-19 cases reached to 1.27% at end October 2020, when our study was finished. Our results support the data published regarding the lower proportion of COVID cases which are generally requiring health care, based on the severity of their symptoms The overall seroprevalence in Romania was lower than that recorded in Sweden, but higher than reported in Germany and Spain [2]. However, it should be noted that the specified studies presented a number of differences, regarding the number of participants, time frame and the methods that were used to evaluate the presence of antibodies.
The more modest seroprevalence rate among elderly could be a reason for consideration in the next planning phase for controlling the pandemic. Also we found interesting and significant geographical variations among regions, which could be an argument in favour of adopting public health interventions tailored to the epidemiological situation in the region, even with particularization for the smallest territorial units. Our study has a number of limitations. Although convenience sample is a common strategy used by many researchers, it can provide biased results because this method has the possibility to over/underrepresent a population [35]. The response rate to the study invite achieved lower levels in extreme age-groups. This is normal, because generally the parents could be reluctant or hesitant in agree the enrolment of their children in surveys. On the other hand, the children are less likely to perform blood tests compared to the adults, thus their enrolment was more difficult. As for the elderly, due to the epidemiological situation, they might avoid or postpone their usual blood tests. Women were represented in a higher proportion than men in this study, meaning that women could be more interested in participating in surveys, or more active in general, in investigating their health status.
Conclusion
Our study suggests that the real number of individuals infected with SARS-CoV-2 in Romania exceeds by around five times the number of reported cases confirmed by PCR. Therefore, data on seroprevalence are very important for understanding the magnitude and distribution of the pandemic at country level. Repeating the study after the vaccination campaign could provide strong indications about the further needs of public health interventions.
Opportunistic Diagnosis of Osteoporotic Vertebral Fractures on Imaging Studies performed for Alternative Clinical Indications
Introduction
In an era of increasing life expectancy, osteoporosis has become a major global health concern [1,2]. Osteoporosis is a skeletal disorder characterised by compromised bone strength which predisposes to increased fracture risk [2]. At least one third of all post-menopausal women, and one fifth of men older than 50 will suffer an osteoporotic fracture in his/her lifetime [3-5]. The National Osteoporosis Foundation (NOF) estimates that approximately 54 million Americans suffer from osteoporosis resulting in 2 million fractures annually [6]. Population-based studies have demonstrated an increasing prevalence of osteoporotic fractures resulting in hospitalisation, increased morbidity and mortality and placing increasing burden on healthcare systems [7-9]. Vertebral fractures (VF) account for up to 50% of osteoporotic fractures making them the most common fracture subtype [10]. The incidence of vertebral fractures increases with age [10,11]. Up to 26% of Scandinavian women are diagnosed with at least one VF in their lifetime [11]. VFs are a major cause of pain and reduced mobility. Many patients who have sustained a VF suffer with the psychological fear of isolation and loss of independence [12,13]. Additionally, sustaining a VF is an independent risk factor for mortality [14]. Studies show that patients with previous VFs are five times more likely to obtain an additional VF and are twice as likely to suffer a hip fracture with resulting morbidity and mortality [15,16]. Encouragingly, evidence has shown that early intervention with pharmacological agents such as bisphosphonates result in a relative risk reduction of up to 0.6 for vertebral fractures and up to 0.8 for non-vertebral fractures [17]. Therefore, it is vital that VFs are correctly diagnosed so that patients are investigated and treated appropriately. However, there is a discrepancy between best recommended management and real-life clinical practice studies concluding that many patients diagnosed with an osteoporotic fracture are never appropriately investigated or treated for osteoporosis [18-20].
Many imaging studies performed for alternative clinical indications fortuitously include the spine. Radiologists do not always systematically review the spinal vertebra when they are not the specific clinical area of concern [21,22]. This can lead to a missed opportunity to detect vertebral fractures and diagnose osteoporosis [21,22]. VFs are evident on various imaging modalities that are performed for alternative clinical indications but are frequently not reported by radiologists [23,24]. Use of terminology such as ‘wedging’, ‘endplate compression’ and ‘endplate concavity’ in radiology reports can be confusing and may not be clearly understood as vertebral fracture or implication of underlying osteoporosis by the ordering physician. Non-diagnosis or inappropriate reporting of VFs in this way is a missed opportunity to diagnose osteoporosis, to provide appropriate treatment and to reduce patients risk of further osteoporotic fractures [18]. In this paper, we discuss the radiological assessment of VFs and describe how fractures can be diagnosed on the most used imaging modalities including plain film, MRI, CT and bone scans (Figure 1A- 1B).
Figure 1A: Lateral lumbar spine radiograph of an 80-yearold female patient. The radiograph demonstrates several insufficiency compression fractures; severe anterior wedge fracture at T12, mild compression fracture of the L1 and L4 superior endplates and moderate compression fracture at L2.
Figure 1B: Lateral thoracic spine radiograph demonstrates a moderate compression fracture at T7 with secondary kyphosis.
Assessment of Fractures
Genant et al. devised the Semi-Quantitative (SQ) method for describing vertebral fractures [25]. This method has high inter- and intra-observer agreement, even amongst inexperienced reviewers [25]. The method is widely reproducible and is often used in research settings and clinical trials. The SQ method is a relatively straight-forward method to grade fractures and avoids otherwise confusing language which may be misinterpreted. First described on lateral radiographs, the SQ method employs visual inspection to grade vertebral fractures. Grade 0 is normal without loss of vertebral body height. Grade 0.5 are borderline vertebral fractures. Grade 1 fractures show mild deformity with approximately 20 % to 25 % loss of height and 10 % to 20 % reduction in area. Grade 2 fractures are moderately deformed with 25 % to 40 % loss of height and 20 % to 40 % loss of area. Grade 3 vertebral fractures have lost 40 % or more of their height and area. The SQ method is not without its limitations. Employing this method may inadvertently overdiagnoses VFs in patients with congenital or acquired vertebral anomalies [26]. Additionally, employing the SQ method alone would fail to diagnose minor endplate fractures which do not result in loss of vertebral body height. In response, Jiang et al devised the algorithm-based qualitative (ABQ) approach which focuses on vertebral endplate deformities [27]. Using this method, an experienced radiologist needs to assess various aspects of endplate abnormality before diagnosing it as a fracture. Jiang et al showed that using a stringent criteria-based algorithm in this way, the ABQ method is likely to diagnose only one third of fractures that would be diagnosed by the SQ method alone. Similarly, Black et al showed that the SQ method diagnosed three times the number of mild vertebral fractures compared to other quantitative methods [28].
Recognition of Fractures
Imaging Modalities:
A. Plain Films: For clinically suspected VFs, plain films including antero-posterior (AP) and lateral projections are usually the first line of investigation. The lateral film is particularly useful (Fig. 1A and 1B). The radiologist should carefully examine the vertebral body outline, especially the superior and inferior endplates to ensure VFs are not missed. The pedicles are examined for symmetry on the AP film. Subjectively identifying reduced bone density heightens the index of suspicion for VFs as these patients are at much greater risk. Dynamic radiographs of the vertebrae can increase the likelihood of correct diagnosis on plain radiography. This method allows the radiologist to compare supine images with lateral sitting radiographs to evaluate for changes in vertebral body height. The sensitivity and specificity of dynamic radiographs for diagnosing acute VFs is 66% and 96% respectively [29]. While moderate and severe VFs are rarely misdiagnosed, there are several conditions which can be mistaken for mild VFs leading to overdiagnosis. These include developmental short vertebral height, physiological wedging, Scheuermann’s disease, degenerative scoliosis, Schmorl’s nodes and Cupid’s bow deformity (smooth developmental curvature of the inferior endplate of lumbar vertebra) [30]. Possible reasons for underdiagnosis of VFs by non-musculoskeletal radiologists include focusing on other acute imaging findings, lack of specialist knowledge about osteoporosis/ osteoporotic VFs or simply ignoring osteoporotic VFs completely [31]. Vertebrae are included on many plain films when there is no clinical suspicion of VF. Examples include abdominal radiographs for patients with abdominal pain or chest radiographs in patients with cardio-respiratory symptoms. Less commonly, the vertebrae are incidentally imaged during barium investigations, interventional, cardiac, and fluoroscopic procedures. Even if not performed to out rule a VF, each imaged vertebra should be carefully evaluated to ensure no underlying occult VF. Despite the obvious opportunity to diagnose VFs in this way, there is a paucity of published literature in the area. The most studied radiographic technique to incidentally diagnose VFs is the chest radiograph. In a large study of over 10,000 post-menopausal women who underwent a lateral chest x-ray, 41% of radiologists who identified a VF failed to document it in the report summary, and only 36% were put on treatment for osteoporosis on discharge [32]. In a smaller retrospective review of chest x-rays of post-menopausal women, Gerlach showed that 14.1 % had a moderate or severe VF visible on chest radiograph [21]. Unfortunately, less than one quarter of visible VFs were referenced in the radiologists’ summary and only one seventh of these patients received a discharge diagnosis of VF. As a result, only 18% of patients were discharged with appropriate medical therapy for underlying osteoporosis. The lateral chest radiograph on elderly patients is an opportunity to incidentally diagnose VFs by assessing vertebral bodies and clearly reporting them in the final summary [33]. Despite their importance in the initial investigation for suspected VF, many patients with VFs will have no morphological change on plain films. It is important not to dismiss patient symptoms based on normal radiographs since many patients with normal plain films may only have acute changes detectable on MRI [34]. Loss of vertebral height may not be evident at time of acute symptoms but can be evident on subsequent follow-up radiograph. MRI: MRI is a time-intensive imaging modality with relative contraindications such as claustrophobia, presence of a nonconditional pacemaker and first trimester of pregnancy. MRI has a sensitivity of 100% in detecting spinal trauma and is an excellent method to diagnose and assess VFs [34]. MRI has a sensitivity and specificity of up to 82% and 98% respectively for distinguishing osteoporotic VFs from other types of fracture [35], (Figures 2A-2C). In addition to identifying a VF, MRI may also diagnose other uncommon causes for back pain such as infection or malignancy, and allows assessment of spinal ligaments, spinal cord, surrounding CSF and meninges. The Short Tau Inversion Recovery (STIR) sequence is particularly sensitive to acute fractures as it nullifies marrow fat signal over a large body area such as the entire vertebral column allowing increased visibility of acute pathology such as fracture. STIR sequences in combination with T1 weighted sequences are helpful to differentiate benign osteoporotic VFs from those caused by malignancy [36]. The presence of marrow oedema recognised as high signal on fluid sensitive STIR or T2-weighted fat saturated sequences indicates recent fracture. Marrow oedema is absent in a chronic vertebral fracture. Benign vertebral fractures typically are seen as linear low T1 signal. Malignancy or infection in contrast cause diffuse nonlinear replacement of the normal marrow of the vertebra. For every MRI study performed, initial localizer sequences are utilised by radiographers to plan image acquisition. These localizers are obtained from thick slices and are not suitable for diagnostic detail but do represent an opportunity to diagnose a VF when not suspected. Strong inter-observer agreement has been reported in detecting VFs in the thoracic and lumbar spine on localizer images [37]. In another study, musculoskeletal radiologists examined 856 localizers of patients undergoing breast MRI. The authors concluded that 8.9 % of patients had a VF visible on the MRI localizer, but none were documented in the final report [38]. MRI localizers are a quick and reliable method of diagnosing vertebral fractures when not suspected and may negate the necessity for further imaging or using ionising radiation.
Figure 2: MRI Lumbar Spine with T1, T2 & STIR sequences of an acute mild compression fracture at T10 in a 67-year-old female patient.
Computed Tomography (CT): CT uses high doses of ionising radiation to acquire images. CT imaging is available 24/7 in most tertiary hospitals and offers almost instant acquisition of images. CT has excellent sensitivity and specificity for identifying VFs;100% and 97% respectively [39]. CT of the spine may be requested when a VF is clinically suspected and when the radiograph is normal. Of note, a non-displaced vertebral fracture on a background of osteopenia, may not be evident on CT [39]. In patients with known VF, CT can help to provide additional information such as stability of the fracture and protrusion of bone fragments into the spinal canal. CT can also aid with clinical decisions such as patient suitability for surgical intervention or vertebroplasty. The majority of CTs are performed for clinical indications not specifically related to identification of VFs including Cardiac CT, CTPA and CT thorax to evaluate for thoracic pathology and CT KUB, CT abdomen/ pelvis, CT colonography and CT peripheral angiograms/venograms performed to identify intra-abdominal pathology. Vertebral morphology, particularly on sagittal reformats is well visualised on these CT studies. Modern CT scanners can display vertebrae in the region imaged in excellent bony detail in coronal, sagittal and axial reformats without the requirement for further imaging or radiation exposure to the patient. Of these, the sagittal reconstructions are particularly important to diagnose VFs (Figure 3) [40]. Despite the ability to utilize CT to diagnose occult VFs, CT is often not effectively exploited in this way. A New Zealand study retrospectively reviewed sagittal reconstructions of CT abdomen or thorax in patients over 65 years. 22 of 175 patients had a VF visible on sagittal reconstruction, and 77% of these had previously undiagnosed VF. The authors concluded that reviewing reformatted CT of the abdomen and pelvis improved diagnosis of VFs but are frequently not reported – thereby missing an opportunity to diagnose osteoporosis, treat with appropriate medical therapy and to reduce risk of future osteoporotic fractures and associated morbidity and mortality [41]. Similar to localizers in MRI, CT scout views are obtained prior to final image acquisition. These use low levels of radiation to acquire 2-Dimensional images which are used to plan the final CT image. Lateral CT scout views may show fractures not visible on axial CT images. One study of 300 CT scans involving the thoracic and lumbar spines demonstrated the sensitivity and specificity of diagnosing VFs on scout views to be 98.7% and 99.7% respectively. The authors concluded that scout views should be used to evaluate for VFs on CTs performed for other clinical indications [42].
Figure 3: Sagittal reformatted CT of the Lumbar Spine in an 83-year-old female demonstrating severe compression fracture at L1, moderate compression fracture of T11 and mild compression fracture of L2.
Skeletal Scintigraphy (Bone Scans)
Tc 99m is a radioisotope which can be bound to MDP and injected intravenously. The radioisotope travels through the patient’s bloodstream and binds to remodelling bone. Three hours after injection, patients are placed on a gamma camera which identifies bony hotspots where Tc99m has accumulated. 80% of VFs are visible as hotspots, usually linear in morphology, at 24 hours following injury and almost all return to normal within two years [43]. The major limitation of bone scans is their poor specificity. The most common indication for performing bone scans is to identify osseous metastatic disease in patients with known primary malignancy. However, bone scans are also utilized to identify occult fractures or osteomyelitis. Due to their non-specific nature, hotspots can also be caused by degenerative changes. For this reason, bone scans are often reported in conjunction with other available imaging such as MRI, CT, or plain films (Figures 4 & 5).
Figure 4: Bone scan for completion of staging in a 67-year-old female with non-small cell lung cancer. There are non-specific foci of increased radioisotope uptake in the mid thoracic spine. Comparison was then made to previous staging CT thorax (Fig. 5)
Figure 5: Review of the staging CT thorax confirmed the areas of uptake on bone scan in Fig 4 correlating to previous moderate wedge compression sclerotic vertebral fractures at T6 and T7 secondary to metastatic disease.
Discussion
Osteoporosis is an increasing public health concern and predisposes patients to VFs. Prompt diagnosis and early intervention with appropriate medical treatment is imperative. The literature shows that incidental VFs, on imaging studies performed for alternative clinical indications are underdiagnosed thereby missing an opportunity to diagnose vertebral fracture, diagnose osteoporosis if not previously diagnosed and treat patient appropriately. Untreated and undiagnosed VFs can significantly impact on a patient’s quality of life and life expectancy. Patients with osteoporotic fractures can endure intolerable pain, loss of independence and suffer psychologically due to fear of isolation. Many patients require polypharmacy for pain control, and all are at high risk of future osteoporotic fractures. The mid-thoracic region and thoraco-lumbar junction are the most frequently affected areas and may result in spinal kyphotic deformities. Kyphosis predisposes to loss of balance, muscle wasting, further degenerative changes at adjacent intervertebral joints, restrictive lung disease, inability to work and loss of earnings [44]. Fortuitously many imaging studies including plain radiography, CT, MRI and Bon scans include the thoracic and lumbar spine in the area of imaging. This provides an opportunity to diagnose unsuspected abnormalities of the spine when these imaging studies are performed for alternate clinical indications. Many radiologists however do not systematically review the vertebra in these studies and miss the opportunity to identify abnormalities such as vertebral fractures and osteoporosis. When vertebral morphological abnormalities are identified equivocal language such as ‘loss of height’ or ‘wedging’ to describe VFs can be misleading. This terminology is ambiguous for referring physicians who may not appreciate that these are vertebral fractures and imply underlying osteoporosis. There is no agreed gold standard for diagnosing VFs on imaging. As a result, many VFs are both under and over-diagnosed. One strategy is the semi-quantitative method for grading fractures. Even amongst inexperienced observers, the SQ method demonstrates high levels of agreement [21]. Alternatively, the ABQ method forces the radiologist to answer a number of questions before diagnosing a VF and is arguably more accurate [27]. Whichever method is employed, it remains imperative the reading radiologist clearly states the existence of a VF in the report summary to improve the proportion of patients discharged on appropriate medical therapy. A number of imaging techniques performed for various clinical indications may show VFs in the area imaged. There is under reporting of VFs which are clearly visible on lateral chest radiographs, MRI localizers and CT scout views. Unless sagittal reformats of CT studies are routinely performed often VFs are not visible on standard axial images even to experienced musculoskeletal radiologists. The term ‘inattentional blindness’ refers to an inability to notice unexpected events when immersed in an alternative task. In one experiment, 83% of expert radiologists failed to recognise a gorilla drawn onto a stack of CT images when they were focusing on finding pulmonary nodules [45]. Another phenomenon coined “satisfaction of search” refers to a relative difficulty in identifying further pathological findings following identification of another significant abnormality [46]. These factors are relevant to radiologists when searching for clinically significant pathology not related to the spine on x-ray, MRI, or CT and thus VFs can easily be overlooked. Dedicated education programmes delivered to radiologists and internal medical physicians may help to improve the diagnosis and management of VFs. In one study, recognition of VFs amongst internists almost doubled from 22% to 43% following provision of basic lectures, posters and flyers. The same study demonstrated a significant increase in patients discharged on osteoporosis treatment from 11% to 40% [47]. In another study, there was a marked improvement in the ability of a radiology resident to correctly identify VFs after undergoing specific teaching [48].
Conclusion
In conclusion, VFs are a major health concern in an era of aging population. Many factors have contributed to underdiagnosis and treatment of VFs. When identified by a radiologist ambiguous terminology should be avoided and the SQ method employed. The spine is included in many imaging studies performed for alternative clinical indications. This is a fortuitous opportunity to assess the spinal vertebrae and diagnose fractures when present. Irrespective of the clinical indication or imaging modality, a high index of suspicion for VFs should be always employed. Basic education programmes for radiologists and internists would serve to improve the diagnosis of VFs and treatment of osteoporosis.