Open Access Journals on Lifescience

Palatability Evaluation, DNA Analyses, and Functional Processing of Rice

Evaluation of Palatability of Cooked Rice

Abstract

Rice is one of the most important crops in the world. It is useful not only for the supply of energy, but also for giving palatability and good health to the people. The rice quality depends on various aspects such as consumer safety, nutrition, appearance, price level, and palatability. Sensory test and physico-chemical measurements are important measures for quality assay of rice grains. Sensory test is a fundamental method that requires large amounts of samples, many panel members, and long hours. Physico-chemical measurements estimate the eating quality based on the results of various kinds of measurements, such as chemical composition analyses, cooking quality test, gelatinization property test, and the measurements of physical properties of cooked rice. Novel method to evaluate the quality of the cooked rice is necessary to breed high-quality rice cultivars and to select the suitable rice for each consumer and each utilization purpose. It is necessary to develop the novel method to evaluate the rice quality using various kinds of novel measurements, such as Texture Analyzer, Tensipresser, RVA, NIR, and spectrophotometer. Simple, rapid, and accurate method to assay the quality of rice grains would be very valuable.

Introduction

Rice, wheat, and maize are the most important crops in the world. Rice consumers need not only enough amount of rice but also high-quality rice grains. The many rice cultivars grown in the world vary markedly in their cooking, sensory, and processing quality [1]. Consumers are heterogeneous with respect to their perceived differentiation of rice quality among regions, countries, cities, and urbanization levels [2] The rice quality depends on various aspects such as consumer safety, nutrition, appearance, price level, and palatability. Because rice is eaten every day, it is indispensable that it should be safe to eat and highly nutritious. Furthermore, because rice provides income for farmers and is prepared, milled, and sold by wholesalers and retailers, the rice yield and price are extremely important to the farmers. Consumers have been asking for more palatable rice because they have recently become more affluent. Calingacion et al engaged local experts across the world and they showed that there are at least 18 different quality types of rice that are favored around the world and this complexity immediately reveals the extent of the specificity of consumer preference [3]. As described by Juliano, rice quality evaluation includes eating quality assays for sensory evaluation and aroma testing, as well as physical property measurements using Instron, Texturometer, or Tensipresser etc., which were highlighted as indirect methods, in addition to amylose content, starch gelatinization temperature, gel consistency, amylography, and protein content determination [4]. Ohtsubo et al. reported on the quality assay of rice using traditional and novel tools, such as the measurements of amylose, physical properties and pasting properties [5].

Starch comprises the most abundant component in rice grain and con-sists of am- ylose (linear ƒ¿-1,4-glucan) and amylopectin (highly branched molecule with ƒ¿-1,4 bonds and ƒ¿-1,6 bonds). Apparent amylose content (AAC) is measured by the iodine colorimetric method [6] and high-AAC rice becomes harder and non-sticky on cooking [1,6,7]. Lian et al. investigated on the identification of the main retrogradation-related properties of rice starch and reported that retrogradation rates of different rice starch showed significant positive correlation with proportion of the chains (DP>10) in amy- lopectin [8]. Protein content is another extremely important factor that determines rice quality [1]. Protein contents are measured by Kieldahl method, combustion method or NIR method. As Juliano [8] and Bhattacharya [9] pointed out, the physical properties of cooked rice grains are important determinants of the eating quality of rice. The pasting properties of rice are useful indicators in the quality assay of cooked rice, rice cake, rice bread, rice extrudate, etc. In several countries, such as Australia, China, Japan, and the United States, the RVA has become the standard method with which the rice processing industry and breeding programs determine rice pasting properties [1]. A rapid, simple, and accurate method is required to evaluate rice. Therefore, if a such novel method could be developed, it would become a great help to the producers and the consumers of rice all over the world. Sensory testing is the fundamental method that evaluates the eating quality of rice grains. The members of a trained panel taste cooked rice samples and give scores based on appearance, flavor, taste, hardness, stickiness, and overall sensory evaluation.

Sensory Test and Physicochemical Measurement [10]

Sensory Test: Sensory testing is the fundamental method that evaluates the eating quality of rice grains. The members of a trained panel taste cooked rice samples and give scores based on appearance, flavor, taste, hardness, stickiness, and overall sensory evaluation. The test results can be expressed as numerical values and treated statistically; there are disadvantages to using this test. The results differ depending on the preference of panel members, and the results cannot be directly compared if the time or country differs.

Physicochemical Evaluations: Physicochemical evaluation is only indirect evaluation of rice palatability, its results are common all over the world if we use the same method and apparatus. Physicochemical measurements include component analysis, such as protein, amylose, and fibers, pasting properties of starch, texture measurements of the cooked rice grains, etc. For the sake of estimating the total palatability, statistical treatment is adopted using the results of each measurement as the variables. Multiple regression analysis, principal com-ponent analysis, and PLS analysis are very useful to clarify the characteristics of the rice samples. Recently, spectrophotometric analyses, such as NIR or visible-light spectrometer, are utilized to estimate the chemical components and to develop the estimation formulae for palatability. “Taste Analyzer” is an example of the NIR system as a non-destructive estimation apparatus for palatability of rice grains. Examples of sensory test and physico-chemical evaluation of rice palatability are shown in Table 1.

biomedres-openaccess-journal-bjstr

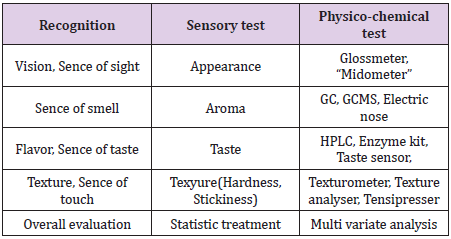
Table 1: Evaluation of rice palatability.

Amylose Content and Amylopectin Molecular Structure: Amylose content is the most important factor that determines rice quality because starch shares approximately 85% (w/w, dry basis) of the milled rice grains. Because North- east Asian consumers prefer soft and sticky cooked rice, low amylose rice is the dominant rice sold in the rice market. Amylose content is generally measured by the iodine colorimetric method of Juliano [6]. Li, et al. [10] reported that stickiness of cooked rice is affected not only by AAC but also the proportion of short amylopectin chain. They found that the autoclave cooking, which is used to produce sticky “convenience rice”, effects on sensory properties and increase leached amylopectin [11].

Protein Content: Protein content is another extremely important factor that determines the eating quality of rice. Cooked rice with high protein content tends to be hard and non-sticky. Protein content is measured by the Kieldahl or the combustion method. It can be measured by NIR method (Near Infrared Reflectance) easily and non-destructively. Recently, not only protein content, but also molecular compositions of protein, such as glutelin or prolamin, is reported to affect the quality of rice [12,13].

Gelatinization Properties Using an RVA: The RVA (Figure 1) provides various information, for examples, as indicators in cerealbased products, on apparent viscosity of cake batters and quality of flour for cake making, about interactions between starch and other compounds, on extruded products and the measurement of the degree of cook, as quality indicators for hydrocolloids and fibers, for simulation and monitoring of processes, and on enzymatic reactions [14]. Comejo and Rosell used RVA in the research on the influence of germination time of brown rice in relation to flour and gluten free bread quality [15]. Although the Brabender Viscoamylograph has been used to assess rice pasting properties [1], Blakeney, et al. [16] and Champagne, et al. [17] showed that the RVA is useful in determining the “degree of cook” after processing of rice into precooked and extruded products. Yao et al. reported that the high temperature during ripening of rice decreased setback and trough viscosities and increased breakdown, implying that the pasting properties were slightly better [18]. Zhu et al. investigated the effect of soaking and cooking on structure formation of cooked rice through thermal properties, dynamic viscoelasticity, and enzyme activity, in which they used RVA for the measurements of enzyme activity [19].

biomedres-openaccess-journal-bjstr

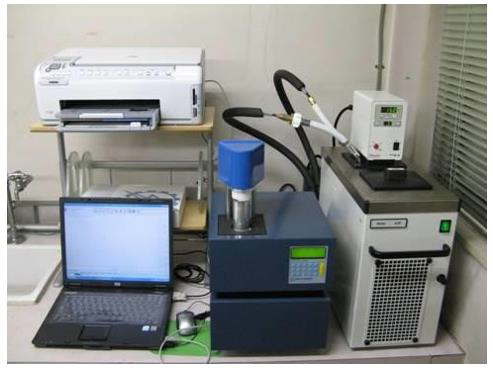
Figure 1: Rapid visco analyzer (RVA).

Nakamura et al. developed a novel estimation formula for AAC and resistant starch (RS) based on the pasting properties measured by an RVA [20], enabling evaluation of the starch properties and processing suitability of material rice flours. Furthermore, we developed novel estimation formulae for oleic and linoleic acid contents based on the pasting properties of brown rice flours using an RVA, making it possible to predict easily and rapidly the nutritive and bio-functional characteristics of material rice [21]. To evaluate the pasting properties, the behavior of rice starch at temperatures higher than 100 ‹C should be examined to elucidate the changes in rice quality after cooking and processing, such as extrusion cooking [22] or super-heated moisture treatment [23]. Recently, Nakamura et al. reported about the comparison of the three different programs and estimating the hardness and retrogradation of cooked rice based on its pasting properties using a novel high-temperaturetype programs [24]. They have made improvements to analyzing pasting properties in a new program using RVA 4800 (Figure 2), and novel estimation formulae were developed in this paper for estimates of the retrograded hardness of cooked rice H1(R) and the degree of retrogradation H1(RD), which has led to an easy and rapid evaluation of the cooking qualities of various rice samples. The following are the main features;
1. Among the three kinds of RVA programs, Program 2 (120‹C) showed the highest correlations with starch microstructure (Amax), RS, physical properties, and degree of retrogradation of the cooked rice grains.
2. The novel Program 2 (120 ‹C) showed high determination coefficients for hard-ness and the degree of retrogradation of cooked rice grains.
3. The novel RVA Program 2 enables us to estimate easily and rapidly the cooking and processing characteristics of various kinds of rice cultivars. Commercial rice of Japonica rice cultivars Consistency (93°C) Consistency (120°C) Consistency (140°C).

biomedres-openaccess-journal-bjstr

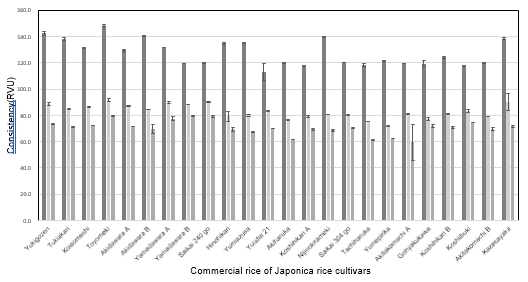
Figure 2: Comparison of “Consistency” among the three programs using an RVA 4800.

Fat Acidity: Fat acidity is a good index to measure the quality deterioration of rice grains during storage. In Japan, newlyharvested rice is preferred to aged rice because consumers like soft and sticky cooked rice. Ohtsubo proposed a new colorimetric method to accurately measure fat acidity [25].

Cooking Quality Test [26]: A cooking quality test was developed by the researchers of USDA in 1950s. An expanded volume and water uptake ratios are measured after cooking rice samples in excess amounts of water. Dissolved amylose is measured by color generation by combining iodine and amylose.

Physical Properties of Cooked Rice Grains: Physical properties of cooked rice grains, such as hardness and stickiness, are measured by a Texturometer, Tensipresser, Texture analyzer, or Rheolograph-micro. Okabe reported the texture measurement of cooked rice and its relationship to eating quality using a Texturometer [27]. Low-compression and high-compression test using a Tensipresser [28] is shown in Figure 3. Recently, Texture Analyser has been used for measuring the physical properties of the cooked rice [29] or the parboiled rice [30]. And dynamic viscoelasticity gives valuable information for the elucidation of the relationship between the texture and the molecular structure of starch, which showed that gconsistency coefficient h affected hardness and tanƒÂ affected stickiness of cooked rice grains [31].

biomedres-openaccess-journal-bjstr

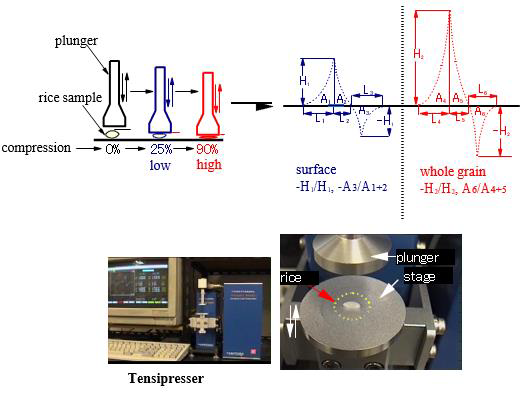
Figure 3: Tensipresser used for texture measurement of cooked rice grains.

Palatability Estimation Formula: Chikubu et al. developed a new equation to estimate the palatability of rice grains using a multiple regression analysis based on physico-chemical measurements, such as an amylograph viscosity profile, protein assay, and iodine blue value measurements [32]. The formula showed a high correlation between the results of a sensory test (R = 0.84) and the rice samples that will be harvested next year.

Application of Near Infra-Red Spectroscopy to Evaluate Rice Quality: Near Infra-red spectroscopy is a rapid, non-destructive, and extremely promising technique to evaluate qualities of the rice grains. In Japan, NIR spectroscopy was initially used to determine the protein and moisture content of the rice flours. Satake Co. Ltd subsequently combined NIR and palatability estimation formula and developed a new system called “Taste Analyser”.

Protein Content: Iwamoto et al. reported that NIR was equally sensitive to both rice and wheat proteins. A standard error of estimation (SEP) was decreased for calibrations using a derivative absorbance. However, the derivative procedure may possibly make an increment bias in cases that predict unknown sam-ples [33]. Inatsu utilized NIR spectroscopy to select palatable rice cultivars by measuring the protein content of rice because low protein rice is preferred in Japan because of their palatability [34].

Estimation of Rice Amylose Contents by NIR [35]: Japanese rice breeders have tried to develop palatable rice cultivars by selecting low amylose rice; however, the amylose contents among Japanese rice grains are not significantly different (15% – 20%). NIR spectroscopy can easily compare protein and moisture; however, it does not easily differentiate amylose from amylopectin. Villareal and Delwiche had already developed excel-lent calibrations to detect amylose in various rice samples through NIR spectroscopy [36,37]. Japanese consumers request high-performance calibration for the measurement of narrow range amylose of Japanese rice cultivars. Ap-parent amylose content (AAC) analysis is a rapid and simple technique uses NIT spectroscopy. It was developed based on the near infrared transmission spectra and the reference value of AAC determined by the iodine colorimetric method. The wide AAC range (0%-35.3%) PLS model was inadequate for the accurate prediction of the extremely narrow range of the AAC (13.2% 20.7%) of Japanese milled rice samples. The statistics performed on the 11 factor PLS model for the extremely narrow range of AAC analyses was 0.78, 0.74, and 2.01 in SECv, r2, and RPD, respectively. The performance of this model was 1.25 and 0.49 for SEP and r2, respectively, on the validation set. The previous models developed a wide range of AAC samples, which were difficult to apply to the narrow range of AAC rice. The present AAC analysis technique is based on NIT spectroscopy, which can discriminate between the extremely narrow differences in AAC of Japanese milled rice in the same sub family.

Eating Quality Evaluation System by NIR: Satake Co. Ltd. Developed a taste analyser in the 1980s that combined the palatability estimation formula that was based on the physicochemical measurements and NIR. The taste analyzer principle is based on the multiple regression analysis that uses NIR data (protein, moisture, amylose and fat acidity) against the sensory test results. A previous study by the Japanese As-sociation of Milling Companies evaluated 3 different types of palatability evaluation system using NIR. The results showed that the taste scores significantly correlated significantly with the results of the sensory test (r = 0.54 to 0.63), but the scores were affected by the moisture contents and milling yield [38]. There were 8 Japanese 2 companies that developed the characteristic systems to evaluate the palatability of rice 3 grains based on the spectroscopic technique. More than 1000 agricultural cooperatives, 4 wholesalers, and retailers introduced these NIR systems to evaluate the quality of their rice 5 grains (Figure 4). In 1996, the Japanese Food Agency conducted a survey regarding the palatability evaluation system, and the results showed that 67% users were satisfied with the performance of the system. The protein and moisture data were extremely reliable, but 8 some users requested an improvement in the taste score and amylase accuracy.

biomedres-openaccess-journal-bjstr

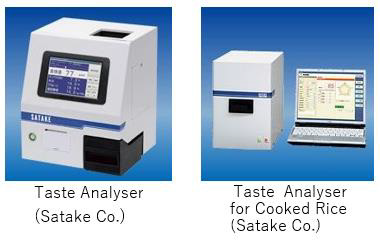
Figure 4: Taste Analyzer using NIR technology (Satake Co.).

Proposal as Novel Physicochemical Measurement, Iodine Colorimetric Analysis, for Rice Palatability Evaluation [39]

Introduction: As described in section 3, physicochemical test is very important because it is time- saving and labor-saving objective test for rice palatability. Main component of rice grains is starch, therefore, amylose content affects eating quality [6]. Low-amylose rice generally be-comes soft and sticky after cooking, whereas high-amylose rice be-comes hard with fluffy separated grains [40]. The most widely used method for amylose determination is a colorimetric assay where io-dine binds with amylose to produce a blue-purple color, which is measured spectrophotometrically at a single wavelength (620nm) [6]. Nakamura et al. characterized the starch of various rice cultivars; evaluated the relationship between their iodine absorption curve and apparent amylose contents, amylopectin fractions, and resistant starch. They improved the iodine colorimetric method, and developed the novel estimation formulae against the amylose contents, resistant starch or certain fractions of definite chain-length amylopectin. This novel method would lead to an easy and low-cost spectroscopic method for analyses of starch characteristics.

biomedres-openaccess-journal-bjstr

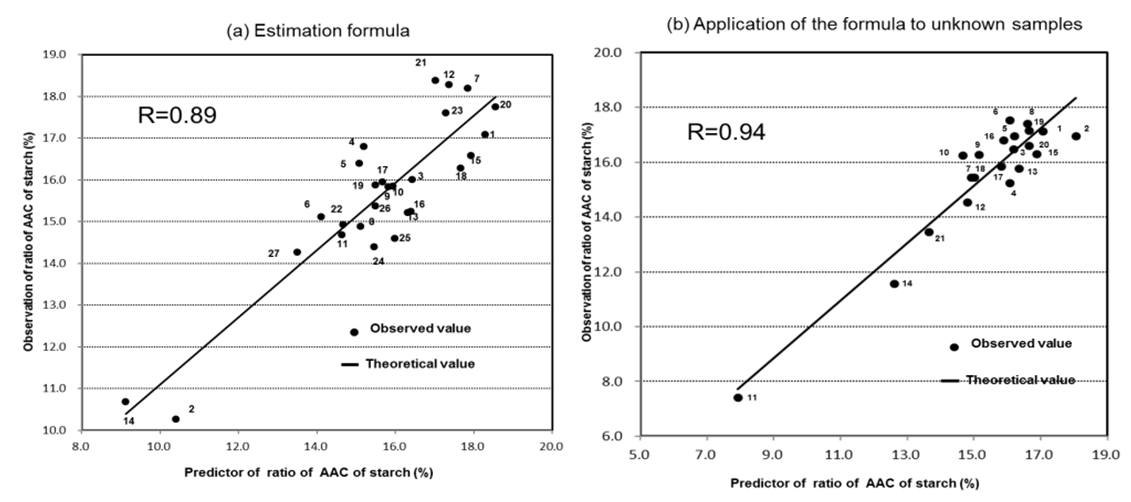
Figure 5: Estimation of apparent amylose contents based on iodine colorimetric analyses.

Iodine Scanning Colorimetric Measurement: Nakamura et al. used Japonica rice, Iindica rice, Indi-ca-Japonica hybrid rice, ae mutant rice, and waxy rice produced in Japan and China. They found that the iodine absorption curve differed between the Indica rice, Japonica rice, Japonica-Indica hybrid rice, ae mutant rice cultivars, and glutinous rice cultivars. And they proposed a novel index, “new max” based on iodine absorption curve, which shows higher correlation with amylose, resistant starch or CD of amylopectin than ordinary max. Furthermore, they developed the novel estimation formulae for AAC, RS contents, amylopectin chain lengths (Fa; DP<12, Fb3; DP>37), and fraction of DP10 (short chain glucans of amylopectin) and fraction of DP22 (medium chain glucans of amylopectin) based on the iodine absorption curve. These formulae would lead to an easy and low-cost spectroscopic method for the starch characteristics [39] (Figure 5).

Examples of Physicochemical Measurements of Rice Palatability

Comparison of Physicochemical Properties between Japanese and Chinese Rice Cultivars: As described in section 3, in the case of physicochemical evaluation, we can get the common results for the rice samples produced in the different countries if we use the same method. As an example, we report the results of physicochemical measurements of rice pal- atability using rice samples produced in Japan and China. China is the largest riceproducing country, accounting for 32% of the global production from 20% of the global rice-growing area. China produces Indica subspecies mainly in the southern region and Japonica subspecies mainly in the northern region (Heilongjiang, Liaoning), and eastern or southern region (Jilin, Jiangsu, Zhejiang, and Yunnan), whereas the other three countries, India, Indonesia, and Bangradesh, primarily grow Indica rice. In China, consumers are now choosing Japonica rice based on its shape and color as well as its texture and taste. Zhang et al. performed a sensory test of Chinese Japonica rice cultivars [41], in which a Chinese panel mainly determined the overall eating quality based on the stickiness and hardness. In the present section, we conducted physicochemical evaluations of some Chinese and Japanese Japonica rice cultivars using traditional and novel indicators based on the iodine absorption curve and RVA.

Recently, Nakamura et al. evaluated 16 Japanese and Chinese rice cultivars in terms of their main chemical components, iodine absorption curve, apparent amylose content (AAC), pasting property, resistant starch content, texture of cooked rice grains, and SDS PAGE of proteins [42]. Based on these quality evaluations, we can conclude that Chinese rice cultivars are characterized by their high protein content. The hardness of the surface layer (H1) and overall layer (H2) were higher in the Chinese rice cultivars than the Japanese rice cultivars, whereas the stickiness of the surface layer, and the balance degree of the surface layer were lower in the Chinese rice cultivars than the Japanese rice cultivars, although the stickiness of the overall layer |H2 was higher in the Chinese rice cultivars than the Japanese rice cultivars. In addition, rate of staling of cooked rice was faster for Chinese rice than Japanese one. In a previous study, they developed a novel formula for estimating AAC based on the iodine absorption curve [39]. The validation test showed a determination coefficient of 0.996 for estimating AAC of these Chinese rice cultivars as unknown samples as shown in Figure 6. Therefore, it became possible to estimate AAC, using iodine scanning colorimetric method [39], or the RVA method [20], easily and rapidly not only for Japanese rice but also various japonica rice cultivars produced in all over the world.

biomedres-openaccess-journal-bjstr

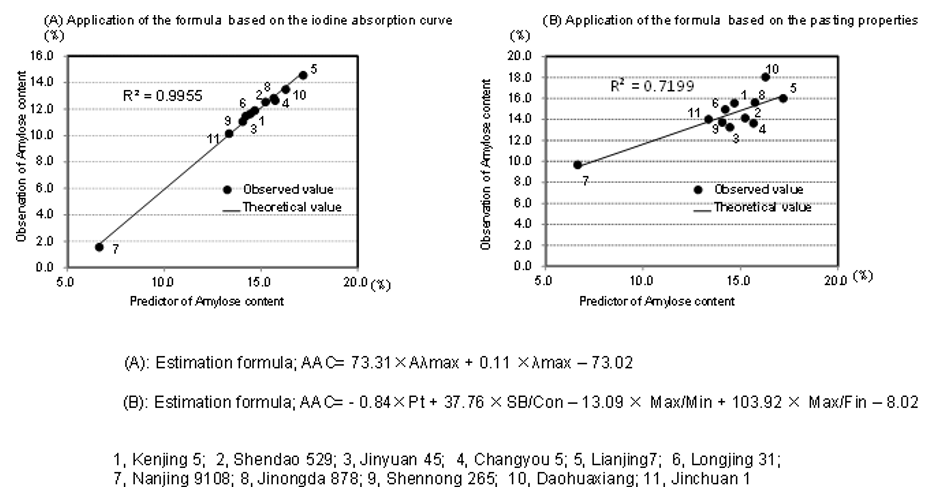
Figure 6: Validation test of the formula for estimating AAC in Chinese rice cultivars.

Summary of Evaluation of Rice Palatability

There are various kinds of rice cultivars of which qualities are diversified, such as hard Indica rice and soft Japonica rice in the world. Consumers in the Southern Asia prefer to hard rice grains and people in the North-eastern Asia like soft and sticky rice grains. Novel method to evaluate the quality of the cooked rice is necessary to breed high-quality rice cultivars and to select the suitable rice for each consumer and each purpose. Many researchers are trying to develop the novel method to evaluate the rice quality using various kinds of apparatus, such as Tensipresser, RVA, NIR, and spectrophotometer, etc. Simple, rapid, and accurate method to evaluate the quality of rice grains is very valuable.

Cultivar Identification of Rice (Oryza Sativa L.) by PCR Method and its Application to Processed Rice Products

Abstract

As the cultivars of rice affect markedly eating quality, processing suit-ability and price, identification or differentiation of rice cultivar is very important. The present authors developed suitable STS (sequence-tagged-site) primers for PCR (Polymerase Chainm Reaction) and it became possible to identify rice cultivar using template DNA extracted and purified from rice grains. Multiplex primer set was shown to be useful to differentiate effectively rice cultivars produced in various countries by PCR. Two kinds of multiplex kit for identification of “Koshihikari”, dominant cultivar in Japan, have been developed. Application of cultivar identification method by PCR method to processed rice products was investigated. The present authors developed “enzyme treatment method”, in which the gelatinized starch is decomposed by the heat stable alpha-amylase at 80°C, followed by hydrolysis of proteins by proteinase K with SDS and purification of extracted DNAs by PCI (Phenol/Chloroform/iso-amyl alcohol). It became possible to identify the material rice cultivars of the processed rice products, such as cooked rice and rice cake, by PCR method using template DNA prepared by the “enzyme treatment method” [43].

Introduction

Rice grains of the famous cultivars are traded or distributed at higher price as “Premium rice” than the ordinary rice because of their high palatability, processing suitability or special aroma, etc. As those premium rice grains sell at high price, some dishonest rice wholesalers or retailers blend low quality cheap rice to high quality premium rice and mislabel to be “high-quality premium rice”. Recently, rice consumers are tend to demand more information, such as cultivar name, location of production, year of production, etc., about rice which they purchase. For example, it is obliged to display the name of rice cultivar on its package under the JAS LAW (Law Concerning Standardization and Proper Labeling of Agricultural and Forestry Products in Japan). Therefore, technology to identify rice cultivar is very important for breeders, farmers, inspectors, wholesalers, retailers, food industries and consumers. Rice cultivar has been identified based on morphological characteristics of rice plant or grains, ripening ratio after crossing, or the isozyme patterns, etc. Cultivated rice (Oryza sativa L.) is one of the most polymorphic crop species in the world.

On the contrary, many high-quality rice or premium rice is closely related because inbred lines are often used for their development. Therefore, it is necessary to develop a time-saving technology to differentiate rice cultivars clearly and precisely. DNA fingerprinting was developed in 1985 [44] and is used for criminal investigation and trial at court. Recently, novel cultivar identification method based on DNA polymorphism has been developed accompanied with the progress in molecular biology. DNA-based markers have the obvious advantage of sampling the genome directly and RFLP analysis has been widely used for assessing variation of plants [45,46].

RFLP analysis has been used to distinguish between species of Oryza [47] and particularly between indica and japonica type of Oryza sativa [48]. Recently, PCR-based marker system has been developed by Williams et al [49]. In this RAPD (Random Amplified Polymorphic DNA) method, short oligo-nucleotides of arbitrary sequence are used to support the amplification of regions of the test plant genome and amplified DNAs are separated by gel electrophoresis. There are some reports on RAPD analysis of rice germplasm including indica and japonica types, to identify suitable parents for linkage map construction, and for gene tagging for drought resistance [50,51]. RAPD analysis was revealed to be reproducible and amenable for identification of each single plant line of F1 hybrid rice in China [52] and Australian rice cultivars [53]. Diversified rice cultivars were classified into separate groups by PCR using RAPD markers, but many primers were needed to resolve closely related japonica cultivars [54-56]. In case of RAPD markers, many other DNA bands than the target DNA for cultivar differentiation appear in the electrophoregram after PCR. Therefore, it is recommended to develop the STS (sequence tagged site) markers or SCAR (sequence characterized amplified region) markers based on RAPD markers. In addition to RAPD markers, microsatellites or simple sequence repeats (SSRs), which are DNA sequences with repeat lengths of a few base pairs and variation in the number of nucleotide repeats, can be detected with PCR by selecting the conserved DNA sequences flanking the SSR as primers. In 1993, SSR markers were developed for rice [57,58].

SSR markers are useful not only characterize the relationship between heterosis and marker genotype heterozygosity but also to identify chromosome segments that may have significant effects on yield and its component traits in rice [59]. Genetic diversity among Indian elite rice varieties was evaluated using three different types of DNA markers and parentage analysis [60]. SSLP was reported to be more reliable than AFLP for identify rice cultivars [61]. RAPD, RFLP, nuclear SSLP and chloroplast SSLP analyses were carried out to clarify the phylogenetic relationships among A-genome species of rice [62]. SSR was reported to provide useful genetic information on weedy rice [63]. Development of genome-wide DNA polymorphism database for map-based cloning of rice genes was investigated using SNP markers [64]. And SNPs were used for the discussion on the sequence variations between the rice cultivars [65]. Although SSR and SNPs are very useful DNA markers, it is impossible to use several PCR primers simultaneously, which is “multiplex PCR”, to simplify the PCR and electrophoresis and save time.

Furthermore, it was not reported to identify or differentiate the material rice cultivars by PCR method using the processed rice products, such as boiled rice or the rice cake. The present authors have investigated about the cultivar identification of rice by PCR method [66-70]. In the present study, application of PCR technology to cultivar identification of rice grains was investigated. SCAR markers and multiplex primer sets were developed based on RAPD marker analyses to differentiate closely related rice cultivars clearly and efficiently by PCR. The efficient method to prepare the template DNA for PCR from the processed rice products, such as cooked rice or rice cake, was investigated. The identification or the differentiation of material rice cultivars by the multiplex PCR was carried out using the processed rice products as samples.

Materials and Methods

Materials: Fifteen various kinds of rices were collected or purchased. Sample rice grains used are as follows; Koganemochi (Japan), Hinohikari (Japan), Akitakomachi (Japan), Kirara397 (Japan), Ilpum (Korea), Calmochi101 (USA), Medium grain (USA), Fobidden rice (USA), Pelde (Australia), Kyeema (Australia), Paellea (USA), Long grain (USA), Doongara (Australia), Nanjing 11 (China), IR2061 (Philippines). Thirty three original Koshihikari rice seeds, produced in 1999, 2000 and 2001, were used for DNA extraction and purification. All the rice samples including other 49 different cultivar rice samples than Koshihikari were kindly provided by National Food Agency, Japan. Forty nine cultivars are Hitomebore, Hinohikari, Akitakomachi, Kirara397, Kinuhikari, Hosh-inoyume, Haenuki, Mutsuhomare, Niopponbare, Sasanishiki, Tsuga- ruroman, Hanaechizen, Yumetsukushi, Hatsushimo, Asanohikari, Tsukinohikari, Aichinokaori, Matsuribare, Akiho, Yukimaru, Mutsukaori, Mana-musume, Kakehashi, Kiyonishiki, Domannaka, Koshijiwase, Yukinosei, Hohohonoho, Yumeakari, Notohikari, Akitsuho, Akebono, Asahi, Yama-houshi, Yamahikari, Koganenishiki, Koganemasari, Reiho, Mineasahi, Fusaotome, Karinomai, Dontokoi, Akinishiki, Naganohomare, Fukuhikari, Goropikari, Hatsuboshi, Nakateshinsenbon and Morinokumasan. Paddy rice samples were hulled by an experimental huller (Ketto Science Laboratory, Tokyo) and milled to the yield of 90% by an experimental rice polisher (Pearlest, Ketto Science Laboratory, Tokyo). Milled rice flours were prepared by a coffee mill (Millser IFM- 100, Iwatani, Tokyo).

Physical and Chemical Properties of the 20 Rice Cultivars: Amylose contents were measured by the iodine-colorimetric method using the milled rice flours by Juliano [6]. Protein contents were calculated by the multiplication of nitrogen- protein conversion coefficient (5.95 for rice) to the nitrogen contents measured by the Kjeldahl method [71]. Physical properties of the boiled rice grains were measured by the method of Okadome [28] using a Tensipresser.

Preparation of Boiled Rice and Rice Cake: White rice prepared by the experimental rice polisher (Ketto Science Laboratory) was boiled by an electric rice cooker (RC183, Toshiba, Tokyo) after soaking for 1 hr and each single boiled rice grain was subjected to the extraction of template DNA for PCR. Milled waxy rice was pulverized using experimental impact mill (Udy cyclone Mill, Udy Corporation, Fort Collins, USA). Thirty five gram of water was added to 50g of the rice powder and kneaded manually. Rice cake was prepared using electric rice cake maker for home-use (SMK-1800, Tiger Co. Ltd, Tokyo). Rice cake was lyophilized and pulverized using a coffee-mill (IFM-100) and subjected to DNA extraction.

Extraction and Purification of Template DNA from Milled Rice Flours: According to the CTAB method [64,65], DNAs of the milled rice flours were extracted. Milled rice flours (0.4g) were placed in the micro-centrifugal tube (2 ml) and DNAs were extracted into the 0.6ml of 2 x CTAB (Cetyl tri-methylammonium bromide, 2% CTAB, 20 mM EDTA (ethylenediamine-N, N, N’, N’- tetraacetic acid), 1.4 M NaCl, 0.1 M tris-hydroxyl aminomethane/ HCl buffer, pH 8.0) solution and 0.2 ml distilled water for 30 min at 65 °C. The solution of chloroform and isoamyl alcohol (24:1, v/v) (0.8 ml) was added and stirred gently for 15 min using a rotator. Thereafter, the solution was centrifuged (8,000 g, 15 min) by a refrigerated centrifuge (hi-mac CR21F, Hitachi, Hitachi) and the upper layer was transferred to another micro-tube. CTAB solution (10%, 0.08 ml) and chloroform/isoamyl alcohol (24:1, v/v) were added to the solution and was stirred gently for 15 min followed by centrifugation (8,000 g, 15 min). The upper layer was transferred to another tube and was stood for 5 min in the freezer (-80°C) after the addition of 2.5 times volumes of the precipitation buffer (50mM Tris-HCl, pH 8.0, 10 mM EDTA, 1% CTAB). The precipitate was collected by the centrifugation (6,000 g, 15 min) and dissolved in the 0.5 ml of Tris-EDTA buffer (TE) and was added with the same volume of isopropyl alcohol. After the gentle stirring by a rotator for 15 min, the precipitate was collected by the centrifugation (6,000 g, 15 min). The precipitate was dissolved in 0.2 ml of TE followed by the decomposition of RNAs by the addition of 1 μl of RNase (RNase A, bovine pancreas, 10 mg/ml, Nippon-gene Inc. Tokyo) and incubation for 1 hr at 55°C. Thereafter, neutral phenol solution was added and upper layer was transferred to another tube after the centrifugation (8,000 g, 15 min). The same volume of the solution of phenol/chloroform (1:1, v/v) was added to the solution followed by the cen-trifugation (8,000 g, 15 min) and the upper layer was transferred to another tube. The solution was added with 0.2 M NaCl and two times volume of cold ethanol to generate the precipitate of DNAs. The DNAs were washed by the 50 μl of 70% ethyl alcohol and dissolved in 30 μl of 0.1 TE and were subjected to PCR.

Preparation of DNA in Case of Processed Rice Products: In case of processed rice products, such as boiled rice grains or rice cake, different DNA extraction/purification method was developed [57,58]. Processed rice product, such as a cooked rice grain, was subjected to the de-composition of starch by heat-stable alphaamylase (790 unit/mg solid, 30 mg/ml, from Batillus richenoformis, Sigma, USA) for 60 min at 80°C. For the starch digestion, 20 μl of above mentioned alpha-amylase (1mg/1ml) was added to the 1.5 ml of the sample solution (0.1 g of single boiled rice grain in the solution of 50 mM Tris-HCL buffer, pH 8.0) and digestion was performed for 1 hr at 80°C. Thereafter, the protein hydrolysis was carried out by pro-teinase K (Takara-bio, Otsu, Japan) 55°C or 2 hrs at 37°C. For the protein digestion, 10 μl of proteinase K solution (27.7 u/mg, 20 mg/ml) was added to the starch digested solution with 1% of sodium- dodecylsulphate (SDS). The protein digestion was carried out for 1 hr at 55°C. Thereafter, DNAs were extracted by the same amount of Tris-EDTA saturated phenol solution and purified by the phenol/chloroform/iso-amyl alcohol (PCI, 25/24/1, v/v/v) and 70% ethyl alcohol. For the control, commercial DNA extraction kit (Isoplant, Nippongene, Tokyo) was used.

Polymerase Chain Reaction (PCR): DNAs were proliferated by the PCR method using 600 commercial random primers (10 mers or 12 mers) as primers [56]. Taq-DNA polymerase (Takarabio Inc., Otsu, Japan) was used for amplification of DNAs. Each DNA was denatured for 1 min at 94°C, annealed for 1 min at 62°C and elongated for 2 min at 72°C. This procedure was repeated for 40 times. As a PCR apparatus, Thermal Cycler MP (Takara-bio, Otsu, Japan) was adopted.

Electrophoreses of the Amplified DNAs: Proliferated DNAs were subjected to the electrophoresis for 30 min through the agarose gel (2%) using a Mupid-2 electrophoresis system (Advance, Tokyo, Japan) at the charge of direct current of 100 V. After the electrophoresis, the DNAs were stained by the ethydium bromide and detected by the irradiation of UV light.

Development of SCAR Markers and Multiplex Primer Sets: In the present study, SCAR markers were developed based on RAPD analysis to differentiate rice cultivars by PCR (25-28). DNAs were extracted from the agarose gel after the electrophoresis of the PCR products using “Easy trapTM” (Takara-bio, Otsu, Japan). DNA cloning was carried out using “TOPO XL PCR Cloning KitT M” (Invitorogen Corporation, Carlsbad, USA). DNA sequence was determined using a commercial DNA preparation kit (QIAprep Spin Miniprep kit, Qiagen, K.K, Tokyo) and DNA proriferation kit (Big Dye Terminator Cycle sequencing kit, V1-1, Applied Biosystems Japan) and automatic DNA sequencing system (DNA sequenser ABI PRISM Genetic Analyzer 310, Applied Biosystems Japan, Tokyo). SCAR markers were designed based on the DNA sequences with from 20 mers to 29 mers so that the transition temperatures are around 62°C. The combinations of these SCAR markers, “multiplex primer set” were developed to identify Koshihikari, most dominant rice cultivar in Japan.

Results and Discussion

biomedres-openaccess-journal-bjstr

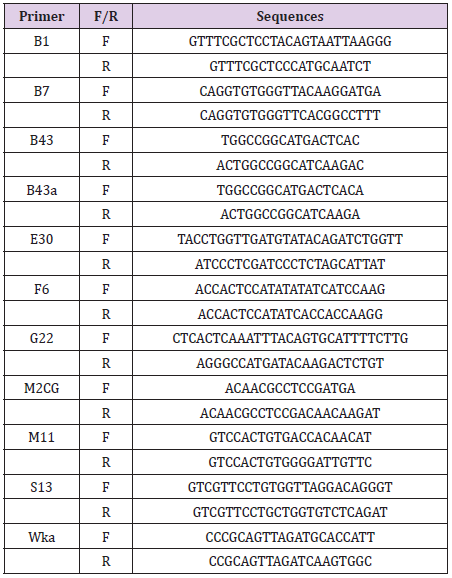
Table 2: Sequences of SCAR markers.

Note: F: forward, R: reverse.

Development of SCAR Markers: Example for the development of SCAR markers for identification or differentiation of rice cultivars is shown in Table 2. The sequence of the differential DNA, which was extracted from the electrophoresis agarose gel after PCR of RAPD method, was determined and the suitable forward and reverse primers were designated as shown in Table 2 [59,60]. As shown in Figure 7, SCAR markers are more useful than RAPD markers [59,60,66,67] because it is clearer in electrophoregram. Furthermore, it is possible to use several SCAR markers simultaneously in PCR, which leads to saving of time and labor. As shown in Table 2, several kinds of SCAR markers were developed. The length of markers was adjusted so that the transition temperatures of the markers are around same temperature, 62°C. Therefore, several SCAR markers can be used simultaneously in “multiplex PCR.”

biomedres-openaccess-journal-bjstr

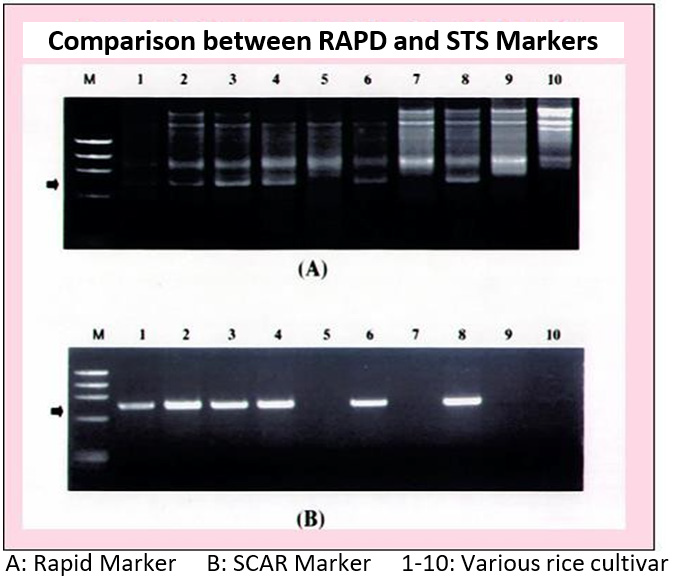
Figure 7: Comparison of RAPD and SCAR markers in PCR and electrophoresis.

Properties of Rice Samples: Various rice samples were collected from different district in the world and their chemical and physical properties were measured [60]. The results are shown in Table 3. As shown in Table 3, Indica subspecies, such as IR2061 and Nanjing 11, showed high amylose content and less adhesiveness, on the contrary, Japonica sub-species, such as Hinohikari and Akitakomachi, revealed low amylose content and more adhesiveness. In case of trade con-tract, inspection or grading or the survey of traceability of rice grains, PCR method must be applied using rice grains as samples. Shoot or leaves are not available as sample specimen. Therefore, milled rice flour, single kernel of polished rice or even boiled rice is used as materials for PCR in the inspection carried out in post-harvest inspection.

Rice is markedly diversified from the viewpoint of genetics, morphology and properties. On the contrary, high-quality rice is closely related by inbred breeding to attain high-palatability, high processing suitability or characteristic aroma, etc. Rice grains of the famous cultivars are traded or distributed at higher price as “Premium rice” because of their high palatability, processing suitability or special aroma, etc. As those premium rice grains sell at high price [1]. In the present study, various rice samples were collected from different district in the world and their chemical and physical properties were measured. As shown in Table 3, the grain properties between Indica subspecies, such as IR2061, and Japonica sub-species, such as Hinohikari, were revealed to be very different, but those among the same sub-species are not different.

biomedres-openaccess-journal-bjstr

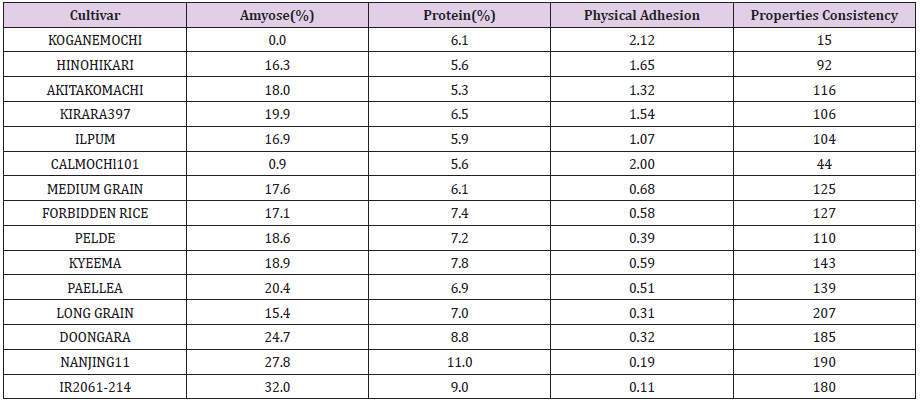
Table 3: Proximate components and physical properties of various cultivar rice.

Note: Adhesion was measured by a Tensipresser and the unit is mm.
Consistency was measured by a Rapid Visco Analyser and the unit is RVU.

Application of PCR to Various Rice Samples: CTAB method can be applied to milled rice flour for extraction and purification of template DNA for PCR [72,73]. The result of PCR using 15 rice cultivars from various countries, such as USA, India, Thailand or Japan, as samples was successful. The primer set used for PCR was our commercial “Koshihikari Positive Kit” (Takara-bio). Four DNA bands appeared clearly in case of Hitomebore and three ones appeared clearly in case of Koshihikari, which were revealed to be useful to differentiate various rice cultivars by a single time PCR and electrophoresis. As shown in Figure 8, the multiplex primer set for PCR, “Koshihikari Positive Kit” is very useful to differentiate various rice cultivars from the different district in the world. It was shown that RAPD analysis is a useful tool in determining the genetic relationships among rice cultivars [51-56].

biomedres-openaccess-journal-bjstr

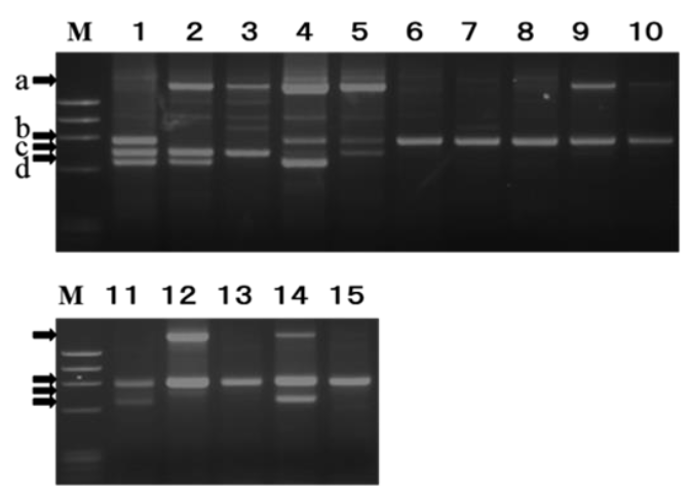
Figure 8: Example of the PCR using the primer set for the differentiation of various kinds of rice cultivars

Nevertheless, it is necessary to perform many PCRs and electrophoreses to distinguish rice cultivars by RAPD or SSR markers because those markers are difficult to use simultaneously in the same experiment. It became possible to save experiment time and cost using multiplex primer set based on SCAR markers. Figure 8 is an example that the multiplex SCAR marker set is useful to differentiate various rice cultivars by a single time PCR and electrophoresis. Three DNA bands appeared clearly in case of Koganemochi, premium Japonica waxy rice, and other three ones appeared clearly in case of Hinohikari, premium non-glutinous Japonica rice. In case of Nanjing 11, typical Indica non-glutinous rice, showed the different three bands, which are useful to differentiate with the other Indica rice, IR2061.

Primer Set for “Koshihikari” Identification: In Japan, leading variety Koshihikari shares more than one thirds of total cultivation area of rice because it is palatable and traded at higher price than other rice cultivars. It is obliged, in Japan, that the name of rice cultivar, location of cultivation, and year of rice production are labeled on the package of rice by the Japan Agricultural Standard (JAS) Act. Therefore, it was necessary to develop the technology to identify Koshihikari cultivar by DNA analysis. As shown in Figure 9A, Koshihikari can be discriminated from any other cultivars using this “primer set for identification” showing three specific DNA bands [69]. There is no other cultivar rice which shows the same three band pattern with Koshihikari among 50 dominant non-glutinous rice cultivars in Japan. All the Koshihikari from the different districts showed the same pattern of three DNA bands, which correspond to the same grouping under Japanese Seeds and Seedling Law based on representative characteristics of rice plant (Figure 9B). On the contrary, no cultivars other than Koshihikari showed the same DNA patterns with Koshihikari even Hitomebore or Hinohiari, which are descendant cultivars of Koshihikari as shown in Figure 9A [69].

biomedres-openaccess-journal-bjstr

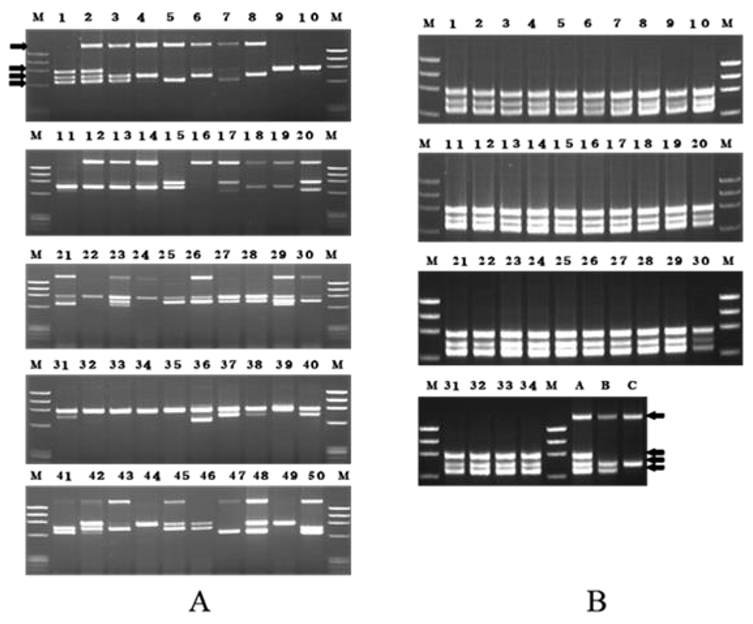
Figure 9: Primer set for identification of Koshihikari. A: 50 different rice cultivars (No1 is Koshihikari)
B: Koshihikari of 34 different prefectures.

Primer Set for Differentiation of Other Rice with Koshihikari: As the premium rice Koshihikari sells at high price, mislabeling “Koshihikari 100%” occurs by the dishonest rice retailers in Japan. For the purpose of detection of rice grains of other cultivars which were dishonestly blended into Koshihikari, “Detection-kit” was developed. In case of detection-kit, no DNA is proliferated in case of all Koshihikari rice grains of various prefectures (Figure 10A), and more than one DNA bands never fail to in-crease by PCR in case of rice grains of other cultivars (Figure 10B). This “primer set for detection” can be used to detect the illegal blending of other rice to Koshihikari labeled as “Koshihikari 100% premium rice.” [69] SSR markers are useful not only characterize the relationship between heterosis and marker genotype heterozygosity but also to identify chromosome segments that may have significant effects on yield and its component traits in rice [57-62]. And SNPs were used for the discussion on the sequence variations between the rice cultivars [64,65]. Nevertheless, “multiplex primer sets” using SCAR markers were revealed to be more useful and practical for efficient and precise cultivar differentiation.

biomedres-openaccess-journal-bjstr

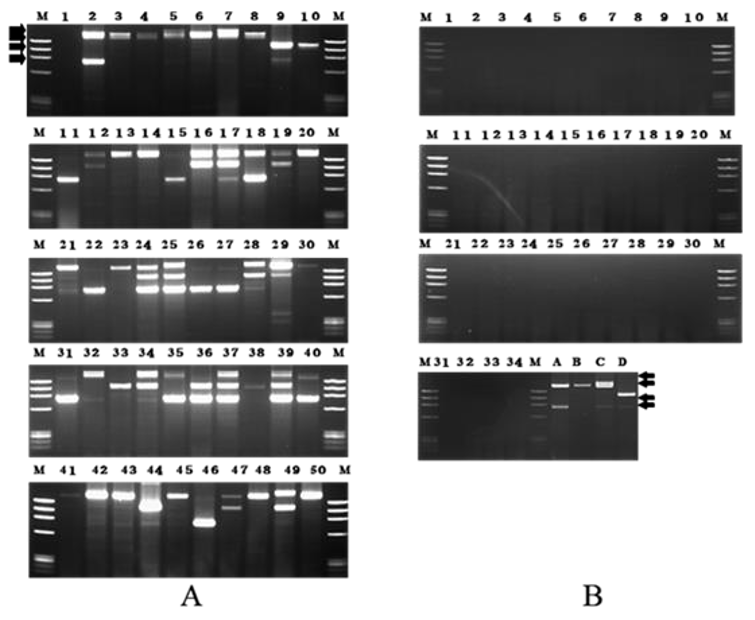
Figure 10: Primer set for detection of other cultivar rice grains to Koshihikari. A: 50 different rice cultivars
B: Koshihikari of 34 different prefectures

Novel DNA Extraction/Purification Method from Processed Rice Products and Differentiation of Material Rice Cultivars of Boiled Rice by PCR: In case of boiled white rice grain, gelatinized rice starch and heat de-natured proteins inhibit the extraction of DNA. Therefore, it is necessary to remove these starch and proteins without the damage or decomposition of DNAs themselves. Comparison of template DNAs prepared by the three methods, commercial kit method, CTAB method and “enzyme treatment method” was carried out [67]. “Enzyme treatment method” was shown to be profitable from the viewpoint of quality and quantity. High temperature of 80 degrees during the starch decomposition by the heat stable alpha-amylase and coexistence of SDS during the protein digestion are meaningful to inhibit the activity of endogenous DNase. Although commercial DNA extraction kit is very useful to prepare the template DNAs from rice leaves, it is not suitable for boiled rice. No amplified DNA bands appeared after PCR in case of template DNA prepared by the commercial kit [67].

In case of CTAB method, it is possible to prepare purified DNAs, but it was inferior to “enzyme treatment method” in terms of quantity of DNAs. Lysozyme is sometimes used for DNA preparation [58]. But lysozyme decomposes cell wall mainly, and it is difficult to digest the gelatinized starch and denatured proteins. It became possible to proliferate specific DNAs by PCR using template DNA prepared by the “enzyme treatment method” and the multiplex primer set is very useful to differentiate various rice cultivars by a single PCR and electrophoresis as shown in Figure 11 [67]. In case of boiled white rice grain, as shown in Figure 11, it became possible to differentiate Hitomebore or Hinohikari from Koshihikari, their parental cultivar by PCR using the template DNA prepared from each single grain of boiled rice by the “enzyme treatment method”, which was de-scribed in Materials and Methods [67].

biomedres-openaccess-journal-bjstr

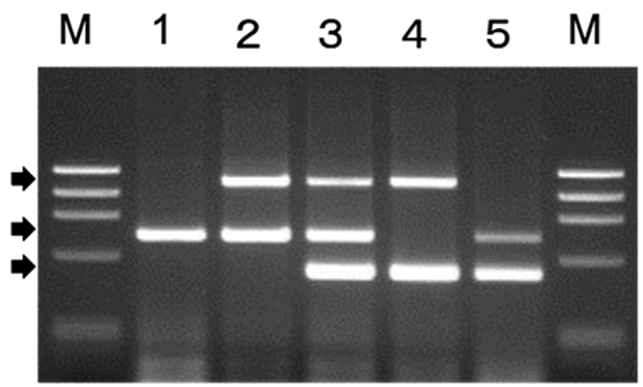
Figure 11: Differentiation of Japanese rice cultivars by PCR using template DNA extracted from a single boiled rice grain by the “enzyme treatment method”

Differentiation of Material Rice Cultivars of Rice Cake by PCR: The results of PCR using template DNAs prepared from each rice cake by “enzyme treatment method” were same with those using template DNAs from Multiplex PCR for identification of material rice of rice cake. ”Ezymetreatment method” is also useful for preparation of template DNAs from rice cake. Solubility of rice cake in boiling water and expansion on heating varies depending on cultivar and producing area of the material glutinous rice [69]. Therefore, identification of cultivars of the material glutinous rice using rice cake as a sample is very important. The results of PCR using template DNAs prepared from each rice cake by “enzyme treatment method” were same with those using template DNAs from material raw rice flour directly by CTAB method as shown in Figure 12. It became possible to differentiate each material waxy rice cultivar by the single PCR and electrophoresis by the development of primer set for “multiplex PCR” to identify waxy rice cultivars [70]. material rice flour directly by CTAB method as shown in Figure 12 [68]. In conclusion, it became possible to identify or differentiate rice cultivars by PCR. Practical primer set for Koshihikari, dominant cultivar in Japan, was developed. It became possible to identify or differentiate the dominant cultivar by a single PCR without timeconsuming RAPD analysis or elaborate elec-trophoresis for SSR analysis. Furthermore, the results were same with ones based on the plant characteristics [1,69]. It became possible to use not only raw rice grains but also processed rice products, such as boiled rice or rice cake, as materials for cultivar identification by PCR method by the development of “enzyme treatment method.” The interference of DNA extraction by the ge-latinized starch and denatured proteins of the processed rice products is re-moved by the decomposition of starch and proteins. Heat-stable alpha-amylase was very useful because the high temperature of 80 degrees inhibits the DNase activities during the starch decomposition and SDS is useful to prohibit the DNase during the protein digestion [67]. Single boiled rice grain or rice cake can be used as a sample for identification or differentiation of material rice cultivars by PCR method [67,68].

biomedres-openaccess-journal-bjstr

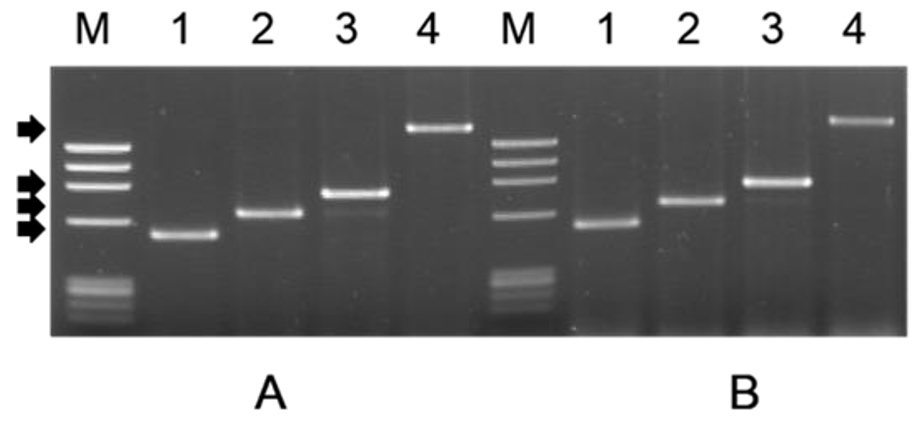
Figure 12: Differentiation of Japanese rice cultivars by PCR using template DNA extracted from the raw rice flours or the rice
cake using “enzyme treatment method”
A: Raw Rice Flours
B: Rice Cake

Recent Progress of Rice Authentication Technology: Hayashi et al. assessed the utility of single-nucleotide polymorphisms (SNPs) and small insertion/deletion polymorphisms (InDels) as DNA markers in genetic analysis and breeding of rice [74]. They surveyed SNPs and InDels in the chromosomal region containing the Piz and Piz-t rice blast resistance genes and developed PCRbased markers for typing the SNPs. Their findings suggest that, because of its ability to generate numerous markers within a target region and its simplicity in assaying genotypes, SNP genotyping with allele-specific PCR is a valuable tool for gene mapping, mapbased cloning, and marker-assisted selection in crops, especially rice. Satake Corporation developed and commercialized “Cultivar Identification System for Rice” in 2005 based on DNA tip method. It is an automatic system and it became possible to identify or differentiate rapidly and simply about 98% of Rice cultivars in Japan. Paddy, brown rice, polished rice, or the pre-washed rice samples are available for the system. It takes only 8 hours for 6 samples although it took about 3 days before (Figure 13). Starch characteristics determine the quality of various products of rice, e.g., eating, cooking and processing qualities. Bao et al. reported microsatel-lite polymorphism in the Waxy (Wx) gene, soluble starch synthase I gene (SS1) and starch branching enzyme 1 gene (SBE1), single nucleotide poly-morphism (SNP) in Wx and starch branching enzyme 3 gene (SBE3), and a sequence tagged site (STS) in starch branching enzyme 1 gene (SBE1) among 499 nonwaxy rice samples and their relationships with starch physicochemical properties [75].

biomedres-openaccess-journal-bjstr

Figure 13: Cultivar Identification System for Rice (Satake Inc.).

Analysis of the starch physicochemical properties of the samples withdifferent microsatellites, SNPs and STS groups indicated that these molecular markers can differentiate almost all the physicochemical properties examined, e.g., apparent amylose content (AAC), pasting viscosity characteristics, etc. These SSRs, SNPs and STS are useful in marker-assisted breeding for the improvement of starch quality of rice. To identify the chromosomal regions controlling the eating quality of cooked rice, Takeuchi et al. performed a quantitative trait locus (QTL) analysis using 93 backcross inbred lines (BILs) and 39 chromosome segment substitution lines (CSSLs) derived from crosses between a japonica rice cultivar Koshihikari (glossier appearance, tasty, sticky and soft eating quality of rice when cooked) and an indica cultivar Kasalath (less glossy appearance, less sticky and hard eating quality of rice when cooked) [76]. They evaluated the eating quality of rice including overall evaluation (OE), glossiness (GL), taste (TA), stickiness (ST) and hardness (HA) in each line based on the sensory test of cooked rice. They also mapped the QTLs for chemical properties, such as amylose content (AC) and protein content (PC), which affected the eating quality.

Consequently, QTL was mapped in the interval between the SSR markers RM1332 and RM6676 in the middle region of the short arm of chromosome 3 by fine mapping of three sub-CSSLs. Five QTLs, qOE6, qGL6, qTA6, qST6 and qHA6, seemed to be associated with the Waxy (Wx) gene located on chromosome 6. Evaluation of eating quality in early breeding generations of rice is critical to developing varieties with better palatability. Lestari et al. reported about DNA markers associated with eating quality of temperate japonica rice and an evaluation method aided by multiple regression analysis [77]. A total of 30 markers comprising STSs, SNPs, and SSRs were tested for their association with palatability using 22 temperate japonica varieties with different palatability values. Eating quality-related traits of the 22 varieties were also measured. Of the 30 markers, 18 were found to be significantly associated with palatability and, consequently, a model regression equation with an R2 value of 0.99 was formulated to estimate the palatability by the marker data set. Validation of the model equation using selected breeding lines indicated that the marker set and the equation are highly applicable to evaluation of the palatability of cooked rice in temperate japonica varieties.

X. Zhou et al. reviewed about the utilization of next generation sequencing (NGS) on direct identification of candidate genes [78]. The genome-wide association analysis (GWAS) has become a commonly used approach toward identifying the genetic loci and candidate genes for several traits that are closely associated with grain yield. The Multi- parent Advanced Generation Inter-Cross population (MAGIC) is introduced to discuss potential applications for mapping QTLs for rice varietal development. Their strategies broaden the capacity of functional gene identification and its application as a complementary method to insert mutants that comprise T-DNA and transposons. Moreover, accurate genome sequence information enables genome editing for the utilization of key recessive genes that control important agronomic traits. Their review summarized how NGS accelerates rice genetic improvements through the identification and utilization of key functional genes that regulate agronomic traits.

Bio-Functionality of Super-Hard Rice with Long- Chain Amylopectin- Multiple Prevention Against Diabetes and Dementia

Abstract

Diabetes and dementia are life-style related diseases, and patients have been increased all over the world. We tried to prevent diabetes using the high-amylose rice cultivars. It was shown that the postprandial BGL of high-amylose rice was lower than that of low-amylose rice. “Super hard rice”, of which starch contains longchain amylopectin, was developed in Kyushu University, Japan, and we clarified its characteristics by the cooperative re-search. It was very hard after cooking, and rich in resistant starch. “Super hard rice” lowered postprandial BGL not only as cooked rice grains but also as rice noodle and rice bread. We prepared super-hard rice bread blended with 5% of black rice bran (SRBBB), which contained much amylose and showed inhibitory activity against β- secretase after heating. Aged mice, which were fed SRBBB diet for 4 weeks, showed lower amyloid β40 in the blood than the control. We investigated the effects of the blend of ordinary brown rice and black rice cooked after a high-pressure treatment (HPTKO). A randomized, single-blind, crossover-designed study was conducted using 15 subjects, and BGLs at 90 and 120 min after ingesting the cooked HPTKO were significantly lower than that for cooked ordinary polished rice. Furthermore, postprandial blood amyloid β40 did not increased markedly compared with the control.

Introduction

According to WHO report, globally, an estimated 422 million adults were living with diabetes in 2014, and diabetes of all types can lead to complications in many parts of the body and increase the overall risk of dying prematurely [79]. Therefore, there is an urgent need to implement population-based interventions that prevent diabetes, enhance its early detection, and use lifestyle and pharmacological interventions to prevent or delay its progression to complications [80]. The WHO and Food and Agriculture Organization of the United Nations recommend foods with low glycemic index (GI) to prevent diabetes [81]. The concept of GI was introduced by Jenkins, et al. [82]. as a ranking system for carbohydrates based on their immediate impact on blood glucose levels, and low GI and glycemic load diets have more recently been widely recommended for the prevention of chronic diseases including diabetes, obesity, cancer and heart disease [83], because the re- sulting glycemic index classification of foods provided a numeric physiologic classification of relevant carbohydrate foods in the prevention and treatment of diseases such as diabetes [84]. Alzheimer’s disease affects more than 25 million people worldwide and is the most common form of dementia [85]. β-amyloid precursor protein (APP) is processed to generate β-amyloid (Aβ) by β- and γ-secretase, in a highly regulated process. Many drugs have been approved for the treatment of Alzheimer’s disease, at different stages of the disease, although they all have limited efficacy. Recent epidemiological studies have suggested a link between Alzheimer’s disease and type 2 diabetes mellitus associated with insulin resistance [86-88].

Diabetes is a lifestyle disease, and its prevention and treatment are extremely important. Low glycemic index (GI) foods inhibit rapid increases in blood glucose and insulin secretion after meals. The β-amyloid precursor protein (APP) generates the amyloid β peptide (Aβ) via β- and γ- secretase in a highly regulated process. Because working memory is impaired by AD, the disease has spawned dynamic research investigating the influence of gammaaminobutyric acid (GABA) on working memory performance in AD sufferers [89]. It is well-recognized that the prevalence of dementia is higher in diabetic patients than in non- diabetic subjects [90], and Tokutake, et al. [91] showed that there is a molecular link between AD and insulin signaling. Cereal grains are indispensable for the people all over the world. Intake of calories, 1st functions, satisfaction of sensory preference, 2nd functions, and the maintenance and promotion of health, 3rd functions, could be possible by the intake of various grains. For example, brown rice contains vitamin Bs, vitamin E, dietary fibers, gamma- oryzanol, ferulic acid, phytic acid, and gamma-Aminobutyric acid (GABA), various minerals, and polyphenols. Colored grains, such as red rice, purple wheat, purple barley, and purple corn, contain much amount of anti-oxidative polyphenolic substances.

Several studies have reported the development of highly resistant starch rice [92,93] as well as high-amylose and high-dietary fiber rice [94] via physical or chemical mutation. The hydrolysis of starch is a key factor in controlling the GI of foods. Functional foods that have α-glucosidase inhibi-tory activities have proven effective in controlling blood sugar levels in people at risk of developing diabetes [95]. Furthermore, epidemiological studies suggest that the low incidences of certain chronic diseases in rice-consuming regions of the world may be attributable to the antioxidant compounds found in rice. The molecules with antioxidant activity contained in rice include phenolic acids, flavonoids, anthocyanins, proanthocyanidins, tocopherols, tocotrienols, γ-oryzanol, and phytic acid. Rice bran also contains various functional substances, such as γ-oryzanol, ferulic acid, sterol, wax, ceramide, phytin, inositol, and protein [96].

Rice bran oil, the only domestic edible vegetable oil made from the rice bran produced in Japan, is known to have high oxidative stability and serum cholesterol- lowering activity [97,98]. You et al. showed that in mice fed a ferulic acid-enriched diet, exercise endurance capacity was enhanced and fatigue was reduced by elevating antioxidative potentials [99]. Matsuzaki et al. showed that bran rice and γ-oryzanol reduced hypothalamic endoplasmic reticulum stress and attenuated the preference for dietary fat in mice [100]. Matsuoka et al. showed that plant sterols/stanols decreased blood cholesterol levels through the inhibition of cholesterol absorption in the intestines [101]. Intake of fermented brown rice could minimize insulin secretion, thus attenuating any subsequent rise in the levels of blood sugar [102]. Abe et al. showed that rice components including inositol hexaphosphate significantly inhibited Aβ production in neuroblastoma cells without causing cytotoxicity, suggesting such foods may prevent Alzheimer’s disease [103]. Pigmented rice contains naturally occurring colored substances that be-long to the flavonoid group called anthocyanins. Positive health effects of these pigments present in the bran layer of rice have been reported [104].

Ling et al. showed that red and black rice decreases atherosclerotic plaque formation and increase antioxidant status in rabbits due to their enhanced serum high-density lipoprotein (HDL) cholesterol and apolipoprotein A1 concentrations [105]. Recently, food technology to prevent the decrease of those biofunctional components during the cooking and increase their functions by the germination, high- pressure treatment, or the coextrusion cooking have been reported. High-pressure treatment (HPT), a technological process that limits the negative effects of food preparation on hydro-soluble vitamins, is recognized as being very useful in preserving nutritional quality in foods [106,107]. Yamakura, et al. [108] showed that subjecting rice to HPT before cooking results in more free amino acids and stickier cooked rice. The consumption of a western diet, which is characterized by a high in-take of red meats and high-fat dairy products, may contribute to obesity and metabolic syndrome, as well as increase the risk of developing type 2 diabetes and cardiovascular disease. In contrast, the traditional Asian diet, which is rich in soy and fish but low in animal protein and fat, may help reduce the frequency of severe chronic diseases [109]. There is also a significant association between a Mediterranean diet and reduced risk of major chronic de- generative diseases, including Alzheimer’s disease. The optimal diet for the prevention of cardiovascular and other major chronic diseases has rapidly evolved [110].

Development of Specialty Rice Cultivars (High-Amylose Rice, Black Rice)

Super rice research project of Japan started in 1989. It was supported by Ministry of Agriculture, Forestry and Fisheries, Japan, to enhance rice consumption. Low-amylose, high-amylose, giant embryo, aromatic, pigmented and high-prolamin rice cultivars were bred and utilized (Figure 14). We prepared wheat/rice bread blending three kinds of specialty rice, high-amylose, sugary, and purple rice cultivars. The bread showed good taste and maintained softness even after 4 days [111].

Utilization of High-Amylose Rice (Prevention of Diabetes)

Diabetes patients are more than 8.2 million and 18.7 million including those to be diabetes in near future in Japan. It is indispensable to prevent diabetes for the reduction of the increase of the medical costs. It has been reported by the large-scale medical tests that the inhibition of drastic increase of the blood glucose after meals reduce the rate of diabetes initiation [81-84,93]. Cristiana reviewed about the rice compounds with impact on diabetic control [112]. They pointed out that rice macro nutrients, such as starch, proteins, lipids, and dietary fiber, and rice bran compounds, such as gam-ma-oryzanol, phytic acid, ferulic acid, and gamma-aminobutyric acid (GABA)and vitamin E, and elucidated the metabolic mechanisms and bioactive towards diabetes [112]. We aimed to evaluate the palatability of the high-amylose rice of which eating qualities are inferior to ordinary Japonica rice. Another objective of this research was to clarify the mechanism to pre-vent diabetes initiation by the high-amylose rice by the feeding test of rats and diet test by the human beings. Proximate components and gelatinization properties of the high-amylose rice were clarified and texture and eating qualities of the cooked rice from high-amylose rice were reported [113]. In the case of highamylose rice, drastic increase of blood glucose and insulin after meals were inhibited (Figure 15) [113]. By serving the retrograded rice samples (2hrs after cooking), increase of blood insulin was more inhibited for high-amylose rice than for low-amylose one in animal feeding test [113].

biomedres-openaccess-journal-bjstr

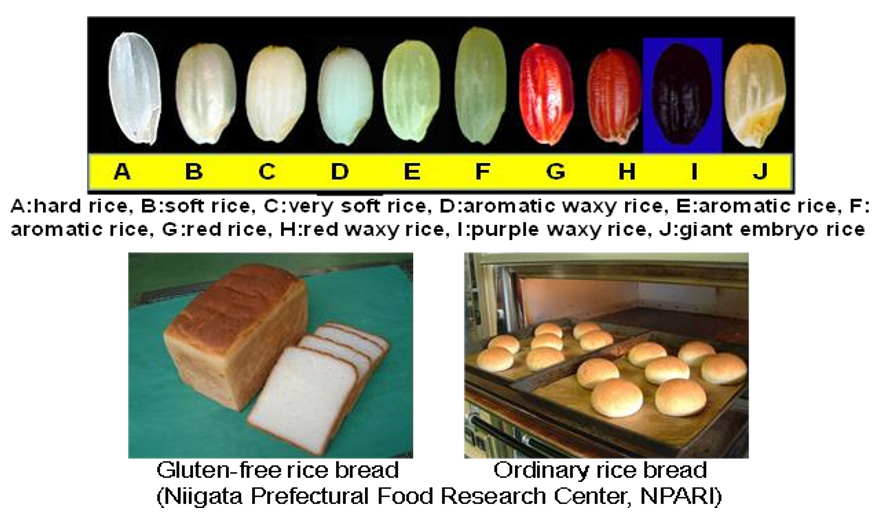
Figure 14: Specialty rice cultivars and rice bread in Niigata Prefectural Agricultural Research Institute

biomedres-openaccess-journal-bjstr

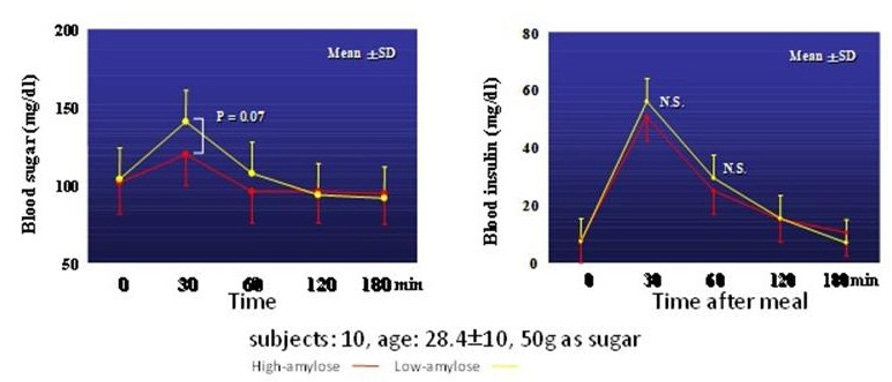
Figure 15: Change in digestion degree between high-amylose rice and low- amylose one

Super-Hard Rice, Amylopectin Long Chain Rice (Prevention of Diabetes)

Super-hard rice (ae mutant rice) was developed through chemical mutation method (MNU method) by H. Sato et al. of Kyushu University Japan (Figure 16) [114]. Its starch is characteristic because its apparent amylose content is markedly high because its amylopectin has much amount of middle and long glucan chains [114]. Although its cooked rice is unpalatable due to hard texture, it contains high amount of resistant starch [115-118]. Therefore, super-hard rice is promising as a material to prevent obesity and diabetes. Nakamura and Ohtsubo [119], and Maeda, et al. [120] tried to improve the texture of cooked rice from super-hard rice (CRSH), and they showed that the high-pressure treatments improve the texture of CRSH and maintained the effect to inhibit abrupt increase of postprandial blood glucose level.

biomedres-openaccess-journal-bjstr

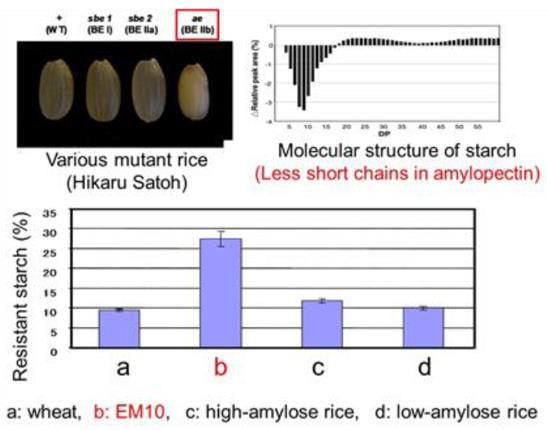
Figure 16: Super-hard rice and its molecular structure of starch amylopectin.

Diabetes/Dementia Multi-Prevention Rice Product by the Combination of Specialty Rice and High- Pressure Treatment

Bio-Chemical Test for Prevention of Life-Style Diseases

Type-2 diabetes and Alzheimer’s disease are very serious disease and the former has been suggested to be one of the causes of the latter [86-88]. Low glycemic index foods inhibit rapid increases in blood glucose and insulin secretion after meals [93,94]. Antioxidative capacity of brown rice and rice oil may be useful for the prevention of dementia [96,98,103]. In this study, we investigated the palatability of boiled rice and inhibition of an abrupt increase in blood glucose level (BGL) and amyloid β peptide production after eating blend of ordinary brown rice, “Koshihikari” and anthocyaninrich black-rice, “Okunomurasaki” unpolished rice cooked after a high-pressure treatment (HPT KO). “Okunomurasaki” showed a high antioxidant capacity and high inhibitory activity against β-secretase even after HPT and cooking [121].

Animal Feeding Test

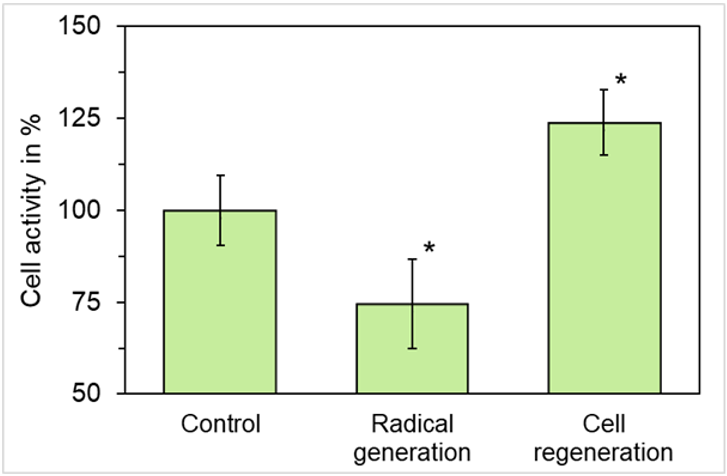
Multiple prevention of type-2 diabetes and Alzheimer’s disease by the rice products would be very important objective for us [86,88,93,94]. Therefore, we prepared super- hard rice bread blended with black rice bran (SRBBB), which showed strong inhibitory activities against β-secretase and acetyl-cholinesterase and contained high amount of resistant starch even after heating. Black rice bran showed greater β-secretase inhibitory activity (3.6- fold) than Koshihikari rice [121]. The bran contained more oleic acid and anthocyanin, meaning that it is potentially a bio-functional food with a high antioxidant capacity. Furthermore, aged mice, which were fed a SRBBB diet for 4 weeks, showed lower amyloid β 40 peptide in the blood than mice fed a commercial diet (p < 0.01) [121] (Figure 17B). Additionally, their initial blood glucose levels after 12 weeks of being fed SRBBB were significantly lower than those in the control group (Figure 17A). Taken together, our results indicate that SRBBB seems to be promising for inhibiting not only amyloid β production but also abrupt in-creases in post prandial BGL.

biomedres-openaccess-journal-bjstr

Figure 17: Change in blood glucose and amyloid β40 in mice.

Human Intervention Test (Single-Dose Test)

It seemed to be necessary to conduct a human intervention test of the promising rice product in terms of inhibitory activity against the increase of BGL and amyloid β peptide production to prove the probability to prevent type-2 diabetes and Alzheimer’s disease. Therefore, we prepared heat moisture treatment cooked brown rice (HMT), and high- pressure treatment cooked brown rice (HPT), which contained higher amounts of resistant starch, antioxidant capacity, and β-secretase inhibitory activity than cooked ordinary white rice (Table 4) [122]. A randomized, single-blind, crossoverdesigned study was conducted using 15 subjects with a normal BGL. It was reported that GI varies depending on the subjects (e.g., young men and women), so we divided the 15 subjects into two groups; a high BGL subclass (seven subjects) and a low BGL subclass (eight subjects). BGL at 90, and 120 min after eating cooked HPT KO unpolished rice for 15 subjects showed a significantly lower BGL compared with that after eating cooked Koshihikari polished rice (p < 0.05). BGL at 90 min and 120 min after eating cooked HPT KO unpolished rice for high BGL subjects (n = 7) showed a significantly lower BGL compared with that after eating cooked Koshihikari polished rice (p < 0.05). AUC was significantly lower compared with cooked Koshihikari white rice 120 min after eating (p < 0.05) [122]. Furthermore, the increase in the amyloid β40 peptide in the blood 120 min after eating HPT KO (unpolished rice, blend of Koshihikari, ordinary rice, and Okunomurasaki, black rice (ratio was 6:4)) tended to be lower than that of cooked Koshihikari polished rice in human intervention test (single-dose test) [123].

biomedres-openaccess-journal-bjstr

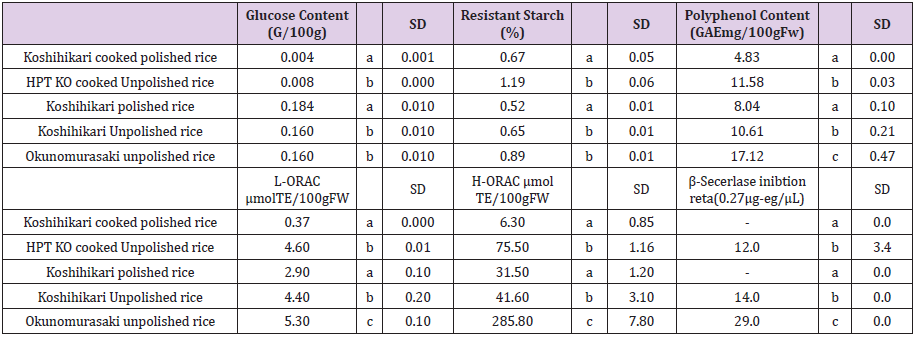
Table 4: Bio-functional properties of raw rice and cooked samples.

Note: HPT, high pressure treatment; KO unpolished rice, blend Koshihikari and Okunomurasaki(6:4) unpolished rice, Significant
difference(p<0.05) among the two cooked rice and the three raw rice is shown by a, b and c.

Long-Term Human Intervention Test (12-Week Test)

Furthermore, we conducted a long-term human intervention test using the HPSHRB (high-pressure treated super-hard rice (40%) blended with black rice (40%)) in terms of inhibitory activity against the abrupt increase of BGL (Figure 18) and amyloid β peptide production for the probability to prevent type-2 diabetes and Alzheimer’s disease. Tokutake et al. pointed out that amyloidβ secretion and hyperphosphorylation of tau are closely related [91], and we had ascertained it by the cell-culture test. By the long-term in- tervention test, we aimed to confirm the effects to inhibit both of abrupt in-crease of post- prandial blood glucose and amyloid β peptide production. And we could ascertain the safety and acceptability of our multi-preventive rice product by this long-term test. Test was performed under the permission of ethical committee for the human test. As a result, significant reduction of abrupt increase of blood glucose (Figure 18) and inhibition of decrease in amyloid β ratio (amyloid β42/amyloid β40, Figure 19), bio-marker of Alz- heimer’s disease [124], were shown after the 12-week human test [125]. And all 12 subjects accepted the rice sample and finished test with no adverse effects.

biomedres-openaccess-journal-bjstr

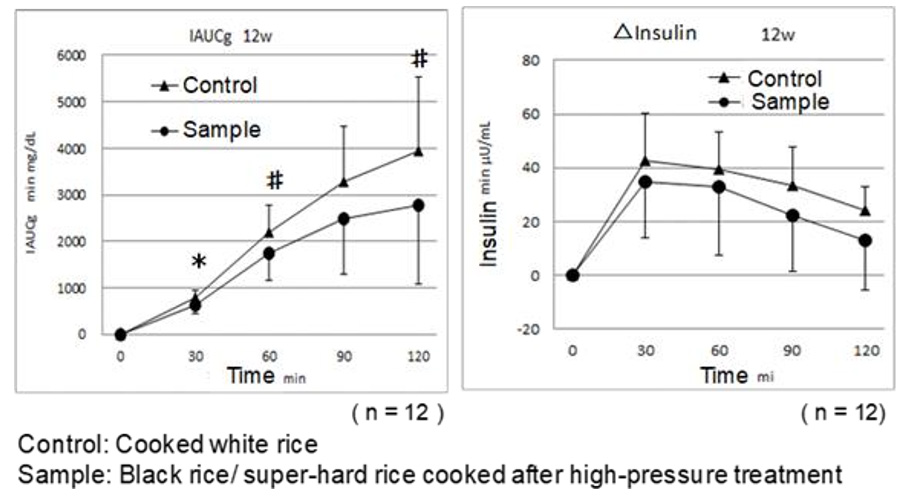
Figure 18: Change in IAUCg120 in subjects after eating cooked rice HPT KO (after 12 weeks).

biomedres-openaccess-journal-bjstr

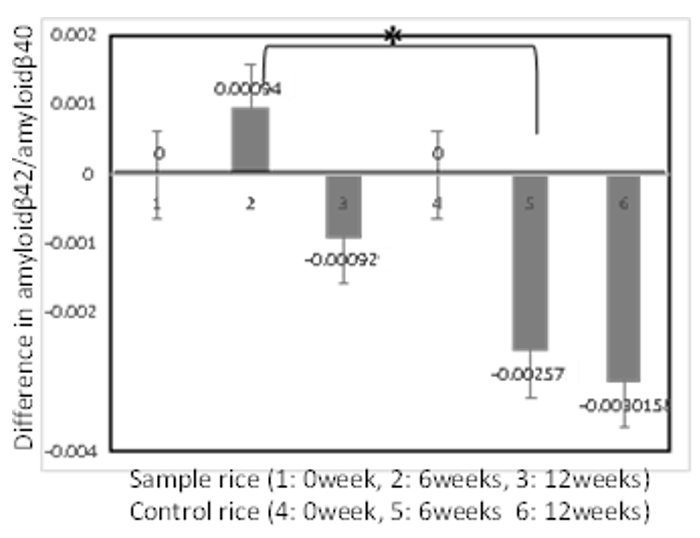
Figure 19: Difference in blood amyloid β42/ amyloid β40 after 6 and 12 weeks in human test

Summary

Diabetes and dementia are life-style related diseases, and patients have been increased all over the world. Rice is a staple food for Japanese and they eat rice at least once or twice every day. Rice does not only supply calories and give tasty dishes but also maintains healthy life for consumers and prevents some diseases. Since 1989, specialty ricecultivars, such as hard rice, soft rice, colored rice, aromatic rice, giant-embryo rice, etc. have been developed in Japan. We tried to prevent diabetes using the highamylose rice cultivars. It was shown that the postprandial BGL of high-amylose rice was lower than that of ordinary rice. It was shown that not only high-amylose rice but also pre-germinated giantembryo rice have the effects to lower the postprandial BGL and to lower the bloodpressure compared with the ordinary rice. “Super hard rice”, of which starch contains long- chain amylopectin, was developed in Kyushu University and we showed its characteristics by the cooperative research. It was very hard after cooking, and rich in resistant starch. “Super hard rice” lowered postprandial BGL not only as cooked rice grains but also as rice noodle and rice bread. High pressure treatment was introduced to food processing by Hayashi in 1980’s. We showed that the super rice becomes softer and sticker by the high-pressure treatment preserving high amount of resistant starch.

We prepared super-hard rice bread blended with 5% of black rice bran (SRBBB), which contained a high amount of resistant starch that showed strong inhibitory activities against β-secretase after heating. Aged mice, which were fed SRBBB diet for 4 weeks, showed lower amyloid β 40 in the blood than the control. We investigated the effects of the blend of ordinary brown rice, super-hard rice, and black rice (2:4:4, w/w) cooked after a high-pressure treatment (HPT KO). A randomized,single-blind, crossover-designed study was conducted using 15 subjects with a normal BGL, and BGLs at 90 and 120 min after ingesting the cooked HPT KO were significantly lower than that for cooked ordinary polished rice (p < 0.05). Furthermore, we conducted a long-term test using the HPSHRB in terms of inhibitory activity against the abrupt increase of BGL and amyloid β peptide production for the probability to prevent type-2 diabetes and Alzheimer’s disease. As a result, significant reduction of abrupt increase of blood glucose and change in amyloid β ratio were shown after the 12-week human test. And all 12 subjects accepted HPSHRB and finished test with no adverse effects. Furthermore, the ratio ofamyloid β42 to amyloid β40, an indicator for the proceeding of Altzheimer disease, did not increase markedly compared with the control.

For More Articles: Biomedical Journal Impact Factor: https://biomedres.us

Open Access Journals on Biochemistry

The Quadratic forms of Equations for Calculation of the Ki and Ka Constants of Enzyme Inhibition and Activation

Introduction

In previous articles [1-9], devoted to construction of a vector method representation of enzymatic reactions in the threedimensional  coordinate system the properties of L vectors of enzymatic reactions was analyzed, from which the parametriacal classification of the types of enzymatic reactions and the equations for calculation of initial activated (Va ) and inhibited (Vi ) reaction rates was suggested. In these article the equations of traditional form (t.f.) for calculation of the constants of activation (Ka) and absent in practice nontrivial types of biparametrical constants of inhibition (Ki) of enzymes (Table 1), was deduced.
This work is devoted to deduction of quadratic form (q.f.) of the equations for calculation of biparametrical constants of inhibition and activation of enzymes (Table 1t & 1f), opening additional ability in the analysis of enzyme action what help of quadratic forms of equation (Table 1q& 1f).
The examples of comparative using traditional and quadratic form of equations for calculation of Ki and Ka constants of inhibition and activation are given.

biomedres-openaccess-journal-bjstr

Table 1: Equations for calculation of Ki and Ka constants (in traditional form).

*The symbol of a graph in Figs. 1-15 corresponds to the type of reaction under study. For example: the line (0) characterizes the position of initial (nonactivated) enzymatic reaction, line I – the position of a graph representing the type of activated enzymatic reaction etc.

biomedres-openaccess-journal-bjstr

Table 1 (continuation).

Deduction of Traditional form of Equations

From (Figures 1, 1a and 2) it easy to see, that ( Ii l ) length of (LIi) projection of LIi vector of biparametrically coordinated, i I type (or mixed type [10 -12]) of enzyme inhibition on Pi semiaxis will be determined by divide (i-0) parameters on ( Ii l ) length of (LIi) projection of LIi vector of – by summation of the quadratic (l2) lengths (orthogonal between them self) LIIIi and LIVi projections of monoparametrical LIIIi and LIVi vectors of i III and  
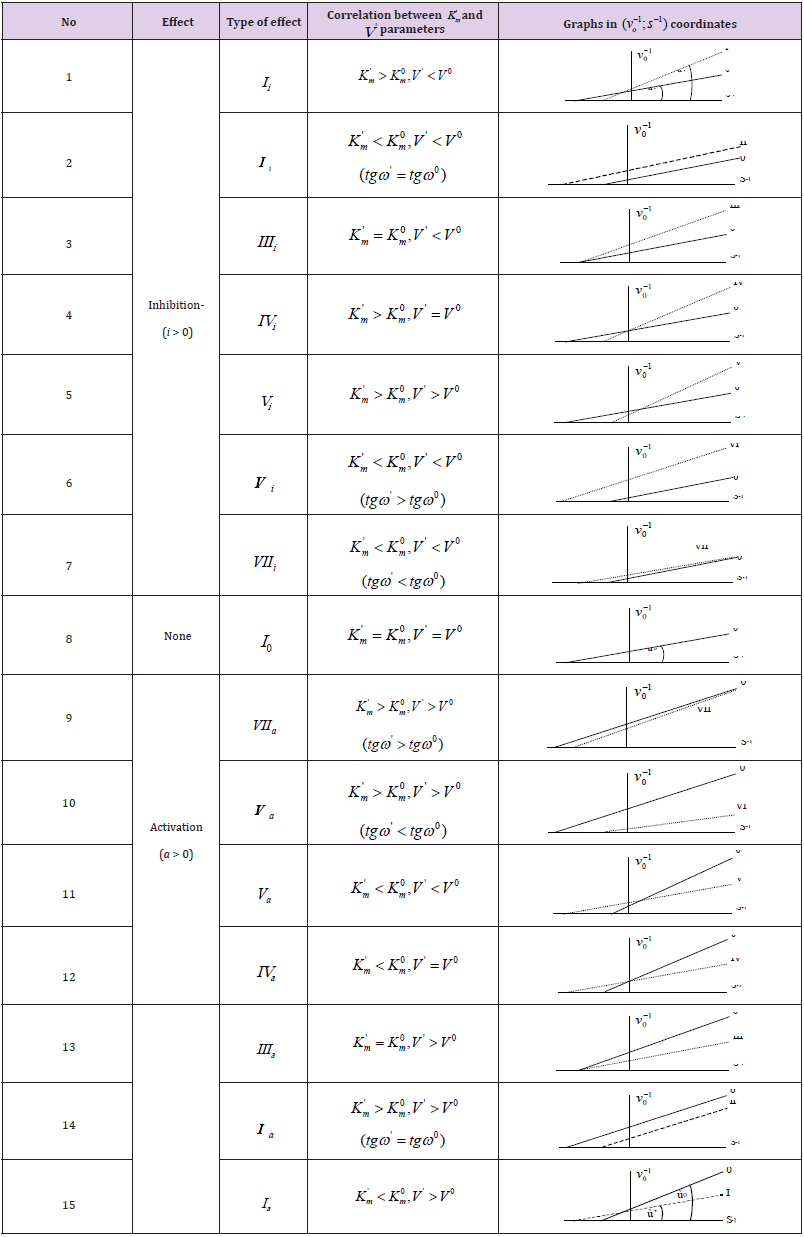
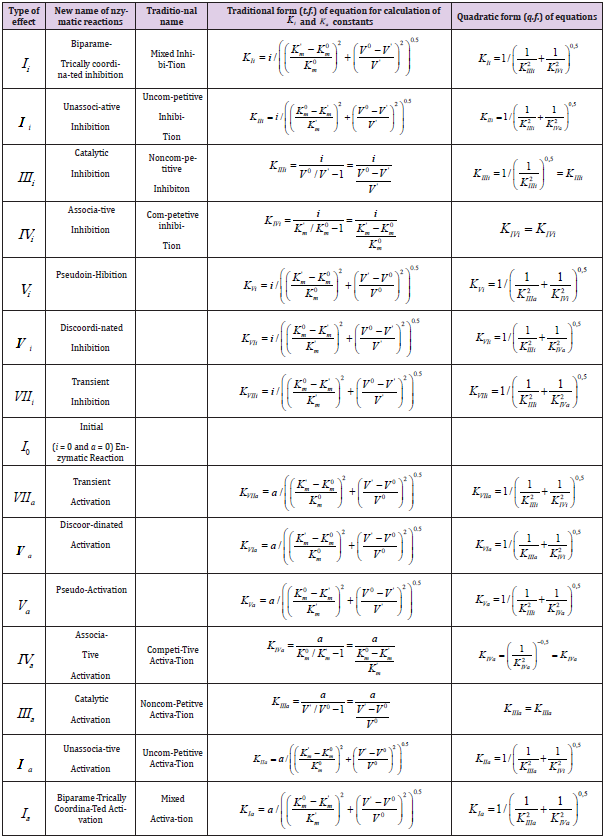
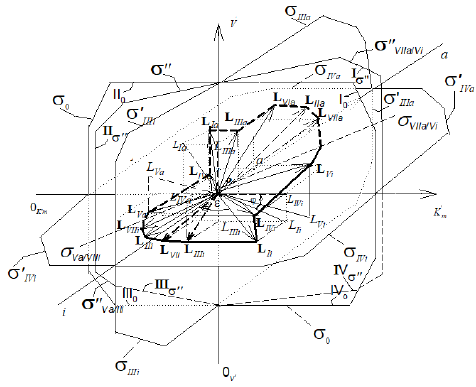
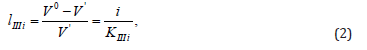
type of enzyme inhibition, (which also are the coordinate of these vectors) but in the same time they taking adjacent place relative to orthogonal LIi projection of LIi vector (Figure 2), determined by equation:

biomedres-openaccess-journal-bjstr

Figure 1: Three dimensional (incompletely) system of rectangular coordinate with separately Pi and Pa semiaxes of molar concentrations of [i] inhibitor and [a] activator. Only 8 L vectors of enzymatic reactions (the symbols: LIi, LIVi, LIIIi, LIIi, LIa, LIIIa, LIIa placed in appropriate parallelepipeds and four orthogonal projections of these L vectors (the symbols: LIi, LIVi, LIIIi and LIa) are placed on basic 0 σ plane (Io, IIo … quadrants of this plane), the magnitude of ϕ angle about 3400.

biomedres-openaccess-journal-bjstr

Figure 1a: Three dimensional (completely)  
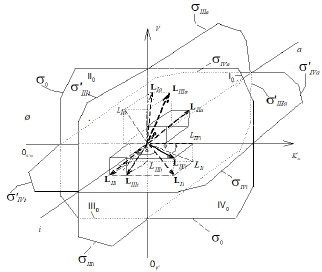
coordinate system, (the same as Figure 1), bat with all 14 branched L vectors (7 type of additional L vectors placed without of appropriate arallelepipeds. The ends of all mobile L vectors are joined by dash line (broken part – activated, unbroken part– L vectors of inhibited reactions). The 15th L0 vector of initial reaction (and it L0 projection take place in P point of coordinate intersection. The all 14 orthogonal LIi, LIVi … LIa , LIa projections of L vectors on basic 0 σ plane, are placed completely in (Figure 2).  quadrants of transient σ ” plane, VIIa/Vi σ and Va/VIIi σ – beginning and finishing ends of the line of orthogonal σ ” transient plane projection on basic σ0 plane (in Figures.1a and 2, market by broken lines), the magnitude of ϕ angle about 3400.

Figure 2: Two-dimensional (scalar)  coordinate system. The symbols of kinetic parameters:  the projections LIi, LIVi… LIa, LIVa of three-dimensional vectors: LIi, LIVi… LIa, LIVa on the basic 0 σ plane and symbols of  coordinate semiaxes the same as in Figure. 1 and in the text, the magnitude of ϕ angle about 150.
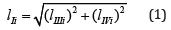
The Ii l length of LIi projection on 0 σ plane of Figures.; (1 – 2) may be determined as

Having expressed from Eq. (2) the lIIIi length of LIIIi projection of LIIIi vector on P0V semiaxis of  coordinate (Figures 1, 1a):

from Eq. (3) – the lIVi length of the second adjacent of LIVi vector projection on  semiaxis:

and substituted them in Eq. (4):

we shall obtain traditional form (t.f.) of equation for calculation of the Ii K constant of biparametrically coordinated, i I type, inhibition of enzymes, taking in to consideration the lIi length of orthogonal projection of LIi vector on basic 0 σ plane of Figure (1a):

where 
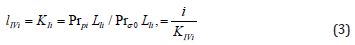
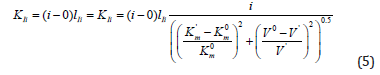
, as it follows from (Figures 1&2).

It is analogous for length of adjacent projections:  for all other lIIa, lVa … of vectors projections of biparametrical reactions (Figures 1,1a & 2).

Deduction of Quadratic form of Equations

From analysis of Equations (1-4) one can easily see that substitution in Eq. (4) of the dimensionless coordinates of the lengths of LIIIi and LIVi vector projections is equal to substitution in this equation of the i /KIIIi and i /KIVi parameters then it is not difficult to become the alternative equations for calculation of i K and a K constants of biparametrical types of inhibition and activation of enzymes. Having substituted in Eq. (4) of the dimensionless coordinates of the lengths of LIIIi and LIVi vector projections is equal to substitution in this equation of the i /KIIIi and i /KIVi parameters.

we find that such as:

this substitution will lead to equation:

or, in quadratic form:

convenient for calculation of constant inhibition of enzymes (Eq. 1, q.f., in Table 1).

It is analogous for all the other equations of biparametrical types of inhibition (Eqs: 2, 5 – 7), and activation (Eqs: 9 – 11 and 14-15 of enzymes, Table 1q & 1f) such as orthogonal projections of correspond L vectors on the basic 0 σ plane, easy to determine by data of two-dimensional (scalar)  coordinate system (Figure 2), taking into account orthogonal L projections of tree-dimensional L vectors on basic 0 σ plane of (Figures 1a).

Examples of constants calculation.

Example 1: Calculation of Constant Inhibition

The inhibitory effect of Tungstic acid anions 2 4 4 WO − (0.5×10− M) on the initial rate of pNPP cleavage by calf alkaline phosphatase (Figure 3). shows that the presence 0.5×10⁻⁴M of these anions in the enzyme-substrate system makes the binding of the enzyme to the substrate cleaved  
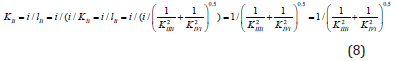
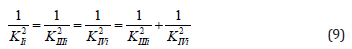
difficult and leads to a decrease in the maximum reaction rate (V0= 2.56, V’= 1.74μmol/ (min per μg protein). This meets all the features  
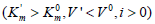
of the biparametrically coordinated, i I type, of enzyme inhibition (Table 1, line 1). Hence, to calculate the Ii K constant of this phosphatase inhibition it is necessary to use Eq. (5, text), or (Eq. 1, Table 1t & 1f).
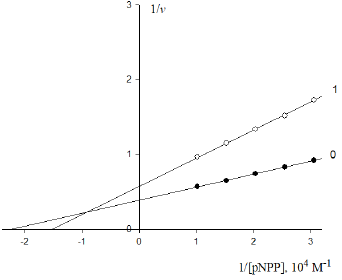
biomedres-openaccess-journal-bjstr

Figure 3: Inhibitory effect of anions  on the initial rate V0, mol/ (min per g protein) of pNPP cleavage by calf alkaline phosphatase. Note: line 1 – the concentration of  is 0.5×10⁻⁴M ; line (0) – the inhibitor is absent.

Substitution in this equation of the parameters  and i obtained by data analysis of (Figure 3) allows the calculation of this constant of enzyme inhibition:

Substitution the same parameters (recalculated to values of  
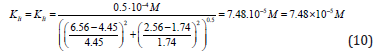
constants) in equation (1 of Table 1t & 1f), result into next value of this Ii K constant:

Substitution of these parameters in (Eq. 1, q.f., Table 1)

result into the same value of the constant of enzyme inhibition:

From Eqs. (10 -13) it follows that dimension of constants in all cases, are the molar concentration of inhibitor:

Control. Determine the value of the IIIi K constant of this experiment (Figure 3) by values of Ii K and IVi K constants.

From equations (11) and (12), rewritten to the form,

it follows that:

Substitution the necessary parameters from (Eq. 15) to (Eq. 16), we find that:

which is in good agreement with the experimental value of this constant (Eq. 12).

Example 2: Calculation of Constant Inhibition

The inhibitory effect of Pyrrolidine dithiocarbonic acid (PDTA) on the initial rate of pNPP cleavage by canine alkaline phosphatase shows that in the presence of 1×10⁻³M PDTA the parameters  
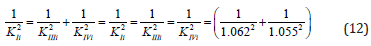
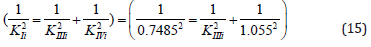
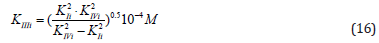
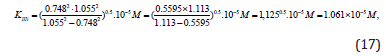
and V0= 2.921 μmol/(min per μg protein) change as follows  and V ‘ = 3.616 μmol/(min per μg protein) (Figure 4). This corresponds to the, Vi type, of enzyme pseudoinhibition  (Table 1, line 5) and Eq. (5, t.f.) is applicable for calculation of the KVi constant of enzyme inhibition. Substitution all necessary parameters in this equation allows calculation of this constant of enzyme inhibition:
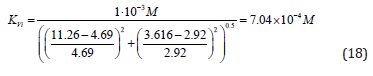
biomedres-openaccess-journal-bjstr

Figure 4: Inhibitory effect of PDTA on the initial rate V0 , mol/(min per g protein) of pNPP cleavage by canine alkaline phosphatase. Note: line 1 – the concentration of PDTA is 1×10⁻³M ; line (0) – the inhibitor is absent.

Substitution of recalculated parameters of (Figure 4)  and  
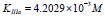
to (Eq. 5, Table 1, q.f.) – result into value of Vi K constant inhibition:

Example 3: Calculation of Constant Activation

The activating effect of Guanosine (Guo) on canine alkaline phosphatase (Figure 5) shows that in the presence of 1×10⁻³M Guo the parameters of initial reaction of pNPP cleavage, i. e  
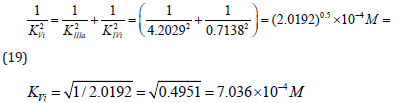
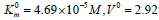
μmol/(min per μg protein), change as follows:  μmol/(min per μg protein). This corresponds to the, Ia type, of unassociative enzyme activation.

biomedres-openaccess-journal-bjstr

Figure 5: Activating effect of Guo on the initial rate v0, mol/(min per g protein) of pNPP cleavage by canine alkaline phosphatase. Note: line 1 – the concentration of Guo is 1×10⁻³M ; line (0) – the activator is absent.

Hence, to calculate the KIIa constant of enzyme activation, one should use Eq. (14, t.f., Table 1).

Substitution of the obtained values of parameters in this equation allows calculation of this constant of enzyme activation:

Substitution of the:  
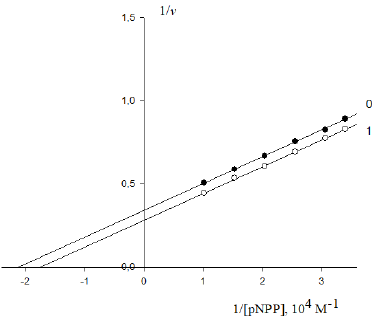
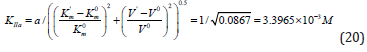
parameters of this experiment (Figure 5) in (Eq. 14, q.f., Table 1), result in to:

as it was to be expected, result in to the same value of activation constant:

From the length parts of equations: (12), (15), (19) and (21) may to see that all they obeys to the signs of Pifagor’s theorem and this may be used as for calculation any of the third constants by the two others known already and for correction the constants, determined by using any other equations.

Example 4: Calculate the value of KIIIi constant of experiment (Figure 3), by value of KIi and KIVi constants. From equation (1, Table 1t & 1f), rewritten to the quadratic form (23).

it follows that:

Having substitution all necessary parameters from (Eq. 23) to (Eq. 24), we shall become, that:

Ii is analogous for all biparametrically types of catalyzed reactions (Table 1).

Introduction in practice of quadratic forms of equations for calculation of Ki and Ka constants, will facilitates for many authors to interpret obtained data of nontrivial types of inhibition and activation by such definition as «essentially competitive inhibition», «similarly to competitive inhibition » and so on [13 -17].

For More Articles: Biomedical Journal Impact Factor: https://biomedres.us

Open Access Journals on Medicinal Chemistry

Recently Reported Dual-Drug Co-Delivery of Liposomal-Based Chemotherapeutics to Treat Breast Cancer

Introduction

Globally, breast cancer is the leading cause of cancer death amongst women [1], and the administration of currently available chemotherapeutics can not only have negative side-effects associated with their use, but also can have limited overall drug efficacy. The use of nanocarriers can serve to alleviate potential deleterious side-effects of cytotoxic agents, and there are many different types of nanocarriers available for such delivery. Liposomes, however are currently of great interest with respect to the development of improved chemotherapeutics largely due to their clinical success. For example, Doxil is a clinically approved drug currently used to treat metastatic breast cancer [2-4], and there are various other liposomal-based chemotherapeutics in either preclinical stages or various phases of clinical trials [5-7]. The clinical success of liposomal-based drugs can be explained for many reasons. For example, their phospholipid bilayer not only makes them biocompatible, but also serves to shield the encapsulated drug from coming into contact with healthy tissue while in circulation. Furthermore, their size can be fine-tuned to the desired size (usually 100 nm in diameter or less) to take advantage of the enhanced permeability and retention (EPR) effect known to occur in-vivo [8-10]. The EPR effect arises from deregulated angiogenesis that occurs in and around solid tumors, as well as the poor lymphatic drainage associated with tumor sites. However, while these nanocarriers can effectively deliver cytotoxic agents to solid tumors such as breast cancer while minimizing negative unwanted side effects, there are still many challenges associated with the overall effectiveness of the drug.

In fact, one of the arguably biggest obstacles to overcome with respect to drug efficacy is multidrug resistance (MDR), which is the primary means by which cancer cells develop resistance to various chemotherapeutic agents [11,12]. For example, this is the case with doxorubicin, which is the encapsulated cytotoxic agent within the clinically approved drug Doxil, and the most widely- used drug to treat breast cancer [13,14], as well as many other commonly used chemotherapeutics [15]. Therefore, several research groups are working on the co-encapsulation of dual drugs in a single nanocarrier such as a liposome in order to improve overall drug efficacy. The strategy here being the use of two drugs, in some cases one is a chemosensitizer and the other a cytotoxic agent, or in other cases two cytotoxic agents with completely different mechanisms of action. For example, Rolle et al. have recently reported a dualdrug liposomal formulation involving the chemosensitizer drug disulfiram and the cytotoxic agent doxorubicin [14]. In this study, this formulation effectively reversed doxorubicin resistance in P-glycoprotein (Pgp)-expressing breast cancer cells. The authors also point out the benefits of using liposomes to both improve the solubility and enhance the stability of the disulfiram. In another recently reported study, Ghosh et al. co-loaded liposomes with two cytotoxic agents, vincristine and doxorubicin, and have determined that the synergistic effect of this combination significantly improved the therapeutic efficacy when tested on triple negative breast cancer (TNBC) cells [16].

Conclusion and Discussion

The use of dual-drug liposomal-based systems to treat breast cancer in order to overcome multidrug resistance is a promising area of study, and several encouraging formulations have been reported here. In fact, in the last study mentioned, Jose et al. uses temperature-sensitive liposomes in order to better facilitate the release of encapsulated drugs so that they can then be internalized into cancer cells. The transfer of encapsulated materials within liposomes to cancer cells can be challenging, and therefore many research groups are currently working on targeted drug delivery [5,21]. Generally, this type of delivery involves liposomal surface modification to include the addition of a targeting ligand that is specific to a known overexpressed breast cancer cell surface receptor. In fact, an interesting future construct may involve dualdrug targeted liposomal formulations, either a chemosensitizer and cytotoxic agent or two cytotoxic agents with completely different mechanisms of action as reported here, for improved delivery of co-encapsulated drugs to breast cancer cells.

Acknowledgment

This work was supported by funds generously provided by the Paul Engler Foundation (Dr. David R. Khan, Paul Engler Endowed Professor of Natural Sciences), the Welch Foundation (grant # AE-0025), the Ross Wilson Organization (Dr. Jason Yarbrough, Ross Wilson Endowed Chair in Chemistry), as well as the Killgore Research Center through the Research Enhancement and Killgore Research grant program at West Texas A&M University.

For More Articles: Biomedical Journal Impact Factor: https://biomedres.us

Open Access Journals on Science and Technology

Beneficial Effects of a Topper with Fango Molecule Structure – Investigations with Organ-Specific Cells in Culture

Introduction

Basically, mud therapy is a simple and effective treatment of several disorders of neurological, rheumatologically, cardiovascular, gynecological and inflammatory origin [1,2]. The term “fango,” which originated in Italy, means a special kind of mud deposited from the thermal springs of sulfur bearing sulfuro or sulfated water [3] and its application is named as fangotherapy. In general, fango holds heat and is useful as a thermal application for chronic health conditions [4]. It also stimulates circulation and lymph flow, supports detoxification and helps the body to relax. Some types of fango have anti-inflammatory and pain relieving properties that make them useful for soft tissue injury [5]. The topper with fango molecule structure as tested in this study was primarily designed that the textile fibers of the topper correspond to the molecular structure of natural mineral mud and can, therefore, reflect infrared waves from the body. Thus, the topper might possess the beneficial health effects of fango. According to the manufacturer, many users report amazing improvements in vitality, health and well-being.In the present study, current cell biological test methods were used to investigate whether the topper might be able to inactivate an excess of endogenously generated radicals and thus prevent oxidative stress. Local oxidative stress in the tissue plays an important role in inflammatory reactions [6-9], in the course of wound healing [10,11] or after physical exercise or even overload [12-14]. Therefore, it was also examined whether the topper has a direct beneficial effect on the cell regeneration/wound healing process.

Material and Methods

Topper with Fango Molecule Structure

The company Physio Night GmbH from D-85134 Stammham, Germany, states that the textile fibers of the PHYSIO NIGHT DELUXE topper with fango molecule structure correspond to the molecular structure of natural mineral mud and can therefore reflect infrared waves from the body. In addition, the topper is complemented all around with a mix of stone pine and new wool. According to the company, a renowned textile manufacturer from Italy has succeeded with the help of nanotechnology in integrating the molecular structure responsible for the beneficial effects of fango into the cotton textile of the topper.

Basic Cell Culture

Human promyelocytes (cell line HL-60; ACC-3; ECACC 98070106; Leibniz-Institute; DSMZ German Collection for Microorganisms and Cell Cultures, Braunschweig, Germany) were cultivated for at least 10 passages upon receipt from the cell culture collection and were taken for the experiments over a period of several weeks to ensure independent experiments. Cells were routinely cultivated in RPMI 1640 medium supplemented with 10 % growth supplement and 0.5 % gentamycin. The non-adherent cells were routinely cultivated as suspended mass cultures in special culture flasks with a ventilated lid (25 cm2 growth area; TPP, Switzerland) and were routinely subculture twice a week with fresh culture medium. Cultures were incubated at 37 °C in an atmosphere of 5 % CO2 and 95 % air at almost 100 % humidity. By addition of 1.5 % dimethyl sulfoxide to the culture medium, cells were differentiated over a period of 6 days into functional neutrophils, which are capable of generating superoxide anion radicals in the course of an oxidative or respiratory burst after addition of phorbol- 12-myristate-13-acetate (Sigma-Aldrich, Deisenhofen, Germany) [15-19]. Connective tissue fibroblasts (cell line L-929; ACC-2; Leibniz Institute DSMZ – German Collection of Microorganisms and Cell Cultures, Braunschweig, Germany) were cultivated for at least 20 passages upon receipt from the cell culture collection and were taken for the experiments over a period of several weeks to ensure independent experiments. Cells were routinely grown in RPMI 1640 with 10 % growth supplement and 0.5 % gentamycin and incubated in an incubator at 37 °C in a humidified atmosphere of 5 % CO2 and 95 % air. All cell culture reagents were purchased from Pan-Biotech, Aiden Bach, Germany.

Anti-Inflammatory Effect (Functional Neutrophils)

For the entire duration of the differentiation process, cells were grown in culture flasks, which were placed on pieces of the topper (about 5 × 5 cm in size) and were shielded in several layers of aluminum foil to avoid any unwanted interactions between the exposed cells and the unexposed control cultures… Untreated control cells from the same basic culture were cultivated under identical conditions, but without the topper, and also shielded with multilayers of aluminum foil. Finally, the cells of each experimental series were prepared by two centrifugation steps (6 min at 190 × g) and repeated washings in phosphate buffered saline with calcium and magnesium. Aliquots of the suspended cells in phosphate buffered saline with calcium and magnesium containing 10 mm glucose were taken for the tests and induced to undergo an oxidative burst by the addition of phorbol-12-myristate-13-acetate to the reaction mixture. The reactive superoxide anion radicals in the reaction mixture caused the cleavage of the tetrazolium dye WST-1 (Roche Diagnostics, Mannheim, Germany), which was also present in the reaction mixture. The amount of superoxide anion radicals present in the reaction mixture was directly related to the cleavage and color change of the dye. The color change was recorded at various selected time points up to 40 min as a differential measurement ΔOD = 450 – 690 nm by an Elisa reader (Biotech Elks 808 with software Gen 5 version 3.00) and calculated with Microsoft Excel 2016. Three independent experiments (n = 3) with duplicate wells for each experiment were conducted.

Cell Regeneration/Wound Healing (Connective Tissue Fibroblasts)

Cells were seeded at a density of 100,000 cells/ml into the four cell culture compartments of silicone Culture-Insert 4 Well (ibidi, Gräfelfing, Germany). The four compartments are separated by a 500 μm thick silicone wall. Due to their especially designed surface, the inserts stick firmly to the cell culture dish and completely prevent any cell attachment and growth under their silicone walls. When the silicone frame is removed, a cell-free space (artificial wound) with sharp edges is left. The cell-free space is then closed by cell migration and proliferation. 48 h after seeding, the cells have become confluent and the silicone frames were removed. After placing the pieces of the topper (about 5 × 5 cm in size) below the cell cultures and shielding them in several layers of aluminum foil, the cells were allowed to migrate and proliferate into the cell-free space for 21 hours. Untreated control cells from the same basic culture were treated and cultivated at identical conditions, but without the topper, and also shielded with multi-layer aluminum foil. Finally, cells were fixed with methanol and stained with a Giemsa’s azur eosin methylene blue solution (Merck, Darmstadt, Germany), and air-dried. The width of the remaining wound space was measured at a minimum of six different areas. Three independent experiments were conducted.

Statistical Analysis

Statistical analysis was done by using the non-parametric, twotailed Wilcoxon-Mann-Whitney test.

Results

Anti-Inflammatory Effect

Exposure of HL-60 cells to the topper for six days during the differentiation process resulted in a reduced generation of endogenous radicals after stimulation (Figure 1). The radical generation in the exposed cell cultures was reduced by 22.6 ± 12.2% (mean value ± standard deviation, n = 3). This reduction was statistically significant (p ≤ 0.05).

Cell Regeneration/Wound Healing

The microscopic examination of the fixed and stained samples of cell regeneration showed at first sight a clear stimulation of the colonization of the cell-free space by exposure to the topper when compared to the untreated control (Fig. 2). The quantification documented a statistically significant improvement by the topper by 23.9 ± 8.8 % (mean value ± standard deviation; Fig. 1) in comparison to the untreated control (p ≤ 0.05).

biomedres-openaccess-journal-bjstr

Figure 1: Effect of the PHYSIO NIGHT DELUXE topper with fango molecule structure on the generation of superoxide anion radicals of functional neutrophils and the regeneration of connective tissue cells. Corresponding controls are set as “100 %. Note that radical generation is decreased, and cell regeneration is increased. Data represent mean values ± standard deviation of 3 independent experiments. *p ≤ 0.05 vs. control; non-parametric, two-tailed Wilcoxon-Mann-Whitney test.

biomedres-openaccess-journal-bjstr

Figure 2: Representative micrographs of fixed and stained cell cultures demonstrating regeneration and wound closure within 21 hours for the untreated control (A) in comparison to the culture which was treated with the PHYSIO NIGHT DELUXE topper (B). Note the significantly reduced cell-free space after treatment in (B). Olympus IX-50 inverted microscope equipped with an Olympus Planachromate 10x and an Olympus E-10 digital camera with 4-megapixel resolution at bright field illumination.

Discussion

Cell cultures are frequently used for a better understanding of the mechanisms that underlie cell activity in vivo. This includes differentiation, migration, proliferation, and metabolism. For over a century, two-dimensional cell cultures as used in this present study, have been used as in vitro models and are well accepted in preclinical research. However, one might argue that cell cultures do not represent the human body with its complex metabolic pathways and facets, but it should be considered that cell cultures can shed light on selected aspects of living matter and are a useful tool to reduce or even avoid animal experiments. Neutrophils are the most abundant type of granulocytes which make up about 60 % of all white blood cells in humans and are normally found in the bloodstream. They form an essential part of the innate immune system [20] and, therefore, play a key role in the front-line defense against invading microbial pathogens. However, neutrophils are also one of the first responders of inflammation and migrate from the blood into the inflamed tissue and generate highly reactive superoxide anion radicals in the course of an oxidative or respiratory burst [21]. The test results of this study indicate that the topper can have a direct effect on inflammatory processes in vivo. The generation of unwanted reactive oxygen radicals is reduced, so that a local oxidative stress in the tissue is also reduced. This can have a positive effect on the healing process of the inflamed tissue after occurrence of local oxidative stress. Synergistically to the first finding is the beneficial effect of the topper on cell regeneration. In this present test system, especially the granulation phase is simulated which is characterized by migration and proliferation of the cells in order to close the cell-free space (= wounded area) in vivo. However, a complicated wound healing process is also related to local oxidative stress [22-24] which is also reduced by the topper. Taken together, both effects can work synergistically and have a beneficial effect on inflammatory reactions or cell regenerative processes after excessive stress or physical burden or even overload. Thus, the PHYSIO NIGHT DELUXE topper might be able to maintain and improve individual health and well-being.

For More Articles: Biomedical Journal Impact Factor: https://biomedres.us

Open Access Journals on Medical Science

Beneficial Effects of a Topper with Fango Molecule Structure – Investigations with Organ-Specific Cells in Culture

Introduction

Basically, mud therapy is a simple and effective treatment of several disorders of neurological, rheumatologically, cardiovascular, gynecological and inflammatory origin [1,2]. The term “fango,” which originated in Italy, means a special kind of mud deposited from the thermal springs of sulfur bearing sulfuro or sulfated water [3] and its application is named as fangotherapy. In general, fango holds heat and is useful as a thermal application for chronic health conditions [4]. It also stimulates circulation and lymph flow, supports detoxification and helps the body to relax. Some types of fango have anti-inflammatory and pain relieving properties that make them useful for soft tissue injury [5]. The topper with fango molecule structure as tested in this study was primarily designed that the textile fibers of the topper correspond to the molecular structure of natural mineral mud and can, therefore, reflect infrared waves from the body. Thus, the topper might possess the beneficial health effects of fango. According to the manufacturer, many users report amazing improvements in vitality, health and well-being.In the present study, current cell biological test methods were used to investigate whether the topper might be able to inactivate an excess of endogenously generated radicals and thus prevent oxidative stress. Local oxidative stress in the tissue plays an important role in inflammatory reactions [6-9], in the course of wound healing [10,11] or after physical exercise or even overload [12-14]. Therefore, it was also examined whether the topper has a direct beneficial effect on the cell regeneration/wound healing process.

Material and Methods

Topper with Fango Molecule Structure

The company Physio Night GmbH from D-85134 Stammham, Germany, states that the textile fibers of the PHYSIO NIGHT DELUXE topper with fango molecule structure correspond to the molecular structure of natural mineral mud and can therefore reflect infrared waves from the body. In addition, the topper is complemented all around with a mix of stone pine and new wool. According to the company, a renowned textile manufacturer from Italy has succeeded with the help of nanotechnology in integrating the molecular structure responsible for the beneficial effects of fango into the cotton textile of the topper.

Basic Cell Culture

Human promyelocytes (cell line HL-60; ACC-3; ECACC 98070106; Leibniz-Institute; DSMZ German Collection for Microorganisms and Cell Cultures, Braunschweig, Germany) were cultivated for at least 10 passages upon receipt from the cell culture collection and were taken for the experiments over a period of several weeks to ensure independent experiments. Cells were routinely cultivated in RPMI 1640 medium supplemented with 10 % growth supplement and 0.5 % gentamycin. The non-adherent cells were routinely cultivated as suspended mass cultures in special culture flasks with a ventilated lid (25 cm2 growth area; TPP, Switzerland) and were routinely subculture twice a week with fresh culture medium. Cultures were incubated at 37 °C in an atmosphere of 5 % CO2 and 95 % air at almost 100 % humidity. By addition of 1.5 % dimethyl sulfoxide to the culture medium, cells were differentiated over a period of 6 days into functional neutrophils, which are capable of generating superoxide anion radicals in the course of an oxidative or respiratory burst after addition of phorbol- 12-myristate-13-acetate (Sigma-Aldrich, Deisenhofen, Germany) [15-19]. Connective tissue fibroblasts (cell line L-929; ACC-2; Leibniz Institute DSMZ – German Collection of Microorganisms and Cell Cultures, Braunschweig, Germany) were cultivated for at least 20 passages upon receipt from the cell culture collection and were taken for the experiments over a period of several weeks to ensure independent experiments. Cells were routinely grown in RPMI 1640 with 10 % growth supplement and 0.5 % gentamycin and incubated in an incubator at 37 °C in a humidified atmosphere of 5 % CO2 and 95 % air. All cell culture reagents were purchased from Pan-Biotech, Aiden Bach, Germany.

Anti-Inflammatory Effect (Functional Neutrophils)

For the entire duration of the differentiation process, cells were grown in culture flasks, which were placed on pieces of the topper (about 5 × 5 cm in size) and were shielded in several layers of aluminum foil to avoid any unwanted interactions between the exposed cells and the unexposed control cultures… Untreated control cells from the same basic culture were cultivated under identical conditions, but without the topper, and also shielded with multilayers of aluminum foil. Finally, the cells of each experimental series were prepared by two centrifugation steps (6 min at 190 × g) and repeated washings in phosphate buffered saline with calcium and magnesium. Aliquots of the suspended cells in phosphate buffered saline with calcium and magnesium containing 10 mm glucose were taken for the tests and induced to undergo an oxidative burst by the addition of phorbol-12-myristate-13-acetate to the reaction mixture. The reactive superoxide anion radicals in the reaction mixture caused the cleavage of the tetrazolium dye WST-1 (Roche Diagnostics, Mannheim, Germany), which was also present in the reaction mixture. The amount of superoxide anion radicals present in the reaction mixture was directly related to the cleavage and color change of the dye. The color change was recorded at various selected time points up to 40 min as a differential measurement ΔOD = 450 – 690 nm by an Elisa reader (Biotech Elks 808 with software Gen 5 version 3.00) and calculated with Microsoft Excel 2016. Three independent experiments (n = 3) with duplicate wells for each experiment were conducted.

Cell Regeneration/Wound Healing (Connective Tissue Fibroblasts)

Cells were seeded at a density of 100,000 cells/ml into the four cell culture compartments of silicone Culture-Insert 4 Well (ibidi, Gräfelfing, Germany). The four compartments are separated by a 500 μm thick silicone wall. Due to their especially designed surface, the inserts stick firmly to the cell culture dish and completely prevent any cell attachment and growth under their silicone walls. When the silicone frame is removed, a cell-free space (artificial wound) with sharp edges is left. The cell-free space is then closed by cell migration and proliferation. 48 h after seeding, the cells have become confluent and the silicone frames were removed. After placing the pieces of the topper (about 5 × 5 cm in size) below the cell cultures and shielding them in several layers of aluminum foil, the cells were allowed to migrate and proliferate into the cell-free space for 21 hours. Untreated control cells from the same basic culture were treated and cultivated at identical conditions, but without the topper, and also shielded with multi-layer aluminum foil. Finally, cells were fixed with methanol and stained with a Giemsa’s azur eosin methylene blue solution (Merck, Darmstadt, Germany), and air-dried. The width of the remaining wound space was measured at a minimum of six different areas. Three independent experiments were conducted.

Statistical Analysis

Statistical analysis was done by using the non-parametric, twotailed Wilcoxon-Mann-Whitney test.

Results

Anti-Inflammatory Effect

Exposure of HL-60 cells to the topper for six days during the differentiation process resulted in a reduced generation of endogenous radicals after stimulation (Figure 1). The radical generation in the exposed cell cultures was reduced by 22.6 ± 12.2% (mean value ± standard deviation, n = 3). This reduction was statistically significant (p ≤ 0.05).

Cell Regeneration/Wound Healing

The microscopic examination of the fixed and stained samples of cell regeneration showed at first sight a clear stimulation of the colonization of the cell-free space by exposure to the topper when compared to the untreated control (Fig. 2). The quantification documented a statistically significant improvement by the topper by 23.9 ± 8.8 % (mean value ± standard deviation; Fig. 1) in comparison to the untreated control (p ≤ 0.05).

biomedres-openaccess-journal-bjstr

Figure 1: Effect of the PHYSIO NIGHT DELUXE topper with fango molecule structure on the generation of superoxide anion radicals of functional neutrophils and the regeneration of connective tissue cells. Corresponding controls are set as “100 %. Note that radical generation is decreased, and cell regeneration is increased. Data represent mean values ± standard deviation of 3 independent experiments. *p ≤ 0.05 vs. control; non-parametric, two-tailed Wilcoxon-Mann-Whitney test.

biomedres-openaccess-journal-bjstr

Figure 2: Representative micrographs of fixed and stained cell cultures demonstrating regeneration and wound closure within 21 hours for the untreated control (A) in comparison to the culture which was treated with the PHYSIO NIGHT DELUXE topper (B). Note the significantly reduced cell-free space after treatment in (B). Olympus IX-50 inverted microscope equipped with an Olympus Planachromate 10x and an Olympus E-10 digital camera with 4-megapixel resolution at bright field illumination.

Discussion

Cell cultures are frequently used for a better understanding of the mechanisms that underlie cell activity in vivo. This includes differentiation, migration, proliferation, and metabolism. For over a century, two-dimensional cell cultures as used in this present study, have been used as in vitro models and are well accepted in preclinical research. However, one might argue that cell cultures do not represent the human body with its complex metabolic pathways and facets, but it should be considered that cell cultures can shed light on selected aspects of living matter and are a useful tool to reduce or even avoid animal experiments. Neutrophils are the most abundant type of granulocytes which make up about 60 % of all white blood cells in humans and are normally found in the bloodstream. They form an essential part of the innate immune system [20] and, therefore, play a key role in the front-line defense against invading microbial pathogens. However, neutrophils are also one of the first responders of inflammation and migrate from the blood into the inflamed tissue and generate highly reactive superoxide anion radicals in the course of an oxidative or respiratory burst [21]. The test results of this study indicate that the topper can have a direct effect on inflammatory processes in vivo. The generation of unwanted reactive oxygen radicals is reduced, so that a local oxidative stress in the tissue is also reduced. This can have a positive effect on the healing process of the inflamed tissue after occurrence of local oxidative stress. Synergistically to the first finding is the beneficial effect of the topper on cell regeneration. In this present test system, especially the granulation phase is simulated which is characterized by migration and proliferation of the cells in order to close the cell-free space (= wounded area) in vivo. However, a complicated wound healing process is also related to local oxidative stress [22-24] which is also reduced by the topper. Taken together, both effects can work synergistically and have a beneficial effect on inflammatory reactions or cell regenerative processes after excessive stress or physical burden or even overload. Thus, the PHYSIO NIGHT DELUXE topper might be able to maintain and improve individual health and well-being.

For More Articles: Biomedical Journal Impact Factor: https://biomedres.us

Open Access Journals on Clinical Medicine

Autologous Expanded Mesenchymal Stem Cell Implantation for Orthopedics Conditions as a Non- Surgical Approach

Introduction

This article aims to address best practices in regenerative medicine using autologous expanded mesenchymal stem cells (MSCs) combined with platelet-rich plasma (PRP). We summarize our findings from various literature reviews and our experience using combined fat-derived expanded MSCs-PRP therapy in many hundreds of clients for osteoarthritis (OA) and tendinopathy, namely tendon tear(s). Generally, the doses we use in large areas ranging between 50-100 million MSCs in 2 MLS of fluid combined with 5-8 MLS of PRP in the same syringe depending on the size of the area(s), but in smaller joints, we modify the number of cells and PRP volume. We also found that concentrated MSCs without PRP is more effective for small joints of the hands and feet. The number of MSCs used in the expanded technique makes the therapy more effective than the low number used in the same-day procedure, i.e., the stromal vascular fraction (SVF); thus, expansion of MSCs is encouraged if the regulatory authority allows this practice. Additionally, we can adjust the volume accordingly by adding more PRP to the mixture to cover more expansive areas. There are three main questions to ask; what is the mechanism of action of this combined therapy? Does it work? And is it safe?
MSCs are multipotent cells with a regenerative effect via both direct and indirect effects. The explicit incorporation into injured and adjacent tissue (i.e., cellular engraftment), while the indirect pathway is related to un-engrafted MSCs producing paracrine signals cytokines that contribute to tissue regeneration by promoting growth and differentiation of local cells [1]. They have an anti-inflammatory effect, immune modulation, and anti-apoptosis (programmed cell death) effect. In addition, MSCs can self-renew and differentiate into various cells like chondrocytes, tenocytes, or other cells depending on where we implant them [2]. PRP works by the activation of the platelets by the release of their intracellular cytoplasmic granules. Those particles contain inflammatory and growth factors which could be responsible for the healing process. The common ones are Platelet-derived growth factor (PDGF), vascular endothelial growth factor (VEGF), transforming growth factor (TGF)-beta, fibroblast growth factor (FGF), and epidermal growth factor (EGF) [3]. Randomized and non-randomized clinical trials showed positive outcomes to the MSC therapy, particularly in knee OA [4]. In our practice, we found a success rate of an average of 70-80 %, with best results for the knee involvement followed by the hip and shoulder OA; the good results are more seen in appropriately selected candidates with osteoarthritis “non-boneon- bone pathology.”
We calculated success rate based on symptom control, quality of life improvement, slowing or stopping the radiologic progression, and eliminating the need for surgery at least in the first five years of its use. We might need to repeat the implantation in some cases. This therapy is favored over the surgery by speedy recovery, comfort in performing routine daily activities, quick return to work and sport. We noticed good effect does vary starting from two weeks post-therapy for up to a year to see the maximum benefit. The good news with this technique is that we can cryopreserve the MSCs in liquid nitrogen for up to fifteen years; this will allow us to repeat the implantation if needed or implicate it in other joints. While the degenerative process takes many years thus regeneration is also a slow process; therefore, we feel repeating imaging too early will not reveal the appropriate comparison. We have concluded MSC therapy stops or slows the progression of osteoarthritis and, on some occasions, recovers some of the cartilage thickness, but those are inconsistent findings and slow processes [4,5]. The main obstacle with cartilage regeneration is the lack of direct blood supply but instead takes it from the subchondral bone and nutrients from synovial fluid. Modified scaffolding techniques like exosomes and hyaluronic acid (HA) might potentiate the effect of stem cell therapy. Exosomes are micro-RNA particles that enhance cell-cell communication [6]. HA has viscous-supplementation physiologic and anti-inflammatory, anti-oxidative, and immune-regulatory pharmacologic positive effects in OA [7]. We believe any scaffold(s) with anabolic effect including PRP, HA, exosomes, and collagen would add substantial synergistic benefit to the MSC therapy.
In terms of tendons regeneration, we have found that the combined MSCs-PRP therapy is significantly effective in symptom control, substantially improves range of motion, and may eliminate the need for surgery [8-11]; in our practice, the success rate is 80-90% of the cases. The clinical benefit was noticed even when there was no clear radiological evidence of tendon healing. We have observed MRI healing of rotator cuff tears and Achilles’ tendinopathy, although the result was inconsistent. Some factors might affect the Efficacy of MSCs-PRP therapy, including local anaesthesia use inside the joint or tendon injected due to its toxicity to both MSCs and platelets. Alcohol and non-steroidal anti-inflammatory medicine before and after the stem cell implantation can reduce its Efficacy, while the use of turmeric/Boswellia as natural preparation help to reduce the inflammatory response post-implantations of the stem cells. The safety of autologous MSCs is well tested in several clinical trials; it has shown no evidence of rejection given both the blood and the cell-based therapies are derived from the same individual. There is no evidence of developing malignancies in autologous adult MSCs [12,13]. We avoid using MSCs-PRP in patients with active cancer or in remission with invasive cancer for at least five years from its onset to prevent overstimulation of the pre-existing cancer cells. Additionally, both PRP and MSCs have some antimicrobial activity [14,15]; thus, infection is infrequent, particularly we sterilize the expanded cells with both antibiotics and antifungal solutions. Also, we adapted single-use sterile PRP tubes.
In summary, we believe this is future medicine. However, more work and research are needed to advance and standardize the best protocol by choosing the correct number of MSCs used in each area and the PRP dose and centrifuge technique to ensure the maximum effective and safe doses.

For More Articles: Biomedical Journal Impact Factor: https://biomedres.us

Open access Journals on Medicine

Inflammation In HSC Emergence

Opinion

In our classical view, inflammation is triggered by environmental changes; may it be pathogens or tissue damage. The stimuli activate a complex transcriptional program that is both cell type and stimulus specific. At the cellular level, a complex gene expression programs that include hundreds of genes is activated within minutes after the initial activation through a stimulus [1]. But this response can vary not only between cell types [2], but even within a cell population depending on their niche environment [3]. In response to inflammatory stimuli, several response pathways can be initiated, including signal transducers and activators of transcription (STAT) [4], activator protein 1 (AP-1) [5], the nuclear factor of the κ light chain enhancer of B cells (NF-κB) [6], and interferon regulatory factors (IRFs) [7]. All these triggers have distinct binding specificities and have different receptor – ligand interaction that leads to a specific transcriptional output. For example, cytokines acting primarily through the activation of STAT TFs such as IFN-γ, are in general unable to activate NF-κB and AP- 1, which are broadly responsive to a large panel of inflammatory stimuli (stretching from LPS and other microbial products to tumor necrosis factor [TNF]-α) [8]. Inflammation in general, is therefore essential for survival in the adult. Specifically, the blood system responds with cell proliferation, HSC self-renewal and progenitor expansion and differentiation.

Hence, it is all the more striking that these pathways are essential for the HSC generation in the embryo, although the mammalian fetus is protected from pathogens by a robust innate immune system at the maternal/fetal interface [9]. During embryonic development, the first Transplantable HSCs are detected between E10.25-E11.5 in the aorta- gonad and mesophephros region (AGM) [10-12] as residents of Intra-aortic hematopoietic clusters (IAHC) that are closely associated with the ventral wall of the dorsal aorta [13-15]. Although to total number of hematopoietic (cKIT) positive cells in the AGM is believed to total around 600 cells, only a small fraction is HSCs [10,16]. In general, blood cells trans-differentiation of specialized endothelial-like cells that can generate blood, termed hemogenic endothelium (HE), to hematopoietic fate during early development. This process is called endothelial to hematopoietic transition (EHT) [17-24]. All the more, it´s remarkable that IL-1RI, that is a receptor for IL1 and leads to NF-κB and c-Jun N-terminal kinase (JNK) activation [25], is expressed by cells in the E11 aortic endothelial and mesenchymal cells, and at low levels in the IAHC [26].

Upon stimulation with IL1β, AGM explants show higher levels of CXCR4, a chemokine receptor that is specific for stromal cellderived factor-1(SDF-1) required for homing of hematopoietic cell to their niches. The importance of signaling through IL1R1 was further confirmed in transplantation settings; IL1R1 mutant AGM cells showed reduced HSC activity [26]. In fact, recent reports show a correlation of CXCR4 expression and HSC activity in the AGM [27]. In agreement with these findings, Tnf α and TnfR2 morphant zebrafish embryos have decreased expression of the hematopoietic markers runx1 and cmyb, and a NF κB reporter line confirms its activity within the ventral domain of the aorta [28]. Interestingly, the authors find aberrant notch signaling, eg decreased levels of Jag1a, which is required for IAHC formation [28,29]. In parallel, a study on Tlr4, MyD88 and NF κB, a core of inflammatory signaling axis leading to nuclear p65, came to comparable conclusions; they found decreased numbers of hematopoietic cells in the aorta of these morphants, and established a link to aberrant notch signaling in this study, the authors found a reduced induction of the notch downstream effectors Hey1/2 and her15.1 [30]. If this lower notch status is due to reduced Jag1a expression as suggested by Espin-Palazon et al. is not known. Interestingly, in the same study, the authors also investigated the HSC activity in the AGM of TLR4 deficient mouse embryos. TLR4 deficient hematopoietic cells in the AGM could generate CFU-C, albeit at a reduced number, but strikingly, almost all HSC activity was diminished in transplantation assays [30]. These studies highlight the high susceptibility of HSC to NF κB signaling, but the HSPCs, the more differentiated cells show a less substantial dependency. Nevertheless, it´s still unclear which target genes are activated by p65 mediated NFkB signaling in HSCs and HSPCs.

In an elegant study by Li et al. the authors subjected E10.5 embryos that express GFP under the Ly6a/Sca1 promoter, a marker of HSPCs, including HSCs, to different cytokines [31]. Here they found moderate increases in Sca1 expression after treatment with IL1β, IL6 and TnfA in the AGM region, but treatment the Inf α4 or Inf γ lead to a huge increase of Sca1 expression in the AGM, including the aorta. The increase in Ly6aGFP+ was due to both, higher expression of Sca1GFP, and enhanced proliferation [31]. In order to determine if there were HSPCs that can receive both Ifnγ and Tnfα simultaneously, combinatorial MO knockdown of Ifnα and Tnfγ was used in zebrafish embryos. Knockdown of both cytokines together caused a greater decrease in hematopoietic gene expression (runx1) in the dorsal aorta than the knockdown of either gene alone, indicating that multiple inflammatory cytokines can cooperate in the formation and expansion of embryonic HSPCs in the absence of pathological stimulation.

Interestingly, blood flow is needed for the expression of ifng1-2, as ifng1-2 was nearly absent from the axial vessels of tnnt2 (silent heart) morphants that don’t have a blood circulation [32]. The reason for this curious observation was not further clarified, but recent studies might provide a plausible explanation. Blood flow might be needed to enhance the sources of inflammatory cytokines to the dorsal aorta.

Detailed analysis of the cellular composition of the AGM microenvironment using mass cytometry (CyTOF) revealed the presence of yolk sac derived macrophages closely associated with IAHC [33]. Prior to HSPC generations in the AGM, the yolk sack produces HSC independent blood progenitors, including macrophages that express different receptors to interact with their niche cells, including Cx3cr1 and Csfr1 [34,35]. Time course analysis with a Csf1r:GFP transgenic mouse model that labels Yolk sac derived macrophages, the study elegantly demonstrates their arrival in the AGM from E9.5 and significantly increasing in abundance by E11.5, ie in time for the HSPC and HSC emergence [33]. Cx3cr1, a chemokine receptor was identified on the macrophages, whereas the possible interacting ligand, Cxcl12, was highly expressed by HE cells. Ablation of Cx3cr, or pharmacological of macrophages with BLZ945, an inhibitor of the colony stimulating factor 1 receptor (CSF1R) reduced CFU-C numbers and HSC activity in transplantation assays. The authors further identified a subpopulation of macrophages based on their cell surface expression of CD206 that specially upregulate cytokine expression of Tnf, Ccl24, Ccl9, Igf1, Bmp2, Pf4, Ccl2, and Ccl7, Whereas Ifnα, Ifnγ, and IL1β expression was observed in all AGM macrophages [33].

In summary, inflammatory signaling pathways are essential for hematopoiesis in the AGM in general, and most importantly, positively influence HSC activity. There is some evidence that some cells are susceptible to more than on the cytokine stimulus at a time [32]. In summary, during development, inflammatory signaling pathways are activated to establish cell identity. It will be important to study the impact of cytokines individually or combined in different cell populations in order to understand the gene expression changes that they inflict. Perhaps the multitude of single cell data sets on AGM cells can give us more clues. Here, we can readily distinguish between the blood cell types and profile their gene expression for inflammatory signaling members. In fact, several single cell data sets of AGM derived cells showed enrichment of inflammatory signaling pathway activation in HE and IAHC [36- 38]. Further, detailed analysis of these data sets can help to improve our understanding of these stimuli in HSC emergence and helps us to improve in vitro approaches to generate HSC by artificially fine tuning these cytokines in culture conditions.

For More Articles: Biomedical Journal Impact Factor: https://biomedres.us

Open Access Journals On Anesthesiology

Ultrasound-Guided Aspiration Therapy for Surgical Site Infection After Spinal Surgery: A Report of three Cases

Introduction

Surgical site infection (SSI) is a common and dreaded complication after posterior spinal surgery. Reported risk factors for infection include patient factors such as age, male sex, diabetes, obesity, smoking, malnutrition and being immunocompromised, as well as intraoperative factors such as long operation time, blood transfusions, open surgery, a greater number of levels operated on and employment of intraoperative equipment including microscopes or CT [1-3]. The infection following spinal instrumentation remains a challenging and controversial subject, as it is positively associated with prolonged hospitalization, increased healthcare costs and rate of reoperation, poorer longterm outcomes, and greater dissatisfaction with the initial surgery [4-7]. To treat SSI, surgical removal of internal fixation is sometimes required, although the loss of fixation can contribute to spinal instability [8-11]. CT-guided aspiration and drainage and drainage is a useful treatment that drains exudates, pus and necrotic tissue to reduce the chance of wound bacterial growth [12]. But these cases required multiple treatments that increased radiation and expenditure. Compared with CT, ultrasound imaging has its unique advantages: non-electromagnetic radiation, economical and convenient. Here, we report three cases of SSI of posterior spine surgery with aspiration under ultrasound guidance was successfully used to promote wound healing.

Case Reports

This study aimed to report the cases of three patients of infection after spinal surgery who underwent ultrasound-guided aspirating incisional effusion (Table 1). The cases we reported here all wrote informed consent for publication of anesthesia.

Case 1

History and Examination. A 79-year-old woman with several years of low-back pain that radiated to her feet was described. She had tried conservative management using pain medications or acupuncture but the pain continued. On examination she had hallux dorsiflexion muscle IV level. Superficial sensation was impaired over the lower legs and lateral dorsum of feet. Meanwhile she had a positive straight leg–raise test at 60°. An MRI study of her lumbar spine revealed L4–L5, L5–S1 para-central disc herniation. The patient also had a history of hypertension and diabetes that required chronic, long-term medication.
Operation: This woman underwent posterior spinal L4, L5, and S1 pedicle screw fixation. Her pain improved obviously and ended the treatment of vacuum sealing drainage (VSD) on the third postoperative day. The patient received 1 intravenous antibiotics (cefuroxime) 30 min preoperatively, and 5 additional doses during 5 days postoperatively, then ceftriaxone replaced. Fifteen days after the operation, the patient presented increased low-back pain. Laboratory tests: white blood cell count (WBC): 7.7 10^9/L (normal range 4-10 10^9/L), neutrophils% NE%: 51.2% (normal range 50-70%), hypersensitive C-reactive protein (HS-CRP): 41.58 mg/L (normal range 0-3 mg/L), erythrocyte sedimentation rate (ESR): 103 mm/h (normal range 0-15% mm/h) (Figure 1). Three days after vancomycin treatment, the pain was unremitting and the HS-CRP and ESR were still higher then normal. Procedure under ultrasound guidance. The patient was placed in a right lateral position and a low-frequency linear ultrasound transducer was placed in a longitudinal orientation lateral to the L4-S1 spinous process. Incisional effusion was identified. A tuohy needle was used to tap 15 ml of dark brown fluid. Post-procedural Course. This woman was treated vancomycin 4 days after the procedure, and experienced immediate improvement in her low-back pain. Fifteen days later, she was discharged home.

biomedres-openaccess-journal-bjstr

Figure 1: The trend chart of laboratory tests which were related to infections of the first case during perioperative period.

Case 2

History and Examination. A 49-year-old man was referred to the hospital with a 2-year history of low-back pain and a 4-month history of lower limb weakness. An MRI study founded that he had the thickening of ligamentum flavum (TLF) in the L4-L5 and thoracic spinal cord compression.
Operation: This patient was performed posterior spinal L4- L5 total laminectomy and pedicle screw fixation. Six days after the operation, he had tenderness to palpation and drainage at the surgical site. Laboratory tests: WBC: 16.5 10^9/L, NE%: 82.7%, HSCRP: 5.18 mg/L, ESR: 13 mm/h (Figure 2). First procedure under ultrasound guidance. Similar to the procedure in the first patient, 80 ml of pink fluid was tapped from superficial plane to the erector spine muscle (ESM) under the ultrasound guided. After 10min, the patient reported that his pain had diminished significantly. Second procedure under ultrasound guidance. His pain aggravated gradually in a week. Laboratory tests showed that WBC and NE%have dropped off, but HS-CRP and ESR have gone up. A large amount of effusion in the surgery site was confirmed again by ultrasound. We drained 100 ml of pink fluid this time. The antibiotic changed from ceftriaxone to vancomycin. Third procedure under ultrasound guidance. Four days later, this man told that his pain had alleviated. The visualized effusion decreased and only 40 ml of pink fluid was tapped. Post-procedural Course. Eighteen days after the third procedure there was no sign of infection, and the pain was resolved. Then the man was discharged home.

biomedres-openaccess-journal-bjstr

Figure 2: The trend chart of laboratory tests which were related to infections of the second case during perioperative period.

Case 3

History and Operation. A 72-year-old man, complained of severe low-back pain that radiated to his right feet. He was performed posterior spinal L4–L5 total laminectomy and pedicle screw fixation. A week after the operation, he was racked by high fever (40.1℃), chills and pain at the surgical site. Laboratory tests: WBC: 3.5 10^9/L, NE%: 79.7%, HS-CRP: 112.63 mg/L, ESR: 97 mm/h, PCT: 27.88 ng/ml (Figure 3). During the four days, although sulperazone and amikacin was used, the infection had maintained. First procedure under ultrasound guidance. Similar to the above-mentioned procedure, ultrasound was used to guide access to the area lateral to the lumbar spinous process and 30 ml of pink fluid was drained (Figure 4). Second procedure under ultrasound guidance. His temperature decreased to normal, but the pain continued. Laboratory tests: WBC: 7.2 10^9/L, NE%: 70.3%, HS-CRP: 50.97 mg/L, ESR: 45 mm/h, PCT: 2.03 ng/ml (Figure 3). Ultrasonography study was used to determined the effusion, and 30 ml of dark brown fluid was drained (Figure 5). Post-procedural Course. The day after the procedure, the patient experienced immediate improvement in his pain. He was discharged home 7 days after the second aspiration and at his follow- up evaluation nearly 1 month later had continued resolution of his symptoms (Figure 6).

biomedres-openaccess-journal-bjstr

Figure 3: The trend chart of laboratory tests which were related to infections of the third case during perioperative period.

biomedres-openaccess-journal-bjstr

Figure 4: Ultrasound image of aspiration in the level of L4-L5. Arrowheads indicate the tip of needle. ESM: erector spine muscle.

biomedres-openaccess-journal-bjstr

Figure 5: Dark brown fluid was drained under ultrasound guidance.

biomedres-openaccess-journal-bjstr

Figure 6: MRI studies.
A. Preoperative MIR graph of the patient’s spine showing L4-L5 intervertebral disc bulges around and the compression of dura mater.
B. Image at the level of L4–L5 showing that a signal of mixed before the first procedure.
C. Before the second procedure graph showing the area of signal mixed changed large.
D. Image of the patient’s follow-up evaluation nearly 1 month after the discharge showing that the mixed signal area had disappeared.

Discussion

Spinal operation is commonly used in the therapy for spinal disease. Post-operative surgical site infection is a dreadful complication with reported rates ranging from 0.7–20% [1-5]. At present, there are many modalities being used for therapy including antibiotic, vacuum sealing drainage (VSD), instrumentation removal, debridement and continuous irrigation and suction [11- 14]. There remains no consensus on indications for maintenance of the stabilization devices versus removal. These devices are often removed to facilitate infection control for the bacteria associated with these infections form biofilms attached to the internal fixator. However, reoperation means higher costs, more pain and longer hospital stay. Studies showed that significant loss of correction in deformity patients after instrumentation removal, even if stable fusion was observed. In our report described here, after undergoing posterior spinal surgery three patients developed SSI. By aspirating incisional effusion with ultrasound-guidance and retaining stabilization devices, their symptoms, the risk of spinal instability and neurological risks decreased, resulting in increased quality of life.
It is widely agreed that deep infection should be managed with aspiration drains pus, and necrotic tissues that can hinder the antiinfective function of para-spinal muscle and granulation tissues. Vacuum sealing drainage (VSD) is a negative-pressure technique, which can achieve safe and rapid healing of soft wounds and infections. However, these patients [13,14] required wound opening during the VSD treatment and a second surgery to close the wound, which increased patient discomfort and the expense, limited patient activity, and required advanced medical facilities. Comparing to VSD, ultrasound-guided aspiration has more advantage including small trauma, less pain, economical and convenient. In our institution we operated 1258 patients of degenerative disc diseases from June 2015–February 2018. There were 1040 patients of posterior spinal surgery. Of these 1040 discs, 115 cases (1.1%) suffered the surgical site infection. Some cases with less severe infection and few effusion could be treated with several weeks of antibiotics. Ultrasound-guided aspirating incisional effusion was performed in those patients whose infection has progressed on MRI despite appropriate antibiotic therapy. Twenty cases undergone this procedure, which all of them have received satisfactory effect. For other cases with severe infection including suppurative spondylitis and septicaemia, aspiration alone cannot completely eliminate bacteria and suggests that surgery was an effective option. For these cases, ultrasound-guided aspiration could help to identify the effusion and correctly choose and use antibiotics.

Conclusion

Based on our small experience with postoperative surgical site infection after spine surgery, we recommended an ultrasonography study to determine the effusion, to determine the infection, to determine causative organisms, to choose correct antibiotic and to aspirate effusion.

For More Articles: Biomedical Journal Impact Factor: https://biomedres.us

Open Access Journals On Medicine and Pharmaceutical Sciences

Times for Peaks of Stress in Quadriceps Muscles During the Force-Velocity Test

Introduction

Among the intermittent tests with increasing loads, there is the Force-Velocity test (FVt) which consists of successive sprints of few seconds separated by recovery periods of a few minutes on an ergo cycle as Monark ergo cycle [1] against increasing braking loads. These authors found the increases of the mechanical power with the increase in the braking loads up to a maximal Power Output (POmax) despite the decrease in the pedaling speed, then its decrease despite the increase in the braking loads. The evolution in surface Electromyogram (EMG) power spectral and the Power Output (PO) concomitant with the increased in braking loads during the FVt were reported [2]. They showed an increase in EMG from the start of FVt to the peak load (Lpic), and then its decrease at the Lpic +1 kg. Thus, during the FVt, the muscle fatigue started after Lpic. Rouffet & Hautier (2008) found the root-mean-square (RMS) of EMG of Vastus Lateralis (VL) and Rectus Femoris (RF) muscles during the Isometric Maximal Voluntary Contractions (IMVC) and torque–velocity bicycling tests (T-V) increased from zero to approximately before 4 seconds during T-V and after 5 seconds during IMVC. Their results agreed those of Vandewalle (1987) who suggested the participants to reach the peak of pedaling speed before the end of the sprint (6 seconds). Due to these variations of the time to reach the maximum peak of EMG during intense exercise [3], the other question was to localize the time of muscle fatigue during each sprint of the FVt. For that, the aim of this study was to examine the EMG evolution of RF, VL, and VM of the quadriceps superficial muscles during the FVt to localize the peak of each EMG signal during the six seconds of each sprint.

Methods

Study Design

The approach was to determine the time to attack the peak of the EMG signal during each sprint of the FVt and, to examine if this time depends to the load and to the muscle. So, EMG signal were collected during each sprint in three quadriceps superficial muscles. In order to have good results during the FVt, only athletes suitable for intense and repetitive exercises such as soccer players were selected during maximum exercise tests.

Participants

Eighteen soccer players (age, 25 ± 4 years; height, 181 ± 3 cm, and weight, 77 ± 7 kg) participated in two tests each: a maximum test to determine their physical fitness and a FVt to examine the evolution of RMS and PMF for EMG in RF, VL, and VM at each sprint. Each participant was informed to refrain from doing intense exercise at least two days before the maximal exercise test or FVt. Both tests were performed at ~20°C between 3 and 6 p.m. in a laboratory. All participants were informed of the experimental procedures complying with the ethical standards of Helsinki Declaration as revised in 1989, before giving written their consent to the adhesion of the study.

Procedure

The maximal exercise test allowed the assessment of the maximal heart rate (HRmax), maximal power output (POmax), and maximal oxygen uptake (VO2max). The protocol consisted of 2 min cycling against a workload of 1 kg at 60 rev·min–1 on the ergometer (824 Monark-Crescent, AB, Varberg, Sweden) as a warm-up, then the load was increased every 1 min until volitional exhaustion by 0.5 kg. The following criteria:
a) Inability of the participants to maintain the frequency at 60 rev·min-1 in spite of verbal encouragement,
b) Attainment of age-predicted HRmax, and
c) Respiratory exchange ratio greater than 1.10 were used to well achieve maximum performance. The results allowed selecting participants having physical capacity to complete a test in spite of the increase the intensity as the FVt.
HR monitor (Polar Accurex Plus, Polar Electro, Kemple, Finland) was used for continuously record. An open circuit technique with the CPX system (Medical Graphics Corporation, St. Paul, Minn., USA.) permitted the measures of the oxygen consumption. Each participant completed the FVt at least three days after the maximal exercise test on the 824 Monark-Crescent. The FVt consisted of performing a maximal sprint against each load in a sitting position for 6 seconds, the maximal time for a participant to attain his maximal velocity after the starting signal. The accuracy of the frequency measurement was ± 3.3 ms. The feet were fixed to the pedals with the toe clips. Each participant started the first sprint of FVt against a load of 2 kg and then recovered for 5 min before repeating the 2nd sprint against the load increased by 2 kg. When the velocity was under 130 rev·min-1, the load was increased by only 1 kg for each sprint to attain more precise the peak load (Lpic) for the peak power output (POpic). We assumed that the participant attained the POpic if an additional + 1 kg (Lpic + 1kg) to the Lpic induced a PO decrease. An automatic system was used to determine the peak velocity (Vpic) for each load and to calculate the PO as the product of load and Vpic (F×Vpic).
Surface EMG evolution of VM, RF, and VL were examined during the FVt for each participant. The EMG signals were collected by Beckman bipolar surface electrodes (9 mm diameter, physiosystems, Noisy-le-Grand), spaced by 20 mm distance, placed over the centre of the belly of each muscle of the right leg of each participant. The ground electrode was placed at the right wrist. EMG signals were conditioned and stored on magnetic tape (TEAC R-71, TEAC Corp., Tokyo, Japan), after differential amplification with bandwidth ranging from 2 Hz to 2 kHz along with the output signal from the dynamometer. EMG signals were sampled by a spectrum analyser (model 3582A, Hewlett-Packard, Les Ulis) at 1024 Hz. Power Spectral Density (PSD) of surface EMG was calculated from 0.5-s time intervals and was defined by 256 points in amplitude and phase in the 2−514 Hz bandwidth. Each PSD was then computed and divided into 10 bands, the bandwidth being 24 Hz, except for the highest band (56 Hz). EMG signals were analysed using acquisition and spectrum analyzer software (Spatol, Divergent, Compiègne, France) and a data-computing software (Calvise, Divergent, Compiègne, France). Calvise software permitted the transformation of PSD into four parameters, among which were the RMS and the mean power frequency (MPF) [4]. For each participant, the RMS and the MPF were determined for RF, VL, and VM at each sprint in real-time during 6 seconds by the computer.
HR was collected continuously with the same monitor using during the maximal exercise test. The mean value of five rest minutes and the higher values after each sprint were conserved for analysis. For each participant, his blood was collected using microcapillary tubes at rest (r0) and at three minutes after each sprint by micro puncture at the fingertips, then the lactate (La) concentration was analyzed at the end of the FVt using a Mini photometer Plus LP 20 (Monitor-8, Anglet-France). The skin temperature (sT) was measured at many periods: r0, three minutes after each sprint. The single probe thermometer TH-5 (Physitemp Instruments, Inc., Clifton, NJ, USA) was applied to the RF to measure the sT. Three successive measures of the sT were realised at each period and the largest value was retained. For each sprint, the sT of RF was considered as the quadriceps muscle sT for each participant.

Statistical Analyses

StatView software (Abacus Concepts, Berkeley, California, USA) was used for all analysis and the results were presented as mean ± standard deviation for POmax, HRmaxth, HRmax, VO2max, and sT during maximal exercise test, then for PO, HR, La, and sT at each braking load during the FVt. Anova one-way analysis of variance with repeated measures was used to illustrate the kinetics of absolutes RMS and MPF data in arbitrary unit (a.u.) obtained at each second during the 6 seconds of each sprint. Then, RMS and MPF were illustrated in curve for each sprint for all participants in real time. The curves of RF, VL, and VM were then compared to determine the degree of the participation of each quadriceps superficial muscles during the FVt.

Results

The mean theoretical maximum heart rate (HRmaxth) was 194 ± 3 bpm. The Maximal aerobic power (POmax = 265±33 w), maximal oxygen uptake (VO2max = 45.8 ± 2.3 mL/min/kg), and maximal heart rate (HRmax = 181 ± 6 bpm), respiratory ratio (1.14 ± 0.02), and skin temperature (sT = 34.6 ± 0.6 °C) were obtained during the maximal incremental exercise test. Table 1 showed the Heart Rate (HR), lactate (La), skin Temperature (sT), and Power Output (PO). The values of the four parameters increased simultaneously with the increase of the load. The peak of sT were attained with the attack of the peak of PO (POpic) at the peak load (Lpic = 8.7 kg). The values of sT decreased at Lpic+1kg like that of the PO. In contrast, after the Lpic, the value of the HR and that of La continued to increase despite the decrease of the PO at the Lpic + 1 kg (9.7 kg). During the FVt, the RMS and PMF increased with the increase of load until Lpic and decreased with Lpic+1kg (Figure 1). At each sprint of the FVt, the curves of RMS and MPF of RF, VL, and VM increased quickly from zero about 4th second, then remained stable or decreased until 6th second. The RMS curves of RF and VL evolved similar from the start to the end of each sprint and were larger than those of VM. In contract, the MPF curves of RF and VL evolved similar from the start to the end of each sprint and were lower than those of VM.

biomedres-openaccess-journal-bjstr

Table 1: Physiological responses during Force velocity test.

Note: HR: Heart Rate, La: Lactate, sT: skin Temperature, and PO: Power Output

biomedres-openaccess-journal-bjstr

Figure 1. Quadriceps suvitroperficial muscles RMS and MPF evolution at each sprint during the FVt.

Note: RA: rectus femoris, VL: vastus lateralis, VM: vastus medialis, RMS: root-mean-square, and MPF: mean power frequency.

Discussion

The main result of this study was a rapid increase of EMG signals of the three superficial muscles of the quadriceps from the start of each sprint until 4-5 seconds, then a tendency to form a plateau or a decline until the end of the 6th second. This increase of EMG signals could inform on the muscle activity illustrated by RMS which was greater for the RF and VL muscles than for the VM muscle at all sprints. On the other hand, these increases in the activities of the three muscles became more significant with the increase in loads until the peak power reached at the load peak (Lpic). Then a slight drop in the activities of the three muscles was observed with Lpic + 1kg. Muscle fatigue was illustrated by smaller increases in the MFP of RF and VL muscles compared to that of VM whose intervention in FVt was late regardless of the braking load. The participants of this study had anthropometric characteristics similar to those of league (1 and 2) or national soccer players [4-6]. The average age of the participants in this study was similar to that of European soccer players (25 years) and lower than that of 2018 World Cup soccer players (27.4 years). As for the anthropometric parameters, the participants of this study had an average size and an average weight similar to those of the 2018 World Cup soccer players (181.7 cm and 77 kg). The physiological conditions (POmax, HRmaxth, VO2max, and HRmax) of the participants of this study recalled their level of physical activity as sedentary. The participants in the present study had a lower HRmax than their own HRmaxth. Their POmax and VO2max were lower than those of professional and even amateur soccer players [6-9]. This study just needed adult’s participants able to participate in a rough test on an ergocycle (the forcevelocity test) to avoid as much as possible, cases of accident [10] linked to poor physical condition during this kind of exercise. The increase in PO from 363 ± 25 to 979 ± 99 w (POpic), then its fall to 926 + 90 w on average had shown a change in the gallows of this physical parameter (POpic) of the FVt test. Similar evolutions of HR and EMG signals concomitant with that of PO have shown a close relationship between physical and physiological parameters during FVt [11-14]. The POpic obtained by sedentary participants in this study was considerable if we compare it to those reported by Vadewalle (1987). These authors had obtained 1221 ± 192 w in 26 ± 6 year old rugby attackers, 1021 ± 152 w in 26 ± 3 year old soccer players and 813 ± 137 w in 29 ± 5 year old recreational players. The successive evolutions of HR, lactate and sT associated with those of PO could also be considered. However, if the HR and the La had evolved in the form of a gallop from 2kg to Lpic+1kg with the PO, the sT had increased until the end of FVt. It had gone from 31.4 + 1.3 at the rest to 34.1 + 0.8 ° C at the end of FVt. These results showed that the sT evolved in a linear fashion with the increase in braking force during this kind of exercise and not as a function of mechanical power like HR or lactate. At all sprints, the evolution of the RMS and MPF of RF, VL or and VM during pedaling presented in Figure 1 showed the level of participation of these three superficial quadriceps muscle. The EMG signals of these muscles were previously illustrated. The significant increase in RMS for RF and VL compared to that of VM showed a strong participation of RF and VL compared to that of VM during each sprint. The decrease in RMS of RF, VL and VM after 4-5 seconds during each sprint could illustrate muscle fatigue. This suggests that a muscle gets fatigue just after a few seconds (4-5 seconds) when it is used at a very high speed regardless of resistance. This muscular fatigue was well illustrated with the presentation of the MPF of RF, VL and VM. Fatigue was much greater for RF and VL than for VM. The MPF of VM was higher above those of RF and VL for all sprints. This result agreed that of Camata (2011). These authors found the RF more stressed earlier and tired more quickly than VL and VM. However, the increase in RMS of RF, VL and VM with that of load from 2 kg to Lpic despite the decrease of speed could show the dominant effect of force on speed during cycling. Also, the significant increase in the MPF (illustrating the fatigue level) of RF and VL compared to that of VM with the increase in the load could show more the influence of the force on the speed during the FVt. These simultaneous increases in RMS, MPF, HR, and La with that in PO agreed with the study of Temfemo (2011).

Acknowledgement

The authors thank all the participants and the members of the Physiology and Medicine of Physical Activity and Sports (UPM-APS) of the University of Douala for their collaboration.

For More Articles: Biomedical Journal Impact Factor: https://biomedres.us

Open Access Journals On Medical Science

Clinical and Laboratory Features of Primary Sjögren’s Syndrome Complicated with Mild to Severe Thrombocytopenia

Introduction

Sjögren’s syndrome (SS; also known as Sicca syndrome) is a chronic systemic autoimmune disease characterized by xerophthalmia (dry eyes) and/or xerostomia (dry mouth). In addition to the impaired function of exocrine glands, other organs may be also involved, such as the skin, joints, lungs, liver, kidneys, and hematological system. Hematological system involvement is common in SS patients, and a third of patients with SS have cytopenias such as leukopenia, anemia, and thrombocytopenia [1]. In primary SS (pSS), one of the most common complications of the hematological system is leukopenia, while a few cases were complicated with autoimmune hemolytic anemia and thrombocytopenia [2]. A study analyzed 99 pSS patients and reported that 61 (61.5 %) developed lymphopenia and leukopenia and 7 (7.1%) had thrombocytopenia [3]. Although thrombocytopenia is not common in pSS patients [4], severe thrombocytopenia can increase the occurrence of adverse events, which are sometimes fatal. Some patients were misdiagnosed because they lack the typical signs in their eyes and mouths [5].
Thus, in 2015, the European League Against Rheumatism (EULAR) has promoted and supported an international collaborative study group (EULAR-SS Task Force) aimed at developing consensual recommendations to provide a homogeneous approach to pSS patients presenting with systemic involvement. The guideline mentioned that patients with thrombocytopenia accompanied with positive Ro/SS-A and/or La/SS-B autoantibodies have possible diagnosis of SS [6]. Because of its low prevalence, large-sample controlled studies on thrombocytopenia in pSS are scarce. Thus, in this study, we aimed to investigate the clinical and laboratory characteristics of pSS complicated with mild to severe thrombocytopenia and compared them with those of pSS patients without thrombocytopenia.

Methods

Design

In this medical records review study, we identified 841pSS patients hospitalized in the Department of Rheumatology of the First Affiliated Hospital of Soochow University between March 2007 and March 2018. Of these pSS patients, 43 developed mild to severe thrombocytopenia (thrombocytopenia group), and 45 patients who did not developed thrombocytopenia were included in the analysis as the control group. The age and sex of the control group were matched to those of the thrombocytopenia group. Patients’ demographic data, clinical manifestations, laboratory examinations, and other results were analyzed retrospectively.

Patients

PSS diagnosis was confirmed either by pathological or clinical method based on the 2002 American College of Rheumatology Classification Criteria [7]. Patients with other diseases such as chronic hepatitis C, human immunodeficiency virus infection, previous lymphoproliferative processes, or other autoimmune diseases were excluded. The study was approved by the Institutional Ethics Board of Medical College, Soochow University (No. 2018- 012).

Clinical Features

The clinical characteristics of pSS are as follows: fever, axillary temperature >37.5℃; Raynaud phenomenon, cool skin and cutaneous color changes of the fingers and toes exposed to cold and/or stress; articular feature, arthralgia or non-erosive arthritis involving two or more peripheral joints; pulmonary complications, chronic and persistent cough, dyspnea, or both, with alveolitis or fibrosis in computed tomography (CT) scans; nephropathy, permanent proteinuria (>0.5 g/day), continuously increasing serum creatinine level (>111 μmol/L), renal tubular acidosis, or glomerular nephritis; liver damage, altered plasma liver function (aminotransferase, alkaline phosphatase, gamma glutamyl transferase, and bilirubin) and/or altered bile ducts in ultrasonography, CT, or magnetic resonance imaging; hemorrhagic manifestations, skin bleeding (skin purpura or bruises), oral bleeding (oral blood blister or gingival bleeding), nasal hemorrhage, gastrointestinal bleeding (visible bleeding or fecal occult blood), urinary bleeding (urinating blood or microscopic hematuria), vaginal bleeding (massive bleeding or prolonged menstrual period), conjunctival bleeding, and intracerebral hemorrhage. Bleeding seriousness was assessed using the immune thrombocytopenic purpura (ITP) bleeding scoring system [8].

Laboratory Features

The laboratory features were as follows: mild to severe thrombocytopenia manifested by platelet count <50×109/L, leukopenia as leucocyte count <4.0×10⁹/L, anemia as hemoglobin <120 g/L, and hypocomplementemia with complement C3 <0.79 g/L and/or complement C4 <0.16 g/L. Rheumatoid factor (RF) (latex test positive at a value >20 IU/mL) was analyzed by enzymelinked immunosorbent assay. Antinuclear antibodies (ANAs; positive at a titer 1:100 by indirect immunofluorescence) and 60- kDa and 52-kDa forms of anti-Ro/SSA and anti-La/SSB antibodies were tested independently.

Statistical Analysis

SPSS software version 21.0 (IBM Corp., Armonk, NY, USA) was used for statistical analysis. Continuous variables were compared using the Wilcoxon test, and proportions were analyzed using chisquare and Fisher’s exact test. A value of p<0.05 indicated statistical significance.

Results

Patient Characteristics

In this study, the total incidence rate of mild to severe thrombocytopenia in pSS patients was 5.1%. Among 43 patients with mild to severe thrombocytopenia, only 3 (6.9%) were men. pSS patients with mild to severe thrombocytopenia were 17–70 years old, with a mean age of 51.69±12.43 years, while control patients were 41.46 ± 14.89 years old. The median disease duration in the thrombocytopenia group was 18 months versus 44 months in the control group (Table 1).

biomedres-openaccess-journal-bjstr

Table 1: Characteristics of pSS patients with or without mild to severe thrombocytopenia.

Note: *p<0.05; **p<0.01

Clinical Features in pSS Patients with Mild to Severe Thrombocytopenia

Table 2 presents the clinical features of the patients in the thrombocytopenia group. The classic manifestations of SS, such as dryness of the mouth and eyes, rampant caries, and other clinical features like fatigue, fever, and weight loss were observed. The incidence rates of xerostomia and xerophthalmia were significantly lower in the thrombocytopenia group than in the control group (P = .0028, and P = .0024, respectively). Of the 43 patients in the thrombocytopenia group, 17 sought admission because of thrombocytopenia and/or hemorrhagic manifestations, without exocrine gland features. While pulmonary interstitial disorders were more common in the control group (P = .0088). The frequency of fever, rashes, arthritis, and Raynaud phenomenon did not show statistically significant difference between the two groups. As expected, the thrombocytopenia group had significantly higher EULAR Sjögren’s syndrome disease activity index than the control group (ESSDAI scores) (P < .001).

biomedres-openaccess-journal-bjstr

Table 2: Clinical features in pSS patients with or without mild to severe thrombocytopenia.

Note: *p<0.05; **p<0.01

Difference in Serologic Features

Not surprisingly, the platelet count in the thrombocytopenia group was significantly lower than that in the control group (P < .001). The thrombocytopenia group had significant hypocomplementemia (C4 level) than the control group (P = .0024). However, the existence of ANA, anti-SSA 60-kDa and 52- kDa, anti-SSB, M2, anti-dsDNA, and anticentromere antibodies (ACAs) was not obviously different between the two groups (Table 3). Levels of erythrocyte sedimentation rate, C-reactive protein, and RF were not markedly different between the two groups. The levels of immunoglobulin A (IgA) were significantly lower in the thrombocytopenia group than in the control group (P = .0019); however, no difference was found in the levels of IgG and IgM between the two groups. Among the regular chemical parameters, the level of glutamic-pyruvic transaminase (alanine transaminase) were significantly increased in the thrombocytopenia group (P = .043) (Table 4).

biomedres-openaccess-journal-bjstr

Table 3: Serologic features in pSS patients with or without mild to severe thrombocytopenia.

Note: *p<0.05; **p<0.01

biomedres-openaccess-journal-bjstr

Table 4: Serologic features in pSS patients with or without mild to severe thrombocytopenia.

Note: *p<0.05; **p<0.01

Disease and Prognosis in pSS Patients with Mild to Severe Thrombocytopenia

In the thrombocytopenia group, the most common hemorrhagic manifestations were skin bleeding, such as purpura/bruises (21 of 43, 48.8%), and gingival bleeding (17 of 43, 39.5%). There were no hemorrhagic manifestations in 14 of 43 patients (32.6%) (Table 4). At baseline, the ITP bleeding score was 1.32±1.17, and no correlation was found between hemorrhagic manifestations and treatment effect (Table 5). No patient died during the study period. Mild to severe thrombocytopenia was treated with highdose corticosteroids and/or intravenous gamma-immunoglobulin, and hydroxychloroquine and cyclosporine were also used. During hospitalization, among 43 patients, 35 were responsive and 8 were not responsive to the treatment. One patient had undergone splenectomy because of refractory thrombocytopenia.

biomedres-openaccess-journal-bjstr

Table 5: Characteristics of pSS patients with mild to severe thrombocytopenia.

Discussion

To the best of our knowledge, this is the first study to show a negative relation between mild to severe thrombocytopenia and lung involvement in pSS. pSS is one of the major chronic inflammatory autoimmune diseases associated with B lymphocyte hyper-reactivity. Recently, the reported prevalence of pSS ranges from 0.05% to 0.23% [9,10], and in China, it is approximately 0.33% to 0.77% [11]. Although most patients have exocrine gland involvement, such as labial gland and lacrimal gland involvement [12], their clinical manifestation is usually quite nonspecific and varied, resulting in the delay in the diagnosis for 3-8 years from the onset of first symptoms [13,14]. In our study, all 88 patients had pathological examination of lower lip biopsy. Among pSS patients with mild to severe thrombocytopenia, 4 had no lymphocytic foci, but in pSS patients without thrombocytopenia, 1 had no lymphocytic foci. Thrombocytopenia is not common in pSS patients. In our study, 5.1% of the pSS patients developed mild to severe thrombocytopenia; among them, 95.3% were female.
Moreover, our participants were inpatients, making our cohort similar to those in other studies. Studies reported that 5%-16% of pSS patients developed thrombocytopenia [15,11,16]. Although there was no real distinction in the median time for diagnosis confirmation between patients with or without mild to severe thrombocytopenia, pSS patients with mild to severe thrombocytopenia obviously had higher ESSDAI scores than those without, and they needed longer hospitalization. Leukopenia is the most frequent hematologic abnormality noted in pSS, and 30%-40% of pSS patients may have leukopenia [2]. In our study, 29.5% of the patients have leukopenia, but among patients with mild to severe thrombocytopenia, the prevalence of leukopenia was significantly lower than in those without thrombocytopenia. All patients responded remarkably well to corticosteroids. Antineutrophil antibody may be responsible for autoimmune neutropenia [17], but the low frequency of neutropenia in pSS patients with mild to severe thrombocytopenia was not reported in previous studies; thus, further research is required. In our study, decreased levels of C4 and IgA were more common in the thrombocytopenia group, indicating the possible important complex immune mechanism in the pathogenesis of thrombocytopenia in pSS patients.
A large proportion of patients in both groups were positive for ANA. The prevalence of all autoantibodies such as anti-SSA and anti-SSB, AIM-M2, CENPB, ACA, anti-dsDNA, and U1RNP showed no remarkable difference between the two groups. For some antibodies, the absence of a significant difference may have resulted from a relatively small sample size. There was lung involvement in 10%-20% of pSS patients [18]. Among 88 patients, 21.6% had lung involvement, which fairly accorded with the results in previous studies [19]. However, in pSS patients with mild to severe thrombocytopenia, the incidence of lung involvement reduced markedly in our study. Platelet-derived growth factor was reported to contribute directly to the migration of fibrocytes to the injured lungs [20]. Current understanding of the pathophysiology of lung disease in pSS suggests a similar process as those in the salivary glands, with epithelial cells playing a critical role in the initiation [19]. It can be assumed that pSS with lung involvement and pSS with hematological involvement have different pathological and clinical manifestations. However, this study has limitations that hindered the generalization of the results: small sample size, retrospective design, single-center setting, etc. More research is needed on the relationship between thrombocytopenia and lung involvement in pSS.

Conclusion

our study explored the clinical features of pSS accompanied with mild to severe thrombocytopenia. pSS patients with mild to severe thrombocytopenia could have higher ESSDAI scores than those without thrombocytopenia, but the incidence of some complications such as leukopenia and lung involvement was low. In pSS patients with mild to severe thrombocytopenia, the incidence of xerostomia, xerophthalmia, and lung involvement reduced markedly. Thrombocytopenia could be present upon the onset of pSS development, without any involvement of the exocrine glands. Thus, there is an urgent need for more detailed classification of pSS based on its clinical manifestations and pathology. Knowledge on the features of pSS associated with thrombocytopenia will help in early and better diagnosis and treatment.

Acknowledgement

We would like to thank Editage (www.editage.cn) for English language editing.

For More Articles: Biomedical Journal Impact Factor: https://biomedres.us