Open Access Journals On Internal Medicine

Telemedicine and Metabolic Diseases in Practice – Weight Predictor Localized for the Czech Population

Telemedicine has been gaining in importance recently. The term telemedicine is derived from two Greek words – tele (“distance”) and medicine (meden = treatment “). According to the European Commission, it is defined as:” Rapid access to shared and remote medical expertise through telecommunications and information technology, regardless of where the patient or relevant information is located. Sometimes the term “telehealth” is used instead of telemedicine [1]. The history of modern telemedicine dates back to the invention of the traditional telephone in the 19th century. At that time, physicians could give information and medical advice by phone. In simple terms, telemedicine can be defined as a supportive medical service using telecommunication technologies [2]. The concept of telemedicine has become established in medical terminology at the instigation of the WHO (World Heat Organization). Another term used for telemedicine is “distance medicine”. However, there are differences in definition within individual fields of telemedicine. The view of individual specializations in telemedicine is inconsistent and may vary. In general, however, the goals of telemedicine can be characterized as follows: to speed up and improve communication between doctors, between doctor and patient, to use modern communication tools and effective information transfer, to improve overall patient care and to improve diagnostic and therapeutic processes [1]. Telemedicine is defined by the WHO as a general term for health activities, services and systems operated remotely through information and communication technologies to promote global health, prevention and health care, as well as education, health care and medical research. The general definition of telemedicine is the provision of medical services at a distance, and this term covers a wide range of different applications. There are two basic areas. First, applications that allow real-time monitoring of the patient, eg. in the form of video calls, online transmission of heart rate data, etc. Second, applications that work asynchronously, eg. by storing physiological data (weight, blood pressure, blood glucose, heart rate records from exercise units, etc.) from home monitoring and their subsequent transfer to the database in the medical facility or reconditioning center [3].

The main goal of telemedicine is to provide medical services remotely. Reducing the need for clinical visits is one of the many benefits that telemedicine brings to patients and offers them obvious convenience. Thanks to the use of IT technologies, the patient can receive basic medical care at home. By evaluating the level of medical support provided over the last two to three decades, IT technologies have undoubtedly provided huge benefits to the general public. More powerful, faster computers, and more efficient use of features have allowed more types of services to be extended to more users. For example, several decades ago, a simple request for medical help could only be obtained by searching for a landline at the clinic where the doctor was present. Thanks to the availability of “Voice over Internet Protocol” (VoIP) mobile technology, you can easily pick up your mobile phone and make a video call with your doctor, ie. the doctor providing the consultation does not necessarily have to be present at the clinic. This is just one of many examples where advances in IT technology have contributed to more affordable healthcare [2]. Thanks to the rapid development of technology, telemedicine is currently gaining more and more space and use across medical specializations. In addition, it enables the so-called remote monitoring of the patient, or the data collection from the patient and their subsequent control with professional recommendations with regard to the patient’s goals. It is potentially widely used, for example, in diabetology, where it uses subcutaneous sensors in patients with DM, which read the patient’s blood glucose level, store data and send it to the physician via a mobile phone connected to the sensor. The physician can evaluate the data and provide feedback to the patient.

The use of telemedicine has common elements in various medical fields. Remote clinical care helps remove barriers and improves access to health services. It is therefore a benefit in urgent and intensive care as well as in the care of chronic patients. Regardless of the medical field in which telemedicine is used, its basic areas of activity can be divided into four categories [1]:
1) Information transfer
2) Remote monitoring
3) Distance therapy
4) Telemedicine education
Telemedicine communication can be further divided into:
1) Voice: The simplest telemedicine service using an analog or digital telephone network. These are, for example, helplines, security lines, consulting and advisory lines.
2) Visual: This includes various imaging methods – teleradiology, CT, MRI, angiography, etc., but also, for example, video conferencing.
3) Data: Data exchange, telemetry, access to databases. It takes place mainly using the Internet and the TCP / IP family of protocols. Includes telemetry – remote monitoring of physiological functions.

Telemedicine in the Treatment of Obesity

Obesity is one of the civilization diseases, which, together with type 2 diabetes mellitus, has been growing since the 1940s, although it seems to be peaking and the increase is no longer so great. However, according to the latest actual data from 2013, approximately 23% of the adult population is obese and another 34% are overweight. Thus, a total of 57% of the adult population struggles with overweight and obesity (Figure 1) [4]. Obese people are 6 times more likely to get type 2 diabetes. If they exercise regularly, only 3.5 times more often. The development of obesity is undoubtedly due to a decrease in physical activity, and although the increase from 2010 to 2013 appears to have virtually stopped, the time spent on physical activity is still shortening [4]. The only result is a logical decrease in physical ability, which is a key prognostic factor in cardiovascular mortality, especially in old age. The main problem of effective treatment is to obtain quality data and this is the use of telemedicine. Questionnaires, whether related to physical activity or frequency questionnaires, appear to have too large deviations from actual energy intake or expenditure. Although there is no doubt that in a large amount of data, they can provide relatively accurate information about diet and physical activity with quality processing. The validity of the questionnaires on physical activity and their use for epidemiological research has been repeatedly confirmed [5]. However, the individual deviations tend to be large and the recommendations based on the questionnaire survey are not effective.

biomedres-openaccess-journal-bjstr

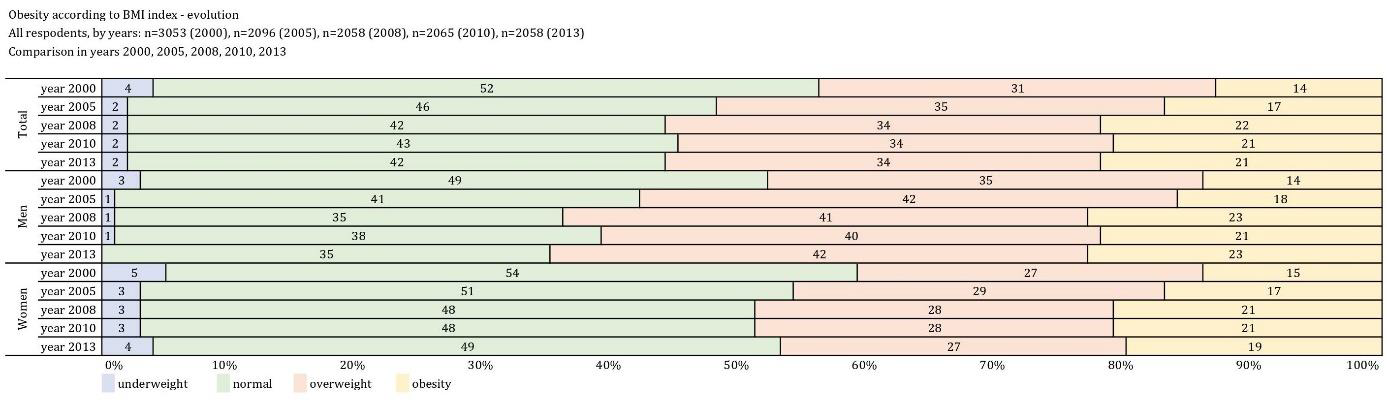
Figure 1: Incidence of obesity in the Czech Republic 2001-2013.

It is not entirely possible to individually calculate the energy value or the proportion of individual components of food in the diet by doctors or nutritional therapists. Various applications are used for this purpose, the quality of applications is often determined by the database that is formed at the time of its creation, but above all by regular updates, which are often greatly underestimated. It is often not even possible to use foreign food databases, because the composition of different foods with similar names is a wellknown problem that is currently being addressed at European Commission level. The specifics of various recipes can be gradually eliminated by entering your own recipes, which quality databases or applications should allow. However, accurate quantity data are much more important for evaluation. This is the only way to get approximately the right result. Immediate recording after a meal is very important. If we record in the evening, even the best applications or food databases will not help us and the error rate will be close to 40% [4].

Telemedicine procedures will be beneficial especially in the rural population, where there is no good availability of clinical specialists (nutrition therapists, psychologists, etc.). This is also proven by a study by Brown from South Carolina. She says that the key is the availability of care at greater distances for the possibility of regular visits, respectively. interventions. The study showed the same effect of weight reduction in clinical interventions during faceto- face visits as when using telemedicine (videoconferencing, etc.) in the rural population [6]. Similarly, another study demonstrates the effectiveness of smartphone engagement and increased physical activity compared to the control group [7]. There is no doubt about cost-effectiveness in the use of telemedicine, although we have not found a detailed study on this topic. Our unpublished data show that weight loss efficacy increases by approximately 15-20% when patients use online energy intake and expenditure monitoring. Adherence to the reduction regime is then about 5-6 months longer. According to [8] [9], there are a small number of long-term studies that show that wearables can improve the results of long-term physical activity and weight loss. However, there was insufficient evidence to show a greater benefit compared to the control groups.

Another randomized study [10] shows that the differences between the control group and the group monitored by smartphone were statistically insignificant. However, the remote monitoring group showed better compliance with the regime. The combination of mobile technology with occasional personal interventions appears to be one of the effective tools in the clinical treatment of obesity. Obesitology is a medical field in which the effective application of distance communication is possible. Self-monitoring, lifestyle change, diet and physical activity are absolutely essential in a reduction mode. Professional medical supervision is possible via information and telecommunication technologies, via the Internet or via smartphones. The advantage of the previous is the possibility of regular communication, whether synchronous or asynchronous. In this context, modern technologies have great potential to help fight obesity, especially in young patients. However, recent study results show that information technologies are not fully utilized in treatment. In the Czech Republic, where the research was conducted, it is not possible to look for barriers only on the part of the patient, because it is not quite common practice on the part of the doctor to use online communication and data sharing in this way. However, for physicians, continuous monitoring of patient outcomes can mean faster detection of patients’ health risks [11].

The advantages of telemedicine in obesitology include monitoring patients, reducing the time required for hospitalization, reducing waiting times for personal examinations, streamlining consultations and improving the overall quality of care provided [11,12]. As mentioned above, obesitology mainly uses patient selfmonitoring, in particular the control of dietary records, physical activity and other monitored data such as glycaemia, blood pressure, weight, etc. The main advantage of telemedicine is to support patient motivation and improve treatment cooperation, and not only in obese or overweight patients. In terrain we can use modern technologies such as pedometers, smart bracelets or watches, heart rate sensors, glucometers, blood pressure monitors, scales (more expensive scales can measure the bioimpedance method of body composition, i.e. the amount of fat, muscle, water in the body) that are connected to a mobile phone (usually via Bluetooth) or online questionnaire completion (nutritional or psychological). Eating habits are monitored online (web or mobile application) on a website with a large food database. The most used application in our country with the widest and regularly updated database is the portal http://www.kaloricketabulky.cz. The application is free and can be used both in web form and in a mobile phone or tablet as an application. To summarize the above, telemedicine has an important role in obesitology and its use consists mainly in (self) monitoring of patients and subsequent data processing, their evaluation and rapid feedback without the acute need for personal contact.

Materials and Methods

As part of improving patient care and simplifying cooperation with the patient in obesitology, the “Weight Predictor” portal for the Czech population is being developed. The main goal of this portal is, based on data obtained from the patient, to predict the development of his weight. The purpose of the predictor is to learn from quality data and on the basis of this data and to create a so-called artificial neural network that will be able to respond to changes in the “behavior” of the patient.

At the Moment, the Predictor has Completed the 1st Phase of Data Collection. The Following Data were Collected from Patients (Figure 2)

1) Energy Intake: Obtained from the applications caloricketabulky.cz, MyFitnessPal and Nutridata.cz
2) Energy Expenditure: Data obtained from smart devices Garmin (Figure 3), Fitbit or others connectable to Google Fit or Apple Health in a mobile phone
3) Questionnaires:
a. Lifestyle questionnaire
b. Psychological profile
c. Lifetime history of weight
d. Anamnestic questionnaire

biomedres-openaccess-journal-bjstr

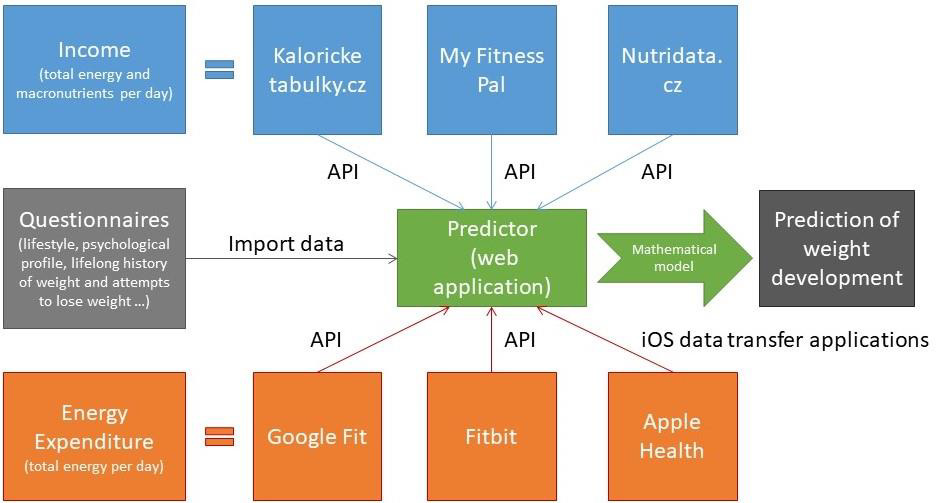
Figure 2: Weight Predictor Data Collection Scheme (Energy intake using the online platform kaloricketabulky.cz, myfitnesspal. com or nutridata.cz. Most often used kaloricketabulky.cz. Energy expenditure – monitored habitual activity (steps) using bracelets with a pedometer via GoogleFit, Fitbit AppleHealth or Garmin. Furthermore, data were collected from questionnaires).

The Data Collection Methodology Included a Total of 6 Weeks of Patient Monitoring with thorough Control of Data Collection. The Data Collection Schedule was as follows

1) Filling in the form – control of the meeting the criteria for inclusion in the program
2) Boot regime
a. Explanation of the program in details
b. Setting up one of the monitoring systems for energy intake and output – see Figure 1.
c. Body composition measurement
d. Ordering a placement visit
3) Placement visit
a. After 1-2 weeks from the first visit
b. Thorough compliance check:
i. Recording the weight, filling in the energy intake and expenditure (steps)
ii. Weighing and measuring body composition
iii. Completion of anamnestic questionnaire
iv. Completion of a psychological questionnaire
v. Record of lifelong weight development
4) Controls
a. A personal visit with consultation and measurement of body composition each week
b. 2 online control of data collection in a week
c. Possibility of online consultation
5) Final Visit
a. Weighing and measuring body composition
b. Quality control of data and data sending
c. In case of a successful regime, it was possible to extend to the second successor regime and possibly to the third

Results

A total of 1193 applicants were registered in the predictor, but unfortunately there was a very large decrease of applicants, so only 248 programs were successfully completed. An overview of data collection participants is shown in Tables 1A-1C and Figures 4A-4E. The biggest problems in data acquisition were mainly the technological barrier in the elderly population (70+) and also less interest in the male population. The best response was in the 40-50 age group in both sexes. From the above, however, it is clear that the obtained data will not be able to “train” the neural network. The “success” of completed programs is shown in Tables 2A & 2B. It can be seen from Table 2 that out of 1193 applicants, only 248 completed, which is less than 21% of all participants involved. In the beginning, most of the applicants were motivated, but over time, the decrease of probands was great. 203 participants did not complete the program due to time constraints, 386 did not fill in calorie tables or weight, 306 probands had insufficiently filled in data during data collection and therefore it was not possible to use the data. 53 probands did not complete due to health reasons. The biggest problems in data acquisition were mainly the technological barrier in the elderly population (70+) and also less interest in the male population. The best response was in the 40-50 age group in both sexes. From the above, however, it is clear that the obtained data will not be able to “train” the neural network. The “success” of completed programs is shown in Tables 2A & 2B. It can be seen from Table 2 that out of 1193 applicants, only 248 completed, which is less than 21% of all participants involved. In the beginning, most of the applicants were motivated, but over time, the decrease of probands was great. 203 participants did not complete the program due to time constraints, 386 did not fill in calorie tables or weight, 306 probands had insufficiently filled in data during data collection and therefore it was not possible to use the data. 53 probands did not complete due to health reasons. The calculated correction coefficients are shown in Tables 3A-3C, both for the whole set and even with the division into men and women. As can be seen in Table 3, the correction factor is on average comparable for both sexes and is around 5.5. Which is a relatively large number (Figures 5 & 6).

biomedres-openaccess-journal-bjstr

Table 1: Set of probands:

A. General overview of probands who completed the program and had sufficiently written or transferred data,
B. Set of men,
C. Set of women.

biomedres-openaccess-journal-bjstr

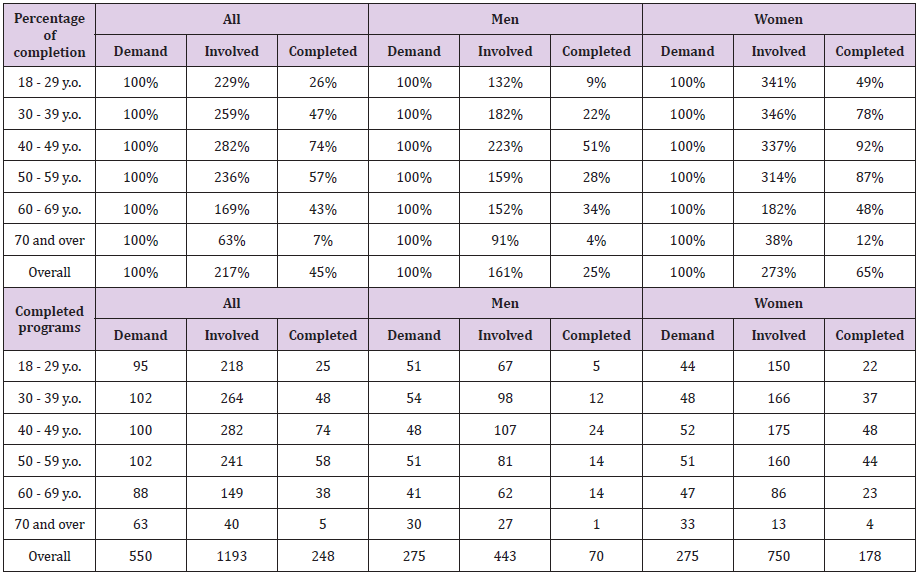
Table 2: Overview of completed programs

A. Percentage overview of completed programs,
B. Absolute numbers of involved and completed programs according to age categories.
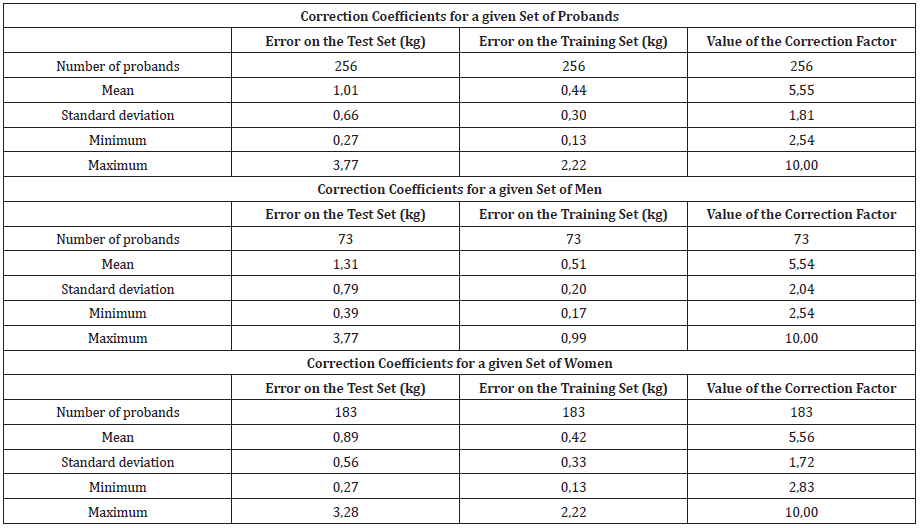
biomedres-openaccess-journal-bjstr

Table 3:

A. Total values of correction coefficients for a group of probands,
B. Calculated correction coefficients for a set of men,
C. Calculated correction coefficients for a set of women.

biomedres-openaccess-journal-bjstr

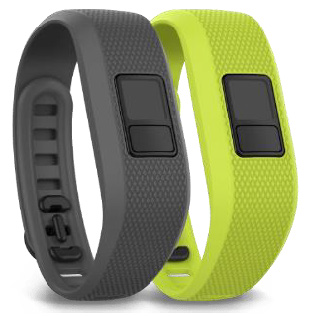
Figure 3: Garmin device for steps collection.

biomedres-openaccess-journal-bjstr

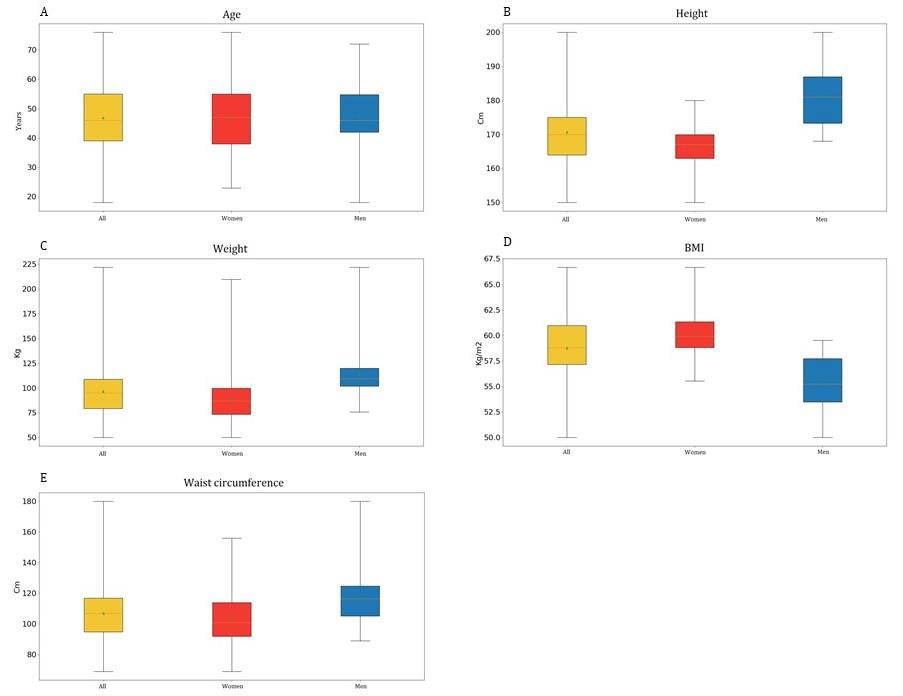
Figure 4: Box plots for:
A. A age,
B. Height,
C. Weight,
D. BMI,
E. Waist circumference

biomedres-openaccess-journal-bjstr

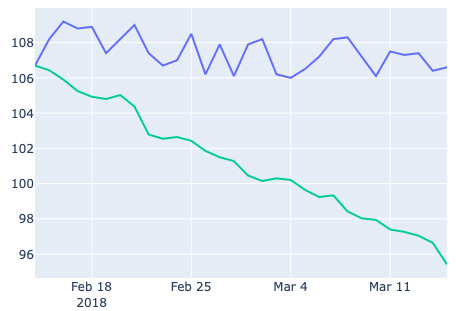
Figure 5: Demonstration of the development of the real weight of a random proband (blue color) and predicted development according to the equation of dr. Hall (green color) in time.

biomedres-openaccess-journal-bjstr

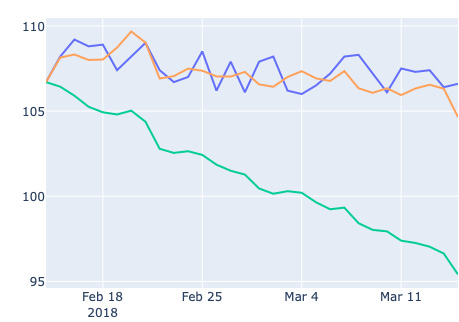
Figure 6: Demonstration of the development of the real weight of a random proband (blue color), predicted development according to the prediction equation of dr. Hall (green color) and predicted scales with correction factor (orange) over time.

Discussion

Telemedicine certainly has a place in obesity and its importance will undoubtedly take on. In addition to monitoring applications and systems, we tried to create software for predicting the weight of Czech patients based on their eating and exercise habits. Based on the collected data, it was not possible to build a neural network that would learn from its data and be able to predict the development of the weight of the individual. The amount of data to create the model was not enough. We therefore used the dynamic-mathematical model of Dr. Hall [13] as a starting model for prediction. as a basis for calculating the prediction. Due to the development of this model on laboratory data, it could not be fully utilized for our purposes. The question is what is the cause of the big difference in the prediction of the used model and real data in our probands. Our probands collected data by self-collection and therefore the collected data could be distorted. No large variations were observed in mostly middle-aged women. There were variations in men’s diet, we called them “score lies.” A possible explanation is that men tend to underestimate portions (they are lazy to weigh). One possible explanation is that a “normal” portion entered in caloric tables does not normally satisfy a man, which is related to the previous one. When a man enters a regular portion in caloric tables, but does not weigh the food, he will increase his income (compared to caloric tables), because his normal portion according to caloric tables exceeds its caloric value. Given the above, we calculated and applied a correction factor to our data, which eliminated the deviations and after incorporating the correction factor, the model showed more significant results for our population [14].

To further refine the model, it would be necessary to test other parameters of the model such as output, content of elements and vitamins in the diet of the Czech population and it was appropriate to test the model on data where the diet remains the same throughout the measurement. The next step in the development of the model should also be the implementation of glycaemia and their influence on the development of body weight, which will be the result of our further work.

Funding

The study was supported by the Ministry of Health, Czech Republic, RVO-VFN 64165 and by the Charles University in Prague, project GA UK No. 316120 and Progres Q25.

For More Articles: Biomedical Journal Impact Factor: https://biomedres.us

Open Access Journals On Science and Technology

Analysis of Latent Factors Underlying Conceptions of People with Dementia and the Effects of Social Resources

Against the backdrop of Japan’s fast-declining birth rate and growing-ageing population, support measures for people with dementia, estimated to be around 7 million in 2025, are drawing attention. In the Dementia Policy Promotion Outline promulgated by the Ministry of Health, Labour and Welfare in June 2019, ‘symbiosis’ is listed as a pillar, and ‘dissemination and enlightenment / personal dissemination support’ is listed as Factor 1 in the section on specific measures [1]. This can be interpreted as a message that we must deepen our understanding of dementia to ensure that people with dementia and their families can continue living in their own way in their communities. Globally, many OECD countries have designated the promotion of dementia awareness as a preeminent national strategy for supporting dementia. In the 2019 World Alzheimer Report released by the International Association for Alzheimer’s Disease, the need to reduce stigma for people with dementia was strongly emphasized, and 10 recommendations were proposed [2]. These recommendations include the creation of communities that are kind to people with dementia and to practice person-centred care. In other words, these recommendations encourage people to cultivate positive conceptions about dementia, and countries throughout the world are being asked to create policies that deepen understanding and awareness of the condition.

Person-Centred Care & Stigma

A positive keyword for dementia understanding and awareness is ‘person-centred care’, and a negative keyword is ‘stigma’. The former is a concept proposed in the 1990s by Dr Tom Kitwood of the University of Bradford, England, which advocates for a reimagining of our conception and perception of dementia, based primarily on traditional medical models of the condition, and instead emphasizes respect of the ‘personhood’ of people with dementia, a quality encompassing the entirety of their personality. Based on this concept of ‘person-centeredness’, Dr Kitwood listed five simple items as the emotional needs of a people with dementia: comfort, identity, occupation, inclusion, and attachment [3]. Brooker lists the four elements of person-centered care: valuing people (acknowledging the worth and value of a person’s existence), individualized care (respecting a person’s individuality), personal perspective (looking at the world from that person’s perspective), and social environment (providing a social environment to support the dementia-affected individual) [4]. Person-centredness goes beyond the medical/caregiving setting and is a concept useful for broadly deepening the understanding of dementia; it serves as a base for helping community individuals understand the lives and circumstances of people with dementia.

On the other hand, one of the primary factors hindering understanding of dementia is ‘stigma’. Byrne describes stigma as a discriminatory attitude toward or negative outlook on the conspicuous or unusual characteristics or traits of individuals [5]. The World Alzheimer Report 2019 cites the existence of stigmas as a major obstacle to both the provision of dementia-related information to those that seek it and the delivery of care and support to those that need it [2]. In the 2013 ‘G8dementia Summit’, the 11th item of the Global Action against Dementia agenda was the strengthening of efforts to lessen stigma towards dementia [6]. Kudo has conducted analyses of stigmas toward people with dementia in Japan and pointed out that when it comes to supporting them, their surrounding environment—especially their relationships with other individuals—is particularly important, and that stigma serves as an obstacle to early community detection of and intervention for people with dementia [7]. In the same paper, Kudo lists behavioural impairment among people with dementia, lack of knowledge of the condition itself, and anxieties about one’s own future condition as factors connected to dementia-related stigma. Removing these stigmas is not an easy task. Since they are often rooted in the history and culture of a nation or region, rather than proposing sweeping policies to counteract dementia-related stigma, the idea of stigma reduction itself should be hoisted as a global directive, and communities should work at the local level to encourage and deepen dementia awareness.

Hypothesis and Study Purpose

The two opposing concepts described above represent the opposite ends of the spectrum upon which our conceptions of people with dementia as an illness and our attitudes and expectations when confronting the condition lie. Philipson’s research team at Wollongong University has created a scale to holistically capture individuals’ stigmas toward dementia, which are classified into the following three categories: Isolation and avoidance of individuals with dementia, Positive perceptions of people with dementia, and Conceptions of oneself if one were to develop dementia; this scale reveals that both positive and negative aspects are involved in conceptions of condition [8]. Further, Philipson et al. (2014) targeted 616 people in Australia to derive four latent concepts that comprise conceptions of dementia in the Australian public: Avoidance, Fear of labelling, Fear of discrimination, and Person-centredness [9]. Thus, scales meant to measure stigma toward dementia and the results of analyses of latent factors have revealed that person-centredness and stigma are key factors affecting dementia understanding. We can, therefore, hypothesize that in Japan too, conceptions of people with dementia are made up of these sorts of positive and negative elements.

In 2019, the Alzheimer’s Association Japan (AAJ) carried out a ‘Survey of Feelings of People with Dementia and their Families, Care Status, and Public Attitudes towards Dementia’. In this study, we used the results of the “Survey of General Public Attitudes toward Dementia,” which was part of that survey, to conduct our analysis. As we test the aforementioned hypothesis, the objective of this study is to clarify the conceptions of people with dementia and to ascertain how existing initiatives and social resources affect dementia understanding and awareness among the general public.

Materials and Methods

The details of the attitude survey (questionnaire format) used in this study are provided below.

Questionnaire Survey Procedure

With the cooperation of AAJ chapters in the 47 administrative districts of Japan, the survey was carried out by targeting attendees and participants of public events held by each chapter, including lectures, university festivals, community events, elderly persons’ clubs, and dementia cafés. The survey was administered by AAJ staff members, and staff members/research collaborators periodically collected responses and sent them back to the main research office. Further, the survey was also uploaded to the AAJ website, distributed via a bulletin and related organizations, and implemented as a web survey. At lecture sessions, to prevent the content of lectures, etc., from influencing participant answers, the surveys were distributed and filled out prior to the event itself. These surveys were conducted between June 1 and November 15, 2019. The attitude survey conducted in this study was carried out anonymously, and no questions that would allow anyone to ascertain the identity of the respondent were set forth. Respondents were provided with an explanation of the objectives behind the survey and were told that the survey itself and analyses of the results would be exhibited to the country and the public and that responding to the survey would be deemed to provide consent to participate. This study was carried out with the approval of the Alzheimer’s Association Japan’s Ethics Committee (approval no. 2019-2003). The authors declare no conflicts of interest.

Content of Attitude Survey

The attitude survey polled respondents on their basic attributes (age, sex, place of residence, occupation), connections with people with dementia, conceptions of people with dementia (18 items), and use and knowledge of social resources (dementia supporter training courses, long-term care insurance, dementia cafés, and AAJ). The 18-item questionnaire on conceptions of people with dementia was formulated after referencing similar material by the Cabinet Office [10], Saitama Prefecture [11], Sugihara [12], Hirotani [13], and Yamada [14] (Table 1). Participants were asked to respond to the following question items using a 4-point scale (1. Agree 2. Somewhat agree 3. Somewhat disagree 4. Disagree).

biomedres-openaccess-journal-bjstr

Table 1: 18 Questions on Conceptions of People with Dementia.

Analysis

A total of 12,410 individuals responded to the questionnaire (556 completed it online). Of these, 10,485 individuals responded to all 18 items regarding conceptions of people with dementia. These 10,485 responses were, therefore, used as the analysis set for this study. In this study, the results of our attitude survey of conceptions of people with dementia were analysed via exploratory factor analysis and tests of mean differences. First, reverse-coded items for each of the 18 question items regarding conceptions of dementia were created, after which exploratory factor analysis (main factor method/Promax rotation) was carried out. At that time, items whose factor communality fell below 0.3, were excluded from the analysis. Next, extracted factor loadings were used to group and name questionnaire items, and Cronbach’s α coefficients were calculated to examine reliability (values ≥ 0.70, indicating high internal validity). The validity of the factor analysis was confirmed by Kaiser-Meyer-Olkin’s sample validity measure (determined to be valid at ≥ 0.5) and Bartlett’s sphere test.

Further, to examine the effects that use or knowledge of social resources for dementia understanding and experience interacting with people with dementia had on the factor scores of factors comprising positive conceptions of dementia (extracted via exploratory factor analysis), we separated respondents into groups. First, we separated them into two groups based on whether or not they had taken a dementia supporter training course, as determined by responses to a question (1. Yes, I have, 2. No, I have not), and compared the mean factor score of Factor I between these groups. Next, we separated respondents into a high-awareness and lowawareness group based on their answers (1. Informed, 2. Somewhat informed, 3. Not very informed, 4. Uninformed) to each of the three questions about knowledge of long-term care insurance, Knowledge of dementia cafés, and Knowledge of AAJ; Individuals who answered 1 or 2 were placed into the high-awareness group, and those who answered 3 or 4 were placed into the low-awareness group. After doing so, we once again compared the mean factor scores of factors related to positive conceptions about dementia between groups for each question. Finally, for question item which asked participants about their level of experience in interacting with people with dementia, we sorted respondents into three groups based on their answers (Experienced, Somewhat experienced, No experience) and compared the mean factor scores for Factor I between groups using a one-way analysis of variance. Statistical analyses were performed using the IBM SPSS Statistics Ver. 27.01 for Macintosh.

Results

The results of the attributes (age, gender, occupation) of the 10,485 analysed respondents are shown in (Table 2). The results of this survey tended to show a high percentage of pensioner and housewife/house husband due to the relatively high age range of the respondents, as well as a relatively high number of respondents in the medical and welfare professions, and this is described as a limitation of the study below. The responses to questions regarding attendance at dementia supporter training courses, awareness of social resources related to dementia (long-term care insurance services, dementia cafés, and AAJ), and experience with people with dementia are shown in (Table 3). The results of our exploratory factor analysis of answers to questions regarding conceptions of people with dementia are shown in (Table 4). The four items whose communality fell below 0.3 during the factor analysis process were excluded. After extracting the factors for the remaining 14 items, four factors with initial eigenvalues greater than 1.0 were extracted (cumulative contribution rate 61.2%). The Cronbach’s α coefficient for these 14 items was 0.75, confirming their internal validity.

biomedres-openaccess-journal-bjstr

Table 2: 18 Questions on Conceptions of People with Dementia.

biomedres-openaccess-journal-bjstr

Table 3: 18 Questions on Conceptions of People with Dementia.

biomedres-openaccess-journal-bjstr

Table 4: Results of exploratory factor analysis on conceptions of people with dementia.

Note: Cronbach’s α coefficient for all items: 0.745
Factor extraction method: main factor method / Promax rotation
※ Indicates reverse-coded factors

The value for the Kaiser-Meyer-Olin sample validity test, which expresses the validity of the factor analysis, was 0.83, and the result of the Bartlett sphere test was p<0.00, demonstrating that the analysis was valid overall. Based on the nature of the question items comprising each factor, the following names were chosen – Factor I: ‘Person-centredness’, Factor II: ‘Behavioural and psychological symptoms of dementia’, Factor III: ‘Forgetfulness’, and Factor 4: ‘Unknown anxiety’. Next, we tested mean difference to determine whether the use/awareness of dementia-related social resources and experience interacting with people with dementia affected the factor score of Factor I, Person-centredness (hereafter referred to as PC score). In our analysis, the Levene test was performed to verify the homoscedasticity of each item. As a result, in this analysis, Welch’s t-test was adopted to compare the two groups (four items), and Welch’s test was also adopted for analysis of variance among the three groups (one item). First, a significant difference in mean PC score was observed between the two groups: Had and had not attended a dementia supporter training course. Significant differences were also observed for high- and low-awareness groups for long-term care insurance awareness, Dementia café awareness, and AAJ awareness. Finally, a one-way ANOVA test between the three groups divided by (5) level of experience with people with dementia also revealed significant differences. The results are presented in (Table 5).

biomedres-openaccess-journal-bjstr

Table 5: The effects of use/awareness of social resources and level of experience interacting with people with dementia have on PC score.

Note: *p<0.001

Discussion

Conceptions of People with Dementia

In this study, the first stage of our factor analysis revealed the compositional elements of conceptions of people with dementia in Japan. The factors extracted were as follows: Person-centeredness, Behavioral and psychological symptoms of dementia, Forgetfulness, and Unknown anxiety. The fact that our results resemble those of the analysis conducted by Philipson et al. insofar as ‘Personcenteredness’ was extracted as a latent factor in the positive understanding of dementia is of significant importance.

At the beginning of the ‘Future Directions for Policies on Dementia’ promulgated in 2012 by the Ministry of Health, Labor and Welfare, the history of cruel treatment of people with dementia, including ostracization and physical confinement, was outlined [15]. Furthermore, psychiatric hospitals and old-age homes have long served as receptacles for people with dementia. Miyazaki details how they have lived under horrible conditions and have been targets of discrimination [16]. However, in the 1980s, the acceptance of people with dementia into special nursing homes for the elderly began, and national qualifications for care workers and social workers who could play a central role in dementia care were developed. Since then, Alzheimer’s disease International has set a policy of eradicating stigma worldwide, and various national measures for understanding dementia have been taken in Japan as well.

The extraction of person-centeredness as the first among the latent factors that comprise conceptions of people with dementia is a sign that we are finally breaking away from our long history of treating people with dementia unfairly. We can believe it positively as a tolerant society that understands people with dementia is being fostered.

On the other hand, “II. Behavioural and psychological symptoms of dementia (BPSD)” and “III. Forgetfulness” factors were extracted, which means that negative conceptions of people with dementia persist. However, the fact that BPSD contributes to people’s conceptions of people with dementia is not entirely negative; it can be interpreted as a natural consequence of the nature of the illness. Memory impairment is the most emblematic of dementia symptoms, and it is medically correct to state that the BPSD interfere with and impede activities of daily living (ADL). It is important to realize that BPSD is the result of cognitive decline and other impairments caused by degeneration of neurons and cerebral vasculature and that they prevent individuals from properly interacting and engaging with their surroundings, forcing them into a state of confusion. Once we understand this, an attitude of acceptance (sympathetic attitude) can be achieved.

It is also interesting that ‘unknown anxiety’ exists as a latent factor in the conceptions of people with dementia. While this can be interpreted as a negative factor, but this can be seen as a negative factor, but it is also a result of the information confusion that has surfaced as Japan faces the social challenge of an aging population. In our highly advanced information-oriented society, most media sources depict ageing as a problem to be solved. Identifying correct information and determining what people needs to understand is particularly difficult in modern society, in particular, individuals that do not normally interact with elderly persons can have limited opportunities to experience dementia proximally, and negative conceptions pushed by media narratives take precedence. Ogawa holds that a deep understanding and acceptance of people with dementia are necessary for the realization of an inclusive society (a ‘dementia-friendly community’) [17], and it is not difficult to imagine how ‘unknown anxiety’ could serve as an obstacle to such a goal. We hope that it will eventually become commonplace for individuals to be fully informed of and understand how to properly interact with them.

Factors Affecting Positive Conceptions of Dementia

The second stage of our factor analysis involved using tests of mean difference to analyse the effects of using and awareness of dementia-related resources and degree of experience interacting with people with dementia had on the PC score of Factor I as extracted by our exploratory analysis. All items polled at this stage of the questionnaire showed significant differences. First, we found that attending dementia supporter training courses improved the respondents’ PC scores. Dementia supporter training courses are actively promoted in the Outline for Dementia Policy Promotion (2019) to encourage understanding of dementia, but, at the local level, there is much debate about regional differences in session content and the actual impact of the sessions themselves. While we will not touch upon the content of these courses here, we hope for further expansion of efforts to promote education for dementia understanding and empathy among individuals who live near people with dementia.

Awareness of long-term care insurance, dementia cafés, and AAJ also raised PC scores. The fundamental principle underlying long-term care insurance is not to simply serve the individual needing care or to attend to their needs, but to support their independence. This idea of supporting independence is similar to that of personhood as posited by Kitwood, and we can surmise that it should be possible for correct knowledge of long-term care insurance to improve PC scores. Participation in organizations that work with people with dementia and their families affords individuals opportunities to directly feel the difficulties that these individuals experience in their daily lives and the often invisible tribulations of a caregiving family. The best way to deepen one’s sympathetic understanding is to listen to the voices of affected persons and their families.

Significant differences were also observed in our tests of mean PC scores (analysis of variance) across the three groups of individuals sorted according to their level of experience in interacting with people with dementia (1. Experienced, 2. Somewhat experienced, 3. No experience). Even outside of the realm of interactions with them, repeated experiences of anything acclimate one to it (normalization). This is a concept that most of us are quite familiar with. The Outline for Dementia Policy Promotion explains ‘symbiosis’ as ‘allowing people with dementia to live with dignity and hope, even with their condition, and enabling all people to participate in society, regardless of whether or not they have dementia’. As we can see, encouraging understanding of dementia among the public and expanding opportunities for people to interact with people with dementia will foster a sense of personcentredness.

While determining how and when to set up these opportunities for both groups to interact with one another is a project for the future, unbiased information provision (education) that takes place before stigmas can take hold is necessary. We believe that the findings obtained through this study will be important for future policy considerations for promoting dementia understanding and awareness. Changing the stigmas in people’s hearts to positive conceptions will undoubtedly lead to the early discovery of dementia and the realization of warm, personable care environments. Therefore, it will be necessary to continue to examine the meaning and impact of existing measures, such as dementia supporter training courses, and awareness-raising activities for understanding dementia in society in Japan. In addition, greater use of social resources aimed at dementia awareness or expanded educational efforts to teach individuals about people with dementia will help us understand the condition as one that is very proximal to all members of society, and will help grow a society rich in personcenteredness. Against such a backdrop, people with dementia will also have more opportunities to enter and engage with society, thereby growing person-centredness of people further. To truly realize a society of symbiosis with dementia, we must work to create a positive cycle that heightens our levels of person-centredness.

Limitations of this Study and Future Issues

The data we analysed in this study was based on a survey conducted at events where the elderly was relatively likely to participate, and some of the responses included those from medical and welfare professionals. Therefore, there was a possibility that some of the respondents already had an interest in dementia. Future research needs to understand the views of those who do not have preconceived notions about dementia in order to further explore the reality of stigma against people with dementia. In addition, since this study is a cross-sectional study, we cannot deny that there is a reverse causal relationship between the use and knowledge of social resources for dementia understanding and experience interacting with people with dementia raised PC scores. These points will be mentioned as limitations of this study at the end.

Acknowledgment

This paper analyses the results of the ‘Survey of Feelings of People with Dementia and their Families, Care Status, and Public Attitudes towards Dementia” conducted by the Health Promotion Project for the Elderly subsidy. We would like to express our deepest appreciation to the Alzheimer’s Association Japan main office, administrative office, and all employees of the branch offices that made this research possible. We would also like to extend our deep gratitude to everyone who answered the questionnaire.

For More Articles: Biomedical Journal Impact Factor: https://biomedres.us

Open Access Journals On Internal medicine

COVID-19 Disease and Treatment of COVID-19

Introduction

Severe Acute Respiratory Syndrome Coronavirus 2(SARS-CoV-2)

i. SARS-CoV-2 is a positive-stranded RNA virus with envelope, a kind of a ‘Beta Corona Virus’.
ii. It is speculated that its RNA sequence and that of the bat coronavirus are more than 80% similar. There is a strong theory that the pangolin acted as an intermediate between bats and humans.

Infection Route of COVID-19

i. Although it is estimated that human-to-human transmission through droplets is the primary route of transmission, a number of research results suggesting the possibility of airborne transmission have recently been published.
ii. Although there are reports that SARS-CoV-2 was cultured in secretions such as feces or urine, it is not clear whether transmission through feces or urine can actually occur.

Infectivity of COVID-19

i. Summarizing the results of the studies which have so far been conducted, it seems that COVID-19 patients become contagious 2-3 days before the onset of symptoms. Infectivity usually lasts 5-7days after which it decreases.

Clinical Symptoms and Complications of COVID-19 Disease

i. Asymptomatic (50%), mild-to-moderate (40%), severe (10%) including respiratory failure.
ii. Cough (50%), high fever (40%: 38°C or higher), headache (35%), dyspnea (30%), sore throat (20%), diarrhea (20%), nausea and vomiting (15%).
iii. Other symptoms include loss of smell, loss of taste, fatigue, decreased appetite, hemoptysis, dizziness, runny nose, nasal congestion, chest pain, conjunctivitis, skin changes, etc.
iv. Respiratory Complications: Lung fibrosis due to ARDS and pneumonia
v. Cardiovascular Complications: Elevated blood pressure, acute myocardial injury, arrhythmia, myocarditis, heart failure, acute coronary syndrome, atherosclerotic event and venous thromboembolism
vi. Acute Kidney Injury: Acute kidney injury due to high fever and dehydration and poor oral intake
vii. Gastrointestinal Complications: poor oral intake, indigestion, diarrhea, nausea and vomiting, elevated hepatobiliary function parameters and pancreatic enzyme levels.
viii. Cytokine Release Syndrome: ARDS, sepsis, DIC, multiple organ failure pattern
ix. Nervous system-related symptoms and complications: Ischemic stroke, encephalitis, meningitis, impaired consciousness, Ataxia, convulsions, neuralgia.

COVID -19 Disease Patterns and Severity Risk Factors in Patients with Pre-Existing Diseases

i. Elderly patients with many underlying diseases are considered to have a high mortality rate because they cannot endure the symptoms and clinical manifestations itself of COVID-19 (high fever, high blood pressure, dehydration, breathing difficulty, thromboembolic events etc.).
ii. Patients with pre-existing diseases such as high blood pressure, diabetes, hyperlipidemia generally suffer of a worsening of these diseases which then become difficult to control and require a higher medication.
iii. In many instances patients develop newly diagnosed disease in the course of their COVID-19 infection, such as high blood pressure, diabetes, hyperlipidemia, which need to be continually followed up even after the patients recovers from COVID-19.
iv. Another chronic underlying diseases that are well controlled (solid cancers, hematologic diseases, autoimmune diseases, etc.) do not have much influence on the conversion of COVID-19 to severe form.
v. Obesity is a risk factor for severe respiratory failure regardless of age or underlying disease.

Clinical Course and Treatment of COVID-19 Disease

i. Each person has a different incubation period (7-10 days) depending on the individual’s immunity, the duration of the illness and the transition period of the corona virus test to negative (14-21 days). The clinical features and complications experienced by each person are different.
ii. Continued intake of medications to control existing chronic diseases.
iii. Popular treatment (fluid treatment, antibiotic treatment, antipyretic analgesic, and anti-inflammatory drugs, etc.) for symptom relief and normalization of test values, control of abnormal findings such as high fever, cough, sputum and pain by public medications is also helpful to overcome mild to moderate COVID-19 disease.
iv. Monoclonal Antibody (Regdanvimab) is effective in preventing progression to severe disease pattern when administered within 7 days of a diagnosed pneumonia (by CT scan) for patients under 60 years and in any case for patients older than 60 even when oxygen saturation is maintained above 95%.
v. The antiviral drug(Veklury) has been proven effective when administered as early as possible in case of pneumonia(confirmation by CT scan) and an oxygen saturation level below 94%.

For More Articles: Biomedical Journal Impact Factor: https://biomedres.us

Open Access Journals On Physical Chemistry

From Pandemic to Apocalypse

Introduction

The current study is an urgent warning on the Earth Day 2020 to prevent the blast of the COVID-19 pandemic to apocalypse. It is shown that the pandemic equations become unstable at reproduction numbers above 3.5, which could reflect in a chaotic catastrophe. There are many complex models describing pandemic kinetics [1,2]. In the current study we propose as chemists a minimalistic model based on chemical kinetics. Such type of equations describes different phenomena due to the universality of non-equilibrium thermodynamics developed by Onsager [3]. If X(t) is the fraction of infected people, its temporal dynamics will obey, the following nonlinear evolutionary equation

The first term on the right-hand side describes transfer of coronavirus from infected to healthy people with a characteristic frequency ϖ . Obviously, it corresponds to a second-order chemical reaction, since there are two different sets of people. Meetings among healthy or infected people do not affect the infection rate. The other relaxational term in Eq. (1) is due to either recovery or death of infected people and τ is the mean lifetime of infection. The favorite solution of Eq. (1) is but there is another stationary solution 
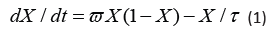
, which could be high at large reproduction number R =ϖτ . The deterministic logistic function is the solution of Eq. (1), which tends at large time to the healthy if or the pandemic if . The maximal infection rate appears in the meddle at . One can recognize in Eq. (1) the well-known SIS model from epidemiology.

A peculiarity of the nonlinear Eq. (1) is the chaotic behavior. Introducing the dimensionless time , being the natural scale of the infection evolution, Eq. (1) can be rewritten as

The discreetness of the society requires 
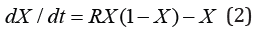
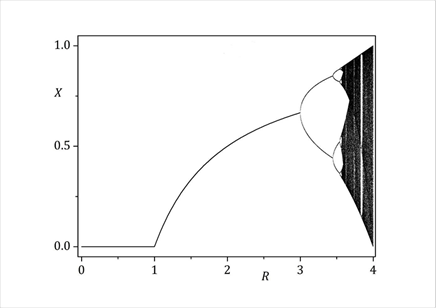
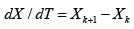
to be expressed by a finite difference and in this case Eq. (2) reduces straightforward to the standard logistic map [4,5]

The bifurcation diagram of the map (3) shows at Figure 1 that the pandemic solution 
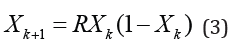
is unique in the range 1≤ R ≤ 3.

biomedres-openaccess-journal-bjstr

Figure 1: The stationary fraction of infected people as a function of the reproduction number.

At larger reproduction number R > 3 a bifurcation hierarchy takes place [6]. Any bifurcation indicates oscillations between healthy-rich and infected-rich states, and this could trigger social segregation and confrontation. The onset of deterministic chaos at R > 3.5 marks the beginning of a cascade of chaotic apocalypses with unpredictable stochastic behavior. An unforeseen salvation is, however, that according to Figure 1 commensurable probabilities hold for the End ( X =1) and a new Beginning ( X = 0 ) at R = 4 . Though Einstein did not believe that God plays dice with the Universe, this would be the case here, because the logistic map has no solution at R > 4 .

Conclusion

The present study aims either educational or scientific goals. The used standard mathematical apparatus is well known in the classical theory of the chaotic systems and the paper is a useful demonstration how it could be applied to important living systems as well. The main contribution to science is the application to epidemiology. The traditional pandemic studies try to solve complex systems of nonlinear differential equations. Outstanding scientists have developed sophisticated models for precise predictions of pandemic but they never considered the bifurcation dynamics of their models. Indeed, the described SIS model is too simple to forecast the exact evolution of the COVID pandemic but we just wanted to stress that any epidemic model is non- linear, due to the infection spreading step, and this can result in a chaotic behavior. In conclusion, to fight effectively with the coronavirus epidemy people should try to reduce the reproduction number R =ϖτ either by suppressing ϖ via social distancing, masks and immunization, for instance, or by decreasing τ via advanced medical care. In any case R should be capped below 3.5 to prevent chaotic disasters. Of course, the present minimalistic model is oversimplified and its numerical predictions could be far from the reality. However, the exact models are even more nonlinear, which presumes a more complex chaotic behavior. But the World knew already that an apocalyptic pandemic was coming [7].

Acknowledgment

The author is thankful to Dr. V. Tonchev for inspiring discussions and grateful to Dr. A. Fauci and Dr. R.W. Eisinger for encouragement. Baron May of Oxford passed away at the day of the first publication of the paper online, R.I.P. Robert M. May [4].

For More Articles: Biomedical Journal Impact Factor: https://biomedres.us

Open Access Journals On Medical Science

Epidemiology of Life-Threatening Disease and Inflammation

Opinion

Various life-threatening diseases were studied in this analysis of epidemiology [1]. Diabetes, allergy and associated diseases, arthritis, metabolic diseases, kidney disease and infection, inflammatory bowel disease and infection are covered here for epidemiology study and analysis. Diabetes, roughly 463 million people living with diabetes worldwide [2] and diabetes caused 4.2 million deaths [3]. According to the predictions, over 700 million people will be affected by diabetes by 2045 worldwide [3]. According to the survey of the National Diabetes Statistics Report, US, in 2018, more than 26.9 million people are suffering from it, and about 8.2% of the US population facing complications because of it [4]. Diabetes is not infectious and is underlined as a chronic inflammatory disease having several complications. The understanding of the emerging role of inflammation in its pathophysiology and allied metabolic disorders will be helpful. It was suggested that by controlling or treating inflammation, the prevention and control of diabetes can be possible. Several scientific observations explore the link between high levels of inflammation and the progression of type 2 diabetes. Elucidation of inflammatory pathways is a good strategy for developing medical remedies for the prevention and controlling of diabetes and associated complications.
The severity of coronavirus disease 2019 (COVID-19) infection is higher in those patients who are already suffering from diabetes mellitus and it is one more complication of it. Arthritis, a large number of the population affected by rheumatoid arthritis and it is approximately 350 million in the world and 120 million people in European [5]. In the US, nearly 54.4 million people out of 22.7 % of the population being affected in 2015 by it [6]. According to an estimation, a large number of patients are affected by rheumatoid arthritis and it will exceed up to 130 million individuals by 2050 [7]. Arthritis has a close association with inflammation. At some times, the immune system triggers an inflammatory response, no reaction from the body, then these physiological complications are notified as autoimmune diseases. Arthritis, which is initiated by inflammation, affects joints, was further classified into different category i.e., rheumatoid arthritis, psoriatic arthritis, gouty arthritis, and systemic lupus erythematosus. Allergy and associated diseases: The occurrence of allergic diseases is frequently growing worldwide. The understanding of the multifactorial etiology of these diseases is interesting. Several allergic illnesses including asthma, allergic conjunctivitis, atopic dermatitis, and allergic rhinitis share similar risk factors. Around 300 million patients have been suffered from asthma worldwide and will be around 100 million by 2025 [8]. In the United States affecting more than 50 million people are affected by allergy-induced diseases every year [9]. In Asia, this disease affects 27% overall population in South Korea and near about 32% in the United Arab Emirates [10]. One of the diseases initiated due to allergy, (asthma) affects more than 24 million people in the United States, including more than 6 million children. Moreover, allergic diseases, such as anaphylaxis, asthma, hay fever, and eczema now afflict roughly 25% of people in the developed world [11]. Therefore, clinicians are trying their best to expose the epidemiological routes of atopic disease and associated factors to design new strategies for effective treatment and prevention for putting into practice.
In allergic diseases, insistent or repetitive exposure to allergens present in the environment, consequences in chronic allergic inflammation. Thus, understanding of the concerned features and consequences of acute and chronic allergic inflammation, and especially, when mast cells initiate several characteristics of various routes and paths of immunological reactivity. It was evident that the influences of environmental exposures, numerous environmental variations, alternations in the features of microbial, and environmental exposure to numerous pollutants. Metabolic diseases, about 54 metabolic disorders considered for clinical and public health significance, such as osteopenia, mild-moderate hypovitaminosis D, impaired glucose tolerance, obesity, metabolic syndrome, erectile dysfunction, diabetes mellitus, impaired fasting glucose, osteoporosis, dyslipidaemia and thyroiditis [12]. According to the physiology of a few diseases were observed in the minimum possible, including pituitary adenomas, adrenocortical carcinoma, and pheochromocytoma. The possibilities of detection of disorders such as hyperparathyroidism and thyroid were in a higher range and the prospects of their incidences are more frequent in female patients.
Many metabolic diseases originate from the abnormal features and functioning of the pituitary, adrenal, and gonadal. Several metabolic disorders such as obesity, atherosclerosis, and type 2 diabetes underlined as lipid storage disorders and have a concern with nutrition. The role of chronic inflammation in the initiation, propagation, and expansion of metabolic disorders are deeply examined and outputs confirmed its title role in their beginning. Recently, transcription factor NF-κB was specified as one of the key reasons for the progression of these diseases, and this evidence confirmed the involvement of inflammation in the etiology of metabolic disorders. Inflammatory bowel disease and infection, according to an estimate of the U.S. Centers for Disease Control and Prevention, more than 3 million people in the United States are affected by inflammatory bowel disease (IBD) [13]. Moreover, Crohn’s and the Colitis Foundation of America assessed the situation and reported that nearly 1.6 million patients in the United States have IBD. Ulcerative colitis (UC) and Crohn’s disease identified as inflammatory bowel disease. Further, Crohn’s disease has four types of it, including Ileocolitis or Ileoceceal Crohn’s disease, Ileitis, Gastroduodenal Crohn’s disease, Jejunoileitis, and Crohn’s (granulomatous) colitis. IBD is an immune-mediated disease, which persisted in the gastrointestinal tract. According to the evidence of epidemiological research, obesity and obesity-associated metabolic syndrome triggered IBD. The predicted treatment methodology can be applied for treating chronic inflammatory bowel diseases by supporting immunosuppression, but in some cases, infectious complications make it worse. Numerous clinical observations have identified the role of infection in the initiation and progression of inflammatory bowel disease, and after that, the clinical suggestions were illustrated for inhibiting bacterial intestinal load. IBD is a type of chronic intestinal inflammation and is identified as a group of autoimmune diseases and host-microbial interactions are its key initiators.
The persistent inflammation easily induced Crohn’s disease and ulcerative colitis. The patient who suffered from IBD experienced abdominal symptoms, including diarrhea, vomiting, abdominal pain, and bloody stools. Kidney disease and infection, chronic kidney diseases are leading health problems worldwide and are detected commonly. According to the data analysis of the global level, CKD has an estimated prevalence is 13.4% (11.7-15.1%), In the US, about 15% of adults, or nearly 37 million people, have chronic kidney disease. Insistent, inflammation is underlined as an important factor, which initiates CKD that plays a unique role in its pathophysiology. Inflammation of the kidney is also known as nephritis. In Greek terminology, nephron defined as “of the kidney” and itis represents “inflammation.” Various causes are underlined that initiate nephritises include autoimmune disorders, infections, and toxins in the body. Various factors i.e., pro-inflammatory cytokines, oxidative stress, AGEs, homocysteine, and acidosis, and their excess physical and chemical concentration and their decreased clearance directly influence the chronic inflammatory status, which further triggered the initiation of chronic kidney disease.

Acknowledgment

Author (Rajiv Kumar) gratefully acknowledges his younger brother Bitto for motivation.

For More Articles: Biomedical Journal Impact Factor: https://biomedres.us

Open Access Journals On Digital Technologies

A Hierarchical Model to Quantify Burnout Stage of Hotel Industry Employees in Ethiopia

Introduction

There is high competition in the tourism sector due to the growing numbers of firms like hotels, restaurants, resorts, and tourism-related companies worldwide. Many hotel industries pursue service quality as the core policy to survive in the increasingly competitive marketplace. Hotels often tend to make it mandatory for employees to deliver excellent and extra services to guests to fulfil guest expectations increasingly. This trend is a common and significant cause of employees’ work-related psychological Stress and burnout experience, resulting in a high turnover rate. Employee turnover is undoubtedly the main fear for hotel companies. The high turnover rate brings a massive increase in costs, inducing expenses related to employee recruiting and training [1]. Burnout is a condition of emotional exhaustion, reification, and reduced personal accomplishment among individuals who work with people in some capacity. Burnout has been compared with boredom, pressure, displeasure, Unhappiness, estrangement, little confidence, nervousness, tension, conflict, fatigue, poor mental health, crisis, helplessness, vital exhaustion, and hopelessness. Nowadays, burnout is a stable academic issue happening which several investigate consume remained completed then around which several assemblies and seminars are said [2,3].

In this research, we propose a new methodology to quantify different burnout stages of hotel employees. Our approach follows a hierarchical investigation to decide the location of burnout for each employee. We collect data from a five-star hotel located in Addis Ababa, the capital city of Ethiopia, and use this data for experiments and investigation of the method.

Related Work

Burnout has attracted the attention of many researchers in the past decades [4-12]. The hotel and tourism industry has a higher impact on the world’s economy, which boosts the economy of the tourist recipient countries [13]. Hospitality, a by-product of tourism, is the relationship between the service itself, the service provider, and the service receiver (the guest) in providing a range of services that includes the satisfaction of physical and psychological needs [14]. Hotel employees are constantly under pressure as they need to meet their customers’ physical and psychological needs. If these pressures are not handled properly, they will lead the employee to frustration, stress, and loss of interest in their job. Burnout is a condition conceptualized as a result of workplace stress which has not been adequately managed[15,16]. Even if burnout is not yet categorized as a medical condition, it may lead to emotional and physical illness [17]. Burnout happens when an employee is overwhelmed, drained, or unable to meet the continuous demand of their working position. Burnout can affect anyone working in any industry.

The Winona state university adopted Venniga and Spradely’s model of stages of burnout to assess the intensity of burnout risk in employees [18]. This model divides the burnout stages into Four.

Honeymoon Phase

This stage is the beginning of the feeling of burnout, which is not assimilated as burnout in most cases; however, most of the time, it’s hard to be diagnosed. Transferring to a new task and assignment of new responsibility is considered a triggering issue. Personal life-related matters like divorce and having a new baby can also often be triggers [19]. This change of situation has an impact on the level of employee job satisfaction. A change of work environment plays a significant role in preventing entering the next stage of burnout. Employees will experience intense optimism, job satisfaction, commitment to tasks, a desire to prove themselves, and a substantial creativity boost [20]. If employers can maintain these positive changes, they may keep their employees in the honeymoon stage for a long time.

Onset Stress

When a workplace continues, positive incentives are ineffective, employees start to feel that some days are better than others at this stage [21]. Employees sometimes feel like they can’t handle the stress at work. Common stress symptoms which may affect employee emotion will be more common. Employees in this stage may experience fatigue, difficulty to focus, irritability, racing heart, sleeping disturbance, headache, anxiety and less self-care [22].

Chronic Stress

When burnout reaches regular stages, the feeling in the onset stages become more frequent. A decrease in motivation will be noticed more often. At this stage, other people will also see changes in the behaviours like missing deadlines and giving a repetitive excuse. The physical and emotional symptoms intensify at this stage [23,24]. Employees in chronic stress may experience anger or aggressive behaviours, missing work deadlines, procrastination, physical pain or illness, instant panic, lack of interest, chronic fatigue and exhaustion, pressure, and social withdrawal from friends or families [20].

Burnout

When chronic symptoms are not handled properly, they will then transfer to the burnout stage. At this stage, it will not be feasible for the employee to continue working in their position. The continued feeling of powerlessness and failure will eventually run to the belief of disillusionment and despairs [25]. Employees feel like there is no way out of such circumstances and become stranded towards their job. Symptoms at this stage happen more frequently; employees may not even have a single day without feeling. Significant symptoms include Feeling emptiness, self-doubt, denial, desire to move away from work, chronic headache, behavioural changes, pessimistic mood and missing pieces [26].

Methodology

Initially, a correlation analysis is conducted on the variable to assess their interrelation between each other. All the variables are classified into four groups based on their attributes, honeymoon indicator, onset indicator, chronic indicator and burnout indicator. The category of each variable is decided based on previous research papers. Once all the questionnaires are sub-grouped, each respondent’s quantitative responses for questions in the same subgroup are combined and then divided to the total grade assigned to each question which gives us the subgroup average. We then summed up the individual respondents in the subgroup and compared the results against the initially calculated average. If the result is greater than the average in that specific subgroup, then that particular employee has observed all the indications of symptoms in this subgroup. If the result is less than half of the average, that individual is considered free from those symptoms.

After completing the same calculation in all subgroups, the result gives the likelihood of each respondent states whether they are affected by each group or not. However, some employees can be categorized into multiple subgroups of burnout stages. Therefore, a filter is added to decide the current state of each employee. The filter will take all the subgrouped results and only gives back the last positive observation of the burnout stage. For example, suppose an employee is found symptomatic in the onset, chronic and honeymoon stage. In that case, the filter will take the last observation of the positive symptom, which is the chronic stageassuming that the honeymoon and onset stages have already been passed. The flow chart of this methodology is presented in Figure 1 below.

biomedres-openaccess-journal-bjstr

Figure 1: Layout of the methodology.

Results and Discussion

Initially, descriptive statistics of the data is reviewed, followed by a detailed presentation of results. The results of the data analysis are conducted in the manner described in the methods section of this paper.

Descriptive Statistics of the Data

Out of the 80 questionaries distributed, 73 (91%) questionaries were passed the requirement of data quality measures. The remaining 7 (9%) were either below the data quality requirement of this project or the respondent didn’t give back the questionaries. Hence, the analysis is conducted using this data as 91% of the total sample data is valid and statistically significant to conclude the total population.

Figure 3. present the sample respondent’s gender. Out of the total sample, 54(73%) respondents were female, and 20(27%) were male. As seen on the chart (Figure 2), female participants are more than males in the sample, which gives the impression that the data is skewed towards the female samples. However, the distribution of gender of the total population of the hotel is also similarly skewed to female. Most hotel industry employees in Ethiopia are female, as the industry recruits female employees more than males. This is especially true in the housekeeping and spa departments with the highest number of hotel employees.

Amongst the hotel respondent, 60 (82%) of them have a daily base face to face contact with customers, while the 13 (18%) of them have very little or no face-to-face interaction with customers. Departments like housekeeping, spa, front office, security, food and beverage are among the departments with consistent contact with customers. On the other hand, departments like maintenance, finance, and kitchen have very little or no face-to-face contact daily (Figure 3). The relation between face-to-face interaction with customers and burnout is described in the following subsection.

Figure 4. presents the average percentage of the participant by department. This research found that the majority of respondents are in the Spa department (19 or 26%)). This result is expected because the total number of employees in the spa department is greater than in other departments. The spa department has three times more shifts and many workloads. The housekeeping department is the 2nd vast department in the hotel, and the percentage of the participant from the housekeeping department is 17(23%). Housekeeping also has more shifts, and it requires a physical job. The 3rd department is security, with 11(15%) of the samples. The security department has two shifts, and night shift guards job requires the employee to be awake at night and sleep during the day. The food and beverage department is the 4th broadest department with a total participant of 8(11%), and this department includes waitress, waiter, and food & beverage control. The finance, front office and kitchen have equal5(7%) participant. The last department is maintenance with a total of the participant of 3(4%).

biomedres-openaccess-journal-bjstr

Figure 2: Respondent by gender.

biomedres-openaccess-journal-bjstr

Figure 3: Frequency of a participant who has a face-to-face contact with the customer.

biomedres-openaccess-journal-bjstr

Figure 4: Percentage of the participant by department.

Correlation of the variables

The correlation of the variables is calculated, and a heat map of the variables is generated using python package. The purpose of the correlation analysis is to investigate the interrelation of variables in four sub-groups. The aim is to use these interrelations as a signifier of different burnout stages. However, as shown in Figure 5, most of the variables have no significant positive or negative correlation. More than 95% of the interrelation are between -3 and 3, representing a weak correlation among the variables.

As presented in Figure 6, 51.35% of the employees are on the honeymoon stage, implying that half of the employees are in safest burnout stage. However, the hotel needs to implement a strategy that keeps this group of employees in the same state. Otherwise, there will be a great chance this employee will slip to the onset stage. The total number of employees in the onset stage is significantly less than the other groups (4.05%). One of the possible reasons why the number of people in this group is less is that employees might not recognize the symptoms of the onset stage. People on the onset stage might feel like they are in either the honeymoon stage or chronic stage. This depends on the severity of symptoms of the onset stage. It is easy to confuse the indicators of onset with the honeymoon stage and chronic stages. Employees on onset stages are in a better placed to receive treatment for their onset symptoms than the later two stages. Hence, the hotel needs to work on these employees to convert them to the honeymoon stage before the atmosphere converts them to a chronic stage.

biomedres-openaccess-journal-bjstr

Figure 5: Correlation matrix result.

Around 20% of the hotel employees are in chronic stage, which is a red flag for the hotel to consider. Chronic stage is a stage that must be addressed before employees reached to uncurable phase. The number of employees on this stage cannot be ignored as it can poison the whole work environment . The hotel needs to take intensive measures to tackle this issue by implementing a rigorous treatment plan that needs to be followed by a plan to measure the success of this implementation. The number of employees who are in the final stage (burnout) is 22.97%. This raises an alarm of concern that the hotel was neglecting a significant margin of its employee. As most studies agreed, employees on this stage require an extensive effort to bring them back to other stages. In some cases, it might even be impossible for the employee to be healed at this stage. There are currently 20% additional employees in the chronic phase, which can shift to burnout stage.

Figure 6. shows, amongst the participant, 51.35% of them are in the honeymoon stage. Onset stages 4.05% the smallest amount of the stage. Shifting this population to the honeymoon requires less efforts and resourses than shifting chronic and burnout stage to honeymoon. 20.27% of the respondents are in chronic stage. This stage has a lower figure comparing to the honeymoon stage. 22.97% of the participants are in the burnout stage, which is very alarming to the hotel.

biomedres-openaccess-journal-bjstr

Figure 6: Burnout stages of the five-star hotel employees, which is investigated in this research.

Burnout Stage by Gender

As explained in the descriptive statistics, most of the employees in this hotel are females. Out of the total sample investigated, 7 (9.77%) male employees are in the honeymoon stage and 32 (44.4%) female employees are on the honeymoon stage. The honeymoon stage is the desired target stage that all employees and employers want to be. It creates a favourable environment for employees and increases productivity and profit for the company. The result reflects that the percentage of workers on honeymoon stages by gender is less than 50% for both genders. Therefore, even if 51.3% of the total employees are on the honeymoon stage, the result by gender shows that the hotel needs to work on both genders. This result revealed a need for a burnout prevention strategy. The number of male employees in the honeymoon stages has a lower percentage than that of female employees. Only 1(1.3%) of the male and 2(2.78%) of the female employees are on onset stages, respectively.

Considering the distribution of the participant’s gender, the distribution of gender in chronic stage is almost even. The number of male employees in the chronic phase is 4 (5.56%), while the female employees count 11 (15.28%). The hotel needs to invest in both genders at this stage as this will be the last chance before it is too late to recover employees from burnout. The number of male and female employees in burnout stage is the same, 9 (12.5%). However, as described in Figure 3, the number of samples taken from male and female employees is not equal. Female respondents count 73%, and male respondents estimate 27%. Hence, the number of male employees in burnout stage is 21% higher than that of female employees. The hotel needs to investigate why male employees in burnout stage are higher than the female. The hotel needs strict treatment measures to decrease these employee numbers, especially male employees in the last stage. As some studies suggested, it is severely challenging to treat employees who are on the final stage; it’s more often uncurable at this stage (Figure 7).

biomedres-openaccess-journal-bjstr

Figure 7: Burnout difference by gender.

Burnout Stages by Face-To-Face Contact with Customers

The result presented in Figure 8 showed the distribution of burnout stages related to employees’ job responsibility of faceto- face interaction with customers. The departments with faceto- face contact with customers are a spa, housekeeping, security front office, and the maintenance team. On the other hand, the Main kitchen. Finance and part of the maintenance team don’t have faceto- face contact with customers. The result shows that employees who have a face-to-face interaction with customers have a higher margin in the four burnout stages. Hence, this indicates the possible link between face-to-face contact with customers and burnout. One of the probable causes for this is that this employee takes the load handling customers’ demands, complaints and enquires. Therefore, the hotel needs special training for this group of customers, which can decrease the pressure of their position.

biomedres-openaccess-journal-bjstr

Figure 8: Stages difference by face-to-face contact.

Burnout Stages Distribution by Department

biomedres-openaccess-journal-bjstr

Figure 9: Stages of burnout in department.

The housekeeping department is the only department where 100% of employees are on the honeymoon stage, followed by the front office (80%) and food and beverage (64%). There are few employees in onset stage from the food and drink and spa departments. The majority of the chronic stage employees are from the security department, followed by spa and finance. Housekeeping is the department that the hotel needs to critically work to save its employee from moving in the burnout stage. The result also shows that majority of the employees in maintenance departments are in the burnout stage. Security, spa food and beverage, front office and kitchen has a share of employees in burnout stages. Based on these results, the hotel must design the best possible combination of treatment for each department as per its need.

Conclusion

In this research, we propose a new hierarchical methodology to evaluate the burnout stage of employees in hotel industry. Using the proposed method, we quantify the burnout stage of five start hotel employees. The hotel investigated in this study is located in Addis Ababa, the capital city of Ethiopia. Our result shows that 51% of the hotel employees are in the honeymoon stage while 4 % are in onset. Employees who are in chronic and burnout stage are 21% and 22%, respectively. We quantify results by gender, department, and face-to-face contact with the customer. The proposed method can also be used to quantify employee burnout stages in other sectors, different from hotel industries.

For More Articles: Biomedical Journal Impact Factor: https://biomedres.us

Open Access Journals On Surgery

Spleen Preserving Treatment of a Ruptured Splenic Artery Aneurysm (SAA) in Emergency Setting: A Case Report and Review of the Literature

Visceral artery aneurysms represent a rather rare disease with documented incidence of 0,1 – 0,2 %. The actual incidence is underestimated, since most aneurysms remain asymptomatic [1]. Of all abdominal vessels, the splenic artery is the third most common affected branch after aortic and iliac arteries [2]. Of the visceral arteries, the splenic artery is the most common affected (60-70%), followed by the hepatic artery (20%) and the celiac/ mesenteric arteries (10%) [3].
Most SAA affect the distal third of the artery and are typically solitary and saccular shaped lesions. In one-third of SAA cases concomitant aneurysms were found at other localizations [4]. Predisposing factors for aneurysm are the well-known cardiovascular risk factors like atherosclerosis (32%), medial degeneration (24%) and inflammatory diseases (10%); previous abdominal trauma was often stated (22%). Less common are high blood flow conditions (e.g., pregnancy, portal hypertension) or fibroconnective tissue diseases. The diagnosis of SAA is made either after rupture or incidentally [4]. After rupture, a spontaneous stabilization can occur if the bursa omentalis temporarily contains the bleeding through compression. The natural consequence, if untreated, is the haemorrhagic shock.
Management of SAA depends on the timing of initial diagnosis. Acute ruptured aneurysms show mortality rates of 10 – 70% and are therefore a surgical emergency [3]. Incidental aneurysms with diameters < 2.5 cm rarely rupture spontaneously, as shown by the Mayo Clinic and the Cleveland Clinic [5]. Size > 3cm as well as symptomatic SAA and all pseudoaneurysms should be treated urgently [6]. In contrast to real aneurysms, only specific wall layers are affected in pseudoaneurysms. Abdominal pseudoaneurysms are often consequence of trauma or iatrogenic injury with faster enlargement and higher rupture rates.
The aim of the treatment is to exclude the aneurysmatic sac from blood flow without compromising the distal perfusion. This can be accomplished with a surgical or endovascular approach [2]. Treatment of asymptomatic aneurysm should be performed in an elective setting and an endovascular treatment should be discussed. Depending on end-organ perfusion but also on the size and location of the aneurysm along the splenic artery, the need for splenectomy must be evaluated. In most cases end-organ perfusion can be guaranteed by collateral arteries and other perfusion sources (i.e., Aa. gastricae breves, Aa. caudae pancreatis), therefore the need for this procedure remains an exception [7].

Case

We present the case of a 40-year-old male patient transferred from a regional hospital. At first contact severe, acute, left abdominal pain since a few hours were stated. Previous illnesses or surgical treatments were denied. His mother died due to a ruptured intracranial aneurysm, no cases of connective tissue diseases were known in the family. He had nicotine abuse as a risk-factor. Initially the patient was hemodynamically stable (BP 138/100mmHg, P 80/min, SO2 100%, T 36.8°C) with signs of peritonitis to the left abdomen. Sonography showed excessive free fluid. A CT scan identified a ruptured aneurysm of the splenic artery (Figure 1) and the transfer to the shock room followed.
No other bleeding sites or aneurysms could be identified. Initially haemoglobin (Hb) was 15 g/l, after one hour it dropped to 13 g/l. 1g Tranexamic acid (TXA) was injected. Upon arrival in the shock room GCS was 15 and the patient was hemodynamically stable. Hb was 11.7 g/l, INR 1.1, thrombocytes 215 G/l and fibrinogen 2.1 g/l. An interventional management was initially discussed. Due to progressive hemodynamical instability and no response to fluid therapy (BP 100/60mmHg, P 105/min) we performed an emergency median laparotomy because of hemorrhagic shock. The bursa omentalis was opened, about 1.5 L of blood was evacuated (total blood loss 2.5 L), the splenic artery was identified and clipped (Figure 2).

biomedres-openaccess-journal-bjstr

Figure 1. CT-Scan: Coronary MIP-Sequence and 3D-Reconstruction.

biomedres-openaccess-journal-bjstr

Figure 2. Intraoperative situs: clamped splenic artery.

As the active bleeding reduced, the aneurysm sac was identified. After controlling of residual bleeding, the spleen did not show any ischemic sufferance. An accessory arterial branch guaranteed the splenic perfusion, and we performed a spleen preserving aneurysm resection. The aneurysmatic lesion (length 8.5cm) was removed. A drain was inserted above the pancreas tail. Before closure, there was no sign of hypoperfusion of the spleen. Intraoperative transfusion of two red cell concentrates (600ml) and 600ml of own blood through Cell Saver followed. The minimal postoperative Hb after transfusions was 9.9 g/l.
The postoperative monitoring in ICU was uneventful. Prophylactic broad-spectrum antibiotic was stopped after 72 hours. A POPF Grad A (postoperative pancreas fistula, biochemical leak) was detected. The drain was removed on POD 7 after a CT scan, the spleen showed normal perfusion. The discharge was on POD 8. The histological aetiology of the lesion was a chronic arteriosclerosis. The 30-days follow-up showed an asymptomatic Patient with normalized Hb. A brain MRI excluded concomitant intracranial aneurysms. A CT scan 3 months after surgery showed a normal splenic perfusion with pancreo splenic and gastro-splenic collaterals. A genetic analysis to rule out genetic connective tissue disease was done. No pathological findings were reported.

Discussion

Ruptured SAA represent a surgical emergency and show mortality rates of 10 – 70% [8]. The treatment should be performed open surgically whenever possible [4,8]. Endovascular approaches in the emergency setting have shown fewer desirable outcomes, including the risk of postembolization syndrome and incomplete aneurysm exclusion [3,8]. In elective setting, laparoscopic or endovascular approaches are preferred [6]. A retrospective analysis of a series of 94 patients undergoing aneurysm repair showed morbidity and mortality rates in open approach (n=74) respectively at 9.4% and 1.3%. The endovascular approach (n=20) showed morbidity rates of 10% with no mortality [9]. We report a spleen preserving open aneurysm resection as surgical treatment of ruptured SAA in haemorrhagic shock since the spleen did not show any ischemic sufferance. Spleen preüserving management of SAA is well described in elective settings, in emergency settings just by endovascular treatment. We only found one similar case report (in English) [10]. We confirm that this procedure can be performed in open surgical emergency treatment of ruptured SAA. 80% of patients presenting with aneurysms of the splenic artery are over 50 years old [5]. The prevalence of splenic artery aneurysm in patients with liver cirrhosis and portal hypertension is 7-20% [4]. Concomitant aneurysms, which can be found in one third of the patients with SAA [4], should be excluded through brain MRI and thoracic-abdominal CT scan. A genetic testing to exclude a connective tissue disease is suggested.
We confirm that the clinical guidelines should be followed in decision making. Open surgery remains the gold standard in the treatment of ruptured SAA and a spleen-preserving management should always be pursued.

For More Articles: Biomedical Journal Impact Factor: https://biomedres.us

Open Access Journals On Anatomic Pathology

A Peculiar Type of Haemangioma that Poses Some Problems in Pathological Differential Diagnosis with Angiosarcoma

Introduction

Anastomising hemangioma is a rare benign neoplasm originally described in urogenital organs [1]. Even if it is seldom encountered in routine diagnostic sign out, it is important for pathologist to know about its existence because it has quite alarming histological features that could lead to an erroneous diagnosis of angiosarcoma. After its original description, this neoplasm was subsequently found in other sites, retroperitoneum being one of the least common [2], especially without any concomitant renal lesion.

We herein report a rare case of retroperitoneal anastomosing hemangioma.

Case Report

A 49-years old male patient came to our attention in January 2019 for the incidental finding of a 16×12 mm right peri-renal lesion at the superior abdominal images of a chest computed tomography (CT) scan. The patient had a positive medical history for pulmonary tuberculosis and asthma. He did not complain of hematuria, flank pain or any other symptom. An abdominal contrast CT scan was performed, which confirmed the presence of the abovementioned lesion (Figure 1). A 5×7,8 cm hepatic hemangioma completed the scenario. The patient also underwent a positron emission tomography with fluorodeoxyglucose (18F-FDG-PET) scan which did not find an increased glucose metabolism. At the presentation the patient had haemoglobin 16,2 g/dl, creatinine 1,3mg/dl.

The patient underwent a laparoscopic exeresis of right peri-renal lesion with preservation of the kidney and adrenal gland. No postoperative complications were observed. Perirenal fat tissue including the above-mentioned lesion was sent to Anatomic Pathology Laboratory and fixed overnight in 10% formalin. Gross examination of perirenal fat tissue revealed a reddish nodule measuring 16×12 mm, which was totally submitted for histological examination, routinely processed and paraffin embedded. Histological sections were cut at 4 micrometer thickness and routinely stained using hematoxylin and eosin (H&E). Immunohistochemical stains were subsequently performed with commercially ready for use antibodies (CD34, clone QBEnd/10, Ventana; CD31, clone JC70, Cell Marque; FLI-1, clone MRQ1, Cell Marque; Ki-67, clone 30-9, Ventana) on formalin fixed, paraffin embedded sections using an automated immunostainer (Benchmark Ultra; Ventana; USA).

biomedres-openaccess-journal-bjstr

Figure 1: Abdominal CT scan showing a 16×12 mm right peri-renal lesion (blue arrow) and hepatic hemangioma (red arrow).

Microscopic examination showed a circumscribed unencapsulated vascular lesion featuring a central hypocellular and edematous core surrounded by a more cellular area composed of ectatic and variably anastomizing thin-walled blood vessels. They were lined by endothelial cells sometimes with hobnail appearance but without aypia, multilayering or mitoses. There were stromal hyalinization and hemorrhages; occasional intravascular thrombi could be seen. On immunohistochemistry, endothelial cells showed expression of CD31, CD34 and FLI-1. Proliferation index evaluated with Ki-67 was very low (Figure 2). Morphological findings were thus consistent with an anastomosing hemangioma.

biomedres-openaccess-journal-bjstr

Figure 2: On microscopic examination a well-circumscribed, unencapsulated lesion was found (A: H&E, 40x). This lesion has a central hypocellular and edematous area surrounded by a cellular area composed of anastomizing thin-walled blood vessels lined by endothelial cells without features of malignancy (B: H&E, 200x). On immunohistochemistry, endothelial cells showed expression of CD31 (C: CD31 immunostain, 200x). Proliferation index evaluated with Ki-67 was very low (D: Ki-67 immunostain, 200x).

Discussion

Vascular tumors can be benign, can have a locally aggressive but rarely metastasizing behaviour (so-called intermediate-grade vascular tumors) or can be highly aggressive with local and distant spread (angiosarcomas). Most of them are superficially located on the skin and in the subcutaneous tissue but they can also develop in deep-seated soft tissues and in internal organs. They are more common in children and young adults, even if some exception occurs [3,4]. Among benign tumors a wide variety of histotypes are described. Anastomosing hemangioma have some peculiarities: it tends to occur in adults with a preference for deep localization [2]. In fact, it was first described in 2009 as a peculiar vascular lesion mimicking angiosarcoma and involving kidney and testis [1]. A recent review [5] have collected about 60 cases renal cases, and an approximately equal number of non-renal lesions, the most frequent of which are the soft tissues and the bones, especially in paraspinal locations [2].

Occurence in perirenal fat without involvement of the kidney is very unusual. At the best of our knowledge only six cases were previously reported exclusively in peri-renal fat [6-8] without concomitant kidney involvement. The anastomizing structure, the diffuse (i.e. non-lobular) pattern of growth and the hobnail appearance of endothelial cells which can show mild atypia may be quite alarming for the differential diagnosis with a welldifferentiated angiosarcoma, especially on small biopsies. Moreover, the lesion frequently has some infiltrative pattern at the edge, which can be misinterpreted as an additional sign of malignancy. However, the absence of mitoses, multilayering, overt atypia and extensive destructive infiltrative pattern may suggest the right diagnosis. Moreover, the homogeneity of the lesion, without any poorly differentiated area stands against a diagnosis of malignancy [5].

Conclusion

In conclusion, anastomizing hemangioma is a rare lesion with less than one hundred cases reported in ten years. However, it usually occurs at any deep location and with worrisome clinical and microscopic features that could lead to a wrong diagnosis of malignant vascular tumor, so pathologists and uropathologists should be well aware of its existence.

Conflicts of Interest

The authors declare no potential conflicts of interest with respect to research, authorship, and/or publication of this article.

Acknowledgement

None.

For More Articles: Biomedical Journal Impact Factor: https://biomedres.us

Open Access Journals On Physical Therapy

Incidental Finding of Lumbar Hemangioma in a Low Back Pain Patient with Red Flag Findings

Mini Review

The patient was a 49-year-old male Chief Master Sergeant in the Air Force with 30 years of recurrent back pain and right-sided lower extremity numbness in the S1 dermatome. His current episode of symptoms was insidious in onset 6 months prior. Since this new onset, the patient reported several red flag findings including a 16-18kg weight gain within 4 months. The patient also had episodes of bloody stools and night pain that woke him from sleeping. The patient had a known history of an L3 Schmorl’s node on radiographs obtained 4 years prior (Figure 1). Aggravating factors included sitting with poor posture and elliptical use. Leaning left in a seated position and unweighting his right lower extremity eased his symptoms. Lumbar active range of motion was 25% limited in right rotation and slightly limited in flexion. Neurological screening revealed diminished sensation to light touch in the right S1 dermatome, absent right S1 deep tendon reflex, and a positive straight leg raise test.
The physical therapist referred the patient for lumbar magnetic resonance imaging due to concern his back pain was arising from sinister pathology. The MRI identified a mild L5-S1 disc protrusion and the presence of a lesion within the L1 vertebral body. The presence of fat within the lesion shown as hyperintense on T1/T2 MRI and hypointense on the Short T1 Inversion Recovery (STIR) MRI confirmed the lesion as a benign hemangioma and not a metastatic lesion (Figure 2) [1]. The diagnosis is further supported by the presence of a corduroy thickened trabecular pattern and a polka-dot trabecular pattern on axial imaging common in lumbar hemanioma (Figure 3) [2]. The patient was primarily treated using an extension based protocol. After three months of treatment, he reported “major relief” of his back pain symptoms and his range of motion was returned to normal, though the right lower extremity paresthesias remained unchanged.

biomedres-openaccess-journal-bjstr

Figure 1. From left to right:
A. Anteroposterior view and
B. Lateral view lumbar radiographs demonstrating a Schmorl’s node on the superior endplate of L3.

biomedres-openaccess-journal-bjstr

Figure 2. From left to right:
A. Sagittal T1
B. T2, and
C. Short T1 Inversion Recovery (STIR) weighted magnetic resonance images of the lumbar spine demonstrating T1/T2 hypertintensity and STIR hypointensity within the L1 vertebral body with a vertically-oriented thickened trabecular pattern consistent with lumbar hemangioma.

biomedres-openaccess-journal-bjstr

Figure 3. Axial T1 weighted magnetic resonance image of the lumbar spine demonstrating a T1 hyperintense lesion with a polka-dot appearance of the trabeculae within the L1 vertebral body consistent with lumbar hemangioma.

For More Articles: Biomedical Journal Impact Factor: https://biomedres.us

Open Access Journals On Pharmaceutical Chemistry

Preparation of (Substituted)- Benzyltriphenylphosphonium Bromide Salts Under Microwave Irradiation

Introduction

Wittig reagent is one of the most important precursors for the synthesis of large number of natural and bioactive molecules thereby one of the keystones in the field of organic chemistry [1- 3]. Usually, the common reaction conditions such as heating at high temperature or refluxing are used to apply to synthesize the desired Wittig reagent. A detailed literature survey revealed that in the conventional method (CM) heating was applied in the presence of various solvents, such as THF [4-5], CH2Cl2 [6], CHCl3 [7], toluene [8-18], CAN [19] etc. Besides conventional methods, two microwave irradiation (MW) methods in neat [20] and with xylene [21-22] were performed by Kiddle and Cvengros in 2000 and 2004 respectively, for the synthesis of triphenylphosphonium bromide salts and another one synthesized by detected by NMR only [23]. Even though they have obtained excellent yields, but due to the lack of temperature control, a similar condition under CM, and uses of only xylene as well as neat conditions promoted us to optimize the reaction conditions varying temperature, pressure, solvents, voltage as well as mole equivalent of the reagents. Nowadays, microwave-assisted synthesis has become a well-established method for chemists as chemical reactions mixtures are heated instantly and reaction products obtained in good to excellent yields. The major advantage of microwave heating is the reduction of chemical reaction times from days and hours to minutes. Here, we report a simple and efficient method for the preparation of Wittig reagents, (substituted)-benzyltriphenylphosphonium bromide salts using MW irradiation from (substituted)-benzylbromides and triphenylphosphine in quantitative yields (87-98%) in the presence of THF at 60 ºC for 30 min.

Materials and Methods

General Preparation Procedure of Phosphonium Salts Using Mw Irradiation

A mixture of triphenylphosphine (1, 10.5 g, 40 mmol) and benzyl bromide (2a, 3.42 g, 20 mmol) in THF (20 mL) in a carboncoated quartz ampoule was heated under Microwave irradiating at 60 °C with 800 Watt and 1 bar pressure for 30 minutes. The ampoule was opened inside a fume hood, and the precipitate was filtered. Recrystallization was performed in CH2Cl2, obtained a 97 % yield of benzyltriphenylphosphonium bromide (3a). Similar procedures were adopted for other phosphonium salts (3b-s).

Benzyltriphenylphosphonium Bromide (3a)

Colourless powder. Yield 97%, Melting point: 296 ºC (MP. 295 – 298 ºC) [5]. 1H NMR (500 MHz, CDC13): δ 5.39 (d, JHP = 15 Hz, 2H, –CH2), 7.18 – 7.21 (m, 2H), 7.24 – 7.27 (t, J = 8 Hz, 2H), 7.34 – 7.37 (m, 1H), 7.77 – 7.81 (m, 6H), 7.85 – 7.90 (m, 6H), 7.94 – 7.99 (m, 5H) ppm.

(4-Cyanobenzyl)-Triphenylphosphonium Bromide (3b)

Colourless powder. Yield 94%, Melting point: 328 ºC (MP: 326 – 329 °C) [5]. 1H NMR (500 MHz, CDCl3): δ 5.23 (d, JHP = 15 Hz, 2H, –CH2), 7.21 – 7.18 (m, 2H), 7.35 (m, 2H), 7.64 – 7.57 (m, 12H), 7.71-7.75 (m, 3H) ppm.

(3-Fluorobenzyl)-Triphenylphosphonium Bromide (3c)

Colourless powder. Yield 98%, Melting point: 315 ºC (MP: >250 ºC) [24-25]. 1H NMR (500 MHz, CDCl3): δ 5.54 (d, JHP = 14.5 Hz, 2H, –CH2), 6.72 – 6.74 (d, 1H), 6.84 – 6.87 (m, 1H), 7.02-7.08 (m, 2H), 7.58-7.61 (m, 6H), 7.72-7.77 (m, 9H) ppm.

(2,3-Difluorobenzyl)-Triphenylphosphonium Bromide (3d)

Colourless powder. Yield 98%, Melting point: 293 ºC (MP: 292.7 ºC) [26]. 1H NMR (500 MHz, CDCl3) δ 5.52 (d, JHP = 14.5 Hz, 2H, -CH2), 6.89 (m, 1H), 7.97 – 7.05 (m, 1H), 7.29 (pt, J = 6 Hz, 1H), 7.64 – 7.58 (m, 6H), 7.71-7.78 (m, 9H) ppm.

(3,4-Difluorobenzyl)-Triphenylphosphonium Bromide (3e)

Colourless powder. Yield 97%, Melting point: 315 ºC (MP: 315 ºC) [27]. 1H NMR (500 MHz, CDCl3) δ 5.67 (d, JHP = 15 Hz, 2H, – CH2), 6.81 (pq, J = 9.5, 8.5 Hz, 1H), 6.96 (dt, J = 11, 8, 2 Hz, 1H), 7.00- 7.05 (m, 1H), 7.55-7.60 (m, 6H), 7.69-7.80 (m, 9H) ppm.

(2,4-Difluorobenzyl)-Triphenylphosphonium Bromide (3f)

Colourless powder. Yield 97%, Melting point: 258 ºC (MP: 258 ºC) [5]. 1H NMR (500 MHz, CDCl3): δ 5.48 (d, JHP = 14 Hz, 2H, – CH2), 6.53 – 6.56 (m, 1H), 6.69 – 6.72 (m, 1H), 7.59 – 7.63 (m, 7H), 7.73 – 7.77 (m, 9H) ppm.

(3-Iodobenzyl)-triphenylphosphonium Bromide (3g)

Colourless powder. Yield 87%, Melting point: 291 ºC (MP: 295- 298 ºC) [5]. 1H NMR (500 MHz, CDCl3): δ 5.46 (d, JHP = 15 Hz, 2H, –CH2), 6.83 – 6.86 (t, J = 8 Hz, 1H), 7.04 (s, 1H), 7.37 (d, 1H), 7.48 (d, 1H), 7.58 – 7.65 (m, 6H), 7.89 – 7.72 (m, 9H) ppm.

(4-Iodobenzyl) triphenylphosphonium Bromide (3h)

Colourless powder. Yield 95%, Melting point: 254 ºC (MP: 255- 256 ºC) [28, 29]. 1H NMR (500 MHz, CDCl3) δ 5.52 (d, JHP = 15 Hz, 2H, –CH2), 6.90 (dd, J = 8.5, 2.5 Hz, 2H), 7.39 (dd, J = 8.5, 1 Hz, 2H), 7.57 – 7.62 (m, 6H), 7.71 – 7.78 (m, 9H) ppm.

(3-Methyoxybenzyl)-triphenylphosphonium Bromide (3i)

Colourless powder. Yield 88%, Melting point: 262 ºC (MP: 261.7 ºC) [5]. 1H NMR (500 MHz, CDCl3): δ 3.45 (s, 3H, –OCH3), 5.22 (d, JHP = 14.4 Hz, 2H, –CH2), 6.57 (m, 1H), 6.99 (m, 2H), 6.94 (t, J = 8 Hz, 2H), 7.56 (td, J = 8, 4 Hz, 6H), 7.67-7.72 (m, 9H) ppm.

(4-Methyoxybenzyl)-triphenylphosphonium Bromide (3j)

Colourless powder. Yield 88%, Melting point: 248 ºC (MP: 234- 235 ºC) [5, 30]. 1H NMR (500 MHz, CDCl3): δ 3.69 (s, 3H, -OCH3), 5.25 (d, JHP = 14 Hz, 2H, –CH2), 6.62 (d, J = 9 Hz, 2H), 6.98 (t, J = 9, 3 Hz, 2H), 7.60 (td, J = 8, 4 Hz, 6H), 7.66 – 7.76 (m, 9H), ppm.

(3,5-Dimethyoxybenzyl)-triphenylphosphonium Bromide (3k)

Colourless powder. Yield 88%, Melting point: 267 ºC (MP: 264- 265 ºC) [31]. 1H NMR (500 MHz, CDCl3): δ 3.47 (s, 6H, 2 × -OCH3), 5.22 (d, JHP = 14.0 Hz, 2H, –CH2), 6.24 (q, J = 2.3 Hz, 1H), 6.28 (t, J = 2.5 Hz, 2H), 7.61 – 7.56 (m, 6H), 7.75 – 7.67 (m, 9H) ppm.

(4-Methylthiobenzyl)-triphenylphosphonium Bromide (3l)

Colourless powder. Yield 88%, Melting point: 234 ºC (MP: 232.9 ºC) [5]. 1H NMR (500 MHz, CDCl3): δ 2.36 (s, 3H, –CH3), 5.34 (d, J = 14.5 Hz, 2H, –CH2), 6.92 (d, 2H), 6.99 – 7.02 (dd, 2H), 7.61 – 7.56 (m, 6H), 7.68-7.74 (m, 9H) ppm.

(3-Trifluoromethoxybenzyl)-triphenylphosphonium Bromide (3m)

Colourless powder. Yield 97%, Melting point: 294 ºC (MP: 309- 310 ºC) [26]. 1H NMR (500 MHz, CDCl3) δ 5.65 (d, JHP = 14.5 Hz, 2H, –CH2), 6.78 (s, 1H), 7.02 (d, J = 8 Hz, 2H), 7.15 (d, J = 8 Hz, 2H), 7.34 (dd, J = 8 Hz, 2H), 7.57 – 7.62 (m, 6H), 7.71 – 7.79 (m, 9H) ppm.

(4-Trifluoromethoxybenzyl)-triphenylphosphonium Bromide (3n)

Colourless solid. Yield 97%, Melting point: 314 ºC (MP: 309- 310 ºC) [32]. 1H NMR (500 MHz, CDCl3) δ 5.67 (d, JHP = 14.5 Hz, 2H, –CH2), 6.95 (d, J = 9 Hz, 2H), 7.26 (dd, J = 9, 3 Hz, 2H), 7.63 – 7.58 (m, 6H), 7.81 – 7.73 (m, 9H) ppm.

(Pyridine-2-yl-methyl)-triphenylphosphonium Bromide (3o)

Light yellow powder, Yield 26%, Melting point: 116.2 ºC (MP: 116 ºC) [5]. 1H-NMR (500 MHz, CDCl3): δ 6.13 (d, JHP = 15.0 Hz, 2H, –CH2), 7.64 (td, J = 8, 4 Hz, 6H), 7.71 (d, J = 8 Hz, 1H), 7.75 – 7.90 (m, 6H), 8.09 (t, J = 7.4 Hz, 1H), 8.22 (d, J = 7.4 Hz, 1H), 8.32 (d, J = 1.6 Hz, 1H), 8.34 (d, J = 6.2 Hz, 2H), 8.65 (d, J = 6 Hz, 1H) ppm.

(Naphthalen-2-ylmethyl)-triphenylphosphonium Bromide (3p)

Colourless powder. Yield 90%. Melting point: 254 ºC (MP: 248- 251 ºC) [5]. 1H NMR (500 MHz, CDCl3): δ 5.49 (d, JHP = 14.5 Hz, 2H –CH2), 7.10 (td, 1H), 7.30 – 7.40 (m, 2H), 7.48 (d, 3H), 7.53-7.58 (m, 6H), 7.65 (d, 1H), 7.74 – 7.68 (m, 9H) ppm.

(Anthracen-2-ylmethyl)-triphenylphosphonium Bromide (3q)

Light yellow powder. Yield 13%. Melting point: 306 ºC. 1H NMR (500MHz, CDCl3): δ 6.34 (d, JHP = 14.2 Hz, 1H, –CH2), 7.10 (dd, J = 8.3, 7.2 Hz, 1H), 7.22 (t, J = 7.5 Hz, 1H), 7.44 (td, J = 8, 3.5 Hz, 3H), 7.56 (m, 3H), 7.62 (t, J = 7.1 Hz, 2H), 7.87 (dd, J = 9 Hz, 2H), 8.34 (d, J = 3.5 Hz, 1H) ppm.

(7-methoxy coumarin-4-yl-methyl)- triphenylphosphonium Bromide (3r)

Colourless powder. Yield 73%. Melting point: 279 ºC. 1H NMR (500MHz, CDCl3): δ 3.74 (s, 1H, –OCH3), 5.99 (d, J = 4.3 Hz, 1H, – CH2), 6.08 (d, JHP = 16.8 Hz, 1H), 6.42 (d, J = 2.5 Hz, 1H), 6.44 (d, J = 2.5 Hz, 1H), 6.46 (d, J = 2.5 Hz, 1H), 7.53 (td, J = 8, 4 Hz, 1H), 7.66 (m, 1H), 7.79 (d, J = 9 Hz, 1H), 7.96 (m, 1H) ppm.

(Anthraquinone-2-yl-methyl)-triphenylphosphonium Bromide (3s)

Colourless powder. Yield 73%. Melting point: 279 ºC. 1H-NMR (500MHz, CDCl3): δ 5.89 (d, JHP = 15.4 Hz, 1H, –CH2), 7.58 (t, J = 2 Hz, 1H), 7.63 (td, J = 8, 3.5 Hz, 3H), 7.72 (m, 1H), 7.77 (m, 2H), 7.84 (ddd, J = 13, 8, 1 Hz, 3H), 8.00 (d, J = 8.0 Hz, 1H), 8.06 (m, 1H), 8.13 (m, 1H) ppm.

Synthesis of Wittig reagents (substitutedbenzyltriphenylphosphonium bromide) from substitutedbenzylhalides and triphenylphosphine was straightforward as depicted in scheme 1. Initially, the condition was optimized using triphenylphosphine (1) and benzyl bromide (2a) as starting materials [equation (i)] (Figure 1).

biomedres-openaccess-journal-bjstr

Scheme 1: Microwave irradiation method for the preparation of phosphonium salts.

biomedres-openaccess-journal-bjstr

Figure 1.

Various conditions, such as room temperature (°C), heating, reflux, different solvents, different molar ratios, powers (watt), pressures (bar), and times (t) were applied to optimize the reaction conditions and summarized in Table 1. From the optimization study table (Table 1), it appears that yields were increased when microwave irradiation was applied to the reaction mixture. Moreover, it saves time as the duration of the reaction was reduced to only 30 minutes. THF acts as the best solvent as it can dissolve triphenylphosphine well, and it also has dielectric properties that are crucial for microwave irradiation reactions. Under these optimal reaction conditions, phosphonium salts (3a-s) were synthesized (Scheme 1). The product formation was considered when a precipitate was observed.

biomedres-openaccess-journal-bjstr

Table 1: Optimization for the synthesis of benzyltriphenylphosphonium bromide salt 3a.

aDecomposition of products; b Temperature was not mentioned, starting materials were liquids

Conclusion

Conventional and microwave irradiation methods were applied for the preparation of eighteen Wittig reagents. Various temperature (°C), power (watt), time (t) and solvents were optimized for the method development of substituted-benzyltriphenylphosphonium bromides. We found, using THF at 60 ºC for 30 min at 800-watt substituted-benzylhalides and triphenylphosphine gave good to quantitative yields. Therefore, this method is simple, efficient and has an advantage over the reported method.

Acknowledgements

The authors gratefully acknowledge the grant from the Ministry of Science, Technology and Innovation, Malaysia (MOSTI) (Biotech Grant Number-30600007001).

For More Articles: Biomedical Journal Impact Factor: https://biomedres.us