Open Access Journals On Zoology, Faculty of Science

Larvicidal Activity of the Leaf Extracts and Powder of Millettia aboensis Against Larvae of Anopheles gambiae s. l. Collected from Lafia, Nasarawa State, Nigeria

Introduction

Mosquitoes are an important group of insects of public health importance, which transmit human diseases like filariasis, Dengue, Malaria, Japanese encephalitis and yellow fever, resulting in millions of deaths worldwide every year [1]. Malaria is the most prevalent mosquito-borne disease, globally affecting about 3.5 billion persons per annum and the causative pathogen (Plasmodium) is vectored by the Anopheles mosquito [2,3]. An. gambiae is an effective vector of human malaria and lymphatic filariasis (el ephantiasis). Despite several efforts in controlling this vector, the medical and economic burdens caused by it continue to grow [4]. The failure in current control measures and the growing insecticide resistance is necessitating the search for newer and more effective control strategies [5]. One of the approaches for controlling this mosquito borne disease is to interrupt the disease transmission through mosquito control or avoiding mosquito bite. The primary public health intervention for reducing malaria transmission at the community level is through vector control and it is the only intervention that can reduce malaria transmission from very high levels to close to zero [3]. Among the most preferred target for mosquito control is the larval stage, because the larva has low mobility, making treatment to be easily localized in time and space as compared to the adult stage [6]. Many approaches have been developed to prevent mosquito menace and the diseases they spread. One of such strategies has been based on the use of synthetic insecticides to interrupt the disease transmission cycle by either targeting the mosquito larvae at breeding sites (through spraying of stagnant water) or by killing or repelling the adult mosquitoes [7]. Though effective, these have created problems like toxicity to humans and non-target populations, long persistence in environment and entry in the food chain [8]. These problems have necessitated the need to develop environmentally safe, biodegradable, economical and indigenous methods of vector control that can be used with minimum care by individuals and communities [9].
Plant products with potentials to act as insecticides or repellent can play an important role in the interruption of transmission of mosquito borne disease at the individual as well as community level [10]. The secondary metabolites in different plants make up a vast repository of compounds with a wide range of biological activities [11]. Millettia aboensis has been used by traditional medicinal practitioners to manage constipation, respiratory difficulties, colds and headaches [12]. The ethanol extract of the root is also used in the study of anti-inflammatory, antioxidant and antimicrobial activity and also macerated root in alcohol is used to treat hernias and jaundice [13]. This study aims to investigate the larvicidal potential of Millettia aboensis against larval stages of Anopheles gambiae.

Materials And Methods

Study Area

This study was conducted in the Federal University of Lafia, Nasarawa state. The City of Lafia, Capital of Nasarawa State has farming as the main occupation of its residents, and it boasts crops such as cassava, yam, rice, maize, guinea corn, beans, soya beans, asha, groundnut, vegetables, sugar cane and millet. Also present in the State are mineral resources like columbite, coal and aquamarine. Residents in this area are prone to mosquito-borne diseases as a result of their farming activities [14].

Plant Sample Collection and Identification

Millettia aboensis plant leaves were sought for and collected locally from farmlands around the Lafia metropolis, Nasarawa State, Nigeria. The plant collected was identified and authenticated botanically at the Federal College of Forestry, Jos, with Herbarium Number 235.

Preparation and Extraction of Plant Sample

Leaves of M. aboensis were washed and air dried at room temperature, devoid of sunlight. Dried samples were ground into powdered form using mortar and pestle and then sieved to get fine powder, which was seperated into two portions. One portion of the powdered plant material was further divided into two parts and then each part (400g each) extracted with methanol (4 litres) and distilled water (4 litres) by maceration [8]. The extract was filtered and allowed to evaporate to dryness at room temperature (31oC). The dried extract was then transferred into an air-tight container and preserved in the refrigerator, prior to use.

Qualitative/Quantitative Phytochemical Screening of Millettia Aboensis

The leaf extracts of M. aboensis was screened for phytochemical constituents at the National Research Institute for Chemical Technology (NARICT), Zaria, utilizing standard methods of analysis [15-18].

Mosquito Larvae Collection and Identification

Anopheles gambiae larvae were collected from rock pools made as a result of quarrying activity in Arikpa-Randa, Nasarawa Eggon, Nasarawa State, located at latitude 08°41.408’N and longitude 008°20.835’E. The collected larvae were colonized in the laboratory in Department of Zoology, Federal University of Lafia prior to larvicidal test, and species identified using taxonomic key by [10]. The larvae were fed by adding finely ground powdered yeast on the surface of the water.

Larvicidal Test

Bioassay was carried out according to the WHO standard procedures for laboratory testing of mosquito larvicides [19]. The methanol leaf extract of M. aboensis were evaluated using different concentrations of 25, 50, 75, 125 and 250 mg/ml. Distilled water only (100 ml) was used as negative control, while distilled water (100 ml) to which 1 ml methanol was added was used as positive control. Twenty larvae of each mosquito species were put into each of seven disposable 250 ml bowls (controls inclusive) containing 100 ml of distilled water, to which a measured concentration of the test solution was added. Larval mortality was counted at 24, 48 and 72 hours after treatment. Mortality was calculated at each time interval, replicated four times and the results used to determine the LC50 and LC90 values for the extract by Probit analysis. Larvae were considered either alive, if they were clearly moving normally, or dead when there is no movement and no response to gentle probing on the abdomen with a needle. The interpretation of the mortality rate of Anopheles larvae based on WHO [19] susceptibility tests was:

a) Mortality rate between 98 – 100% within the diagnostic time, indicates susceptibility.
b) Mortality rate between 80 – 97% suggest possible resistance.
c) Mortality rate < 80% indicates resistance.
The percentage mortality was calculated by employing the formula as propounded by [19] as:

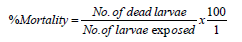
The Corrected percentage mortality was used when a proportion of the insects in the control batches died during the experiment. This was applied using Abbott’s formula [20], represented as:

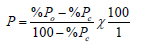
Where: P = Corrected Mortality
Po = Observed Mortality
Pc = Control Mortality, all expressed in percentages.

Determination of LC50 and LC90

Lethal concentrations (LC50 and LC90) were determined by Probit analysis as described by Finney [21] for both samples at the different concentrations and times used in this study. The LC50 and LC90 are the lethal concentrations of the extract that kills 50% and 90%, respectively of the larval population. It is important to note that the lower the LC50 and LC90, the more effective the larvicidal efficacy of the extract. Microsoft Excel regression probit analysis was employed. Percentage mortalities were converted to probits by looking up the percentage in Finney’s table. The log of concentrations is calculated. A graph of probits versus the log of concentration is plotted to fit a line of regression. Extrapolating the probit of 5 in the y-axis to the x-axis followed by taking the inverse of log of the extrapolated value on the x-axis gives the LC50. A similar procedure was used to determine the LC90.

Statistical Analysis

Data obtained were analyzed using R Console software (Version 2.9.2). Mortality rate of the Anopheles larvae in relation to concentrations of extracts were compared using Pearson’s Chisquare test. P-value < 0.05 was considered statistically significant.

Results and Discussion

Results of qualitative and quantitative phytochemical screening of the leaves of M. aboensis showed that flavonoids was present in very high concentration from both extracts and leaf powder (Table 1). Flavonoids are hydroxylated phenolic substances synthesized by plants in response to microbial infection. They are also effective antioxidants, helping in the removal of oxidant free radicals [22,23]. They are health promoting compounds due to their active radicalscavenging potential [24].

biomedres-openaccess-journal-bjstr

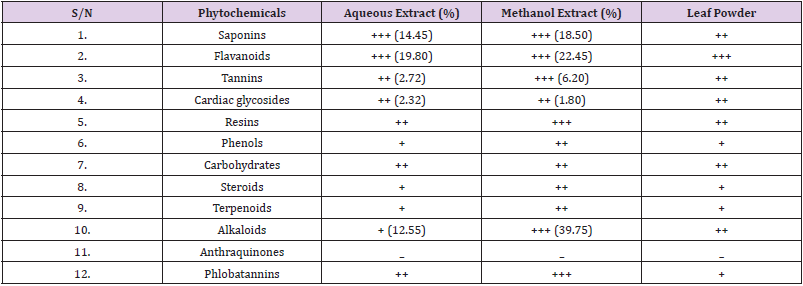
Table 1: Results of Phytochemical Tests on Leaf Extracts and Leaf Powder of M. aboensis.

Key
+++ = Present in very high concentration
++ = Present in moderately high concentration
+ = Present in low concentration
– = Not Detected

Larvicidal Activity of Leaf Extracts and Powder of M. aboensis against Anopheles gambiae larvae

Results of mortality rates recorded against An. gambiae by methanol, aqueous and leaf powder extract at varying concentrations (25-250 mg/ml) are presented in Table 2.

biomedres-openaccess-journal-bjstr

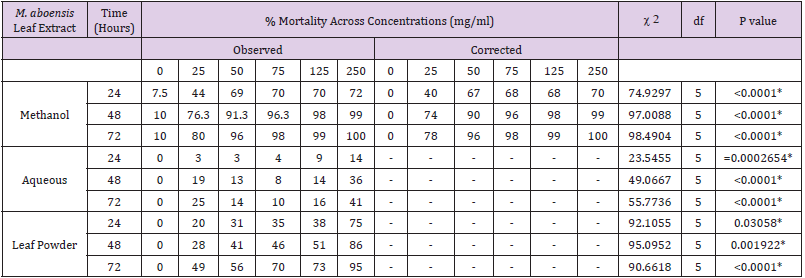
Table 2: Percentage Mortality of An. gambiae Larvae exposed to Extracts Millettia aboensis in relation to Time.

*: Significant

Exposure to Methanol Extract

At 24 hours, 250 mg/ml concentration recorded highest mortality rate of An. gambiae larvae (70%) followed by 125 mg/ ml and 75 mg/ml (68%) then 50 mg/ml (67%), 25 mg/ml (40%), while no mortality was recorded at 0 mg/ml (Table 2). There was a very high significant difference (χ 2 = 74.9297, df = 5, P < 0.0001) in mortality rate of An. gambiae larvae in relation to concentrations of methanolic extract of the leaf of M. aboensis. The larvae were resistant at 24 hours to the larvicidal activity of methanolic extract of the leaf of M. aboensis. At 48 hours, 250 mg/ml concentration had the highest mortality rate of An. gambiae larvae (99%), 125 mg/ml (98%), 75 mg/ml (96%), 50 mg/ml (90%), 25 mg/ml (74%), whereas no mortality was recorded at 0 mg/ml (Table 2). Hence, there was a very high significant difference (χ 2 = 97.0088, df = 5, P < 0.0001) in mortality rate of An. gambiae larvae in relation to concentrations. The larvae were susceptible at 125- 250 mg/ml concentrations but showed possible resistance at 50- 75mg/ml concentration but were however resistant at 25 mg/ml concentration.

A. gambiae larvae were predominantly killed (100%) by 250 mg/ ml concentration at 72 hours period followed by 125 mg/ml (99%) then 75 mg/ml (98%), 50 mg/ml (96%), 78 mg/ml (20%), but no mortality was recorded at 0 mg/ml (Table 2). Therefore, there was a very high significant difference (χ 2 = 98.4904, df = 5, P < 0.0001) in mortality rate of An. gambiae larvae in relation to concentrations. The larvae were susceptible at 75-250mg/ml concentration, and indicated possible resistance at 50mg/ml, but were resistant at 25 mg/ml concentration. The results obtained showed progressive increase in percentage mortality as concentrations increased. The findings are in agreement with studies by Dakum [25] and Abok et al. [26] who investigated the larvicidal potency of the methanol leaf extract of H. suaveolens against An. gambiae larvae, a possible reason being the similarity in the use of solvent for extraction, the same mosquito species tested, and the same Protocol applied for larvicidal testing. This agrees with the findings of Kholhring [27], who investigated the mosquitocidal activity of M. pachycarpa on the larvae and eggs of Ae. aegypti, recording peak mortality at the highest concentration of the extract, after total exposure time. A possible reason for this may be the similarities in the use of plant species from the same family and similar solvents used for extraction.

Exposure to Aqueous Extract

At 24 hours exposure time, highest mortality rate of An. gambiae (14%) was observed at 250 mg/ml concentration followed by 125 mg/ml (9%), 75 mg/ml (4%), 50 mg/ml and 25 mg/ml (3%) while no mortality was recorded at 0 mg/ml (Table 2). Therefore, there was significant difference (χ 2 = 23.5455, df = 5, P=0.0002654) in mortality rate of An. gambiae larvae in relation to concentrations of aqueous extract of the leaf of M. aboensis. The larvae were resistant at 24 hours exposure. The 250 mg/ml concentration had the highest mortality rate of An. gambiae larvae (36%) at 48 hours followed by 25 mg/ml (19%), 125 mg/ml (14%), 50 mg/ml (13%) and 75 mg/ ml (8%), whereas no mortality was recorded at 0 mg/ml (Table 2). Thus, there was a very high significant difference (χ 2 = 49.0667, df = 5, P < 0.0001) in mortality rate of An. gambiae larvae in relation to concentrations. The larvae at 48 hours were resistant. The mortality rate of An. gambiae larvae was highest (41%) at 250 mg/ ml concentration during the 72 hours exposure period followed by 25 mg/ml (25%), 125 mg/ml (16%), 50 mg/ml (14%) and 75 mg/ ml (10%), while no mortality was recorded at 0 mg/ml (Table 2). Hence, there was a very high significant difference (χ 2 = 55.7736, df = 5, P < 0.0001) in mortality rate of An. gambiae larvae in relation to concentrations. The larvae were resistant at this hour.
After 24 hours of larval exposure to aqueous leaf extract, the result demonstrated very slow increase in percentage mortality as concentrations increased. At 48 hours exposure period, larval mortality showed an irregular pattern as mortality was high at 25 mg/ml concentration, but started to decline steadily at 50-75 mg/ ml. There was a sudden increase in mortality as concentration was increased to 125 mg/ml and peak mortality was recorded at 250 mg/ml. This gave an irregular pattern of larval mortality. After 72 hours exposure period, there was a similar irregular mortality rate pattern. Larval mortality was high at 25 mg/ml concentration, but started to decline steadily from 50-75 mg/ml. There was a sudden increase in mortality as concentration was increased to 125 mg/ ml and peak mortality was recorded at 250 mg/ml. This irregular pattern of larval mortality also gave an undulating mortality rate curve. A possible explanation for the irregular mortality rates recorded at the 24th and 72nd hour may be that the larvae developed some resistance to initial dose of the aqueous extract and were able to tolerate higher doses, but however lost their resistance when concentration was increased to the maximum. This result disagrees with the findings of Meenakshi and Jayaprakash [28] who investigated the mosquito larvicidal efficacy of leaf extract from mangrove plant Rhizophora mucronata against Anopheles and Aedes species and recorded 100% larval mortality at all concentrations after 48 hours exposure period.
Dakum et al. [25] and Abok et al. [26] who conducted similar experiments, recorded peak mortality at all concentration of the extract after 72 hours exposure time, which disagrees with the findings from the current experiment. The variations in results may be due to the conditions under which the experiments were conducted and the locations from which the larvae were collected and the variations in plant species used for extraction and larvicidal testing.

Exposure to Leaf Powder

At 24 hours, 250 mg/ml concentration recorded highest mortality rate of An. gambiae larvae (78%), followed by 125 mg/ml (38%), 75 mg/ml (35%), 50 mg/ml (31%), 25 mg/ml (20%), while no mortality was recorded 0 mg/ml (Table 2). Therefore, there was a significant difference (χ 2 = 92.1055, df = 5, P = 0.03058) in mortality rate of An. gambiae larvae in relation to concentrations of the leaf powder of the leaf of M. aboensis. The larvae were resistant at 24 hours. At 48 hours, 250 mg/ml concentration recorded highest mortality rate of An. gambiae larvae (86%), followed by 125 mg/ml (51%), 75 mg/ml (46%), 50 mg/ml (41%), 25 mg/ml (28%), while no mortality was recorded at 0 mg/ml (Table 2). There was a significant difference (χ 2 = 95.0952, df = 5, P = 0.001922) in mortality rate of An. gambiae larvae in relation to concentrations. The larvae showed possible resistance at 250 mg/ml concentration but were susceptible however at 25 – 125 mg/ml concentrations. At 72 hours, 250 mg/ml concentration recorded highest mortality rate of An. gambiae larvae (95%), followed 125 mg/ml (73%), 75 mg/ml (70%), 50 mg/ml (56%), 25 mg/ml (49%), while no mortality was recorded at 0 mg/ml (Table 2). There was a very high significant difference (χ 2 = 50.6667, df = 4, P < 0.0001) in mortality rate of An. gambiae larvae in relation to concentration. The larvae showed possible resistance at 250 mg/ml concentration but were however resistant at 25 – 125 mg/ml concentrations.
The results obtained demonstrated progressive increase in percentage mortality as concentrations increased. A possible reason for susceptibility recorded may be the fact that the leaf powder used up the dissolved oxygen available in the water, making it difficult for the mosquito species to survive. Chukwujekwu et al. [29]. who investigated the antiplasmodial diterpenoids from the leaves of H. suaveolens recorded similar finding. Also, Ombugadu et al. [30] recorded an increase in mortality of Anopheles larvae with increase in dosage of Capsicum chinensis.

Comparison of the Efficacy of Three Treatments

The larvae of An. gambiae showed progressive increase in mortality after 24 hours exposure period. The methanol leaf extract showed greater efficacy than the aqueous leaf extract and the leaf powder. However, at 250 mg/ml, the leaf powder was more effective, recording the highest mortality than the methanol and aqueous leaf extracts. A possible explanation to this occurrence may be that larval mortality resulted from pollution of test habitat caused by the 250mg/ml concentration of the leaf powder, which may have caused a decline in the amount of dissolved oxygen available for the juvenile larval population. This event may have promoted larval mortality at that concentration and time. This result disagrees with the findings of Dakum et al. [25]. who recorded recorded higher mortality rates of An. gambiae exposed to concentrations of the methanol leaf extract of H. suaveolens than those exposed to the aqueous leaf extract of the same plant. After 48-hour exposure period, larval mortality showed progressive increase at all concentrations. The methanol leaf extract proved to be more effective than the aqueous leaf extract and leaf powder, with peak mortality recorded at 99% of the methanol leaf extract at 250 mg/ml. This is in agreement with the findings of Meenakshi and Jayaprakash [28], who also recorded higher mortality rates of An. gambiae and Ae. aegypti larvae exposed to the methanol leaf extract of Rhizophora mucronata.

After 72 hours exposure period, larval mortality showed progressive increase at all concentrations. The methanol leaf extract proved to be more effective than the aqueous leaf extract and leaf powder

Lethal Concentration of Leaf Extracts and Powder of M. aboensis

LC50 and LC90 values for Anopheles species in relation to leaf extracts and powder of M. aboensis are presented in Tables 3 & 4 respectively. Table 3 shows that the methanol leaf extract would be the most effective to use in order to yield 50% mortality rate at 24, 48 and 72 hours against An. gambiae larvae. The leaf powder would be most effective in order to yield 90% mortality rate at 24 hours, while the methanol leaf extract would be most effective to kill 90% of Anopheles gambiae larvae at 48 and 72 hours Table 4.

biomedres-openaccess-journal-bjstr

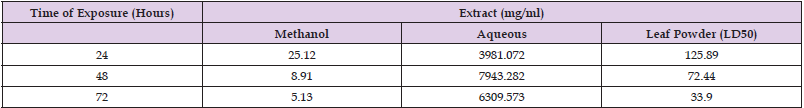
Table 3: LC50 for An. gambiae larvae Exposed to Leaf Extracts of Millettia aboensis.

biomedres-openaccess-journal-bjstr

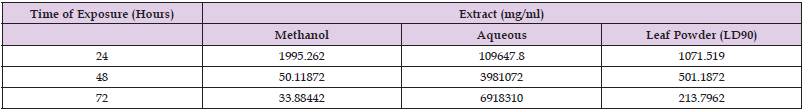
Table 4: LC90 for An. gambiae larvae Exposed to Leaf Extracts of Millettia aboensis.

Conclusion

Results obtained established that the methanol and aqueous leaf extracts, and leaf powder of M. aboensis can be used as an alternative to synthetic insecticides in control of Anopheles gambiae larvae at high concentrations. It is recommended that the extracts could be merged with various Pest Management programs. Repercautions of extracts on non-target organisms should also be investigated before its recommendation for use in vector control programme and commercial production.

For More Articles: Biomedical Journal Impact Factor: https://biomedres.us

Open Access Journals On Laboratory of Neuroscience and Pharmacological

Intravenous Repetitive Injection of Lidocaine Associated with Pregabalin Enhances Oxidative Stress Parameter in Fibromyalgia Patients’ Blood: A Randomized Trial

Introduction

Fibromyalgia syndrome (FMS) is a clinically well-defined disease of extra-articular rheumatologic origin with an estimated 2-4% prevalence. It is the most found chronic musculoskeletal pain condition, and its etiology is still unknown [1]. Its symptoms also include non-recoverable sleep patterns, cognitive dysfunction, headache, morning stiffness, fatigue, depression, and anxiety [2]. Oxidative stress is an imbalance between oxidation products and antioxidant defenses and has recently been associated with several events in the pathogenesis of FMS [3,4]. Patients with FMS have decreased levels of glutathione (GSH) and increased lipoperoxidation in blood and plasma, which seems to be associated with a worsening of patients’ clinical condition [5]. The pathology of fibromyalgia (FM) causes a negative regulation of catalase activity in patients’ erythrocytes and leukocytes [6,7]. Research has also described the effects of antioxidant redox systems, levels of protein carbonylation and lipoperoxidation on the pathogenesis of FMS, and increased oxidative stress is strongly associated with the FMS severity [5]. Thus, managing the oxidative profile can be a promising approach to optimize the FMS treatment, although there is a little-explored gap in this profile. There is still no specific pharmacological therapy to date to relieve such syndrome, and the currently available drugs are used to manage symptoms. Although there are drugs that can treat FMS symptoms, such as neuromodulators, antidepressants, and muscle relaxants, some side effects and their low efficacy have been reported to limit therapeutic adherence. Lidocaine is an aminamide-type local anesthetic with fast onset, safety profile, low cost, and wide availability. It inhibits neuron-dependent voltagegated sodium channels, reducing the nervous signal conduction and consequently blocking pain. Intravenous lidocaine showed positive results in treating acute and chronic neuropathic pain syndromes, such as trigeminal neuralgia and peripheral nerve damage. However, the role of intravenous lidocaine injection in FMS needs to be clarified.
Pregabalin was the first drug approved by the Food and Drug Administration (FDA) to treat FMS. Its structure is similar to the gamma-aminobutyric acid (GABA) neurotransmitter, without pharmacological action in this way, but in voltage-dependent calcium channels [8]. Few studies have reported using lidocaine with pregabalin to manage FM, and we have not found reports of studies valuating the oxidation parameters of FM patients with this treatment. Therefore, the hypothesis that there could be an effect on oxidative stress allowed us to assess its correlation with oxidative symptoms and parameters.

Methodology

Ethical Aspects

The Ethics Committee of the Federal University of Sergipe (UFS) approved the clinical study opinion No. 2.637.928 (Certificate of Presentation for Ethical Consideration (CAAE) protocol No. 85503418.2.0000.5546). All subjects who volunteered for the trial were women included in the study only after signing the free and informed consent form. The Universal Trial Number (UTN) is U1111-1257-3477. ReBEC trial: (req:10410) Benefits of innovative treatment for women with fibromyalgia: a procedure to follow.

Experimental Groups and Schematic Design of Experiments

Forty-eight female patients who met the 2016 American College of Rheumatology (ACR) FMS classification criteria were enrolled. The inclusion/exclusion criteria adopted in the study excluded patients with other comorbidities such as epilepsy, recent trauma (≤ 3 months), psychiatric and rheumatic disorders, moderate or severe neuromuscular disorders, hypothyroidism or hyperthyroidism, infectious arthroplasty, other chronic pain syndromes, hypersensitivity to drugs, and neoplasms disorders.
Twenty-four patients formed two groups randomly.
Pregabalin Group (GP): Women taking 150 mg pregabalin daily and submitted to a hospital procedure performed at the surgical center for an intravenous administration of 0.9% physiological solution for three consecutive weeks.
Pregabalin/lidocaine Group (GPL): Women taking 150 mg pregabalin daily and submitted to a hospital procedure performed at the surgical center for intravenous administration of lidocaine (3 mg.kg) for three consecutive weeks.
FM patients valuated for five weeks. The experimental procedure schematic design shown in Figure 1. The lidocaine infusion was applied at the third (T2), fourth (T3), and fifth (T4) weeks. The FIQ and VAS questionnaires were performed at the first (T0), second (T1), third (T2), fourth (T3), and fifth (T4) weeks.
All patients took pregabalin (150 mg.kg) for treatment as the therapeutic protocol of the HU-UFS outpatient clinic. Thus, since our research ethics committee did not authorize an experimental group of fibromyalgia patients treated with lidocaine alone, they used the previous pregabalin because it is a pain clinic, which is a limitation of this study Table 1 and Table 2.

biomedres-openaccess-journal-bjstr

Table 1: Demographic features of patients.

Note: BMI, body mass index; GPL, pregabalin/lidocaine group; GP, pregabalin group; R, Rank-Biserial Correlation. Values are expressed in means ± SD. Mann-Whitney Test.

biomedres-openaccess-journal-bjstr

Table 2: Intensity of resting pain (EVA score) and Impact of Fibromyalgia (FIQ score) determined in initial time (T0) and final time (T5).

Note: BMI, body mass index; GPL, pregabalin/lidocaine group; GP, pregabalin group; R, Rank-Biserial Correlation; T0, initial time; T5, final time. Values are expressed in means ± SD. Mann-Whitney Test

biomedres-openaccess-journal-bjstr

Figure 1.

Fibromyalgia Impact Questionnaire (FIQ score)

The FMS functional status was valuated by the FM impact questionnaire (FIQ). The questions aimed to highlight well-being and the loss of daily work, difficulty to work, fatigue, pain, and well-being in the morning after waking up, stiffness, anxiety, and depression. High scores showed functional limitations [9].

Intensity of Resting Pain (VAS score)

A numerical scale of 11 points measured the intensity of the pain according to how intense patients report the pain to be, in which 0 is considered painless and 10 is the worst pain. The test is an analogic visual scale completed by the patients themselves [10]. The FMS functional status was valuated by the FM impact questionnaire (FIQ). The questions aimed to highlight well-being and the loss of daily work, difficulty in working, fatigue, pain, and well-being in the morning after waking up, stiffness, anxiety, and depression. High scores showed functional limitations [9]. The visual analog scale (VAS) is a subjective measure validated for acute and chronic pain. Patients reported their scores by making a handwritten mark on a 10 cm line representing a continuum between “no pain” and “worst pain”.

Biochemical Measures

Blood Collection and Preparation of Blood Samples

During the second and third trials, corresponding to the second and third weeks, venous blood samples of all individuals were collected in test tubes with no anticoagulant or EDTA. Fresh whole blood samples were separated and used for determined reduced glutathione (GSH) and lipoperoxidation. A portion of EDTA-blood was centrifuged for 10 minutes at 3000 xg to separate plasma and erythrocytes that were then washed three times with PBS and kept frozen at -80°C until analysis for activities of RBC antioxidant enzymes, reduced sulfhydryl groups, and ferric reducing ability of plasma (FRAP).

Ferric-Reducing Ability (FRAP assay)

FRAP level in plasma was measured according to the method by Benzie and Strain, as described previously [11]. The plasma samples were mixed with a reagent mixture containing acetate buffer (pH 3.6), 5 mM tripyridyltriazine in 40 mM HCl, and 20 mM ferric chloride. Absorbance was assessed at a 593 nm wavelength. FRAP values were expressed as μg/mg protein.

Reduced Sulfhydryl Groups and GSH Determination

To measure the levels of reduced thiol (-SH) groups in protein and nonprotein fractions from plasma, an 80 𝜇g sample aliquot reacted with a 10 mM 5,5- dithionitrobis 2-nitrobenzoic acid. After 60 minutes of incubation at room temperature, the absorbance was read in a spectrophotometer set at 412 nm [12].

Lipid Peroxidation Level Determinations

Lipoperoxidation levels in the total blood samples were measured with the thiobarbituric acid reaction according to the method by (Draper & Hadley 1990 [13].

Catalase Activity

Catalase activity was assayed in blood cell lysates by measuring the hydrogen peroxide (H2O2) absorbance decrease ratio in a spectrophotometer at 240 nm [14].

Superoxide Dismutase Activity

Superoxide dismutase (SOD) activity was determined in blood cell lysates from the inhibition of superoxide anion-dependent adrenaline autoxidation in a spectrophotometer at 480 nm as previously described [15].

Statistical Analysis

The results were expressed as a mean ± S.E.M or mean ± S.D. Samples were assessed for normal distribution according to the Shapiro-Wilk test. Differences between the two groups were analyzed using the Mann-Whitney U test for independent samples or the Wilcoxon test for dependent samples. The rank-biserial correlation was used as a side effect. Differences were considered significant if p<0.05. The statistical analyses were made using the GraphPad Prism® 5.0 software (GraphPad Prism Software Inc., San Diego, CA, USA).

Sample Size Calculation

Although a 1:1 proportion for randomization was proposed, the final proportion was 3:2 due to a lack of follow-up. Thus, for a significant difference at the 5% level with 80% power, with a very large effect size (Cohen’s D = 1.2), 25 patients with a 3:2 ratio are necessary, considering a correction of asymptotic relative efficiency for non-parametric tests.

Results

According to the study flowchart, the steps occurred as shown in Figure 1.
Study flowchart
The description of the patients is reported in Figure 2. No difference was found in demographic values for patients with FM treated with pregabalin (GP) or treated with pregabalin/ lidocaine (GPL) (Table 1).
Table 3 Regarding the VAS scores, patients treated with lidocaine/pregabalin (GPL) showed improvements in the parameter analyzed compared initial (T0) and final time (T5) of treatment. No difference was found in patients from the group pregabalin (GP). Besides, a considerable improvement also was seen in the FIQ score compared initial (T0) and final (T5) time of vasluation in GPL and GP groups. No difference was reported between the GPL and GP groups in VAS, neither the FIQ score in the final time (T5) (Table 2).
Table 4 The effect of repetitive intravenous lidocaine 3 mg.kg.h, diluted in 250 ml of 0.9% saline through an infusion pump, administration associated with pregabalin (150 mg.kg) on the redox status are described in Figures 2 and 3. The blood samples were collected before first lidocaine administration (at the third week (T2)) and after the third lidocaine infusion (at the fifth week (T4)), and the analyses was performed at T2 and T4 in the same patient from the GPL (lidocaine/pregabalin) and GP groups (pregabalin) (Figure 1).

biomedres-openaccess-journal-bjstr

Table 3: Demographic features of patients.

Note: BMI: Body mass index; GPL: Pregabalin/lidocaine group; GP: Pregabalin group; R: Rank-biserial correlation. Values are expressed in means ± SD. Mann-Whitney U Test.

biomedres-openaccess-journal-bjstr

Table 4.

Note: BMI: Body mass index; GPL: Pregabalin/lidocaine group; GP: Pregabalin group; R: Rank-biserial correlation; T0: Initial time; T5: Final time. Values are expressed in means ± SD. Mann-Whitney U Test.

Figure 2 represents the oxidative damage and non-enzymatic antioxidant profile. The results showed that lidocaine/pregabalin administration attenuates the redox damage caused by FM. We found that lidocaine/pregabalin increased GSH levels (p<0.01) and non-enzymatic capacity (FRAP) (p<0.05) in blood and plasma of the GPL group (Figure 2A & 2B). Moreover, lidocaine decreases lipoperoxidation (p<0.001) in blood cells of the GPL group (Figure 2C) without changing the sulfhydryl groups (Figure 2 D). No changes were found in the GP group (pregabalin) between T2 and T3 in oxidative damage and non-enzymatic antioxidant status.
Figure 3 describes the effect of lidocaine/pregabalin administration on enzymatic antioxidant defense catalase and superoxide dismutase. Lidocaine/pregabalin could not alter enzymatic antioxidant activities in blood cells in both the GPL and GP groups (Figure 3).
Figure 4 Mild headache, dizziness, and drowsiness have been reported.

biomedres-openaccess-journal-bjstr

Figure 2: Schematic representation of experimental procedures.

biomedres-openaccess-journal-bjstr

BMI: Body mass index; GPL: Pregabalin/lidocaine group; GP: Pregabalin group; R: Rank-biserial correlation. Values are expressed in means ± SD. Mann-Whitney U Test.

Figure 3: Effect of repetitive intravenous injection of lidocaine (3 mg.kg IV) on parameters of oxidative imbalance in blood cells and plasma of FM patients. Ferric-reducing ability (FRAP) (A); GSH levels (B); Thiobarbituric acid reactive substance (TBARS) (C); Total reduced thiol content (SH) (D). Data are reported as mean ± SEM of 15 patients (GPL group) and ten patients (GP group). Statistically significant differences from T2 (before lidocaine injection) and T4 (after third lidocaine injection) as determined by the Wilcoxon test. GPL: Pregabalin/lidocaine group; GP: Pregabalin group.

biomedres-openaccess-journal-bjstr

Figure 4: Effect of repetitive intravenous injection of lidocaine (3 mg/kg IV) on enzymatic antioxidant defenses in FM patients’ blood cells. Superoxide dismutase activity (A); Catalase activity (B); SOD and CAT ratio (C). Data are reported as mean ± SEM of 15 patients (GPL group) and ten patients (GP group).
Statistically from T2 (before lidocaine injection) and T4 (after third lidocaine injection) as determined by the Wilcoxon test. GPL: Pregabalin/lidocaine group; GP: Pregabalin group.

Discussion

This study investigated the beneficial effects of repetitive intravenous injection of lidocaine associated with pregabalin on FM and the role of oxidative stress in the lidocaine/pregabalin pharmacological action. There were significantly improved VAS and FIQ scores in the GPL group (lidocaine/pregabalin). Moreover, to the best of our knowledge, our findings also showed for the first time that lidocaine/pregabalin attenuated the oxidative stress caused by FM, especially by regulating the non-enzymatic antioxidants defense. Lidocaine is a classical local anesthetic and antiarrhythmic drug that changes neuron depolarization by blocking the fast voltage-gated sodium (Na+) channels. It is also used as an analgesic for several painful conditions [16]. Nowadays, several works have described the effect of lidocaine in attenuating fibromyalgia symptoms. Intravenous lidocaine administration inhibits the pain caused by a deep ischemic but not the superficial cutaneous pain modalities or tactile sensation [17]. Also, repeated lidocaine injections into myofascial points attenuated clinical FM pain and several tender points [8,17], and a single administration of lidocaine into the trapezius muscle reduced secondary hyperalgesia in FM patients [18]. Our results showed that intravenous injections of lidocaine associated with pregabalin (orally) reduced the pain, which is supported by the VAS and FIQ scores. Chronic pain is one of FMS’s main symptoms and modulating that parameter could lead to a better quality of life. Moreover, our findings also showed improved functional and physical capacity and mental health status assessed by the FIQ score in the pregabalin/lidocaine group. Thus, administering lidocaine/pregabalin modulates morning tiredness, stiffness, anxiety, pain, and depression in FM patients, thus decreasing FMS symptoms [19]. However, no differences were found between the GPL and GP groups regarding the FIQ scores. Such finding agrees with a study by Oliveira [20], which showed that clinical pain was attenuated after lidocaine treatment. The effect was similar to that of saline administration, which indicated that the additional factor to overall analgesia could be inferred in the lidocaine effect. Additionally, the pain parameters improved in the group treated with lidocaine/pregabalin, reinforcing the hypothesis that combining those drugs could bring associated benefits. Studies have associated oxidative stress parameters and FMS symptoms, showing a strong relationship between redox status and FIQ scores [21]. Thus, we analyzed the effect of repetitive intravenous lidocaine administration on the redox status of FM patients. Lidocaine/pregabalin could improve the total antioxidant capacity, mainly by upregulating the glutathione (GSH) levels compared to the GPL and GP groups. The tripeptide GSH contains the thiol group that protects the organism from oxidative stress by modulating the enzyme glutathione peroxidase [22]. It could be a biomarker of improved redox balance in FM patients [23].
Those reduced thiol group levels deteriorate in FM patients and the thiol-disulfate rate increases in favor of disulfide amounts. Increased GSH levels seen in GPL patients could contribute to better physical and psychological response after the lidocaine treatment measured by the FIQ scores. Moreover, increased antioxidant redox systems, such as GSH, protect lipids and membranes from oxidative damage [5,24]. FM includes increased plasma lipoperoxides levels in blood [25,26], resulting in altered membrane fluidity and proteinlipid bilayer, altered membrane potentials and eventual integrity leading to the release of cell organelle contents in extracellular fluid. Besides, lipid peroxidation plays a key role in the central nervous system mechanism of depression, anxiety, cognitive dysfunctions, and pain. All of those symptoms are described in FM patients, so lipid oxidation protection is an important FM therapy target [5,24,27].
Together, our data showed in the experiment that lidocaine/ pregabalin therapy stimulate antioxidant defenses in the blood, reducing oxidative stress and consequently lipid bilayer damage and cell membrane disruption. Attenuating oxidative injury could mitigate FM symptoms. These results could propose intravenous lidocaine injection as a safe treatment that may significantly improve FMS patient’s quality of life.

Acknowledgments

This study was supported by the Brazilian Agencies National Council for Scientific and Technological Development (CNPq), Coordination for the Improvement of Higher Education Personnel (CAPES), and Foundation to support Research and Technological Innovation of the State of sergipe (FAPITEC-SE).

For More Articles: Biomedical Journal Impact Factor: https://biomedres.us

Open Access Journals On Pharmaceutical & Medicinal Chemistry

Acetylation of Cinnamic Acid and Evaluation of Antioxidant Activity of the Resultant Derivative

Introduction

In the search for novel pharmacologically active compounds, research efforts are being focused on some lead chemicals/ compounds. One of such is cinnamic acid and its derivatives which are chemical compounds with high potentials for development into drug templates. Some of these compounds especially the ones containing phenolic hydroxyl group are well-known for their several health benefits due to inherent strong free radical scavenging properties. Hence, these compounds are being studied as potential antioxidants due to the multi-functional activities they exhibit. Furthermore, previous studies have shown that this class of compounds posses anti-microbial, anti-inflammatory, anti-cancer, anti-oxidative and cardiovascular protective properties. A derivative namely, p-coumaric acid (4-hydroxyl-trans-cinnamic acid) has been found to exhibit antioxidant activity involving direct scavenging of ROS (Reactive Oxidative Species) by minimizing the oxidation of low-density lipoprotein [1-3]. In addition, ethyl cinnamate and cinnamyl alcohol have been found to posses antioxidant activity using the rapid bench-top DPPH (2, 2-diphenyl-1-picrylhydrazyl hydrate) test [4]. In this present study, the acid was acetylated and the resultant derivative screened for antioxidant activity (IC50) using the DPPH test. Comparison of the activities given by the acid and the derivative was done with a view to determining if any improvements would be observed.

Experimental

Reagents/chemicals

DPPH (2, 2-diphenyl-1-picryl hydrazyl hydrate) and cinnamic acid were purchased from Sigma Aldrich Chemicals, Germany while acetic acid, acetic anhydride, di-ethyl ether, methanol and sulphuric acid were obtained as AnaLAR Grade Chemicals from British Drug House Chemicals Limited, Poole, England.

Acetylation of Cinnamic Acid

0.4g of cinnamic acid was dissolved in a beaker containing 10mL of acetic anhydride and 10mL of acetic acid. The solution was heated for 20 minutes and allowed to cool. 5mL of concentrated H2SO4 was added as catalyst. Further heating was done for few minutes and it was covered with an aluminum foil and kept in the refrigerator at -4 0C. After two weeks, crystals were formed in the beaker. 5mL of warm di-ethyl ether was added and the mixture gently heated again for a few minutes. The crystals dissolved on warming, but formed back after some hours. They were then filtered and allowed to dry [5,6]. The crystals were then weighed (Figure 1).

biomedres-openaccess-journal-bjstr

Figure 1.

Determination of Melting Point

Cinnamic acid and the synthesized derivative (0.05g) were separately filled to a quarter of the length of a micro-capillary tube and the melting point determined [7] using an Electro-thermal Melting Point apparatus (Electro-thermal Engineering Limited, England).

Determination of Optical Rotation and Refractive Index

Each sample (0.05g) was dissolved in 10mL of methanol. The tube of the Polarimeter (ADP-220, Bellingham Stanley, England) was filled with distilled water and the machine subsequently zeroed. The tube was refilled with 5mL of sample and the optical rotation and was measured at the wavelength (λ) of sodium D line (589.3nm) at 20.5 0C. Similarly, the refractive index of sample was obtained on a refractometer (WAY-15, Abbe, England) at the wavelength (λ) of sodium D line (589.3nm) at 20.5 0C [8,9].

Antioxidant Activity

Spectrophotometric Determination of Antioxidant Activity using DPPH Reagent: Substances which are capable of donating electrons or hydrogen atoms can convert the purple-colored DPPH radical (2, 2-diphenyl-1-picrylhydrazyl hydrate) to its yellowcolored non-radical form; 1, 1-diphenyl-2-picryl hydrazine [10,11]. This reaction can be monitored by spectrophotometry.
Preparation of Calibration Curve for DPPH Reagent: DPPH (4mg) was weighed and dissolved in methanol (100mL) to produce the stock solution (0.004 % w/v). Serial dilutions of the stock solution were then carried out to obtain the following concentrations; 0.0004, 0.0008, 0.0012, 0.0016, 0.0020, 0.0024, 0.0028, 0.0032 and 0.0036 % w/v. The absorbance of each of the sample was taken at λm 512nm using the Ultra-Violet Spectrophotometer (Jenway 6405, USA). This machine was zeroed after an absorbance had been taken with a solution of methanol without DPPH which served as the blank.
Determination of the Antioxidant Activity of Cinnamic Acid, Dderivative and Vitamin C: 2mg each of sample was dissolved in 50mL of methanol. Serial dilutions were carried out to obtain the following concentrations; 0.0004mg mL-1, 0.0008 mg mL-1, 0.0012mg mL-1, 0.0016mg mL-1 and 0.0020mg mL-1 using methanol. 5mL of each concentration was incubated with 5mL of 0.004 % w/v methanolic DPPH solution for optimal analytical accuracy. After an incubation period of 30 minutes in the dark at room temperature (25 ± 2 0C), observation was made for a change in the color of the mixture from purple to yellow. The absorbance of each of the samples was then taken at λm 512nm. The Radical Scavenging Activity (RSA %) or Percentage Inhibition (PI %) of free radical DPPH was thus calculated:

Ablank is the absorbance of the control reaction (DPPH solution without the test sample and Asample is the absorbance of DPPH incubated with the sample. Cinnamic acid /derivative / Vitamin C concentration providing 50 % inhibition (IC50) was calculated from a graph of inhibition percentage against the concentration of the cinnamic acid/ derivative /vitamin C [12,13]. Vitamin C was used as a standard antioxidant drug.
Infra-Red Spectroscopy of Samples: Each sample (0.2g) was analyzed for IR characteristics using the FTIR 84005 Spectrophotometer (Shimadzu, Japan).

Results

Structural Elucidation

Cinnamic Acid: C9H8O2; mol. wt. (148g/mol); white crystalline solid; m.pt. (134-136 0C); [n]D20 (1.516); [α]D20 (00); FTIR (cm-1): 1576 (Ar-C=C), 1627 (acyclic -C=C), 1682 (C=O) and 2923 (-OH) (Tables 1 & 2).
Cinnamyl Acetate : C11H10O3; mol. wt. (190g/mol); yellow crystals; m.pt. (169-171 0C); [n]D20 (1.552); [α]D20(00); FTIR (cm- 1): 771 (alkyl substitution ), 1071 (C-O-C, ether linkage), 1577 (Ar- C=C), 1629 (acyclic -C=C) and 1683 (C=O).

biomedres-openaccess-journal-bjstr

Table 1: Absorbance of samples incubated with DPPH at different concentrations at λmax 512nm (Blank absorbance of 0.004% methanolic DPPH reagent: 0.803).

Note: DPPH = (2, 2-diphenyl-1-picrylhydrazylhydrate)

biomedres-openaccess-journal-bjstr

Table 2: Radical scavenging activity (RSA)/ percentage inhibition (PI) of samples at different concentrations and the computed IC50 values.

Note: IC50 = Concentration at which 50% of DPPH is scavenged or inhibited RSA% (PI) = Radical Scavenging Activity (Percentage Inhibition).

Discussion

The cinnamic acid used in this study had been put through some monographic determinations in a previous research [4] where its identity, purity, integrity, assay and suitability were established. Its IR spectrum shows diagnostic stretching’s at 1576, 1627, 1682 and 2923cm-1 which indicate the characteristic Ar-C=C, acyclic C=C, α, β unsaturated C=O and –OH groups respectively. The –OH peak of the acid absorbed particularly lower the expected (>3000) at 2923 cm-1 because of inherent intra-molecular hydrogen bonds. Cinnamyl acetate was synthesized as yellow crystals with a balsamic flavor. The compound was found to be soluble in methanol, petroleum ether, acetone, chloroform and ethanol. However, it was insoluble in water conferring a lipophilic character on it. Its refractive index was found to be 1.552 compared with the parent compound at 1.516 while its melting point was 169-171 0C. IR peaks of the acetyl product at 771, 1071, 1577, 1629 and 1683 cm-1 are characteristic of alkyl substitution (found in -COCH3 substitution in the derivative), ether linkage -C-O-C, aromatic Ar-C=C (which was observed to absorb slightly higher than that seen in the cinnamic acid), acyclic -C=C and C=O stretching’s (both slightly higher than that seen in the acid) respectively.
The ether linkage is particularly elucidative indicating that the hydrogen atom in the -OH had been substituted with an acetyl group. Both the acid and its acetyl derivative showed an optical rotation of 0o indicating that the compounds are optically inactive. Consequently, neither compounds can rotate plane of polarized light in any directions. Hence, the compounds cannot demonstrate either dextro-rotation or laevo-rotaion [8,9]. The derivative has also been found to be of immense benefit to the pharmaceutical, winery and perfumery industries. It is pertinent to mention that open or acyclic carboxylic acids such as cinnamic acid are much difficult to acetylate compared with the ringed or aromatic counterparts. Consequently, the acetylation procedure had to be left for 14 days in a refrigerator for the reaction to go into completion.

Antioxidant Activity

A calibration curve was prepared for DPPH (2, 2-Diphenyl-1- picryl hydrazyl hydrate) reagent with the aim of confirming its purity and suitability for use in the antioxidant determinations. The Beer- Lambert’s Law is the basis of all absorption spectrophotometry [9]. The reduction of the DPPH radical was determined by taking its absorption at a wavelength of λm 512nm. It was observed that the absorbance of DPPH decreased as the concentration of added free radical scavenger (cinnamic acid/derivative/vitamin C) increased which suggested that the DPPH reagent was being reduced. The tables show radical scavenging activity (RSA %) or percentage inhibition (PI %) and the computed IC50 values of cinnamic acid / derivative / vitamin C. The RSA % is an indicator of the antioxidant activity of cinnamic acid/ derivative/ vitamin C. Interestingly, both the cinnamic acid and derivative demonstrated significant antioxidant activity (IC50) of 0.18 and 0.16μg mL-1 respectively. The values compare remarkably with the antioxidant activity given by vitamin C (standard antioxidant drug) at 0.12μg mL-1. However, it should stated be that the derivative was slightly more active than the parent compound. Hence, it can be inferred that acetylation enhances the antioxidant activity of the acid. This was not surprising because the solubility profile of the synthesized derivative showed that it was soluble in organic solvents whereas it was insoluble in water implying that it has some lyphophillic characteristics. This feature most probably could account for its slightly better activity than the acid which can enable it to get it the active sites (allosteric sites) faster than the acid to effect anti-oxidation Aside from the DPPH assay, other methods for determining the antioxidant activity of compounds include the hydrogen peroxide, nitric oxide, conjugated diene, superoxide, phosphomolybdenum, peroxynitrile and xanthine oxidase assay methods amongst many others [14,15].

Conclusion

This present study shows that the cinnamic acid and its cinnamyl acetate elicited significant antioxidant activity. However, the activity demonstrated by the derivative was slightly better. Hence, acetylation enhances antioxidant activity of the acid.

Acknowledgement

The authors are grateful for the kind gesture of the Department of Pharmaceutical and Medicinal Chemistry, University of Uyo for the use of its Jenway 6405UV/VS Spectrophotometer in the antioxidant assays. Also, we acknowledge the contribution of the University of Ibadan, Nigeria for the use of their facilities in obtaining the IR spectra.

For More Articles: Biomedical Journal Impact Factor: https://biomedres.us

Open Access Journal on Septic surgery and Wound care

Remarks on Severity of Trauma Patients Due to Road Traffic Accidents have Been Treated at Vietduc University Hospital Assessed by RTS

Introduction

Traffic accidents are always a global problem. According to statistics of the World Health Organization – WHO, every year around the world, about 1.35 million people die, leading to 50 million people being permanently disabled due to irreversible injuries, accounting for 30-50% of total hospital admissions (3). Vietnam is the country with the highest number of traffic accident deaths in ASEAN and one of the countries with the most traffic accidents in the world. Therefore, traffic accidents are always a current topical issue in Vietnam because it’s a burden on health care and society, affecting the patient’s lives. Although the Government has been implementing many measures to reduce the number of cases and victims, Vietnam is still in the group of developing countries with high rates of morbidity and mortality caused by traffic accidents [1-4]. To improve the qualifications of trauma care, one interesting issue is updating trends in trauma care assessment. Primary trauma care requires assessment of severity to develop appropriate care strategies. The Revised Trauma Score -RTS simplifies the rapid assessment of injury based on Respiratory Rate, Maximum Blood Pressure, and traumatic brain injury severity – Glasgow Coma Scale has been widely recognized for clinical decision making. Several articles have evaluated the performance of RTS in the emergency department (ED) as a triage and prediction tool and showed the effect in clinical practice because bedside assessment tool, each of its variables can be easily and quickly calculated [5,6]. Viet Duc University Hospital, one of the leading centers of surgery in Vietnam, annually receives more than 30.000 trauma patients, most of them are serious trauma patients due to traffic accidents. Quick triage for providing proper treatment is a very important issue for health workers at the ED because it could impact the outcomes of treatment. Therefore, we have conducted this study to evaluate the effectiveness of using RTS on trauma patients at ED of Hospital.

Materials and Methods

Tool

In this study, we used the RTS including three parameters are considered for the RTS: maximum systolic blood pressure (MaxSBP, mm Hg), Respiratory Rates (RR, cycles per minute), and Glasgow Coma Scale (GCS). The RTS will range from 0 to 12, where the lower RTS is the more severe injury at the higher risk of death [5] (Table 1).

biomedres-openaccess-journal-bjstr

Table 1.

Setting and Participants

We prospectively analysed the clinical data of 200 patients with traffic accident acute trauma who were treated in the ED of Viet Duc University Hospital, a comprehensive tertiary surgical hospital) from December 2020 to March 2021. The patients were assessed the RTS upon admission within the first 24 hours. The data were recorded by attending nurses and doctors at the time of the patient’s presentation to the ED. Exclusion criteria were used: The patients already had airway intervention such as endotracheal intubation, mechanical ventilation. The patients died on arrival or were discharged from the ED before termination of emergency treatment, the medical records were not completed.

Data Analysis

Data were processed using SPSS 20.0 software.

Results

A total of 200 patients who met the selection criteria were analyzed. The characteristics of subjects are as follows:
*All 50 patients who dead in the group with RTS ≤ 9. The difference between survival and death rates of groups with RTS ≤ 9 and RTS ≥ 9 is statically significant with P <0.05.

Discussion

Injuries in general and traffic accidents, in particular, are still a global problem. In most developed countries, the injury classification system helps to provide appropriate care strategies, reducing complications and mortality. However, in many developing countries like Vietnam, the trauma emergency system is still incomplete and has many challenges. According to Zhejun Yu [4] each year, more than 400 000 people die in China from motor vehicle accidents or industrial accidents, among which 1%-1.8% were multiorgan/multisystem injuries. China’s regional trauma system hasn’t yet been full-fledged, and the management of trauma centers is facing great challenges. Therefore in all emergency rooms, especially in cases of overcrowding and understaffed, it is critical to rapidly screen large numbers of patients, identify the critically ill patients promptly, assess the severity of their condition and assign appropriate treatment priorities, and transfer them towards or intensive care unit are very important issues while treating the patients there [7-9].
In the past 30 years, a different trauma scoring system has been developed, most of the scales are combined with factors related to anatomy and physiology.
However, the scales are too complicated, with many variables, while the emergency needs to be done as quickly as possible. Among the commonly used scales are the Revised Trauma Score (RTS) or the T-Revised Trauma Score (T-RTS), the Severity Scale. Injury – Injury Severity Score (ISS) and Trauma Score-Injury Severity Scores (TRISS), the RTS is widely used. Many studies have evaluated the effectiveness of applying RTS to serve trauma care at the ED effectively [10-12]. In 1989 Champion HR [5] has introduced a revised scale to assess the severity of trauma based on three main indicators: Respiratory Rates – Maximum Blood Pressure – Glasgow Coma Scores abbreviated as RTS – Revised Trauma Score. According to the rating scale, the lower the RTS, the higher the risk of death. Because RTS reflects trauma severity, it is considered a useful tool to predict the patient’s survival and death. The study of R.A Lichtveld [13] of 503 trauma patients showed that when compared with non-ventilated patients with unchanged RTS, the risk of death in patients with RTS scores was 3.1 times lower (P=0.001), patients with a good initial RTS score but subsequently intubated were 2.9 times higher (P<0.001) and in patients with a low RTS, intubated were twice as likely (P<0.001) (6). According to Nguyen Huu Tu [14] if RTS ≤9 mortality rate is 78.3% compared to 3.4% of the RTS group >9 (3). Research results of Nguyen Huu Tu and Nguyen Truong Giang are similar: the higher RTS means the greater rate of survival [14,15]. In the study on the effects of T-RTS by Lam Vo Hung [6] to triage of trauma patients at the ED of An Giang hospital in the South of Vietnam in 2012 through 150 trauma patients with traffic accidents. The study has shown that RTS had a statistically significant difference in the mean value of the survival group with the death group with P = 0.000. RTS cut-off score <9 predicts mortality with a sensitivity of 88% and a specificity of 99%.
The author recommends that RTS should be widely applied in medical facilities and that the RTS scale is effective in survival prognosis. With a sensitivity of 88.2% and a specificity of 99.2%, the RTS shows an effective role in assessing the risk of death. The reports of Nguyen Huu Tu, et al. [14,15] also had similar results with sensitivity of 78.7%, 76%, and specificity of 95.1%, 84%. According to the study by Kondo Y et al. [16] about the correlation between long-term mortality and short-term mortality of RTS, T-RTS, TRISS, MGAP (mechanism, GCS, age, and arterial pressure) score, and GAP (GCS, age and arterial pressure) score. They found that T-RTS was better at predicting short-term mortality than long-term mortality. For the aging group, the study of Lam Vo Hung [6] showed that the group with the highest mortality was from 16 to 39 years old, young people who were hyperactive, disregarded traffic rules, and easy to be injured by traffic accidents (accounting for 50% of the total sample of study). In our series, the age group was the highest proportion from 21 to 60 years old, accounting for 64%, males accounted for the majority of 86.7% (Figures 1 & 2). As for the type of injury, in the study of Lam Vo Hung [6], traumatic brain injury and multiple trauma had a high mortality rate. Among the types of injuries, there was a statistically significant difference in mortality with P<0.05. Nguyen Huu Tu [14] has the same comment as us, the mortality rate due to traumatic brain injury and multiple trauma is 16.6% and 22.3%, respectively (3).

biomedres-openaccess-journal-bjstr

Figure 1: Distribution by age group.

biomedres-openaccess-journal-bjstr

Figure 2: Distribution by sex.

In addition, Nguyen Truong Giang [15] studied 532 accident patients at 103 Hospital and found that the RTS were low in the traumatic brain injury group and the multi-traumatic group. Nguyen Duc Chinh, et al. [17] conducted a study at Viet Duc University Hospital on deaths (2016-2018) showed that the traumatic brain injury group accounted for the highest rate, especially the group with GCS from 6 to 8. Bruno Durante, et al. [18] analyzed 200 patients from December 2013 to February 2014, including trauma victims admitted to the emergency room of the Cajuru University Hospital. The patients were set up in three groups: (G1) penetrating trauma to the abdomen and chest, (G2) blunt trauma to the abdomen and chest, and (G3) traumatic brain injury. The variables we analyzed were: gender, age, day of the week, mechanism of injury, type of transportation, RTS, hospitalization time, and mortality. Regarding mortality, there were 12%, 1.35%, and 3.95% of deaths in G1, G2, and G3, respectively. The median RTS among the deaths was 5.49, 7.84, and 1.16, respectively, for the three groups. The authors concluded that RTS was effective in predicting mortality in traumatic brain injury, however failing to predict it in patients suffering from blunt and penetrating trauma. In our study, the highest proportion of combined injuries were maxillofacial injuries 44%, limb injuries 23.5%, blunt chest injuries 22% (Table 2).

biomedres-openaccess-journal-bjstr

Table 2: Associated lesions (N = 200).

Patients with severe traumatic brain injury according to the GCS of 6 – 8 accounted for the highest rate of 52% (Table 3). Up to 40% were operated on emergency within the first 24 hours. The rate of serious injured was discharged to die at home accounted for 24.5%, 0.5 % died in hospital, overall mortality was 25% respectively (Table 4). Regarding the RTS in our study, there were mostly in the group of RST at 10 points (50.5%) and 9 points (35.5%). There were 98 patients (49%) with RTS ≤ 9 (Table 5) of which, 91.8% with serious brain injury. All 50 fatal and critically ill patients were in this group.

biomedres-openaccess-journal-bjstr

Table 3: GCS, MxBP and RR (N = 200).

biomedres-openaccess-journal-bjstr

Table 4: Managements and outcomes at ED within first 24 hours (N = 200).

biomedres-openaccess-journal-bjstr

Table 5: RTS.

In a Mega-analysis of Manoochehr S [19], to compare the ability of Revised Trauma Score (RTS) and Kampala Trauma Score (KTS) in Predicting Mortality, the study was conducted by two investigations searched the Web of Science, Embase, and Medline databases and the articles in which the exact number of truepositive, true-negative, false-positive, and false-negative results could be extracted were selected. A total of 11 relevant studies (total n = 20,631) were investigated. Regarding the accuracy and performance, the author concluded that RTS was better than KTS for distinguishing between mortality and survival. Compared with the other researches of domestic and international, we find that RTS is convenient to use in a clinical emergency for trauma victims. Moreover, in addition to the GSC, RTS can also be used as a predictor of severity and mortality, helping physicians at ED to making quick decisions and providing appropriate treatment [4,6,20,21].

Conclusions

Through the study of 200 trauma patients due to traffic accidents, we found that RTS has a value in predicting survival as shown by the difference between survived group and the death group. The patients who died were in the group with scores ≤ 9 statically significant with P <0.05. Because it is easy to calculate and suitable for first aid, it is recommended to apply in clinical practice, especially in the actual conditions of Vietnam. In the difficult conditions of shortage of resources, the trauma emergency system has not been standardized, the application of RTS helps to reduce the morbidity and mortality rate.

For More Articles: Biomedical Journal Impact Factor: https://biomedres.us

Open Access Journals on Medical Sciences

Molecular Detection of BCL2/IGH Rearrangement in Follicular Lymphoma in Low Resource Settings: A Phase III Diagnostic Accuracy Study

Introduction

Follicular lymphoma (FL) is the second commonest non- Hodgkin lymphoma (NHL) subtype worldwide and the commonest in certain regions like USA [1]. FL has generally an indolent clinical course, somehow influenced by the cytological grading that is not, however, of prognostic relevance [2]. Conventional chemoimmunotherapy can induce initial remissions; nonetheless, cure is still not common [3]. In fact, relapses do occur, characterized by progressive chemoresistance development. In a percentage of cases, relapsing is also associated with histological transformation to secondary DLBCL [2]. The source of relapse in patients who initially achieve complete clinical remission are residual neoplastic cells representing the so called minimal residual disease (MRD). MRD can be detected either in bone marrow and blood by molecular methods and/or in tissues (mainly lymph nodes) by PET scan [4]. The t(14;18)(q32;q21) is molecular hallmark of FL. This translocation joins the BCL2 gene located on chromosome 18q21 with the immunoglobulin heavy chain locus (IGH) on chromosome 14q32, leading to the inappropriate expression of BCL2 protein, known to be a potent apoptosis inhibitor [5,6]. Detection of the BCL2/IGH rearrangement can be clinically useful for diagnostic purposes (using fluorescence in situ hybridization on tissues), but also for staging and MRD monitoring (using molecular techniques on blood and marrow) in FL patients [3,7,8].
Different techniques can be currently applied for the molecular detection of MRD, including more conventional ones (nested-PCR and quantitative Real-Time PCR, qPCR) and more innovative like digital PCR and next generation sequencing based ones [9,10]. Despite all of them have been demonstrated to be highly effective and overall reproducible and comparable [7-10], in low resource settings it is still debated whether to routinely test, due to costs, and which technique to prefer, due to technologies availability. In this study, we performed a phase 3 diagnostic accuracy study aiming to compare the two most conventional molecular techniques for MRD detection in FL, namely nested-PCR (used as test technique) and qPCR (used as golden standard) for BCL2/IGH detection. The two approaches were chosen as the only currently available in many referral centres even with limited resources.

Material and Methods

Twenty-two FL patients for which biological samples, complete clinical information, and long-term follow up were included. All patients were at diagnosis, and samples were taken before treatment initiation as well as after CHOP-R induction therapy, and after zevalin consolidation treatment at specific time-points (+3, +6, +12, +24, +30 months) [11]. Genomic DNA was extracted from mononuclear cells of peripheral blood (PB) and bone marrow aspirate (BM) as previously described [12]. The nested-PCR and the qPCR based on TaqMan technology [ABI PRISM 7900HT Fast Real-Time PCR System (Applied Biosystem)] were performed as previously reported [3,13,14]. As for BCL2/IGH PCR assays, primers were used according to previous Italian experiences [Ladetto 2001] (Tables 1-2). GAPDH was used as control gene for qPCR. Conversely, AF4 was chosen as control gene and was amplified according to BIOMED2 protocols for nested PCR [15]. All samples were tested by both techniques in triplicate.

biomedres-openaccess-journal-bjstr

Table 1: Primers sequences for nested PCR (BCL2/IGH).

biomedres-openaccess-journal-bjstr

Table 2: Primers sequences for nested PCR (BCL2/IGH).

Calculations of sensitivity (ST), specificity (SP), positive predictive value (PPV), negative predictive value (NPV), were made by CATmaker software (Centre for Evidence Based Medicine, Oxford University, http://www.cebm.net). The limit of significance for all analyses was defined as P<0.05. The study was approved by the local Ethical Committee and was developed and conducted in respect of the Helsinki Declaration. The study was designed and conducted according to the evidence-based medicine rules, respecting the STARD requirements.

Results and Discussion

All the enrolled patients could be studied for MRD. In total, 145 tests were performed. In fact, other than the expected 132 (22 cases by 6 timepoints), additional 13 were available from patients with longer clinical CR duration. Overall, we observed good concordance between “qualitative” nested-PCR and quantitative real-time PCR (80,86 %), in detecting MRD. The absolute sensitivity of the qPCR was in line with previously reported data [7]. Particularly, by evaluating serial dilutions of t(14;18)-positive cells into t(14;18)- negative cells, the relative sensitivity of our qPCR assay of about 10−5 resulted greater than the nested-PCR one (10-4), with an enhanced quantitative potential. This is overall in line with most studies. In terms of reproducibility, the precision of qPCR was determined by repeatability intra-assay and inter-assay; both the tests gave results of high reproducibility, above 95% considering 3 replicates. In contrast, the nested-PCR has given a lower reproducibility with discordant data and the need of additional repetitions to achieve a uniform result (three nested-PCR in mean). Overall, this is in line with previous works on qPCR. By contrast, nested PCR seemed to be “technically” more complicated and probably requiring more experienced personnel, to be consistently performed. This fact, further stress the need for adequate training and standardization processes when MRD is studied, in order to ensure the requested clinical consistency.
Consistency between the two was evaluated in terms of sensitivity and specificity. Overall, this analysis confirmed what observed in terms of reproducibility, i.e. a significantly higher efficacy of qPCR. Among 145 performed tests, 85 were concordant between the two techniques, while 59 were not (59% overall accuracy). Particularly, among 103 tests turned out to be negative by nested PCR, only 46 were instead positive by qPCR (45%). Conversely, among the 46 that resulted positive at nested PCR, only 13 were discordant and 33 consistent (72%). This was translated into remarkable specificity but low sensitivity of nested PCR (Figure 1).

biomedres-openaccess-journal-bjstr

Figure 1: Diagnostic accuracy analusis of qPCR vs Nested PCR (Catmaker, Oxford, UK).

Lastly, analysis of costs and practical feasibility in reduced laboratories was performed. The expenses for reagents, consumables and labor employed for the TaqMan assay was calculated about 34,00€ (4,443 KES) per sample when testing the maximum number of 5 samples in triplicate in 96 well-plates. Conversely, the analysis of 5 sample by nested-PCR has a total amount of 126,00€ (16,466 KES). This calculation was obviously optimized for running a complete TaqMan plate. By reducing the number of available samples, the cost would progressively increase. This implies that referral labs centralizing the activities are advised, particularly when resources are limited, also considering the highest initial investment for machinery. The shortest test duration of 3 hours and 14 minutes was found for the real time PCR while 18 hours and 30 minutes were needed to perform a complete nested- PCR analysis (including gene control PCR, the nested-PCR repeated for three times in mean, post PCR manipulation)

Conclusion

The present study, though based on a limited series, highlights the relevance of using a qPCR-based method to detect BCL2/ IGH rearrangements in FL patients in laboratories with limited resources. The use of TaqMan detection system was shown to be a sensitive, reproducible, and economical tool for MRD monitoring in FL. It allowed a relative sensitivity of about 10-5 providing a more accurate prognostic information [16]. Finally, the Taq Man approach in comparison with nested-PCR showed the simplest and shortest workflow sequence with a considerable gain of time and money, the average cost of 34€ per samples makes it feasible also in low resource Countries. Adequate programs of training and standardization should be then planned accordingly.

For More Articles: Biomedical Journal Impact Factor: https://biomedres.us

Open Access Journals On Medical Biochemistry

Anthrax Toxins and their receptors

Introduction

Under unfavorable growth conditions, B.anthracis undertake the developmental process of sporulation. B.anthracis spores are their infectious form, because contact with such spore forms under favorable conditions can lead to inhalation, skin and gastrointestinal infections [1]. For example, when spores enter the lungs, they are phagocytosed by macrophages and dendritic cells. However, some of them are able to spread throughout the body, despite the initial immune response. The spores that survive then transform into vegetative bacilli thanks to the formation of a polyɣ- D-glutamine capsule and the secretion of anthrax toxin proteins [2]. The anthrax toxin is composed of two binary combinations of three soluble proteins: 83 kDa protective antigen (PA83), 90 kDa lethal factor (LF), and 89 kDa edema factor (EF). PA forms complexes on the surface of host cells. It binds to one of two known anthrax toxin receptors, tumor endothelial marker-8 (TEM-8) or capillary morphogenesis protein-2 (CMG-2) [3]. Receptor-bound PA is proteolytically activated by a cell surface protease to generate a 63-kDa form (PA63) which oligomerizes, generating ring-shaped heptameric and octameric pore precursors [4].

These pre-channel oligomers are capable of binding up to three and four LF and/or EF molecules, respectively. The complexes are endocytosed and delivered to an acidic endosomal compartment. The PA oligomer transformed into a translocase channel, allows the transmembrane proton gradient to force lethal factor and edema factor translocation into the cytosol where they carry out their enzymatic functions, (Figure 1) [5]. Bacillus anthracis is a Grampositive, spore-forming, rod-shaped bacterium and is recognized by the presence of the pX01 and pX02 virulence plasmids, which give its unique ability to produce the anthrax toxin [6]. The plasmids pXO1 and pXO2 are very important for the virulence of B. anthracis. The pXO2 plasmid contains genes encoding the poly-D-ɣ-glutamic acid capsule, and the pXO1 plasmid contains genes encoding the toxin components: PA, EF, LF and virulence regulator anthrax toxin activator (AtxA) [7]. AtxA regulates genes encoding anthrax toxins and capsule synthesis [7]. AtxA includes the domains: two helixturn- helix (HTH), which is responsible for binding to DNA, and two phosphotransferase system (PTS) regulation domains (PRDs) and an EIIB-like domain [7]. Due to the presence of the PRDs domain in AtxA, its activity is regulated by phosphorylation strictly dependent on the presence of carbon dioxide [8,9]. These findings have important implications for developing research on the main role anthrax toxins as a major virulence factors at the initial stage of anthrax infection.

biomedres-openaccess-journal-bjstr

Figure 1: Schematic mechanisms of virulence B. anthracis by anthrax toxin and progression through the endocytic pathway. B. anthracis produces the three subunits of anthrax toxin: protective antigen (PA), lethal factor (LF) and edema factor (EF) encoded on plasmid pXO1 and poly-D-glutamic acid polimer capsule (CAP) ancoded on plasmid pXO2. AP-1 – activator protein 1; Cbl – E3 ubiquitin-protein ligase; CMG2 – capillary morphogenesis gene 2; E3 – ligase; EF – edema factor calmodulindependent adenylate cyclase; Fyn – tyrosine-protein kinase; LF – lethal toxin zinc metalloprotease; Src – Src-like kinase; TEM8 – tumor endothelial marker 8; VNTR – variable number tandem repeat.

Anthrax Toxin

Anthrax toxin is comprised of three nontoxic proteins that combine on eukaryotic host cell surface to form a toxic complex. A tripartite AB-type anthrax toxin is comprised of two catalytic A moieties: lethal factor (LF) and edema factor (EF) and a single receptor-binding B moiety, designated as protective antigen (PA). Lethal factor is a zinc-dependent metalloprotease that, together with protective antigen forms lethal toxin. It is a main virulence factor and the major cause of death for the Bacillus anthracis infected organism [10]. Lethal factor specifically cleaves the N-terminal end of mitogen-activated protein kinase kinases (MAPKKs) (Pellizzari et al. 1999). Because the N-terminal domain of MAPKKs is essential for the interaction between MAPKKs and mitogen-activated protein kinases (MAPKs), the cleavage of this domain impairs the activation of MAPKs [11]. Lethal factor cleavage of MAPKKs leads to the inhibition of three major signaling pathways-ERK1/2 (extracellular signal-regulated kinase), JNK/SAPK (c-Jun N-terminal kinase) and p38 kinases [12].

They are involved in diverse cellular processes including growth, apoptosis, innate and adaptive immune responses and several responses to various forms of cellular stress. According to lethal factor crystal structure, the enzyme comprises four different domains [13]. Domain I is responsible for protective antigen binding. The catalytic site and two zinc-binding motifs are found in C-terminal of domain IV [13]. Several studies have shown that histidine residues play an important role in the catalytic activities of lethal factor. Three histidine residues, His-35, His-42, His-229 are important for lethal factor binding to protective antigen but His- 686, His-690 and specially His-669 are essential for lethal factor catalytic activity [14,15]. Edema factor (EF) is composed of two functional domains, domain I (EFN, residues 1-291) and domain II (residues 292-798) [16]. The first domain (30 kDaN-terminal PA binding domain) interacts with protective antigen whereas the second (43 kDa AC domain and 17 kDa helical domain) interacts with adenylyl cyclase [17].

A series of biochemical studies has been revealed that EF also has two conserved aspartate residues, which coordinate two magnesium ions required for adenylyl cyclase activity [17]. EF is a calmodulin-dependent adenylyl cyclase that increases intracellular cAMP concentration of infected cells. cAMP is a secondary messenger with multiple downstream effectors, including protein kinase A (PKA) and protein activated by cAMP (EPAC). High levels of cAMP generated by ET activate PKA-induced transcriptional changes including modulation of cAMP-responsive element binding (CREB) protein [18]. Study on monocyte-derived cells suggests that CREB and glycogen synthase kinase 3 (GSK-3) are important for the ET-induced expression of anthrax toxin receptor 2 [19]. In addition, cAMP as a second messenger contributes to the regulation of leukocyte chemotaxis and endothelial barrier integrity [20,21]. The results reported by Nguyen, et al. [22] demonstrated that edema toxin (ET) impedes IL-8 driven movement of neutrophils across an endothelium independent of c AMP/PKA activity.

The stability and even the formation of the EF-calmodulin complex depends on the level of calcium bound to calmodulin (CaM) [23]. The binding of calmodulin to EF is a sequential process, first the N-terminal CaM is anchored to the helical domain and next C-terminal CaM region can insert between the catalytic core and helical domains of EF [24]. It leads to a conformational change of C-terminal region to stabilize the catalytic loop of EF for enzymatic activity. According to crystallographic studies residues Leu 667, Ser 668, Arg 671, Arg 672 and Val 694 are implicated in binding of calmodulin to EF [16,25,26]. Makiya, at al. [25] identified these amino acids residues as the binding epitope of EF-neutralizing mAb EF13D, which can neutralize EF in vitro in the subnanomolar range. Other labs have also reported small molecules which inhibit EF by different mechanisms but in the micromolar range [27,28]. Nanomolar affinities are often requested for an efficient competition, which explains that antibody concentration plays a role in toxin neutralization.

A variety of other types of EF inhibitors have been proposed. Especially, various purine and pyrimidine nucleotides with unique preference for the base cytosine were studied [29]. Edema factor and lethal factor forms toxic complexes with protective antigen, edema toxin (ET), which induces tissue swelling and lethal toxin (LT), which can alter cell function and may cause death [4]. The maintenance of homeostasis of the neural microenvironment is responsible for the blood-brain barrier. It is a regulatory interface between the peripheral circulation and the central nervous system (CNS) [30]. The endothelial barrier protects the brain from microorganisms and toxins circulating in the blood. Unfortunately, pathogenic microorganisms have evolved neuroinvasiveness mechanisms to penetrate host cell barriers. In vitro and in vivo studies from several laboratories suggest a principle role for ET in modulating brain endothelial integrity by disrupting the intercellular contacts and a role for LT in promoting penetration of the blood-brain barrier and development of meningitis [31-34].

Edema toxin has been shown to alter host defense like reduced activation of antigen-presenting cells, increased release of cytokines from dendritic cells, impaired chemotaxis and differentiation of T lymphocytes [35]. ET has also been shown to play an important role in the pathogenesis of anthrax-associated shock [36]. Infection with Bacillus anthracis can be cutaneous, gastrointestinal or pulmonary (inhalational). Frequently affected organs include secondary lymph nodes, lung, spleen, kidney, liver, intestinal serosa, heart, and brain proper [37]. Destruction of the organ function is due to the secretion of LT and ET. Some labs have reported that lethal toxin can disrupt endothelial barrier function [37]. The mechanisms causing endothelial dysfunction are stimulation of endothelial apoptosis, alteration of actin fibers and cadherins and mast cell activation [36,37]. Other lab has found that endothelial permeability is under tight control system where hypoxia activates signaling through the Rho-kinase-myosin light chain phosphatase pathway which leads to increased permeability [38].

However, hypoxia can activates p38 MAP kinase signaling leading to heat shock protein 27 (hsp27) phosphorylation which decreases endothelial permeability [39]. The majority studies indicate that anthrax lethal toxin induces the apoptosis of macrophages in an activated caspase-dependent way [40,41]. The cytotoxicity of lethal toxin is related to the activation of the transcription factor- NF-κB and TNF-α (tumor necrosis factoralpha) production in bovine macrophages [42]. It was shown that in bovine macrophages lethal toxin efficiently induces inhibitor-1- κB degradation and enhances the nuclear translocation of NF-κB. Neither protective antigen nor lethal factor alone had any impact of NF-κB activation. Lethal toxin induces apoptosis and necrosis in bone marrow derived macrophages and in activated human peripheral blood monocytes [41,43].

Interestingly, human alveolar macrophages demonstrate significant resistance to all the effects of lethal toxin, including inhibition of cytokine induction, lethal toxin-mediated MEK cleavage and lethal toxin-mediated apoptosis [44]. Lethal toxin, through its effect on the p38 pathway, disrupts glucocorticoid receptor signaling [45]. In vitro study has suggested that lethal toxin may depress murine cardiomyocytes function via an NADPH oxidase-mediated superoxide production mechanism [46]. Series of histological and microbiological studies concerning the effect of LT on intestinal tissues confirm LT-induced intestinal pathology, which is marked by villous blunting, mucosal erosions and ulceration [47-49]. Protective antigen is an 83 kDa pore-forming protein that binds to the anthrax receptors on the surface of the target cells and arrange entry of lethal toxin and edema toxin into the cytosol [50]. Native form PA consists of four domains with different functions: domain 1 – proteolytic activation by furin occurs in it; domain 2 – forms a transmembrane pore to translocate edema factor and lethal factor into the cell and contributes significantly to the receptor interaction; domain 3 – mediates in self-association of nicked form of PA83; domain 4 – primarily involved in binding to anthrax toxin receptor [50,51].

Upon binding to receptors, PA molecules undergo furin cleavage into 20 kDa fragment and 63 kDa subunits that remain cell surface bound. Furin is a critical housekeeping enzyme involved in protoxin activation [52]. Furin is essential for introducing the anthrax toxin into macrophages in highly pathogenic strains. The PA 63 kDa molecule creates a membrane channel that allows the entry of the LF toxin into the cytoplasm of the host cell [53]. It is extremely interesting that the site of cleavage of the PA protein of anthrax toxin has homology with the S1 site of the SARS-CoV2 virus, which is also affected by furin and the transmembrane protease serine 2 (TMPRSS2) [53]. Furthermore, both the anthrax toxin and the SARS-CoV2 virus infect macrophages and respiratory epithelial cells. In both infections, furin, the infected host’s protease, is the initiating enzyme. It is a factor that activates both the anthrax toxin and the SARS-CoV2 virus protein [54]. The characteristic protein sequences affected by furin are common among influenza, measles viruses, flaviviruses and the botulinum toxin [54]. They are the socalled initiation sequences, the presence of which among bacterial or viral strains increases their pathogenicity and virulence. As mentioned earlier, furin is a key host enzyme involved in the activation of protoxins and is therefore an interesting target for the search for its inhibitors. It is highly probable that the tropism and pathogenicity of bacterial strains increases as a result of the action of furin [54,55].

Anthrax Toxin Receptors

Two different cell surface receptors mediate anthrax toxin entry to the cells: ANTXR1, tumor endothelium marker 8 (TEM- 8) and ANTXR2, capillary morphogenesis protein 2 (CMG-2) [1,3]. TEM 8 and CMG 2 are type I membrane proteins containing the domain of von Willebrand factor A, which was originally identified in the blood serum protein as a platelet adhesion factor. ANTXR1 was previously discovered as a tumor endothelium marker, which is present at very low levels in healthy tissues and significantly increased in tumor tissues. ANTXR1 shares many similarities with integrins [56]. The ANTXR1 structural domains are similar to the β1 integrin domains and interact with type I and type VI collagen which also aid in cell migration and extracellular matrix reorganization [57]. On the other hand, the cytoplasmic part of the ANTXR1 receptor, directly anchored to the cytoskeleton of the actin cell, influences cell signal transmission, similar to integrins [58,59].

Cheng at al. for the first time investigated the mechanical signal transduction pathway initiated by the mechanical stimulation of the ANTXR1 receptor and its subsequent conversion to a biological signal in bone marrow stromal cells (BMSCc) [60]. The ANTXR1-initiated mechanotransduction involving the proteins LPR6 and LPR5 (low-density lipoprotein receptor-related protein) partially activates β-catenin to transfer a mechanical signal to the cell nucleus to regulate chondrogenesis [60]. Moreover, further experiments confirmed the interaction of ANTXR1 with actin and fascin actin-bundling protein 1 (FSCN1), which may also suggest the participation of anthrax receptors in the reorganization of the cell cytoskeleton [60]. Both CMG2 and TEM8 receptors have long cytoplasmic domains of 148 and 222 amino acid residues, respectively, like many other signaling receptors, and their physiological roles are related to cell migration and extracellular matrix remodeling [61,62].

Receptors can be post-translationally modified as a result of glycosylation, palmitoylation or ubiquitination [63,64]. Glycosylation affects protein folding in the ER, movement, and function. The TEM8 receptor has putative three glycosylation sites that are necessary for the movement of this protein from the ER and reaching the cell membrane [65]. It was verified that the TEM8 receptor lacking glycosylation did not bind the anthrax toxin in HeLa cells [65]. In contrast, the CMG2 receptor in the same cells, in the absence of glycosylation, could leave the ER and reach the cell membrane where it was able to bind ligand. Both receptors can be ubiquitinated by the action of the host ubiquitin ligase, leading to endocytosis of the clathrin-dependent toxin complex [63]. This process is even necessary for the intracellular activity of the anthrax toxin. S-palmitoylation involves the attachment of a 16-carbon fatty acid to a specific cysteine to form a thioester bond. In proteins, there may be a correlation between palmitoylation and ubiquitination within the same molecule. An example of such a phenomenon is the ubiquitination of the TEM8 receptor, if it has not been palmitoylated before, which leads to its destabilization and premature degradation [66].

The cytoplasmic domain of ANTXR1 and ANTXR2 are important in regulating half-life of the receptors at the plasma membrane [67]. The palmitoylation of cysteine residues increase the half-life of these proteins by preventing its premature clearance for the cell surface [63]. In the cytoplasmic domain, both receptors contain tyrosine residues phosphorylated following binding of protective antigen by receptor which is required for efficient toxin uptake [64]. There are three isoforms of ANTXR1. The ANTXR1-sv1, the longest isoform has 564 amino acids and the medium isoform ANTXR1-sv2 has 386 amino acids [68]; ANTXR1-sv3, the short isoform does not contain the transmembrane domain, so it cannot bind of PA and probably acts as secreted protein [69]. The studies of isoforms have demonstrated that the extracellular and transmembrane domains of these receptors are essential for PA binding, oligomer formation and translocation of anthrax toxin into the cytosol [69].

Toxin Entry into Cells

Toxin entry into host cells begins when protective antigen (PA83) binds to either of two cell surface receptors, ANTXR1 or ANTXR2. Following that PA83 is proteolytically activated by furinlike protease to create an active 63kD-form (PA63). Receptor – bound PA63 has the ability to oligomerize into heptameric or octameric rings, to form a pre-pore that can bind up to three molecules of either edema factor or lethal factor. The toxin-receptor complex is then internalized preferentially via clathrin-mediated endocytosis (Figure 1). This endocytosis appears to be protein depend such as clathrin, dynamin, heterotetrameric adaptor (AP-1) and actin [70]. ANTXR1 and ANTXR2 both could interact with lipoproteinreceptor- related proteins 5 (LRP5) and lipoprotein-receptorrelated proteins 6 (LRP6) [71]. Presumably, there are required for anthrax endocytosis. The large hetero oligomeric complex is then transported to early endosomes where it is incorporated into intraluminal vesicles [69].

The acidic pH of the early endosomes induces structural changes in the PA pre-pore leading to the pore formation as well as to the partial unfolding of edema factor and lethal factor [72]. The current study found that both proteins, EF and LF undergo major conformational changes during binding to PA [69]. These are then translocated through the PA pore across the endosomal membrane. It is understood that the anthrax toxin enzymatic subunits before being released into the cytosol must be transported to late endosomes in a microtubule dependent manner which is essential to protect them from lysosomal proteases. However, many of the details of this sophisticated delivery system remain to be elucidated.

Conclusion

Bacillus anthracis has two virulence factors, a poly-ɣ-Dglutamine capsule and bipartite toxins. The capsule of B. anthracis contributes to pathogenesis by blocking phagocytosis. The lethal toxin (LT) and edema toxin (ET) play a significant role in the pathogenesis of the disease. The study of the mechanisms by which these toxins modulate host defense has tremendously improved. The discovery of anthrax toxin receptors is a relevant for anthrax pathogenesis. Anthrax toxin receptors can regulate ligand-binding after conformational changes. A better understanding of anthrax pathogenesis may allow design of effective inhibitors. Future studies of anthrax toxins and their receptors promises to yield more information concerning toxin entry into the cells and therapeutic applications.

For More Articles: Biomedical Journal Impact Factor: https://biomedres.us

Open Access Journals on Environmental Science

The New and Effective Methods for Removing Sulfur Compounds from Liquid Fuels: Challenges Ahead- Advantages and Disadvantages

Introduction

Combustion of liquid fuels with organosulfur compounds such as sulfides, disulfides, thiophenes and the corresponding derivatives emits harmful gases SOx and NOx. HDS is main methods used for desulfurization, but this process is inefficient in removing organo sulfur compounds [1]. So recently, former techniques such as adsorption desulfurization (ADS) and oxidation desulfurization (ODS) were considered [2]. The main challenge of the ADS method is the selection of adsorbents with high adsorption capacity and selectivity [3]. Vafaee, et al. [4], synthesized nanosorbents of (A: Ni, CO & Mg) AFe2O4-SiO2 by an auto-combustion sol-gel method and used them in the ADS process. Also, Vafaee, et al. [5] used NiFe2O4- Polyethylene glycol catalyst for ultrasound assisted oxidative desulfurization (UAOD) process using central composite design (CCD) under response surface methodology (RSM). Consequently, ferrites in the adsorbent and phase transfer catalyst were easily separated and recycled via magnetic field for desulfurization process.

Conclusion

In this study, efficiency of ADS and UAOD methods with the AFe2O4-SiO2 (A: Ni, Co & Mg) nanoadsorbent and NiFe2O4-PEG phase transfer nanocatalysts were reviewed. In the UAOD process, increasing the temperature and oxidant amount had the greatest effect on increasing the percentage of DBT conversion. In addition, one of the main challenges of ADS and UAOD methods is the use of adsorbents and phase transfer catalysts with easy separation and recovery capabilities. Therefore, using the magnetic field caused by ferrites in the adsorbent and phase transfer catalyst structure, they were easily separated and recycled after desulfurization.

For More Articles: Biomedical Journal Impact Factor: https://biomedres.us

Open Access Journals on Old Age Psychiatry

Vitamin D Supplementation for the Treatment of Depression in Females in a Private Practice Clinic

Introduction

During the last decade there is a strong interest regarding the effect that vitamin D plasma levels can have in depression [1]. There are also studies that suggest the use of vitamin D supplementation either by mouth or through light therapy as an add-on therapy for depression [2]. Influenced by this evidence, during the winter season of 2019, we used Vitamin D3 supplementation mainly as an add-on therapy for the treatment of patients suffering from depression in our private practice. In order to better assess the results of this intervention and also to communicate our experience to other practitioners, we concluded a small case series study with all our depressed patients that received vitamin d supplementation, during a certain time frame.

Material and Methods

Subjects

During autom of 2018 and witner 2018-2019 Every patient that was treated for depression that was presented with residual depressive symptoms was assessed for Vitamin 25(OH) blood levels. Subjects with Vitamin D blood levels below 30ngr/ml where assessed for this study. In total ten patients were assessed. Out of them eight where included in the study since two of the patients were suffering from psychosis and not depression and were excluded. All patients were Caucasian women with a mean age of 54,29 (S.D 16,75). (Table 1)

biomedres-openaccess-journal-bjstr

Table 1: Various numerical parameters of the study, initial with final vitamin d levels were compared with paired T test and had a statistically significant difference with p= 0,014.

Method

All subjects were prescribed with Vitamin D3 oral supplementation oral dose ranging between 2000 and 5000 UI of Vitamin D3 per day was administered. One of them was treated with Vitamin D3 as monotherapy while in the rest; Vitamin D3 was used as an add-on therapy. Levels of Vitamin 25(OH) were assessed again within two months’ time frame. Patients with major changes in their treatment such as addition of another antidepressant were to be excluded from this study but in our sample nothing like this occurred during the time frame of this study. Qualitive analysis was used on the psychiatric records that were kept in our private practice in order to assess the symptoms that are more likely correlated with low vitamin D levels. Qualitive analysis was also used in the follow up assessment of the patient in order to detect the symptoms that might have responded to vitamin D supplementation. Final assessment took place three months after the first assessment for each individual. Paired T test was used to compare changes in Vitamin 25(OH) blood levels. SPSS for windows in version 15.0 was used for this comparison.

Results

All assessed patients had some type of Vitamin D deficiency mean level of Vitamin D(OH) was 12,04 ngr/ml (S.D. 7,995) with levels ranging from 4,5ngr/ml to 26,5ngr/ml. Seven out of eight having vitamin d blood levels below 20ngr/ml. The mean dose of Vitamin D(OH) supplementation was 4142,88units/per day (S.D 1399,75), with most of them taking a dose of 4000 units/per day. Final assessment of Vitamin D (OH) levels took place within two months period, mean time of 52,67 days (S.D. 30,651) while it was still in winter. There was a significant increase of Vitamin D (OH) blood levels 25,65ngr/ml (S.D. 11,559) p=, 014 (Table 1). Qualitive analysis showed that the main complain that all patients had in common was psychomotor retardation less common but significant was also morning depression. These symptoms and especially psychomotor retardation tend to improve in various degrees two months or more after the beginning of Vitamin D supplementation (Figure 1).

biomedres-openaccess-journal-bjstr

Figure 1:

Discussion

This is a prospective case series; its results are hopeful. It seems that there is a strong possibility that depressed female patients with a certain residual symptom profile might also suffer from vitamin d deficiency. More specifically symptoms such as psychomotor retardation or morning depression seem to be more correlated with vitamin d deficiency [3]. This study was conducted in total in winter time. This happened since we wanted to reduce confounders such as sun exposure, which is much more likely to happen during summer, and can change the levels of vitamin d in blood regardless of our supplementation [4]. It is important to understand though that in this case psychiatrists should change their treatment culture. While in almost all their care tend to treat almost completely without biological markers, vitamin d supplementation for treatment of depression requires a different approach. In our study first we check and if there was a vitamin d deficiency and then we prescribed supplementation of vitamin D [5]. Vitamin D3 was prescribed since it seems to be a better alternative in comparison with other vitamin D supplements such as Vitamin D2 [6].
A significant improvement in depressive symptoms, that was correlated time wise at least with the increased of Vitamin D blood levels, was observed. This is in accordance with patient’s satisfactions, which do not consider Vitamin D as another ‘Psychiatric drug’. Caution should be placed thought to the regular follow up of Vitamin D levels since high above normal Vitamin D levels can also be toxic [7]. So if Vitamin D levels are raised above limits Vitamin D supplementation should be stopped. Furthermore, during summer period Vitamin D levels are raised since our body composes it to higher degree due to increased sun light exposure, thus vitamin D levels must be more thoroughly checked during summer time. This brings us to another point. The aim of supplementation is the increase of vitamin D levels in the body. If we can achieve that with other means except prescribing a supplement such as sun exposure it is also good practice to try. The knowledge of the effect that vitamin d can have in the mood and the benefits of sun exposure related to it, might motivate a significant proportion of depressed patients to increase their outdoors activities [8].
This study has significant limitations. Firstly, it is a small study. There are very few patients included. The researchers present this as a case series and not a cohort or other more powerful type of study. Furthermore, the fact that all patient were Caucasian women increases somehow the power of this study. The other limitation is the fact that no standardized assessment of patients initial status or treatment progress, with the use of questionnaires occurred. This makes more difficult to interpret study’s findings. To our view since the aim of our approach was to treat residuals symptoms it was difficult for these symptoms to be detected through formal questionnaires that asses overall depression, furthermore the observation and consensus of two specialized psychiatrists has its value when we asses depression and gives some addition credibility to the results. Also, qualitive analysis that we used is an acceptable measure of outcome [9].

Conclusion

Although results are quite preliminary, there is a strong feeling, that Vitamin D supplementation is effective in treating certain depressive symptoms. Of course, much further study is needed for any firm conclusions.

For More Articles: Biomedical Journal Impact Factor: https://biomedres.us

Open Access Journals On Department of General Practice

The Diagnostic Value of Galactomannan Testing in Bronchoalveolar Lavage Fluid on the Diagnosis of Pulmonary Aspergillosis in Patients with Chronic Respiratory Diseases

Introduction

According to the definition of chronic respiratory diseases (CRD) by the World Health Organization, CRD is a group of diseases that affect the airways and other structures of the lungs, the most common include COPD, bronchial asthma, bronchiectasis, etc. [1]. In-depth studies in recent years have found that pulmonary aspergillosis can also occur in patients with chronic respiratory diseases (CRD) [2,3]. As delayed treatment of pulmonary aspergillosis always leads to high mortality rate, early recognition of CRD with pulmonary aspergillosis is extremely important. Galactomannan (GM) is a thermally stable polysaccharide on the cell wall of aspergillus filaments, which is released into the blood from the tip of the mycelium during aspergillus growth [2]. GM can be detected in the blood in the early stages of infection. Nevertheless, various factors have been found in clinical practice to cause false positives and false negatives in galactomannan testing. Bronchoalveolar lavage fluid (BALF) can be applied to detect pathogens on lung lesions in the early stage of aspergillus infection.
Although BALF has been recommended for GM testing by domestic and foreign guidelines, there is no unified standard for BALF-GM testing cut-off value [2,3]. In this study, bronchoalveolar lavage fluid (BALF) was collected from 100 patients with suspected clinical pulmonary Aspergillus infections by means of bronchoscopy. BALF GM test and serum GM test were compared to assess the diagnostic value of galactomannan testing in bronchoalveolar lavage fluid on the diagnosis of pulmonary aspergillosis in patients with chronic respiratory diseases.

Patients and Methods

Patient Selection

Between June 2019 and December 2019,100 patients with suspected clinical pulmonary aspergillus infections from three different hospitals (50 patients from the Guangzhou Thoracic Hospital,45 patients from the Guangdong Province People’s Hospital, and 5 patients from the First Affiliated Hospital of Sun Yat-Sen University, respectively) were enrolled in this retrospective analysis. They all suffered from chronic respiratory diseases include COPD, bronchial asthma, bronchiectasis, etc. Data of all patients were collected, including age, sex, smoking history, past medical history and medication history, length of stay, laboratory tests, chest imaging examination, pathogen examination, lung pathology and bronchoscopy results. Serum and BALF GM tests were performed during their hospitalization. Factors that might cause false positives in the GM test such as piperacillin/tazobactam were excluded. Hematological malignancies, hematopoietic stem cell transplantation, solid organ transplantation, HIV infection, and patients with incomplete clinical data were excluded from the study.

Statistical Analysis

a. Koimogorov-smirnov test (K-S test) was used by SPSS 25 software to determine whether the target variables were normally distributed. If the measurement data conformed to normal distribution at the same time, it was represented by mean ± standard deviation (`X±s). For the measurement data that did not conform to normal distribution, it was represented by M(P25-P75). The counting data was expressed by percentage or constituent ratio. Independent sample T test was used for BALF GM values of the case group and the control group, paired sample T test was used for BALF GM values and serum GM values of the case group, non-parametric rank-sum test and Mann-Whitney U test were used for samples that did not conform to normal distribution.
b. SPSS 25 software was used to draw ROC curves of the diagnostic efficacy of BALF and serum GM test in the case group and the control group, and the optimal cut-off value of BALF and serum GM test for pulmonary aspergillosis was calculated.
c. The data of baseline features, clinical features and imaging examination of the subjects were analyzed with the independent sample T test or chi-square test for normal distribution, and non-parametric rank-sum test for nonnormal distribution. The differences were considered to be statistically significant when p<0.05.
d. According to several guidelines, the cut-off value of GM was between 0.5 and 1.5, and the cut-off value of 0.5, 0.8, 0.9, 1.0, 1.2 and 1.5 have been reported in many guidelines and metaanalyses. Sen, spe, positive predictive value (PPV), and negative predictive value (NPV) of BALF GM were calculated.

Results

Patient characteristics and data.4 patients with incomplete data and follow-up loss were excluded, and a total of 96 patients were included in this study. According to the diagnosis standards of IDSA (2016) [2], 43 patients were diagnosed by pathological data (proven diagnosis), and 3 cases were diagnosed by radiology, etiology, and other clinical examinations (probable diagnosis). Both of them were included in the case group. The control group included 6 cases of possible pulmonary aspergillosis and 44 cases of nonpulmonary aspergillosis. Clinical data of patients were collected (Table 1). The most common clinical symptoms in the case group were cough (41cases,89.1%), hemoptysis (30 cases,65.2%) and expectoration (27 cases,58.7%). Whereas in the control group were cough (36 cases,72.0%), expectoration (27 cases,54.0%) and fever (16 cases,32.0%). The clinical symptoms of hemoptysis and cough were statistically different between the two groups.
The imaging findings of patients in the two groups included nodular shadow, patchy shadow, consolidation shadow, air crescent sign, cavity and aspergillus balls. Nodular shadow (27 cases,58.7%) and cavity (22 cases,47.8%) were dominant in the case group, while patchy shadow (14 cases,28.0%) and nodular shadow (13 cases,26.0%) were dominant in the control group. The imaging manifestations of nodular shadow, cavity and aspergillus bulb were statistically different between the two groups. Microbiological examination results. In the case group there were 21 cases (45.7%) of positive aspergillus in BALF culture and 3 cases (6.50%) of positive aspergillus in BALF smear microscopy. The serum GM value was 0.18(0.12-0.34) in the case group and 0.12(0.07-0.21) in the control group, showing no statistical difference. BALF GM value was 1.93(0.61-5.78) in the case group and 0.51(0.25-0.82) in the control group, Z value =-4.709. BALF GM value in the case group was higher than that in the control group, P<0.05 (Table 2).

biomedres-openaccess-journal-bjstr

Table 1: Baseline characteristics of patients in case group and control group(%).

Note: *P value < 0.05, the difference was statistically significant

biomedres-openaccess-journal-bjstr

Table 2: Comparison of microbiological examination results between the case group and the control group.

Note: *P value < 0.05, the difference was statistically significant

Diagnostic effificacy of the BALF GM test. When the GM cutoff value was 0.5,0.8,0.9,1.0,1.2,1.5, the sensitivity of BALF GM test decreased with the increase of GM cut-off value, and the specificity increased with the increase of GM cut-off value. When the diagnostic threshold of serum GM test was 0.5 and 1.0, the sensitivity decreased with the increase of the threshold, but the specificity did not change. BALF GM test had higher sensitivity but lower specificity than serum GM test (Table 3). The area under ROC curve of BALF-GM was 0.779(95%CI: 0.684-0.874),standard error was 0.0487,Z value was 5.727,P =0.001, Youden index was 0.4939,when thre hold>0.96,the sensitivity and specificity were 67.4%,82.0% respectively (Figure 1, Table 4). The area under ROC curve of serum-GM was 0.638(95%CI: 0.439-0.807), standard error was 0.121, Z value was 1.147, P=0.255, Youden index was 0.3116, when threshold> 0.18, Sen was 47.8%, Spe was 83.3%; When serum-GM threshold ≥0.18, AUROC was the highest, for which the sensitivity and specificity were 45.5%,83.3% respectively (Figure 2, Table 4).

biomedres-openaccess-journal-bjstr

Figure 1: ROC curves of BALF-GM test in two groups.

biomedres-openaccess-journal-bjstr

Figure 2: ROC curves of serum-GM test in two groups.

biomedres-openaccess-journal-bjstr

Table 3: Diagnostic value of different GM test limits for BALF GM test.

biomedres-openaccess-journal-bjstr

Table 4: Comparison of ROC curve analysis parameters between BALF-GM test and serum GM test.

Discussion

Structural lung disease is a major cause of pulmonary aspergillosis, including bronchiectasis, PTB, bronchial asthma, COPD, etc. Long-term and chronic diseases lead to the destruction of the normal anatomical and physiological structure of the lungs, the destruction of the mucosal barrier of respiratory epithelial cells, and increase the ability of aspergillosis to adhere to airway epithelium. In addition, cilium lodging and degeneration of airway epithelium and obstruction of clearance of respiratory secretion increase the chance of aspergillus infection [4,5]. This study also confirmed that patients with pulmonary aspergillosis had more chronic respiratory diseases in the case group than in the control group (bronchiectasis 58.7% vs.12.0%, P=0.001),PTB (82.6 vs.20.0%,P=0.001),COPD (43.5% vs.22.0%,P=0.025),which was consistent with the results reported in literature [6].The early clinical manifestations of pulmonary aspergillosis are not specific, and the typical chest CT findings are often related to the time of disease occurrence and the severity of lesion development, and the imaging findings cannot lead to a definite etiological diagnosis.
Traditional methods such as smear microscopy and fungal culture have long cycle, low positive rate and are susceptible to environmental pollution. Therefore,a variety of auxiliary examination methods are used to achieve the purpose of early diagnosis. Galactomannan (GM) is a specific polysaccharide of aspergillus cell wall. At present, GM can be detected clinically by blood, BALF, pleural effusion, cerebrospinal fluid and lung tissue, and it is one of the common antigens for the diagnosis of aspergillosis. A large number of existing studies have proved that the sen, spe, ppv and diagnostic coincidence rates of BALF were higher than those of serum GM. The results of this study showed that the cutoff values of BALF GM test were all higher than serum GM, which was consistent with the results of previous studies. The uniform diagnostic threshold of BALF GM has been disputed at home and abroad. The IDSA 2016 guidelines again recommended BALF GM and serum GM tests as laboratory tests for pulmonary aspergillosis. However, they did not specify a BALF GM value, but the diagnostic threshold of serum GM test was ≥0.5[2]. In 2019, EORTC/MSGERC scholars updated the definition of IFD, which clearly indicated for the first time that the clinical diagnostic threshold of BALF GM as pulmonary aspergillosis was: serum GM≥1.0,2 BALF GM≥1.0; or a single serum GM≥0.7+a single BALF GM≥0.8 [7,8].
In this study, through ROC curve analysis, the AUROC of BALF GM test was 0.779(95%CI:0.684-0.874).When BALF GM test limit> 0.96,Sen was 67.4%,Spe was 78.0%,PPV was 73.8%, NPV was 72.2%, PLR was 3.06.When serum GM limit was greater than 0.18,AUROC was the highest, Sen was 45.5%,Spe was 83.3%,and P=0.255.The purpose of this study was to understand the value of BALF GM in the early diagnosis of pulmonary aspergillosis in patients with nonneutropenia complicated with pulmonary underlying diseases. Our results showed that the sensitivity of serum GM test was lower than BALF GM test regardless of setting GM≥0.5, ≥0.8, or ≥1.0 as the diagnostic threshold of BALF GM. When GM threshold was≥0.5, Sen,Spe,PPV of BALF GM were 80.43%,48.0%,58.73% respectively. When the BALF-GM threshold was increased to ≥1.0, the PPV was significantly increased. Compared with previous studies [9,10], BALF GM values of patients with chronic respiratory diseases were different from those of patients with traditional diseases such as neutropenia, hematological malignancies, parenchymal organ transplantation, hematopoietic stem cell transplantation, and immunosuppressant use.
At present, some scholars have proposed that different optimal diagnostic boundaries should be set for patients with different underlying diseases and different immune states, such as neutropenia and non-neutropenia [10], organ transplantation (including hematopoietic stem cell transplantation) and non-solid organ transplantation [11,12], hematological malignancies [13,14], etc. Similarly, the interpretation of BALF GM test results should also be based on the full assessment of the underlying diseases and immune status of patients to determine the optimal BALF GM diagnostic threshold for various patients, so as to improve the diagnostic efficacy of BALF GM in the diagnosis of pulmonary aspergillosis in different populations. Research and clinical practice at home and abroad have found that many factors affecting GM tests cause false positives and false negatives in GM tests, which often confuses clinical work and even leads to misdiagnosis, missed diagnosis and excessive antifungal treatment.
In this study, it was found that BALF GM value was higher in some patients without aspergillus infection in the control group, while BALF GM value was lower in a small number of patients with aspergillus infection in the case group, resulting in false negative in addition to sample dilution during BALF collection, which might also be related to the use of antifungal drugs. A recent review suggested that false negatives in GM tests were associated with the use of antifungal active agents and myxolytic agents [15]. Using beta lactam classes of antibiotics (especially piperacillin/ he azole temple, amoxicillin/clavulanic acid potassium, etc.), intravenous use of parenteral nutrition, blood product containers containing glucose acid, severe gastrointestinal mucous membrane inflammation, multiple myeloma will lead to GM false positive [15]. Clinical cases have also reported that contamination of sterile containers could lead to false positives of GM [16]. According to previous studies and the results of this study, the early diagnosis of pulmonary aspergillosis requires combining imaging examination, histopathology, smear microscopy, fungal culture, aspergillosis antigen detection, aspergillosis antibody detection, and molecular biological examination.

Conclusion

In this study, BALF GM test is more valuable than serum GM test for diagnosis. BALF GM test is more significant for the diagnosis of pulmonary aspergillosis. The best limit, sensitivity and specificity of BALF GM test are 0.96,67.4% and 82.0%(P=0.01). The optimal threshold of BALF GM may vary with host-based diseases and even with different species of Aspergillus. BALF GM value of pulmonary aspergillosis under different immune states needs more clinical data. At the same time, when serum GM and BALF GM are used in clinical practice, it is necessary to fully understand and identify the false positive and false negative of GM, and to diagnose pulmonary aspergillosis by integrating patient factors, clinical manifestations, imaging examination and pathogenic microbial examination.

For More Articles: Biomedical Journal Impact Factor: https://biomedres.us

Open Access Journals on Natural Sciences

Vaccination Against COVID-19, A Healthy Alternative

Commentary

Since the first reported cases of COVID-19, the world has been grappling with this disease and its consequences. Confirmed cases are increasing, the numbers of daily deaths are chilling, countries suffer the paralysis of social life and the national economy. Meanwhile, the scientific community has been racing against time to find effective vaccines in response to the pandemic. Vaccines have the function of preparing the immune system to detect and fight specific viruses and bacteria, achieving that if the body is exposed to pathogenic germs, it will be ready to destroy them immediately and thus prevent disease. It is sought with the vaccine, protection against the most severe forms of the disease and mortality. In June 2021, the World Health Organization (WHO) reported the existence of 185 vaccine candidates in the preclinical development stage and another 102 in the clinical trial phase [1]. Currently, the WHO has authorized the use of six vaccines, others are still being studied for subsequent approval. National Regulatory Agencies have authorized COVID-19 vaccines in specific countries [2].
The first mass vaccination program started in early December 2020. The great spread of the novel coronavirus increases the demand for vaccines, but their limited production will lead to the use of all formulations that prove to be suitable. The effectiveness of a vaccine is measured by the percentage reduction in the frequency of infections among vaccinated people compared to the frequency among those who were not vaccinated, assuming that the vaccine is the cause of this reduction. Effectiveness represents the health benefits provided by a vaccination program in the population when the vaccines are administered in the real or usual conditions of daily care practice or program development [3]. Although all currently approved vaccine platforms have been shown to stimulate both the humoral and cellular responses, there is a great unresolved question: How long does the immunity conferred by vaccines last? Nevertheless, the vaccination option is a healthy choice for the general population.
Vaccination has been intensifying in risk groups such as those over 60 years of age, patients with comorbidities such as heart disease, diabetes, among others. Pregnant women have been prioritized to achieve an ideal immunization, as this group is one of the most disadvantaged before the disease, due to the physiological changes of pregnancy and the decrease in the immune system of the pregnant woman. According to data provided by the Pan American Health Organization (PAHO), more than 270,000 pregnant women have fallen ill with COVID-19 in the Americas and more than 2,600 have died from that cause since the start of the pandemic, it is also important to take into account breastfeeding women [4]. The pediatric population is another of the risk populations towards which vaccine interventions are currently directed. Being especially vulnerable to COVID-19, health personnel have been among the first to receive any of the existing vaccines. This occupational group is at higher risk for severe COVID-19.
Until today, vaccination is the best strategy to control the spread of the virus, but it should not be forgotten that changes in personal behavior and attitude will be increasingly necessary. The biosafety and self-care measures that the population must maintain must be a priority to be able to return to a social normality that is so longed for. Getting the largest number of people vaccinated as quickly and globally as possible, along with non-pharmacological interventions, could ensure that the virus can be suppressed rather than spread [5]. The news reflects new outbreaks and the increase in cases in many countries, even as vaccination campaigns are progressing. The population is concerned about the increase in cases, which occurs at the same time as the introduction of vaccines. This largely depends on the type of variant that circulates in the region, the Delta is much more virulent and therefore the contagion increases in its presence, despite the fact that there is a certain level of population vaccination.
Vaccination leads to collective protection, although there will be patients in the group, they will not be able to transmit the disease, either due to the immunization conferred by the vaccine or because they were convalescent, this is the so-called herd immunity. The aim of the vaccine is to reduce deaths, serious and critical cases, intensive care units, hospitalizations and then the incidence rate [6]. Cuba began the intensive vaccination program on May 12, 2021, and as of September of the same year, more than 14 million doses of nationally produced vaccines had been applied. In a staggered manner, the strategy for the development, introduction and extension of Cuban vaccines has been applied, which ranges from clinical trials, studies in risk groups, health intervention to mass vaccination, a stage in which the country is immersed. Cuba already has three quality, safe and effective immunogens. Abdala approved in July 2021 and Soberana 02 together with Soberana Plus authorized in August of the same year [7].
One of the worst health situations in the history of mankind is being experienced. The loss of human life is quantified in the thousands, in addition to the situations of social deprivation and health that are worsening in the world population. Faced with this situation, it is necessary to consider the research progress, the production of science based on evidence, to respond in the best way to this pandemic caused by COVID-19. Vaccination, without a doubt, is an alternative that raises the hope of success in the face of this disease.

For More Articles: Biomedical Journal Impact Factor: https://biomedres.us