Open Access Journals on Agriculture

Determinants of Poverty in Farming Households in Southwest Geo-Political Zones of Nigeria

Introduction

The significance of rural poverty is underscored by the fact that as much as 45% to 80% of national population reside in the rural areas and are dependent in agriculture in most developing countries Ravalion et al. 2007. Poverty can be described as the level of deprivation that encompasses shortfalls or inadequacies in basic human needs, which prevent people from achieving internationally acceptable levels of well-being Etim, et al. [1]. This situation, which has been ascribed in some quarters to production failure owing to a suppression of markets and in some other quarters to institutional and distributional failure Ognonna et al. 2007 is characterized by disease, low life expectancy and physical and mental retardation. Globally, about 1.2 billion people are in extreme poverty, living on less than a Dollar per day IFAD [2]. Majority of these people are in developing countries, 44% in South Asia, 24% each in sub- Saharan Africa and East Asia and 6.5% in Latin America and the Caribbean IFAD [2,3]. Within these regions, poverty is largely a rural phenomenon with an average of between 62 and 72% of the population living on less than a dollar a day Owuor, et al. [4]. In comparison, rural poverty also tends to be deeper than urban poverty in these regions Owuor, et al. [4].
In Nigeria rural poverty levels are relatively high. For example, a national poverty survey carried out in 2003 and 2004 indicates that the urban areas have poverty levels estimated at 43.2% while the rural areas have poverty levels that are as high as 63.8% Federal Republic of Nigeria [5,6]. The mean national poverty incidence stands at 54.7 NBS [6]. However, evidence indicates that this situation has not improved in the last 15 to 17 years in a majority of Sub-Saharan countries of Africa Owuor, et al. [4]. In Southwestern Nigeria, about 70% of the populations live in the rural sector and are dependent on agriculture as in most developing countries of the world for their livelihood Akoroba 2007.

Problem Statement

Poor people live without fundamental freedoms of action and choice that the better off take for granted Elijah [7]. They often lack adequate food and shelter, education and health, deprivations that keep then from leading the kind of life that every one values. They also face extreme vulnerability to ill health, economic dislocation, and natural disasters Owuor, et al. [4] and they are often exposed to ill treatment by institutions of the state and society and are powerless to influence key decisions affecting their lives. These are several dimensions of poverty World Bank [8]. Poverty is an unacceptable deprivation in well-being World Bank [8]. It exists when there is lack of the means to satisfy critical needs. Poverty can be regarded as the status, objective or subjective, of an individual or a population. Poverty will have an objective definition once observable and measurable indicators exist that are used to approach the material or other aspects of the lives of individuals. On the other hand, the subjective definition of poverty is when judgment (including value judgment) of individuals is taken into consideration in order to investigate their welfare Amao [9]. Reducing poverty is an important development policy issue because economic growth is obviously associated with poverty reduction. Nigeria has experienced a high incidence of poverty alleviation Etim NA, et al. [1]. The worrisome aspect of this phenomenon is the spatial differences in the incidence of poverty in Nigeria.
The United Nations Human Development Report (1998) declares that Nigerian poverty level is getting worse by the day and more than four in ten Nigerians live in conditions of extreme poverty of less than N320 per capita per month, which could hardly provide for a quarter of the nutritional requirements of healthy living. This is approximately $8.2 per month. The report ranked Nigeria 146 out of a total of 174 countries in its Human Development Index (HDI), which measures achievement in terms of life expectancy, education and real income per capita. Poverty has been identified as a rural phenomenon and its interventions will be effective only if the correct poverty causing factors are identified In recent years, because of the large prevalence of poverty, reducing it has been of great concern to many developing countries for the past few decades Babatunde, et al. [3]. This situation has created the quest for poverty reduction strategies which have been at the center stage of development programmes and policies. The progress towards the global target of halving, between 1990 and 2015, the proportion of people living in extreme poverty, has been very slow. The main problem lies in the fact that despite the high poverty rates in Nigeria little is documented on policy related determinants of rural poverty among farmers especially arable crop farming households, making it very difficult to effectively set and implement sustainable antipoverty programmes. Hence, the objective of this study was to empirically determine factors influencing arming household poverty in Oyo state.

Methodology

Study Area

The study was carried out in selected States of Southwestern Nigeria. Southwestern Nigeria comprises six states which are Lagos, Ogun, Oyo, Osun, Ondo and Ekiti. The Southwest lies between latitude 50N and 90N of the equator and longitudes 2.50 and 60N east of the Greenwich Meridan. It is bounded in the East by Delta State, the Republic of Benin in the West, Kwara and Kogi State in the North and by the Atlantic Ocean in the south. The major occupation in the States is farming in which Maize, Cassava, Rice, Yam, Oil palm, Cocoa, Timber are produced enormously. The vegetation pattern of the states is of rainforest in the south and guinea savannah in the north. Figure 1 shows the position of the study area in the map of Nigeria.

biomedres-openaccess-journal-bjstr

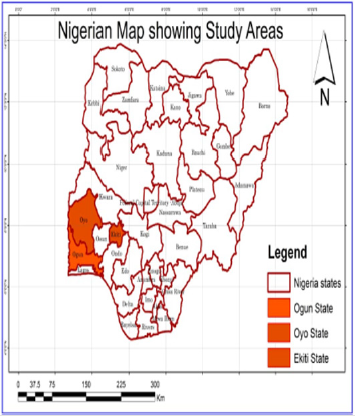
Figure 1: Map of Nigeria Showing the Study areas.

Sampling Techniques and Data Analysis

Multistage sampling procedure was used to select 600 rural farming households across the selected states (Oyo, Ekiti and Ogun) in Nigeria. First stage involved the selection of two (2) Zones from each states making 6 zones. Second stage involved random selection of two (2) blocks from each of the six (6) ADP zones respectively making 12 blocks. Stage three involved random selection of four (4) cells from each of the 12 blocks making 48 cells. While the last stage involved random selection of thirteen (13) rural households from each of the 48 cells making six hundred (600) rural farming households. Primary data were collected using structured interview guide.

Analytical Method

The statistical tools used to realized the objective of this study were tables, percentage, mean poverty ratios and multiple regression analysis.
Descriptive statistical tools such as tables, means and percentages were used to analyse the poverty line. However, the analysis used household expenditure as a proxy for income, as income was very difficult to obtain.

Z = 2/3 Y* …………………………. 1

Where,
Z = Poverty line measured in Naira. This was defined as the minimum level of consumption required and individuals or households falling below the threshold were considered poor. This was used to establish the poor and non-poor farming households. Y* = Mean of per capita household expenditure, measured in Naira and derived as the average of per capita household expenditure following Babatude, et. al. [3]
Linear multiple regression analysis was used to estimate the determinants of rural poverty following Olubanjo, et al. (2007). The implicit functional form was specified as:
P = f(X1, X2, X3, X4, X5, X6, X7,E) ……..… 2
Where
P = Poverty line
X1 = Age of the household head (Years)
X2 = Marital Status
X3 = Educational level (Years)
X4 = Household size (Numbers)
X5 = Primary Occupation
X6 = Income from Primary Occupation (₦)
E = Error term

Result and Discussion

Socio-Economic Characteristics of the Respondent

Table 1 shows the socioeconomic characteristics of the respondents in the study area. The results of the descriptive statistics reveal that 54% were male while 46% were female. Thus, this implies that male dominate farming activities than in the study area. The table also shows that 48% of the respondents were married with 27% having no formal education. Majority (44%) of the respondents have less than 5 acres of farm size with 65% choosing farming as their major occupation.

biomedres-openaccess-journal-bjstr

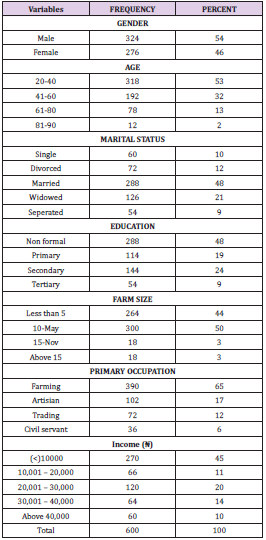
Table 1: Socioeconomic distribution of the respondents.

Note: Source: Field Survey Data, 2014

Estimated Poverty Line

The poverty lines was estimated based on per day expenditure among farming households in the study area. Results showed that the mean annual household food expenditure among the farming households was estimated as ₦11,226.11 while the poverty line was estimated as ₦427.14 per person per day. This implies that any farming household living below ₦427.14 on person per day was categorized as poor household. This implies that could not meet the daily needs of the entire farming household. Considering the mean household size of 6 persons per household, this was lower than the international poverty threshold of $1.25 per person per day for people living in sub-Saharan Africa and Asian countries as viewed by Ravallion, et al. [10]. This result tends to suggest problems of food insecurity among farming households. In other words this amount may not be able to meet the minimum daily calorie in-take of 2250 Kcal required per person per day.

Estimated Determinants of Poverty

Table 2 shows the determinant of poverty among the respondents’ household in the study area. It reveals age, marital status and household size are statistically significant at 5%, 1% and 10 respectively to their poverty level. This lends credence to some author’s finding such as Elijah, et al. [4,7] that as the age of the household head increases, poverty level decreases. Education also enhances the ability to derive, decode and evaluate useful information as well as improves the quality of labour as viewed by Onyenweaku [11-15].

biomedres-openaccess-journal-bjstr

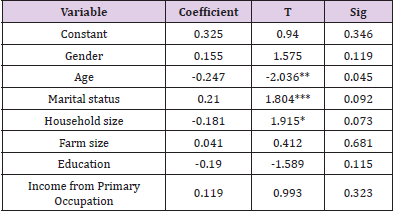
Table 2: Determinant of poverty among rural household in the study area.

Note: Field survey, 2014.
* = Significant at 10 percent ** = Significant at 5 percent *** = Significant at 1percent.

Conclusion

The poverty line of ₦427.14 obtained was a reflection of limited resources among the farming households in the study area. The results tend to suggest problems of food insecurity among poor farming households. If farming households are to improve on food security, then there is the need to provide them with adequate compensation scheme. This can be done through provision of credit facilities. This will encourage them to produce more irrespective of the cost of production and increase in income. Finally, the determinants poverty among farming households were age, marital status and household size. The result of the determinants of poverty serves as criteria for policy interventions.

For More Articles: Biomedical Journal Impact Factor: https://biomedres.us

Open Access Journals on Biochemistry

Association of Fibroblast Growth Factor Receptor Gene (FGFR2) Polymorphism (rs2981582) and its Expression with Breast Cancer

Breast Cancer (BC) is one of the most common malignant tumors among women all over the world and has the highest mortality rate amongst the cancers afflicting women [1]. In recent years, its incidence has increased among young women with increasing tendency of chemo-resistance and recurrence [2,3]. Genetic factors such as BRCA1, BRCA2, HER2, CyclinD1, MAP3K1, FGFR2, TOX3, etc play a major role in etiopathogenesis of breast cancer [4]. Lots of researchers have reported the association between FGFR2 polymorphism and BC risk [5-7]. FGFRs mediate signaling of fibroblast growth factors (FGFs) and have numerous important functions [8]. FGFR2 gene is located at chromosome 10q26 and acts through multiple downstream signaling pathways that play vital roles in cell proliferation, survival and differentiation [9]. The role of FGFR pathway as a predictive/prognostic marker has been investigated through various studies. According to these studies, aberrant FGFR2 expression is associated with an increased risk of BC and correlates with poor prognosis [10,11]. According to Gene Wide Association Study (GWAS), five single nucleotide polymorphisms (SNPS) (rs7895676, rs2912781, rs10736303, rs2912778 and rs2981582) in the non-coding region of FGFR2 were found to have a significant association with breast cancer. FGFR2 (rs2981582) in intron 2 has been identified as the most significant breast cancer risk locus by the Breast Cancer Association Consortium genome wide association study [12]. Hunter et.al (2007) also identified four other SNPs, rs11200014, rs2420946, rs1219648 and rs2981579 in intron 2 of FGFR2 that are also associated with breast cancer [13]. Therefore, it becomes very important to understand the FGFR pathway on how it leads to BC and how it can be targeted. Several trials are being done with multiple agents that target FGFR pathway components [14-16]. According to these trials, identification of patients with FGFR pathway amplified tumors who may respond to this treatment may be possible. Large number of studies are available on relevance between FGFR2 single nucleotide gene polymorphisms (rs2981582 and rs2981579) and breast cancer, but the results vary with geographical differences [17]. There is hardly any study exploring the association of rs2981582 FGFR2 polymorphism in patients of breast cancer with Indian ethnicity. Therefore, we developed an interest to elucidate the frequency of this polymorphism and its influence on FGFR2 expression in Indian patients with breast cancer.

Materials and Methods

Study Site and Patient Recruitment

The present study was conducted at the Department of Biochemistry in collaboration with the Department of Surgery and Department of Pathology, Maulana Azad Medical College and Associated Hospitals, New Delhi, India. The Institutional Ethics Committee (IEC) of Maulana Azad Medical College approved the study and written informed consent was provided by all participants for blood sampling and genetic testing. All the research has been conducted in accordance with the Helsinki declaration. Patients were consecutively recruited from July, 2018 to December, 2020 in Lok Nayak Hospital, New Delhi, India. Twenty-five female patients who were histopathologically diagnosed with breast cancer were included in the study. Another 25 patients with benign fibroadenoma were also recruited. The control subjects comprised of twenty-five unrelated healthy women. Patients with history of other malignancies or other systemic diseases were excluded from the study.

Genotyping

Peripheral blood samples from cases and healthy control subjects were collected in EDTA anticoagulant vials and stored at −80°C until used for further process. Whole genomic DNA was isolated from the peripheral blood mononuclear cells (PBMNCs) using HiPurATM Blood Genomic DNA Miniprep Purification Kit (Ref: MB504-50PR, Country of origin: India) according to the manufacturer’s instructions. The quality of DNA was checked by Ethidium Bromide (EtBr) stained 1% agarose gel electrophoresis. The DNA quantity and integrity were determined by A260/280 ratio using NanoDrop spectrophotometer (Washington, DC, USA). Polymerase Chain Reaction Restriction Fragment Length Polymorphism (PCR-RFLP) technique was used to study rs2981582 single nucleotide polymorphism in FGFR2 gene. The detailed information of the FGFR2 SNPs, primer sequences used for amplification, PCR amplicon sizes, restriction edonucleases used and size of products obtained after restriction digestion are given in Table 1. The restriction digestion fragments were resolved and analyzed by 3% to 3.5% agarose gel electrophoresis using EtBr as staining dye.

biomedres-openaccess-journal-bjstr

Table 1: Score of overall students’ barrier perception to exclusive e- learning (n=1137).

RNA Isolation and cDNA Synthesis

Total RNA was extracted from all the subjects using Geneaid Total RNA Mini Kit (Cat. No. RB100, Country of origin: Taiwan) according to the manufacturer’s instructions. Briefly, 300μL of peripheral blood in an eppendorf was mixed with 900μL of RBC lysis buffer, incubated at room temperature for half an hour and centrifuged for 10minutes at 3500 RPM. The supernatant was discarded, and this step was repeated till a whitish cell pallet appeared at the bottom of the eppendorf tube. This cell pallet was mixed with 200μL cell lysis buffer and incubated for 10minutes. The ingredients of the eppendorf tube were then transferred to columns, provided with the kit, and centrifuged at high speed (14000 RPM) for 2minutes. The temperature of the centrifuge machine was set at 4°C. The columns were then washed with 75% alcohol and RNA was eluted down in RNAse free water (100μL). RNA integrity was determined by agarose gel electrophoresis (2%) and concentration was determined by measuring absorbance at 260 nm as discussed above.
The RNA was converted to complementary DNA (cDNA) using cDNA synthesis kit (Thermo Fisher Scientific, USA) by following manufacturer’s instructions as provided with minor modifications. I brief, total RNA (100 ng), 2 μL oligo (dT) primer, and 9 μL water were mixed and incubated at 70°C for 5 minutes in a thermal cycler. This reaction mixture was then mixed with 5X RT buffer (4 μL), 5 mM dNTPs (2 μL), 1 μL each of RNAse inhibitor, and reverse transcriptase enzyme in a total volume of 20 μL. This mix was incubated at 42°C for 1 h and then heated to 95°C to stop the reaction. The cDNA was stored at −80°C until used for expression studies.

Quantitative Real Time Polymerase Chain Reaction (qRT-PCR)

Quantitative RT-PCR was used to carry out relative expression of FGFR2 gene on a Rotor-Gene Instrument (QIAGEN; Skelton House, Lloyd, Manchester, UK). β-actin gene was used as reference gene for normalizing. The primers used were as follows:
FGFR2 forward primer 5′-TCCACATGGAGATATGGAACAGGA-3′
FGFR2 Reverse primer 5′-GGAGCTATTTATCCCCGAGTG-3′
β-actin Forward primer 5′-CGACAACGGCTCCGGCATGTGC-3′
β-actin Reverse primer 5′-CGTCACCGGAGTCCATCACGATGC-3′
A 20 μL reaction mixture consisting of 10 μL SYBR Green Master Mix, 1 μL cDNA (equivalent to 100 ng RNA), 0.3 μL forward primer (25 pm/μL), 0.3 μL reverse primer (25 pm/μL), and 8.4 μL water. The thermal cycling conditions were standardized to match both FGFR2 and β-actin specific primers. The final standardized temperature profile consisted of a denaturation program of 95°C for 5 min followed by 40 cycles of denaturation at 95ºC for 15 seconds, annealing at 60ºC for 45 seconds, and extension at 72ºC for 50 seconds with a final extension at 72ºC for 10 minutes. The quantification was expressed as 2−ΔΔCT or fold change using Livak method adopted from (https://doi.org/10.1177/1010428317713857 and https:// doi.org/10.1007/s13577-020-00370-6).

Statistical Analysis

Chi-square test was performed for comparison of genotypic frequency distribution between:
I) All patients and healthy controls,
II) Benign patient’s vs healthy controls and
III) Malignant patient’s vs healthy controls and IV) benign vs malignant patients. Odds ratio along with corresponding 95% confidence intervals (CIs) were used for estimation of individual genotypic risk for breast cancer by employing codominant model of inheritance. Continuous data was analysed by student t-test and One-way ANOVA (Analysis of variance). Moreover, all the p-values were corrected, in case of multiple comparisons, by employing Tukey’s post hoc test. These statistical analyses were performed by GraphPad Prism 5.lnk software package and a p value of <0.05 was considered statistically significant.

Results

The clinicopathological and demographic characteristics of patients and healthy controls are represented in Tables 1 & 2. In contrast to healthy controls (mean ±SD=34.28±9.3), the breast cancer patients tended to be younger (mean ± SD=32.52+11.13) taken together was more. Further, when the breast cancer patients were subdivided, benign patients were comparatively found to be younger (mean ±SD=30.76±12.65) followed by healthy subjects (mean ±SD=34.28±9.3) and then by malignant patients (mean ±SD=46.2±15.54). Principally, we did not find any significant differences in basic demographic characteristics among the healthy subjects and breast cancer patients when taken together except that breast cancer patients significantly tend to be multiparous and married. However, significant differences were seen in basic characteristics including age at menarchy, parous status, menopausal status, breast feeding and marital status, but feeding habits, between subtypes. All the basic characteristics of healthy and breast cancer subjects, along with statistical analysis, have been presented in Tables 2 & 3.

biomedres-openaccess-journal-bjstr

Table 2: Basic demographic characteristics of healthy controls and breast cancer patients.

biomedres-openaccess-journal-bjstr

Table 3: Association of breast cancer risk with FGFR2 (rs2981582) polymorphism.

Risk Analysis of FGFR2 Polymorphisms in Concert with Breast Cancer

The genotypic and allele distribution of FGFR2 polymorphisms (rs nos. of FGFR2 pols) are shown in Table 3. The risk analysis based on calculation of odds ratio showed association of FGFR2 polymorphism with overall breast cancer risk. It was observed that FGFR2 polymorphism exhibited a heightened overall breast risk in both codominant and dominant models though it was not significant. In codominant model the heterozygous genotype (TC) depicted the highest risk (OR=3.54; 95% CI= 0.378 to 33.107; p=0.26) followed by recessive homozygous (CC) (OR=2.12; 95% CI= 0.7382 to 6.1167; p=0.16); dominant model; TC+CC; (OR=2.30; 95% CI= 0.8410 to 6.3015; p=0.10). The allele specific model depicted a statistically increased risk of overall breast cancer associated with the minor allele of the polymorphism (C allele; OR=2.06 95% CI=1.1578 to 3.6980; p=0.01).When patients were sub-grouped based on the type of tumor; benign and malignant, TC genotype in dominant model, TC+CC additive genotype in dominant model and C allele in allele specific model showed a non-statistical heightened risk for malignant breast cancer (OR=2.42; 95% CI= 0.1988 to 29.6617; p=0.48: OR=1.66; 95% CI= 0.5270 to 5.2898; p=0.38 and OR=1.55; 95% CI= 0.8660 to 2.794; p=0.13 respectively). Further, the recessive CC genotype was found to be associated with decreased risk of malignant breast cancer in codominant model, though the results were not significant (Table 3). Increased associations were observed between benign breast cancer and heterozygous (TC) and recessive homozygous genotypes (CC) (OR=5.10; 95% CI= 0.4653 to 55.8940; p=0.18 and OR=2.91; 95% CI= 0.8637 to 9.8335; p=0.08 respectively) in codominant model. Also, in dominant model of inheritance, the FGFR2 was found to be nonsignificantly associated with increased risk for benign breast tumor (TC+CC: OR=3.18; 95% CI= 0.9989 to 10.1716; p=0.05). Moreover, a statistically increased risk for benign breast tumor was associated with recessive allele (C) of FGFR2 polymorphism in allele specific model of inheritance (OR=5.44; 95% CI= 2.9735 to 9.9688; p<0.0001).

FGFR2 mRNA Expression and Polymorphism (rs2981582) in Concert with Breast Cancer

We analysed the mRNA expression of FGFR2 gene and compared it among healthy controls and breast cancer patients. It was observed that RGFR2 mRNA expression varied significantly among healthy controls and breast cancer patients. Breast cancer patients exhibited an increased FGFR2 mRNA expression compared to healthy control subjects (mean fold ± SD=4.33+4.20, Table 3). We further compared FGFR2 mRNA expression among benign and malignant breast cancer patients and observed that FGFR2 mRNA expression was significantly raised by 2.95-fold in malignant subjects compared to benign tumor ones (mean fold ±SD=2.49+1.21 vs 7.35+5.88; p=0.0002 respectively, Table 4 and Figure 1). Next, we categorized patients based on genotypic distribution of FGFR2 (rs2981582) polymorphism and analyzed the FGFR2 mRNA expression in breast cancer patients with reference to their genotype. We observed an increased FGFR2 mRNA expression in patients with mutant homozygous (CC) genotype (mean fold± SD=5.51±5.59) compared to patients with wild type (TT) (mean fold +SD=4.46±3.94) and heterozygous (CC) genotypes (mean fold ±SD=3.79±2.10), but this difference did not reach statistical significance (Table 4 & Figure 2). Similarly, FGFR2 mRNA expression in concert with FGFR2 (rs2981582) polymorphism genotype was analysed in patients of benign and malignant tumour separately (Table 5). However, we could not reach any meaningful inference as the FGFR2 mRNA expression did not follow a meaningful pattern. The results of the analysis are depicted in Table 4 below.

biomedres-openaccess-journal-bjstr

Table 4: FGFR2 mRNA expression in healthy controls and breast cancer patients.

biomedres-openaccess-journal-bjstr

Table 5: FGFR2 mRNA expression in concert with FGFR2 (rs2981582) polymorphism.

biomedres-openaccess-journal-bjstr

Figure 1: FGFR2 expression among breast cancer and benign breast disease.

biomedres-openaccess-journal-bjstr

Figure 2: FGFR2 expression with reference to FGFR2 polymorphism.

Discussion

In addition to several known risk factors, studies have shown strong relations with FGFR2 gene in respect to breast cancer. Multiple genetic aberrations in FGFR2 which triggers the activation of up and/ or downstream FGFR2 signaling pathways have been identified in breast cancer [7]. In this study, SNP of FGFR2 rs2981582 of genotype T>C have been chosen for assessing the association with risk of breast cancer. The protocol resulted in fragment lengths of 176 base pairs, with genotype patterns wild type TT [176 base pairs(bp)], heterozygous TC (176+154+22 bp) and homozygous CC (154+22bp).On assessment of specific genotype association with breast cancer, our results show that on comparing malignant with healthy controls, a slightly higher risk is associated with heterozygous genotype TC with OR of 2.4 (95% CI=0.199-29.66) but is not statistically significant (p value=0.481) TT genotype being the wild type (Table 3). Also, while comparing malignant with benign cases, no significant risk in both heterozygous genotype TC (OR=0.47 95% CI=0.067-3.396 P-value=0.46) and homozygous genotype CC (OR=0.53 95%CI = 0.164-1.75 P-value=0.30) (Table 3) was observed. So, rs2981582 SNP did not alter the risk of benign or malignant breast tumour in this population. A study of 203 histopathologically confirmed cases of breast cancer and 200 cancer free controls by Liu et.al showed that the rs2981582 TT genotype is significantly associated with breast cancer in Chinese women (OR=1.831, p-value=0.037) [18] but no evidence of significant association was found in this study of 25 breast cancer cases and 25 benign cases with 25 healthy controls. The small sample size may be attributed to the above finding in our study.
Our results have shown that FGFR2 expression was significantly increased in malignant cases (mean fold change =7.35±5.88) as compared to benign cases (mean fold change=2.49±1.219) with p-value of 0.0002 (Fig.1). This finding is correlating with the previous studies on overexpression of FGFR2 in breast cancer [19]. So we infer that altered expression of FGFR2 might have a role in pathogenesis/malignant transformation of breast tumor / cancer. However, on comparison of FGFR2 expression among benign patients with different genotypes (rs2981582 T>C) the differential gene expression associated with different genotypes of the polymorphism (TT/TC/CC) was not found to be statistically significant (Figure 2). On comparing the same among malignant patients, FGFR2 gene expression among different genotypes in malignant cases was also statistically insignificant (Figure 3). So, we hypothesize from this study that rs2981582 SNP does not influence the expression of FGFR2 in this population.

To the best of our knowledge, previous studies have not clearly documented possible relationship between FGFR2 expression with different genotypes of the polymorphism rs2981582. It is worth exploring which SNPs of FGFR2 gene influence its expression or if there is some gene-gene or gene-environment interaction influencing its expression in breast cancer.

For More Articles: Biomedical Journal Impact Factor: https://biomedres.us

Open Access Journal on Medicine

Gender and Time Trend of Liver Cirrhosis Mortality and Its Estimated Avoidable Proportion in a Mountainous Province of Viet Nam from 2005 To 2018

Introduction

During 1980-2017, Liver Cirrhosis was the major mortality of liver diseases worldwide [1]. The disease is chronic progressive liver fibrosis due to lifestyles and environmental factors [2]. In the initial stages, patients who suffered from liver cirrhosis are asymptomatic and the disease incidence rates are commonly underestimated [3]. Once clinical symptoms occur, the morbidity and premature death resulting from cirrhosis increase sharply [4]. Liver diseases due to chronic infection with hepatitis viruses [5-8] and high consumption of alcohol [9] have been observed to be common in Viet Nam from the last century to date. Harmful usage of alcohol, chronic infection with hepatitis viral infection, and smoking might be responsible for cirrhosis. Previous results have pointed out the major risk of cirrhosis was “Alcoholism” in many countries [10-13]. Based on these facts and figures, we have hypothesized that liver cirrhosis is a lifestyle-related health event and a possible avoidable disease. Patients suffering from liver cirrhosis need frequent medical care and their quality of life is affected [14]. Patients with liver cirrhosis have significantly increased morbidity and mortality [15]. However, few studies have been performed to address this public health problem in Viet Nam to date. This study aimed to estimate mortality rates, time trends by sex, and to estimate an avoidable proportion of death due to cirrhosis in men in Lang son Province from 2005 to 2018.

Methods

The study was performed in Lang Son province, a mountain highland province in northern Viet Nam. The study population is bordering Guangxi province in China and other provinces in Viet Nam. It was a population-based mortality registration operated by the Lang Son Center for Diseases Control (CDC) that covered all 226 communes of 11 cities/districts of the province, with a population of 790,500 people in 2018 [16]. In Viet Nam, the national mortality registration systems have been started from 1992 that was following the guideline by the Ministry of Health to report the causes of death from all health facilities nationwide. From 1992 to date, Lang Son is one of all 63 cities/provinces of the country to actively conduct mortality registration based on the medical records available at 226 state commune health stations (CHS), 10 district general hospitals, 9 district out-patient clinics, and 3 provincial general and specialized hospitals. The head of the CHS is a person in charge of the monthly report of all death cases that occurred at his/her communes in a mortality registration book, named A6-mortality book that was designed by the Ministry of Health. The variables included name, age, sex, ethnicity, address, occupation, date, and cause of death, place of death occurred (at a health facility, home, other), and attended emergency care at the endpoint (Yes/no), and the name of the reporter.
From 2005 to date, the Lang Son CDC has collected data from all 226 CHS using the data collection form in the hard copy of “Mortality Registration” for six variables of name, age, sex, occupation, date, and cause of death for every year. The additional guidelines to determine the causes of deaths, including the immediate cause of death, a contributing cause of death, and the underlying cause of death, and its ICD-10 code, were sent with the designed form of “Mortality Registration”. The average population number by sex has also been collected by this form for every year from 2005 to 2018. A yearly population structure by age groups of (0-9, 10-19, 20-29, 30- 39, 40-49, 50-59, 60-69, 70-79, 80+) by sex was estimated using the results of the National Census conducted in 1999, 2009, and 2019. The collected variables of each death case were inputted in Excel for each district for each year. The ID and ICD-10 code for the cause of death was made for each case. In this way, a database of mortality from 2005 to 2018, missing data for 2009-2010, was made by the Lang Son CDC. The dataset included 49,253 reported death cases due to all causes [16,17].
We accessed to Lang Son database of mortality during 2005- 2018, missing data for 2009-2010, to derive variables of case’s ID, age, sex, date, and cause of death, ICD-10 code. We found ICD-10 code K74 for Liver Cirrhosis and a total number of 2,612 cases for the present study. We also derived the average number of population by years and by communes for further estimate number of person-year for the final analysis. We calculated the mortality rates ratio with a 95% confidence interval (MRR, 95%CI) using regression analysis, adjusted for age groups of 10-year intervals (0-9, 10-19, 20-29, 30-39, 40-49, 50-59, 60-69, 70-79, 80+) and sex. Age-standardized rates (ASR) per 100,000 person-years were calculated using the world population structure as the standard. We calculated the avoidable proportion of deaths in men by the formulation of ((a-b)*100/a (a: ASR in men; b: ASR in women). The Board of Ethics in Bio-Medical Research at University of Medicine and Pharmacy at Ho Chi Minh City #106/UMP-BOARD, on 20 March 2019 and Hanoi Medical University Review Board in Bio-Medical Research # 61/HMURB, on 25 November 2008 have approved the present research protocol.

Results

Overall, a total of 2,612 deaths were registered among residents in Lang Son Province from 2005 to 2018. Table 1 shows the results of deaths were 2,321 in men and 291 in women. Men had a higher age-adjusted mortality rate (ASR-WHO 63.2 per 100,000) due to cirrhosis compared to women (ASR-WHO 7.3 per 100,000), giving man to women ratio: 8.7/1 (63.2/7.3). The estimated men to women ratio were sharply increased from 4.9/1 (49.1/10.1) in 2005 to 18.6/1 (63.1/3.5) in 2018. Compared to women, the estimated avoidable proportion of death from Liver Cirrhosis in men was ((63.2-7.3)*100)/63.2=88.5%. There was 88.5% of total premature deaths occurred under the age of 70, Table 1. The agestandardized death rate increased gradually according to WHOASR from 27.7 per 100,000 to 33.4 per 100,000 person-years for both genders from 2005 to 2018, respectively. The estimated proportion of deaths due to Liver Cirrhosis was 5.3% (2,612 cases of Liver Cirrhosis vs. 49,253 total death cases) in both genders. Overall death due to the disease, men, and women combined, was significantly increased from 2005 to 2018. After adjusting for age and sex, per-year increment was significantly seen, MRR (95%CI): 1.019 (1.009, 1.028), p=0.001 (Table 2).

biomedres-openaccess-journal-bjstr

Table 1: Mortality due to Liver Cirrhosis by sex during 2005-2018 in Lang Son province.

Note: Missing data for the year 2009-2010; &: Crude rate per 100,000 person-years; $: Age-standardized rate per 100,000 person-years using the World Health Organization standard population for 2000-2025; # Proportion of death cases aged under 70 year-olds. @: Age-standardized rate per 100,000 person-years using the SEGI World standard population (in the 1960s). Men to women ratio (ASRWHO) = 8.7 (63.2/7.3). The estimated proportion of death from Liver Cirrhosis in men was {(63.2-7.3)*100}/63.2=88.5%

biomedres-openaccess-journal-bjstr

Table 2: Mortality due to Liver Cirrhosis in both genders by year from 2005 to 2018 in Lang Son province.

Note: Missing data for the year 2009-2010; the estimated proportion of deaths due to Liver Cirrhosis was 5.30% (2,612 cases of Liver Cirrhosis vs. 49,253 total cases), both genders. $$ adjusted for age group (0-9, 10-19, 20-29, 30-39, 40-49, 50-59, 60-69, 70-79, 80+) and sex. Per-year increment MRR (95%CI): 1.019 (1.009, 1.028), p<0.001. & Crude rate per 100,000 person-years; $ Age-standardized rate per 100,000 person-years using the World Health Organization standard population for 2000-2025; # Proportion of death cases aged under 70 year-olds. When combined all cases from 2005-2018, both genders, WHO-ASR: 31.3 per 100,000 person-years.

In men, the estimated proportion of deaths due to Liver Cirrhosis was 7.4% (2,321 cases of Liver Cirrhosis vs. 31,262 total cases). The age-standardized mortality rates per 100,000 were increased from 49.1 in 2005 to 65.1 in 2018. The estimated mortality rates ratios, the year 2018 versus 2005, were significantly increased, MRR (95%CI): 1.367 (1.104, 1.693), p=0.004. During this period, per-year increment was significantly observed, MRR (95%CI): 1.028 (1.018, 1.038), p=0.001 (Table 3). In Women, the estimated proportion of deaths due to Liver Cirrhosis was lower (1.6%, 291 cases of Liver Cirrhosis vs. 17,990 total death cases) than in men (7.4%, 2,321 cases of Liver Cirrhosis vs. 31,262 total death cases). For a time trend, in contrast, death due to the disease was significantly decreased in women from 2005 to 2018. The estimated mortality rates ratios, the year 2018 versus 2005, were significantly decreased, MRR (95%CI): 0.344 (0.177, 0.668), p=0.002. During this period, per-year decrement was significantly seen, MRR (95%CI): 0.948 (0.923, 0.974), p=0.001 (Table 4). By age-specific, the estimated mortality rates per 100,000 in men were much higher than in women for all age groups, especially for the age group (50-59), 193.5 versus 13.2, respectively (Figure 1).

biomedres-openaccess-journal-bjstr

Table 3: Mortality due to Liver Cirrhosis in men by year from 2005 to 2018 in Lang Son province.

Note: Missing data for the year 2009-2010; the estimated proportion of deaths due to Liver Cirrhosis was 7.42% (2,321cases of Liver Cirrhosis vs. 31,262 total cases) in men. ## adjusted for age group (0-9, 10-19, 20-29, 30-39, 40-49, 50-59, 60-69, 70-79, 80+). Per-year increment MRR (95%CI): 1.028 (1.018, 1.038), p<0.001. & Crude rate per 100,000 person-years; $ Age-standardized rate per 100,000 person-years using the World Health Organization standard population for 2000-2025; # Proportion of death cases aged under 70 year-olds. When combined all cases from 2005-2018 in men, WHO-ASR: 63.2 per 100,000 person-years.

biomedres-openaccess-journal-bjstr

Table 4: Mortality due to Liver Cirrhosis in women by year from 2005 to 2018 in Lang Son province.

Note: Missing data for the year 2009-2010; the estimated proportion of deaths due to Liver Cirrhosis was 1.62% (291 cases of Liver Cirrhosis vs. 17,990 total cases) in women. ## adjusted for age group (0-9, 10-19, 20-29, 30-39, 40-49, 50-59, 60-69, 70-79, 80+). Per-year increment MRR (95%CI): 0.948 (0.923, 0.974), p<0.001. & Crude rate per 100,000 person-years; $ Age-standardized rate per 100,000 person-years using the World Health Organization standard population for 2000-2025; # Proportion of death cases aged under 70 year-olds. When combined all cases from 2005-2018 in women, WHO-ASR: 7.3 per 100,000 person-years.

biomedres-openaccess-journal-bjstr

Figure 1: Age-specific mortality rate per 100,000 person-years by sex during 2005-2018 due to Liver Cirrhosis.
Note: Missing data for the year 2009-2010;

Discussion

We observed a divergence over time from 2005 to 2018 between men (statistically significant increase) and women (statistically significant decrease) in a community in the mountainous province of Lang Son in northern Viet Nam. When compared to women, the estimated avoidable proportion of death due to the disease was about 88.5% in men. There was serious premature death, as high as 88.5% for both genders (91.3% in men and 66.3% in women). The findings suggested that Liver Cirrhosis is a preventable disease and performing primary prevention in the community to reduce premature death would be highly needed. Harmful usage of alcohol by men living in the Lang Son province might be the major risk factor of developing Liver Cirrhosis. An estimated annual amount of pure alcohol consumption in 2010 was 12.1 liters and 0.2 liters in men and women, respectively [18]. This big gap between men and women can be consistent with the significantly higher risk of death from Liver Cirrhosis in men than in women. Between men and women, there were no significant differences for both Hepatitis B virus, HBsAg positive (Odds ratio and 95% confidence interval, men versus women: 0.76 (0.54–1.01)) and Hepatitis C virus infection (Odds ratio and 95% confidence interval, men versus women: 1.73 0.41–7.28) [5,19].
Therefore, viral Hepatitis infection could not be explained for the big gap between genders in the risk of death from this disease. The present findings support our hypothesis that liver cirrhosis is a lifestyle-related health event and a possible avoidable disease. The results warrant further observational studies to conclude the association between alcoholism and Liver Cirrhosis in the disadvantaged areas in Viet Nam with emphasis on primary prevention of the disease. There was rarely alcohol drinking (0.2%) and tobacco smoking in Vietnamese women aged 15+ (1.7%) in 2010 [18] and it was a similar observation in the 1990s [20]. The estimated prevalence of Hepatitis C virus infection was very low (0.5%) in rural areas [19]. There was also a very low prevalence (4.8%) of overweight among Vietnamese women. Therefore, Vietnamese women will be minimized risk of Liver Cirrhosis caused by alcoholism, smoking, Hepatitis C virus infection, and obesity. From 2005 to 2018, nutrition and diet, living and working environments have been improving which might be explained why there was a significantly decreased trend of mortality from the disease in the study population. In contrast, a significant increasing trend in men might be related to the increasing prevalence of harmful usage of alcohol from 25.5% in 2004 to 35.0% in 2013 [21].
The present study has several strengths, including long time of mortality registration from 2005 to 2018 to examine time trend of the disease; a large number of mortality cases was reported for both men and women; the covered study population was for the entire Lang Son province with good healthcare systems from communes to district and provincial health facilities; mortality registration was actively and yearly done by professional health workers; the average population by each of 226 communes was updated for every year that allows us to estimate the age-standardized mortality rates by genders and for each year [16,17]. In addition, the quality of mortality registration in Viet Nam has been validated [22-24] to be performed well which will be feasible, reliable, and practical to develop annual local and national mortality databases of mortality to identify priority public health problems and to create planning timely actions in general and in controlling Liver Cirrhosis in particular. Based on these favorable research conditions, we can observe a real problem of the disease and add some new pieces of knowledge for further elimination of this preventable health threat in our society.
Liver Cirrhosis was a serious public health problem at the disadvantaged highland in Viet Nam of the present study population and that was consistent with findings in the world. There were 1.32 million deaths due to Liver Cirrhosis reported in 2017, with 440,000 deaths in women and 883,000 deaths in men. The burden of disease has been increased from 1990 to 2017. That is, the estimated deaths due to Liver Cirrhosis were responsible for about 2.4% of total deaths in the world in 2017 compared with 1.9% in 1990 [25]. In this study, we found that mortality due to cirrhosis was 5.3% of total deaths during 2005-2018 in the Lang Son province that was over doubled than the world estimation. There has been no systematic nationwide screening for Liver Cirrhosis in Viet Nam, especially in the mountain areas, and no nationwide comprehensive response to the disease.
The present study has certain limitations that include i) missing data for the year 2009-2010; ii) there is no available data of histopathological confirmation of Liver Cirrhosis, and iii) there is not the available data of lifestyle and environmental factors related to the disease. Despite these limitations, the present findings warrant further studies to identify risk factors for implementing primary prevention and secondary prevention in the community.

For More Articles: Biomedical Journal Impact Factor: https://biomedres.us

Open Access Journals on Physical Science

Pore Characterization of Alumina Short Fiber Using Small Angle X-Ray Scattering Technique

Introduction

Alumina or Aluminium Oxide (Al2O3) is ceramic metal oxide and have wide variety of applications [1]. Alumina is also widely used as biomaterials for bone replacement [2]. This is due to the fact that Alumina is relatively high strength and has good tribological properties especially wear resistance. Improvement in terms of material purity has led to great chemical resistivity and excellent tissue compatibility. Thus, it is not surprising the usage of Alumina even is found in dental implants [3]. Alumina could be produced by electrospinning technique. It is a process of producing fibers by employing electrohydrodynamic properties with a relatively simple set-up [4]. The set-up includes a high voltage power supply, pump, syringe and grounded collector. Raw material for the electrospinning process is in the form of sol-gel. Prior to sol-gel injection by using the syringe, an electrical field is generated between the syringe and the collector. As the sol-gel is injected from the syringe, an electrical repulsive force directs the material in the form of fiber onto the collector. The obtained material on the collector finally in the form of thin layer of mats. The material is carefully removed and calcined at high temperatures to remove the unwanted polymer precursor. Then the desired Alumina is obtained. The fiber produced by this technique demonstrate good performance and properties. This is due to the increase of the specific surface area of the nanofiber. The nano-scale could be achieved by various approaches includes reduction of fiber diameter. Electrospinning process allows manipulation of setting parameters to achieve that [5]. Electron microscopy (EM) and small angle scattering (SAXS) are two approaches of data acquisition method for characterizing nanoparticles. Both are considered as direct technique but one is in real space (EM) and the other is in reciprocal space (SAXS). These two methods are usually utilized to produce data such as size distributions, determine pore sizes, high resolution imaging and much more [6]. Fundamentally, electron microscopy (EM) uses high speed electron as a source of illumination to obtain high resolution image while small angle x-ray scattering (SAXS) involves successive irradiation mode of passing the x-ray beam through the sample and data built based on scattered x-rays [7,8].

There are idiosyncratic advantages and disadvantages between these two techniques. With regard to application on different types of samples, small angle x-ray scattering (SAXS) has further advantages due being able to study variety of sample states includes solid, powder, sol-gel as well as thin film [9]. Estimation of particle sizes of electron microscopy (EM) methods is made from measurements of limited number of particles which makes small angle x-ray scattering (SAXS) provide more accurate data on particle sizes due the estimation is made from vast number of particles [10]. In addition, preparing samples for small angle x-ray scattering (SAXS) are often require very little time, comparing to the complicated electron microscopy (EM) sample preparation procedure where often taking longer period. It is the interest of researchers to probe the specific surface area for confirming the success of obtaining nano-scale materials. One of the technique is through the use of Small Angle X-ray Scattering (SAXS) technique.

SAXS is advantageous as compared to fluid for probing the pore space. It covers both close and open pore. In SAXS, a beam of X-rays of fixed wavelength and known intensity is illuminated on the sample, and the intensity of the scattered signal is measured versus the scattering vector. X-ray probe the fluctuations of the electronic density and reflect the chemical heterogeneity and density variations within the sample. From this result, many information on the sample are obtainable such as size, shape and specific surface area.

Materials and Methods

The Alumina nanofibers were prepared from electrospinning process. The raw materials used were reagent grade Aluminium Isopropoxide (AIP) as the source of alumina precursor, Polyvinylpyrrolidone (PVP with Mw 1300000) as polymer precursor, nitric acid (HNO3) and Ethyl Acetoacetate. All chemicals were from Sigma Aldrich. The optimum electrospinning setting parameter were followed based on previous work [11]. Surface morphology was carried out using SEM/EDX FEI Quanta 400. SAXS experiments were performed using Anton Paar Saxpoint instrument, operated at 50kV and 1mA with the point collimation geometry. The radiation used was a Ni filtered CuKα radiation of wavelength 0.154nm. The intensity profiles are recorded using a CMOS 2-D detector (Eiger) and the scattering vector q, covers from 0.035 to 5 nm-1. One-dimensional scans of I(q) were extracted from two- dimensional scattering patterns using the analysis package SAXS analysis, Primus and Easyswax. Angular calibration of the scattered intensities in the small angle regime for the detector is performed using silver bahenate (d = 58.38 Å). Sample to detector distance is 575.5mm and sample exposure to the source is 600 seconds. All experiments are carried out at room temperature, 20ºC. The measured scattering vector is related to the scattering angle through the equation:

θ = Scattering angle or half of diffraction angle (degree)
q = scattering vector (nm-1)
𝝀 = 0.154 (nm)
Another parameter under consideration is Invariant. It is the integral of second moment of the scattering curve I(q) q2. The equation is given below:

Qp shall be calculated by extrapolating scattering intensity towards zero (Guinier approximation) and infinitely large scattering angle (Porod’s q-4 dependence). Pore is assumed to be spherical in shape.
Surface to volume ratio is based on the equation of:

where:
Kp = Porod Constant
Qp = Invariant
θ = Volume fraction of particles
Specific surface is obtained by dividing the surface to volume ratio with the apparent density. All equations are based on Heimo Schnablegger [12]. SAXS experiment were subjected to two samples namely Alumina Quantachrome Reference standard and Alumina nanofiber. The result for Alumina Quantachrome Reference standard is compared with the value given by the manufacturer but by using a different technique, BET technique. Then, the second sample, Alumina nanofiber is subjected to SAXS measurement. 2D-SAXS image of Alumina Quantachrome Reference (Figure 1) and Alumina nanofiber (Figure 2) with the same linear scaling in the q-range of 0.035nm-1 < qz < 5nm-1. Exposure time was 300s (avarage of 2 reading). 2D scattering data are reduced to 1D scattering profile by radial integration from 0° – 180°. Further analysis is performed based on 1D scattering profile as shown in (Figure 3). From Invariant (Porod and Guinier) calculation, It was found the value of Kp/Qp are 0.19 for standard Alumina Quantachrome Reference sample and 0.62 for Alumina sintered nanofiber sample. The specific surface area for both sample is calculated and given in (Table 1). The existance of nanopores are clearly visible by the excess SAXS signal in (Figures 1 & 2). Ring pattern for both sample indicates there is no preferred orientation of the nanopore within the plane of the samples.

biomedres-openaccess-journal-bjstr

Figure 1: 2D scattering of Alumina Quantachrome Reference sample.

biomedres-openaccess-journal-bjstr

Figure 2: 2D scattering of Alumina nanofiber sample.

biomedres-openaccess-journal-bjstr

Table 1: Specific surface area.

The intensity of alumina Quantachrome Reference standard is found much more higher than the Alumina sintered nanofiber. This reflect that many scatterer in the alumina Quantachrome Reference sample as intended from the reference material. In terms of pore size, it is found that the alumina nanofiber exhibits smaller pore size as indicated by the higher specific surface area, 399.98 m2/g. Comparing specific surface area values for alumina Quantachrome Reference material between SAXS and BET technique reveals that both values are in good agreement. SAXS gives the value of 95.58 m2/g and BET is reported to give the value of 107.5 m2/g. However, slight differences might be caused by damages to the sample during the crushing of the Quantachrome Reference sample from solid to powder form in order to mount the sample into the holder for SAXS experiment. The surface morphology of Alumina sintered nanofiber is given in (Figure 4). it is clearly seen the fibers are in the range of 100-200nm in diameter. The pore between the fibers are expected to be much more smaller than that. This will give rise to the scattering event in the sample. The applicability of SAXS technique in assessing the pore in the sample is found to be comparable to BET technique. The simple sample preparation makes the technique very attractive and is successfully shown in this work by probing Alumina sintered nanofiber.

biomedres-openaccess-journal-bjstr

Figure 3: 1D scattering of Alumina Quantachrome Reference and Alumina sintered nanofiber sample.

biomedres-openaccess-journal-bjstr

Figure 4: Alumina sintered nanofiber, short fiber with the average diameter of 100- 200 nm.

For More Articles: Biomedical Journal Impact Factor: https://biomedres.us

Open Access Journals on Medicine

Bio-Filtration as a Solution for the Detrimental Health Effect of Excess Fluoride in Drinking Water

Introduction

One of the main importance of water filtration is to prevent water-related illnesses and diseases. To this day, various explored methods were used in the remediation of water of different types of contaminants such as flocculation [1,2], coagulation [3], solventextraction [4], co-precipitation [5], precipitation [6], ion-exchange [7], photo catalysis [8], adsorption-desorption [9], reverse-osmosis [10], nano-membrane filtration [11]. The adsorption technique is considered one of the attractive and commercial options to eliminate of the most pollutant substances whether macro- or micro- organic/inorganic ions from water, due to its simplicity of steps and high activity. Moreover, the purification of water by using adsorption technique has been applied to several matter as absorbent such as agricultural residues and industrial residues, and biomaterials wastes, which are modified and applied in biosorption of contaminants from water [7,9-12]. Fluoride is an ionic form of fluorine and can be found in food and numerous sources of drinking water. It can be also purchased as a dietary supplement [12]. Many kinds of toothpastes contain fluoride because these ions serve as an armor against tooth decay [13]. Approximately 80% of the fluoride taken orally is absorbed. Humans retain around 50% of the fluoride they consume, and most of this amount is deposited in teeth and bones (Graphical Abstracts 1 & 2). The remaining 50% is excreted in the urine.

biomedres-openaccess-journal-bjstr

Graphical Abstract 1: Problem statement.

biomedres-openaccess-journal-bjstr

Graphical Abstract 2: Solution.

However, young children can retain an especially high percentage of the consumed fluoride, because their bones and teeth absorb more fluoride than those of adults [14]. The principle and mechanism of pollutants removal by adsorption technology from different types of water based on forms layer of condensate pollutants (called adsorbate) which is migrated from aqueous solution to the surface of solid (called adsorbent) as either in the form of liquid-solid interface [11,15]. Excess fluoride is harmful to human health. Groundwater wells worldwide have been reported to contain water with fluoride concentrations exceeding the acceptable level of 1.5 mg/L. This fact was attributed to local ground stones exhibiting high percentages of fluoride in their composition [14]. Excessive fluoride consumption can lead to several health issues, such as skeletal fluorosis, a disorder marked by bone and joint pain as well as joint tenderness. The overconsumption of fluoride during the formative years of tooth enamel can also lead to dental fluorosis, which leads to tooth discoloration, and/or tooth pitting [15]. Many researchers have attempted to develop water filtration strategies to lower the levels of fluoride or metals that contaminate water [16]. Biomaterials have shown great promise in water filtration because of their environmentally favorable properties, high filtering efficiency, and low cost [17].

Charcoal, which may be manufactured from a variety of biomaterials, is one of the most commonly used bio-filters. Water contaminated with heavy metals can be treated using different processes, which include ion exchange, precipitation, reverse osmosis, catalysis, coagulation, and adsorption [18,19]. Heavy metal adsorption is dependent on the nature of the adsorbents, which can be composed of natural or man-made mate-rials including clay [10], sludge [11], industrial waste, activated carbon, and plants [12]. Bone char is an adsorbent made up of 90% calcium phosphate and 10% carbon. It can be created using one of the two methods: treatment with chemicals and physical treatment leading to carbonization of bones [20,21]. Cow bone char is com-monly used to purify water contaminated with heavy metals, as shown in (Table 1). The aim of the current study was to produce a lowcost, effective, and environmentally friendly biochar adsorbent from cow bone through physical activation (carbonization), and subsequently use it to remove fluoride from the polluted water [22]. Furthermore, it was also proposed to enhance this bio-filter by adding nanocomposites. Nanocomposites have very high surfaceto- volume ratios, which makes them ideal components for the adsorption process [23,24].

biomedres-openaccess-journal-bjstr

Table 1: Bone charcoal use based on the literature review.

Experiments

Cow bones were collected and processed by rinsing them several times with hot water to remove residual muscles and other joint tissues. Then the bones were allowed to dry in the open air. The dried bones were calcined in a furnace for 1 h at 400°C. The resultant charcoal adsorbent was crushed using a gate mortar and stabilized for further testing. It can be stated that the filters were produced with little to no expenses. A stock solution of CaF2 with a 100-ppm concentration of fluoride was prepared to test its adsorption in the cow bone sample. First, 1 g of charcoal was added to the 100 mL solution in a separate beaker, which was then placed in a shaker operated at room temperature and a 251 min-1 frequency for 5 h. Next, on the same day, the solution containing cow bone charcoal was filtered from impurities and charcoal leftovers using filter paper to prepare a sample for ionic chromatography (IC) [25]. IC was utilized for determining the concentrations of calcium and fluoride ions in the prepared CaF2 solution. Ion chromatographs can measure concentrations of important anions such as fluoride, chloride, nitrate, nitrite, and sulfate, as well as major cations such as lithium, sodium, ammonium, potassium, calcium, and magnesium in the parts-per-million (ppm) range. Ion chromatography can also be used to determine the concentrations of organic acid [26].

The surface structure of cow bone charcoal was studied by using a scanning electron microscope (SEM) (Model: JSM-7100F) at 10000 × magnification [27]. In conjunction with SEM, the energy dispersive X-ray (EDX) analysis technique was used to perform the elemental analysis and chemical characterization of the material. EDX utilizes an electron beam that strikes the surface of a conducting sample (placed under SEM) to determine its elemental content [28].

Results and Discussion

The SEM micrographs of the cow bone biochar explained the sample morphology by analyzing the microstructure of the bone powder, as shown in (Figure 1a). The corresponding EDX graph is presented in (Figure 1b). A close look at (Figure 1a) reveals cracks and irregular surfaces, as expected after grinding, where Vickers hardness can be determined (it is planned to be measured in the upcoming study). Furthermore, SEM micrographs showed that the studied samples had several heterogeneous porous layers, which represent a key feature relevant for fluoride adsorption. The pores appeared to be localized symmetrically in certain regions in the grooves on the surface of the bone. The sample composition revealed by EDX results was as follows: O2, 39.6 wt%; Ca, 33.9 wt%; C, 12.8 wt%; P, 12.8 wt%; Na and Mg, 0.9 wt%.

biomedres-openaccess-journal-bjstr

Figure 1: (a) Scanning electron microscope (SEM) micrograph of the cow bone charcoal shows several groups of symmetrically distributed pores. (b) The corresponding energy dispersive X-ray (EDX) graph of the bone constituents.

The surface morphology of the cow bone is particularly distinctive in terms of the hard appearance and the distribution of pores, which are of critical importance in filtering large species from water (Figure 2). Hence, the surface geometry and the source of adsorbent provided different types of active sites onto surface of adsorbent [29-35] (Table 2).

biomedres-openaccess-journal-bjstr

Figure 2: (a) SEM micrograph of cow bone charcoal shows symmetrically distributed pores on the surface (red arrows) with diameters in the range of several hundred nanometers, as shown in (b).

biomedres-openaccess-journal-bjstr

Table 2: The effect of bio-filtration with cow bone charcoal on fluoride removal.

Conclusion

The examined cow bone charcoal filter achieved maximal fluoride adsorption of 93.6%, which can be attributed to its porous nature. The prepared bio-filter has a very high adsorption capacity and is energy-efficient as it works at room temperature and does not require energy consumption. It means that using cow bone charcoal is a cost-effective filtration technique that should be further investigated to optimize the performance of nanocomposites and to set up measures for its widespread manufacturing.

For More Articles: Biomedical Journal Impact Factor: https://biomedres.us

Open Access Journals on Pathology

Breast Cancer Prognosis: A Genetic Code for Personalized Therapy

Introduction

Today, breast cancer is distinguished into at least three different subtypes based on clinical and molecular parameters: luminal, erbB2, and basal type, which exhibit different biological behaviors and prognoses. Correctly identifying the molecular subtype of the tumor opens the door to new, increasingly adequate and targeted therapeutic possibilities for the treatment of the specific molecular subtype [1]. In this scenario, luminal carcinomas (which represent approximately 65% of the total) are distinguished by a particular heterogeneity of biological behavior, with recovery of disease in approximately 40-50% and death in approximately two-thirds of these patients 5 years after diagnosis, despite initial anatomopathological pictures of apparent low aggressiveness [2- 9]. Precisely for this diagnostic category, biomolecular parameters derived from the genome/transcriptome that are capable of orienting the therapeutic choices in a more precise and personalized way on the patient’s actual therapeutic needs are desirable [10,11]. Currently, the clinical (T, nodal status) and biopathological (hormonal status) parameters obtained from membrane receptor expression provide prognostic information and an indication of any adjuvant systemic chemoradiotherapy treatment [12-14]. However, adjuvant therapy reduces the risk of recurrence by only 25-30% [13]. These data are probably due to:
1. Clinicopathological parameters of stratification of the risk of disease recovery are not sufficiently adequate for the patient’s prognostic framework.
2. Adjuvant therapies are not specific enough toward the cells responsible for disease recovery [15,16].
Knowing the details of the mutations of every single tumor allows us to predict the biological behavior of that neoplasm and to adequately stratify the risk. Genetic tests, such as Mammaprint and Oncotype DX, EndoPredict [17,18], assist clinicians in choosing the most suitable adjuvant treatment by analyzing the expression profile of genes involved in the metastasis process (St Gallen 2017). These tests are very expensive and often have to be sent to foreign laboratories. The genetic profile is of the utmost importance in the evaluation of parameters already known as the expression of hormonal receptors and HER2; these are currently determined with immunohistochemistry (IHC) or FISH methods, which provide information about the morphological expression of the receptor but not about their functional state. In any case, knowing that the receptor is expressed at the membrane level is not sufficient information to guarantee the effectiveness of the drug addressed to it because that protein may not be functionally active. Therefore, it is necessary to ascertain the functional activation of the gene responsible for the synthesis of the protein to guarantee its functionality, more than its presence. Moreover, from the gene expression profile, additional information that specifically correlates the expression of some genes to the response to individual therapies can be obtained; for example, in HER2-positive patients, the high expression of IGF1R correlates with resistance to Herceptin, as well as the hyperexpression of CCNE1; instead, ER+ patients with high PDGFRA expression are resistant to tamoxifen treatment [14,19,20]. The use of gene profiling tests offers the opportunity for a more adequate risk stratification, an improvement of the therapeutic planning and the clinical outcome, avoiding what happens today, with the standard clinical-pathological criteria, namely, the undertreatment of approximately 20% of women with grade 1 breast cancer and overtreatment of approximately 15% of women with grade 3 breast cancer

Methods

This retrospective study aimed to observe the difference in the receptor state obtained from the genome compared to that obtained with traditional immunohistochemistry. Analyzing biological material from formalin samples from 1994/1995 from two groups of selected patients with breast cancer, one consisting of patients still alive and the other of patients with a survival of less than 4 years. Survival data of a group of patients with a long follow-up period (RTUP) suffering from breast cancer diagnosed in the twoyear period 1994/1995 were obtained with the authorization of the Ethics Committee of Umbria (CEAS). The group, consisting of 55 patients, was then divided into 2 numerically balanced subgroups: the first of 30 patients staged alive on 31/12/2013 with survival of >20 years and the second of 25 patients staged in death with lower survival 4 years after diagnosis (Table 1). The relative tissue samples of the respective patients fixed in formalin and included in paraffin (FFPE) were subsequently collected and stored in the histoteca of the SC of Anatomy and Pathological Histology of the Hospital of Perugia. Twenty-two patients who had the respective tissue sample unsuitable for lack of biological material in the original inclusion block were excluded. The remaining samples, for a total of 33 cases, were all characterized again from a biopathological point of view through a dedicated immunohistochemical panel: ER, PgR, Ki67, HER2 and subjected to microscopic evaluation by a pathologist who was thus able to identify two groups of carcinomas: luminal and nonlluminal (according to the San Gallen criteria 2011 and following).

biomedres-openaccess-journal-bjstr

Table 1: The two-subgroup division of the 55 patients.

The recharacterization provided for the preparation of 1 slide for hematoxylin and 4 slides with blank sections necessary for the immunohistochemical panel for each sample. The pathologist made the diagnosis based on current guidelines and verified that in each section stained with the hematoxylin of each patient there were at least 30% of the neoplastic cells out of the total. This percentage figure is necessary to maximize the extractive yield of total RNA. In practice, for samples with a number of neoplastic cells ≥ 30% of the total, it was not necessary to proceed with macrodissection. In the first phase of the experimentation, so with the 33 starting samples, the enrichment of the sample was not necessary, but 2/4 sections of the FFPE fabric of 10 μm thickness were cut in sequence on microtome and placed in 1.5 ml safe look tubes ready to be extracted. Total RNA, after appropriate quantitative and qualitative evaluation, was used for the preparation of cDNA for sequencing purposes. The library used is Illumina’s TruSeq Total RNA. In the second phase of the experimentation, 2 pilot samples were used to validate the panel of genes obtained with the first phase; they were homogeneous both as biopathological characteristics of the lesion (early breast cancer; tumor diameter; lymph node status; state of HER2 and so on) and as the age of the patients. In the end, for each patient, we obtained 2 tubes of tumor tissue and 2 tubes of healthy tissue ready to be extracted. The extraction kit used to obtain total RNA was the same as that used in phase I of the trial. Total RNA, after appropriate quantitative and qualitative evaluation, was used for the preparation of cDNA for sequencing purposes. The library used was Illumina’s TruSeq RNA Access, suitable for processing RNA extracted from paraffin samples. Total RNA was extracted from sections of paraffin tissue using the “Tissue Preparation Reagents” kit – Sividon Diagnostic, from the Pathological Anatomy Section of the Santa Maria Della Misericordia Hospital. The chosen extraction method was previously “validated” on 2 samples with characteristics of “age of the sample”, “type of tissue” and “origin” identical to the samples to be used for this work. Validation test of the extraction method suitable for the preparation of the “TruSeq RNA Sample Prep” library from RNA for sequencing.
For the deconvolution of the data from the HiSeq sequencer, to process them, the following steps were carried out:
a. Demultiplexing: phase necessary to attribute to every single sample its respective data (1 sample = 1 fastq file).
b. Fastqc: phase in which the quality control of the sequencing is carried out through the use of the “fastq file for reads quality” tool.
c. Trimming: delicate but essential phase of the deconvolution process because it eliminates the reads and low-quality fragments from the Fast file.
d. Mapping: important phase of the process because for each sample a same file (also called bam) is built which specifies how the reads align on the reference genome.
e. Count table assembly: a final phase that includes all the information from the same file of the analyzed samples and related “count reads” in a single table.
Based on the reference human genome, the following are the data of the number of reads that align: Human Genome Assembly (GRCh37/hg19). These data are used as a criterion for deciding which samples will be analysed.
Samples with a low quantity of exons were excluded: a low number of reads mapped to exonic regions <12%.
Two R/Bioconductor 3.2.2 packages were used for statistical analysis:
1. DESEq2 (Love MI, Huber W, Anders S. Moderated estimation of fold change and dispersion for RNA-seq data with DESeq2. Genome Biol. 2014; 15 (12): 550.)
2. edgeR (Robinson MD, McCarthy DJ, and Smyth GK (2010). “edgeR: a Bioconductor package for differential expression analysis of digital gene expression data.” Bioinformatics, 26, pp. -1)
The edgeR package was used on the data analyzed with DESeq2 to confirm the results obtained with this calculation algorithm. Both are based on the negative binomial distribution but use different correction tests. The use of the two packages allows obtaining a list of genes that for both calculation algorithms are differentially expressed between the samples.
The statistical significance that will be used in the two packages is shown below:
1. DESeq2: P-value <0.05; P adjusted value <0.1
2. edgeR: P-value <0.05; False Discovery Rate <0.1.
An analysis of the network of genes significantly differentially expressed in the two groups was also conducted using GeneMania (http://www.genemania.org). This network was built based on the interactions between the genes, as reported by results published in the literature. Features such as gene coexpression, proteinprotein interactions, physical interactions between genes and other functions as described in the studies indicated in the table compared to the network figure are evaluated. Although paraffin introduced non negligible “background noise” in the analysis, the number of reads obtained was satisfactory to conduct a differential expression analysis using a “Read Counter” approach. It is possible to evaluate the formation of 2 small subclusters, and the analysis of differential expression with this dataset allows us to differentiate 25 genes differentially expressed between the 2 groups. The hierarchical cluster of significant genes shows a homogeneous trend among the 2 groups except for 2 luminal samples, which, although clustered with nonluminal samples, are very close to samples of the same stage (sample 7506 luminal staged due to death is very close to sample 2626 nonluminal staged due to death; sample 10429 luminal staged in life is close to sample 262 nonluminal staged in life). The IFIT3 and MX1 genes, among the 25 differentially expressed genes, have a strong interactome with other genes not present in the list but strongly correlated with each other in biological processes.From a careful observation of the PCA luminal vs nonluminal of the samples selected in Figure 1, it is possible to observe the formation of 2 groups of samples that do not comply with the luminal/nonluminal classification provided, as shown by the PCA. Although paraffin introduced nonnegligible “background noise” in the analysis, the number of reads obtained was satisfactory to conduct a differential expression analysis using a “Read Counter” approach. It is possible to evaluate the formation of 2 small subclusters, and the analysis of differential expression with this dataset allows us to differentiate 25 genes differentially expressed between the 2 groups. The hierarchical cluster of significant genes showed a homogeneous trend among the 2 groups. Among the genes, the FGFR3 gene is highlighted: a 2012 paper may be useful in which the following is stated: “FGFR3 activation in MCF7 cells stimulated activation of the mitogenactivated protein kinase (MAPK) and phosphoinositide 3-kinase (PI3K) signaling pathways, both of which have been implicated in tamoxifen resistance in breast cancer”. It should be considered that it is 4 times less expressed in “luminal” cases than in “nonluminal” cases.

biomedres-openaccess-journal-bjstr

Figure 1: Luminal vs Non-Luminal.

Results

From the comparison of the results obtained with the two methods of statistical analysis, 62 significant genes emerged between living and deceased patients (Figure 2). In particular, 12 overexpressed genes emerged in live patients, and 50 overexpressed genes emerged in deceased patients. The 8 intersecting genes of the diagram are IFITM10, CEACAM7, KCNE4, OGDHL, NPY1R, SNCG, ARHGAP23, and PIEZO2. The unique DESeq 2 gene is RBFOX1. In this study, the data of the 26 samples (previous analysis) were analyzed again to highlight the genes that are differentially expressed in the luminal (life/death) and in the nonlluminal (life/ death) samples using the bioinformatic tools edgerR and DESeq2 in the R/Bioconductor environment using the following settings: DESeq2 pValue <0.05, P adjusted value 0.1; edgerR P-value 0.05, FDR 0.1. The parameters are those used in point 4.2 so that the results can be compared.
The final result is divided into some innovative cornerstones: from the 28 overexpressed genes (23 in the luminal and 5 in the nonluminal), we found that
1. DSCAM-AS1 is a specific gene of the luminal A subtype that is not present in healthy tissue or preneoplastic lesions. If this gene is present, the patient could avoid standard PBI and adjuvant therapy.
2. ER+ patients (good prognosis) died because of a high risk for the overexpression of CCND1, INST4, and GAB2.
3. ER+ patients (good prognosis) died because the overexpression of FOXJ3, SOX2, and FGFR3 (4 times less expressed in the luminal region) correlated with the failure of endocrine therapy.
4. in HERB2+ patients, we found other genes, among which PAX8-AS1 was responsible for stem cell proliferation.
5. The fusion of IFITM10 and CTSD promotes cell proliferation of the tumor and is a tumor marker.
The study highlighted a code of 33 genes that characterize breast cancer. Forty-three percent of the isolated genes were common between the 1st and 2nd sequences. Seven of our genes are found in the commercial genetic tests PAM50, Oncotype and Endopredict: four are present in the Panel Cancer targets 50 genes of the Ion AmpliSeq. The verification of the validation of the 28 genes selected from phase I in a more recent sample of women (2005) and characterized by the molecular split point (Endopredict®) allowed us to provide the study with greater consistency (Table 2).

biomedres-openaccess-journal-bjstr

Figure 2: Life vs Dead.

biomedres-openaccess-journal-bjstr

Table 2: The 28 genes characterized by the molecular split point (Endopredict®).

Conclusion

A very positive result was the ability to extract suitable RNA from 1994 samples in paraffin in good quantities and qualities to make the study possible. In this regard, experiments have been conducted to define the best protocol between RNA extraction and library preparation. The calculation of the RNA (RNA integrity number) and the concentration at Qubit allowed us to always “select” valid samples. The basic hypothesis of the study has been confirmed: the characterization of the luminal and nonluminal tumors is not real through IHC (surrogate St. Gallen), which is routinely used but must be read on a molecular basis. However, the most relevant data are represented by the 33 overexpressed genes: 28 genes (23 in the luminal and 5 in the nonluminal) and 5 genes (which confirm the premises of the study in wanting to find molecular markers capable of “personalizing” the therapy). Two of the 28 genes were always present in both groups: a CXCL13 life gene and an IFITM10 death gene. Moreover, IFITM10 and CTSD fusion promotes cell proliferation of the tumor and is a tumor marker. The DSCAM-AS1 gene is specific to the luminal A subtype. If this gene is present, the patient could avoid standard PBI and adjuvant therapy. The result obtained, which can be assumed to be transformed into a genetic panel, following validation on more recent samples (2005) and studied with Endopredict®, will help us to implement a personalization of the therapy: surgical and adjuvant. In the preoperative phase, with the core biopsy of the neoplasm, the histological diagnosis is obtained, and then the biopathological characterization and the presence of the genes described above are verified to evaluate the risk of local and/or systemic recurrence, which varies according to the molecular subtype.
The hyperexpression of CCND1, INST4 and GAB2 changes the prognosis of ER+ patients from favorable to inaustic. Our work also revealed that ER+ patients died (in which we would have expected a good prognosis) because they had overexpressed FOXJ3, SOX2, and FGFR3 genes that correlate with the failure of endocrine therapy. In the postoperative phase, targeted therapy allows a better stratification of adjuvant therapies based on the amplification of the genes that regulate, for example, resistance to tamoxifen and/ or to trastuzumab.

For More Articles: Biomedical Journal Impact Factor: https://biomedres.us

Open Access Journals on Orthopedics

Enhancing Patient Outcomes with Clinical Nutrition: The Effects of Supplementation in Orthopedics

Introduction

Each year more than half of people over the age of 18 in the US will develop a musculoskeletal injury that lasts more than 3 months. This is roughly 18% of all clinical visits and represents enormous costs, ~5.7% of US GDP and 216 million lost workdays [1]. Tens of millions of patients each year turn to orthopedic surgeons and physical therapists to treat their injuries and return to normal function as quickly as possible. There is an urgent need to utilize all of the latest techniques, tools and technologies to improve outcomes and enhance patient recovery to lower the cost burden on the health system and improve economic output due to lost workdays. New innovations continue to enhance the field of musculoskeletal injury treatment and management. One area that is showing considerable promise is in targeted nutrition.

Nutrition and Healing

Science is increasingly showing just how critical nutrition is to healing and recovery. As we know during a state of trauma, such as injury or surgery, the body’s nutritional needs increase:
a) The body enters a higher metabolic state and requires more energy
b) Trauma and lack of use leads to muscle atrophy, which prolongs recovery
c) The immune system is weakened due to stress and shock
d) Risk of wound infection is increased
e) Persistent inflammation delays return of function
f) Trauma and physiological stress lead to increased fatigue
Nutritional deficiencies impede the natural progression of healing, including elevating the risk of infection and lengthening recovery periods. A patient that is nutritionally optimized will heal better and faster and have better long-term outcomes. One that isn’t will heal more slowly and may have long-term complications. Unfortunately, most Americans are overfed and undernourished, meaning most Americans are not at optimal nutritional status to prevent complications post-trauma. Hospital studies have shown that as many as 50% of patients are undernourished or malnourished [2]. These patients face greater complications than properly nourished patients, including longer hospital stays, greater risk of infection, and increased mortality. One study, published in the Journal of Nutrition, studied over 16,000 individuals and found that many are not meeting the minimum recommended thresholds for micronutrient intake (Table 1): The combination of increased baseline nutritional needs post-trauma, from injury or surgery, and prevalent undernourishment means that most Americans are not well equipped nutritionally to heal Figure 1.

biomedres-openaccess-journal-bjstr

Table 1.

Adapted from3

biomedres-openaccess-journal-bjstr

Figure 1: The Impact of Malnourishment on Healing ().

Clinical Evidence – Nutrition as an Orthopedic Treatment Tool

The science of nutrition in orthopedics is advancing rapidly and a growing body of clinical trials are demonstrating convincingly that targeted nutrition can enhance outcomes, both for acute patients as well as for patients with chronic conditions. Wound healing, inflammation response, increasing muscle mass and strength, and decreasing muscle atrophy are crucial recovery objectives for orthopedic patients, and nutrition has been shown to support these healing processes. Below we look at a sampling of randomized trials from a larger set of published clinical trials in orthopedics. A randomized controlled study by Ekinci et al. [3]. included 75 older female patients with hip fractures and investigated the effects of Calcium HMB, vitamin D, and protein supplementation on wound healing and muscle strength. The study group received an enteral product containing 3g CaHMB, 1000 IU vitamin D, and 36 g protein, in addition to standard postoperative nutrition. They found that the patients on the nutritional supplement product had an acceleration of wound healing, shortening of immobilization period, and increased muscle strength without changing body mass index. This study also found a reduced dependence to bed and related complications after an orthopedic operation [4,5]. A study by Negro et al. found that twice daily consumption of a mix containing Essential Amino Acids (EAA), creatine, vitamin D and Muscle Restore Complex® (MRC®: Alpha Lipoic Acid (ALA), Coenzyme Q10 (CoQ10), resveratrol) for 12 weeks may aid in sarcopenia prevention without physical exercise by improving muscle aging-related outcomes, such as muscle mass, muscle strength and muscle power. In this study 38 healthy elderly subjects were randomized and allocated into the supplement or placebo group. Significant improvements were found in the supplement group compared to placebo in vitamin D blood levels, Legs Fat Free Mass, Appendicular Lean Mass, Maximal Voluntary Contraction, and Peak Power [6]. Dreyer et al. found in a double-blind, placebo-controlled, randomized trial on patients undergoing total knee arthroplasty (TKA), that EAA supplementation is safe and reduced the loss of muscle volume in older adults recovering from TKA [7]. These studies emphasize the importance of targeted nutritional supplements for muscle preservation and return to function – critical in any patient with a surgery that results in significant muscle atrophy such as ACL.
Certain key ingredients are crucial to include to help support recovery. Liberman et al. found that thirteen weeks of nutritional supplementation with Vitamin D and leucine-enriched whey protein may attenuate the progression of chronic low- grade inflammatory profile in older sarcopenic persons with mobility limitations [8]. Another key study by Kim et al. found that in surgical patients, the addition of glutamine supplementation reduced infection rates and shortened the length of hospital stay. Glutamine also decreased the production of pro-inflammatory cytokines in this population [9]. By lowering inflammation, the healing process is greatly enhanced. β-hydroxy β-methylbutyrate (HMB) has been shown in many studies to promote wound healing and diminish muscle wasting Flakoll et al. found that elderly women treated with a nutritional supplement containing HMB, arginine, and lysine for 12 weeks had increased muscle mass and maximum strength [10]. HMB is also utilized and useful in combination therapies. This doubleblind controlled 12- month study by Rathmacher et al. found that HMB in combination with Vitamin D had a significant benefit on lean body mass and showed improvement in knee extension peak torque even with no exercise. Overall, their findings showed that even without exercise, the HMB+ Vitamin D supplemented group showed significant increases in functional outputs than those in controls [11]. Interestingly, HMB has also been shown to increase anabolic signaling [12].

Conclusions

A very significant proportion of the orthopedic patient population is nutritionally compromised and during trauma the body’s nutritional needs increase above baseline. Clinical studies are increasingly demonstrating that a patient’s nutritional status can directly impact outcomes and that modification through supplementation can enhance outcomes. The American Physical Therapy Association (APTA) has recognized the important role of nutrition in patient care and treatment and put it in scope of practice. APTA states: “Nutrition is part of the professional scope of practice for physical therapists”; further they state: “it is the role of the physical therapist to screen for and provide information on diet and nutritional issues to patients, clients, and the community within the scope of physical therapist practice.” (House of Delegates P06-15-22-17).” There remains work to be done to quantify the economic impact and savings to the healthcare system, but we suspect it is considerable. For example, large retrospective studies done by Novartis and Eli Lilly of more than 130 thousand patients shows that severe muscle atrophy and weakness (MAW) is common in joint replacement patients and that complications related to MAW cost roughly $10K per patient to treat13. Similarly, according to a study published by Mackenzie et al. [13]. in the Journal of Orthopedic Sports Medicine, revision costs in ACL patients range roughly in the $9K range [14]. Considering the sheer volume of orthopedic injuries and surgeries, we can extrapolate that there is billions of dollars of cost in the healthcare system that can be addressed through nutritional supplementation and optimization.
In summary, an increasing body of science suggests that targeted supplementation should be utilized in patient care. By doing so, we can improve patient outcomes and reduce healthcare costs.

For More Articles: Biomedical Journal Impact Factor: https://biomedres.us

Open Access Journals on Oncology

Teleconsultations in Oncology: The Way Forward?

Opinion

Teleconsultation is defined as synchronous or asynchronous consultation using information and communication technology to omit geographical and functional distance [1]. The WHO defines telemedicine as: “Delivery of health-care services, where distance is a critical factor, by all health-care professionals using information and communications technologies for the exchange of valid information for diagnosis, treatment and prevention of disease and injuries, research and evaluation, and the continuing education of health-care workers, with the aim of advancing the health of individuals and communities” [2]. In the current COVID-19 pandemic, the use of telemedicine has increased by leaps and bounds- both by patients as well as health care providers. There are certain medical specialties where Teleconsults may be very useful, and maybe the way forward as well, viz. Dermatology, General Medicine, Diabetology, Endocrinology, Psychotherapy, to name a few. However, if we apply the same across all specialties- Oncology in general, and Surgical Oncology, in particular, seem to be the least efficacious towards “telemedicine”. The Cancer sufferers are caught on the ledge of a precipice- Cancer on one end, and COVID at the other. But, is telemedicine the way out? The pros would be – ability to allay anxiety, provide basic management and hope for a future “in person” consults. The cons include inability to manage any emergent situation or provide any definitive management to the patients. So- is there no role in Oncology? Effective teleoncology interventions may include cancer telegenetics, telepathology, bundling of cancer related teleapplications, remote chemotherapy supervision, symptom management, survivorship care, palliative care, and approaches to increase access to cancer clinical trials [3]. The Medical Council of India, in partnership with the NITI Aayog, has laid down certain guidelines for telemedicine, to provide Medical Practitioners to work within a specific framework. They have considered tele-consults to be equivalent to the “in –person” consults, both clinically, as well as economically. However, if we look at the satisfaction levels of patients, there seems to be a tremendous shortfall. The physician as well, faces several limitations, in accurately assessing the patients’ clinical condition. Moreover, “in person” consults allow a more humane, personal and confidential approach, which go a huge way, not only in building the “patientdoctor” relationship, but also enabling a more wholesome approach to disease management. In a nutshell, Teleconsultations are here to stay, but their appropriate usage for optimal patient outcomes and satisfaction is still debatable.

For More Articles: Biomedical Journal Impact Factor: https://biomedres.us

Open Access Journals on Dermatology

Development of Flexural Psoriasis Following COVID-19 Infection in an Infant

Introduction

A handful of rare and newly reported dermatoses have come into light following COVID-19 infection. While most manifestations are benign are transient, there are also a handful of reports of COVID-19 triggering a chronic dermatosis [1]. Although there are reports of triggers and flares of various morphological variants of psoriasis following COVID-19 infection, there is no such report of trigger of napkin psoriasis following the viral infection [2,3].

Case Report

A 6 months old female child presented to our skin out patient department with the parents complaining of development of whitish pink macerated lesions in her groin since 3 weeks. On examination there was presence of well-defined bilaterally symmetrical fine scaly erythematous and slightly indurated plaques in intertriginous areas of groin, buttocks and anogenital region (Figure 1). The parents reported that the child had developed a lab proven COVID-19 infection 2 months back, which she presumably contracted from her infected mother. The onset of her cutaneous lesions had begun 5 weeks following the infection, while she experienced a respiratory flare in her symptoms. Current lab investigations revealed the girl to be RTPCR negative for COVID-19. Rest of the lab investigations were unremarkable. The child also had an optimum weight, height and milestones for her age. The KOH and fungal culture of lesional scraping and woods’ lamp was negative. The child was diagnosed with inverse or flexural psoriasis on the basis of striking clinical picture which further got confirmed by histopathological analysis.
Biopsy findings included hyperkeratosis, fused rete ridged, suprapapillary thinning, and dilated tortuous dermal blood vessels. The child was prescribed hydrocortisone lotion and pemicrolimus ointment, along with oral antihistaminincs.

Figure 1: Napkin psoriasis in a 6-months-old female child 8 weeks after COVID-19 infection.

Discussion

The only variant of psoriasis presumed to have a definitive correlation following a systemic infection is guttate psoriasis. It is triggered following a staphylococcal infection and seen predominantly in children and young adults [4]. Various other genetic, environmental and idiopathic factors have also been reported to be responsible for triggering psoriasis. In fact. Even respiratory viral triggers, including COVID-19, are being reported. A viral infection can lead to immune dysregulation which stimulated TLR-3 which can stimulate CXCL8 and IL-36 [5]. As the novel COVID-19 evolves and unfolds it is only obvious that its myriad manifestations and complications will unravel. Skin being the largest organ has a great potential of being perhaps the greatest target of various immune deregulatory sequalae of this infection, especially in long haulers. Although our patient had a favourable clinical course with rapid recovery, the potential long term complications of COVID-19 are still unpredictable.

Conclusion

To the best of our knowledge this is the first such case of napkin psoriasis triggered by COVID-19. A dermatologist must always be on the look out to differentiate such presentation from other similar looking spotters like candida intertrigo, tinea cruris, and acrodermatitis enteropathica to name a few.

For More Articles: Biomedical Journal Impact Factor: https://biomedres.us

Open Access Journals on Medicine

Electroanatomical Voltage Mapping Endomyocardial Biopsy-Guided Diagnosis and Therapy of Erythroparvovirus Myocarditis Presenting with Ventricular Arrhythmias: Case Series and Review of the Literature

Introduction

Myocarditis is an inflammation of the cardiac muscle caused by infiltration of immunogenic cells following different kinds of cardiac injury. It most commonly results from a viral illness; however, it can also be due to non-infectious etiologies. Given its variable clinical presentation, the diagnosis is frequently missed, making it difficult to quantify the true incidence of acute myocarditis. Infectious causes include a large number of viruses, as well as bacteria, protozoa and fungi; among these pathogens viruses are the most frequent cause of the myocardial inflammatory process. The most common forms of cardiotropic viruses found in endomyocardial biopsies (EMB) are erythroparvovirus B19 (B19V) and human herpes virus 6 (HHV6) and most recently Coronavirus (COVID19) [1-4]. We will now present two cases of 3 Dimensional electroanatomical mapping (3D-EAM) guided endomyocardial biopsy for the diagnosis and therapy of B19V myocarditis presenting with ventricular arrhythmias.

Case 1

A 54-year-old woman presented to our emergency departement with a sustained monomorphic ventricular tachycardias (VTs) (inferior axis, RBBB, Figure 1), which, due to evolving haemodynamic instability, had to be cardioverted externally. She had no other known diseases except for a MTHFR mutation without clinical relevance and did not take any medications. On her arrival and after the external cardioversion she had no complaints. She had a normal blood work with no signs of an active infection and only a slightly elevated Troponin without elevation of CK as well as CKMB. Her ECG in sinus rhythm showed a minimal diffuse STelevation and relatively low voltages in the praecordial leads. The patient underwent a coronary-angiography, with no signs of coronary disease, an echocardiography which showed a normal left ventricular function with a slightly enlarged and dyskinetic right ventricle and finally a cardiac MRI (c-MRI) with evidence of preserved LV function and a RV dyskinesia as well as multiple RV aneurysms and areas of edema as well as multisegmental transmural late gadolinium enhancement on both ventricles, setting a differential diagnosis between sarcoidosis and myocarditis.
The patient underwent a PET-CT which ruled out the sarcoidosis. We performed a 3DEAM-guided EMB to target areas of edema and fibrosis on the interventricular septum and avoid false negative results, which showed signs of an inflammatory cardiomyopathy with B19V with active replication and started the patient on a therapy with interferon Beta which is a well-tolerated and safe treatment option, leading to effective virus clearance or reduction of the virus load in patients with chronic viral cardiomyopathy [5]. After two months of therapy, we repeated a c-MRI which showed an almost complete resolution of the edema with persistence of late enhancement as scarred myocardial tissue. The patient underwent a secondary prophylactic implantation of an ICD and is stable ever since, without having experienced any new arrhythmias.

biomedres-openaccess-journal-bjstr

Figure 1: ECG: sustained monomorphic ventricular tachycardia with an inferior axis and a right bundle branch block, rhythm of presentation of the patient in case1.

Case 2

A 66-year-old woman was sent to our cardiology Department after a secondary prophylactic implantation of an ICD, due to sustained slow ventricular arrhythmias (LSB, inferior axis) after a probatory therapy with amiodarone as well as with sotalol. The echocardiography showed a mildly reduced EF (41%) with a diffuse hypocontractility, more evident in the basal segments. There were no echocardiographic signs for a dilated cardiomyopathy or for a hypetrophic cardiomyopathy and a coronaroangiography made in the first hospital had already ruled out any ischaemic cause of the reduced EF or the VTs. As the VTs were of incessant nature the patient underwent an emergency VT ablation of the RVOT-septal focus. Even if the procedure had an acute success with termination of the ventricular arrhythmias, one day after the ablation the VTs started again, and the patient was put on Mexiletine (Table 1).
Because of the unclear diagnosis of the origin of the ventricular arrhythmias, their persistence after ablation, and the impossibility to run a c-MRI because of the implanted ICD, we decided to perform a 3DEAM-guided EMB which showed an active B19V replication. We then began an immunomodulating therapy with interferonbeta, under which a cessation of the ventricular arrhythmias was documented. At the follow-up, after six months of interferonbeta there were no sustained VTs anymore in the ICD-memory. No control MRI could be performed because of the device in situ (Figures 1 & 2).

biomedres-openaccess-journal-bjstr

Table 1: Endomyocardial biopsy results.

biomedres-openaccess-journal-bjstr

Figure 2: NavX Ensite Precision™ Image : bipolar voltage mapping of the right ventricle showing healthy ventricular tissue in purple (bipolar voltage > 1,5 mV) and scar ventricular tissue (grey, < 0,5 mV) with pathological area identified with the color coded scale. Right anterior oblique view with NavX Ensite Precision™ system. The yellow dots show the His Bundle And the right fascicle While the orange dots show the site in which the endomyocardial biopsy has been made, targetting the fibrotic or edematous tissue on the septal right ventricular wall.

Discussion

Even though for many years the medical research has failed to show a causative role of B19V in the genesis of heart failure confirming only an association [5-7], some more recent works have reported that chronic viral infections of the heart can be one antecedent event leading to progressive dysfunction of the myocardium, often with an impaired prognosis due to a virus- or immune-mediated myocardial injury [6]. Moreover, even if it is known that myocarditis can lead to cardiac dysfunction and to ventricular arrhythmias through the development of scars and therefore reentry circuits [8] no direct association between B19V persistence and those clinical pictures has been described.
As the diagnosis of viral myocarditis can be problematic and the presentation can mimic other diseases such as sarcoidosis, arrhythmogenic cardiomyopathy as well as an evolution in dilated cardyomyopathy, the gold standard for the diagnosis and guide of the therapy is the EMB, an invasive but safe diagnostic tool that allows the quantification and identification of immune cell infiltrates, the quantification of viral loads and confirmation of virus subtypes via sequencing [9-14]. Hystorically, the EMB was performed under fluoroscopy guidance and was associated with potentially critical complications such as a cardiac tamponade. In the last years, there has been an evolving and promising use of EMB guided by 3D-electroanatomic voltage mapping, which could confere a higher specificity and sensitivity in targeting the involved tissue and in reducing false negative results, could reduce the radiation exposure of patients and operators in such procedures and present a higher safety profile compared with the mono-dimensional fluoroscopy images [15].
We described how two patients presenting with ventricular tachycardias of unknown cause could be successfully managed after a diagnostic 3D-EAM guided EMB after ruling out the most common causes of ventricular tachycardia. In our patients a subacute viral myocarditis caused by persistent erythroparvovirus, having sustained ventricular tachycardias as clinical presentation and demonstrating active replication of the virus, an immunomodulating therapy with interferon Beta was able to stabilize and resolve the ventricular arrhythmias. The 3D EAM guided EMB either combined with cMRI or not, can help to improve specificity and sensitivity in targeting the involved my-ocardial tissue and avoid false negative results, without increasing risks for the patients, as already shown in the literature [15,16].

Conclusion

To our knowledge this is the first case series described in the literature. Even if we will need a greater number of patients to confirm our observations, we hypothesize that B19V active replication could have a pivotal role in some forms of myocarditis which show an arrhythmogenic clinical presentation and that diagnosing and treating B19V in patients with a subacute myocarditis and ventricular arrhythmias could be determinant in solving the arrhythmias as well as the myocardial inflammation, although is not curative of the areas where the myocarditis has already produced a myocardial scar. We also described the emerging role of 3DEAM-guided endomyocardial biopsy in order to target the involved myocardial tissue and reduce complications as well as false negative results.

For More Articles: Biomedical Journal Impact Factor: https://biomedres.us