Open Access Journals on Bioregenerative Medicine

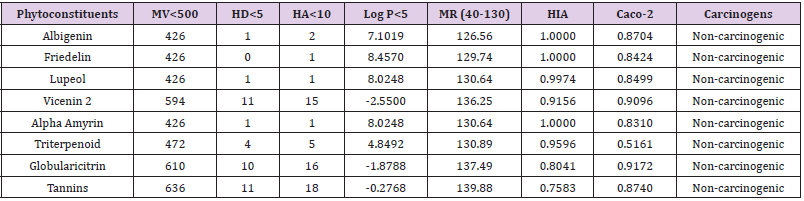
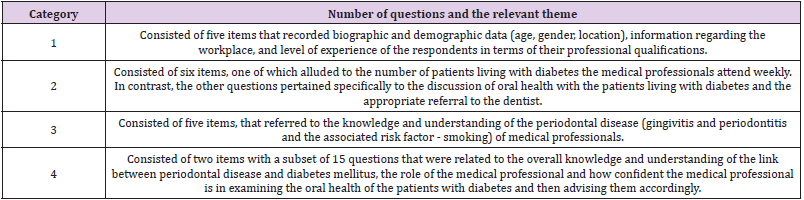
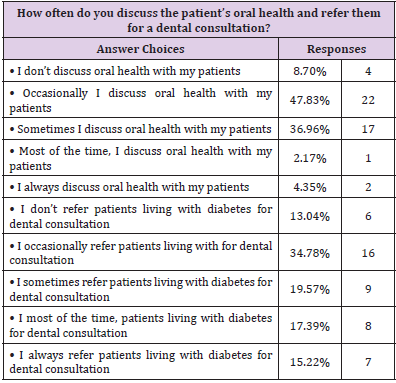
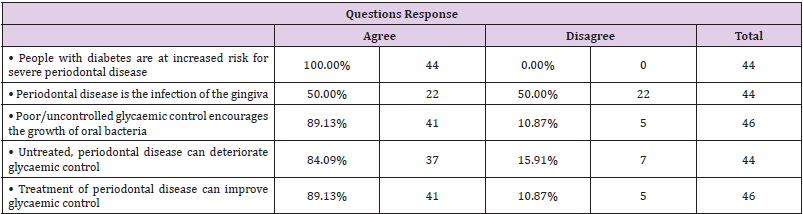
Inhibitory Effects of Ninjin’yoeito Ingestion on a Reduction in Chewing-Like Movement and Cognitive Hypofunction in Powder Diet-Fed Mice

Introduction

“Mastication” refers to a series of processes from food ingestion until food mass formation through mixing with saliva. During mastication, the mandible rhythmically moves through cooperation among the teeth, jaw, and masticatory muscle. These movements are complexly and exquisitely regulated by the central nervous system based on various pieces of oral sensory information [1]. A recent study showed that mastication promoted the process of food digestion/absorption, exhibiting various actions: the activation of the brain, inhibition of brain aging, maintenance/improvement of the motor function, and regulation of blood circulation [2]. Thus, mastication is associated with various functions, playing an important role. However, recently, the influence of soft-diet-related masticatory hypofunction on biological bodies has been indicated [3]. Furthermore, a decline in the masticatory function (oral frailty) associated with aging-related tooth loss or oral hypofunction is considered to be an early, important sign of aging.

It increases the risk of dementia and promotes the risk of drymouth- or dysphagia-related aspiration pneumonia or a decline in the physical function (frailty) related to a reduction in energy intake. Many elderly persons have multiple diseases, and multi-component-system Kampo medicine formulations are usually used from the viewpoint of polypharmacy with high risk of adverse reactions [4]. Among these formulations, Ninjin’yoeito, which has been used in clinical practice, is effective for symptoms, such as a decline in physical strength after illness, fatigue/malaise, anorexia, night sweats, coldness of the hands and feet, and anemia. Recently, this formulation has been particularly prescribed for frail patients [5,6]. In this study, we examined the effects of Ninjin’yoeito on reduction in chewing-like movement and cognitive hypofunction using powder-fed mice.

Materials and Methods

Experiment Materials

Laboratory pellet chow (solid diet) and powder chow (powder diet) were purchased from CLEA Japan (Osaka, japan). The dried extract powder of Ninjin’yoeito (NYT, Lot No. 1712111AO) was used in the present study and was manufactured by the GMP Pharmaceutical Factory of Kracie Pharma, Ltd. (Qingdao, China). NYT consists of 12 crude drugs: Rehmannia Root, Japanese Angelica Root, Atractylodes Rhizome, Poria Sclerotium, Ginseng, Cinnamon Bark, Polygala Root, Peony Root, Citrus Unshiu Peel, Astragalus Root, Glycyrrhiza, and Schisandra Fruit. The details are presented in Table 1.

Animals

Three-week-old male C57BL/6J mice were purchased from Japan SLC Inc. (Shizuoka, Japan), and maintained in a 12 h/12 h light/dark cycle in a temperature- and humidity-controlled room (room temperature, 23±2℃; humidity, 55±10%). The animals were divided into 4 groups. The animals were divided into 4 groups: solid diet group fed laboratory pellet chow (solid diet), powder diet group fed the powder chow (powder diet), and the two experimental groups which fed powder diet plus 1% NYT or powder diet plus 3% NYT. Animals had free access to food and water for 5 months. The body weight of each mouse was measured once a week and the total amount food and water consumed recorded 5 times per week. After the mice had been fed these diets for 5 months (at 25 weeks of age), blood was taken from each mouse by venous puncture using a heparin-containing syringe under anesthesia with isoflurane. Subsequently, the masseter muscle, temporal muscle, large salivary glands (parotid gland, submandibular gland, sublingual gland), gastrocnemius muscle, soleus muscle, and epididymal adipose tissue were extirpated, and the respective wet weights were quickly removed and weighted. The plasma was prepared and frozen at -40°C until analysis. This experiment was performed after approval by the Animal experiment committee of Kracie Pharmaceutical, Ltd. Kampo Research Laboratories following regulations on animal experimentation specified by the Research Laboratories and ‘Basic guidelines for the conduct of animal experiments in implementing agencies under the jurisdiction the Ministry of Health, Labour and Welfare’.

Measurement of Chewing-Like Movement

A device to measure chewing-like movement in mice was prepared, as described by Ayada, et al. [7], and the amount of chewing-like movement was measured, utilizing a mouse escaping habit by tail fixation (Figure 1); each mouse was placed in a thin cylinder, and plastic plates were set at the anterior and posterior notches of the cylinder. The murine tail was fixed with tape for a specific time, and the amount of change in the plastic plates was calculated. In this study, the measurement time was established as 1 hour, and the amount of change in the plastic plates was regarded as the amount of chewing-like movement in mice. The amount of chewing-like movement was measured 30, 90, and 150 days after the start of powder feeding (51, 111, and 171 days of age).

biomedres-openaccess-journal-bjstr

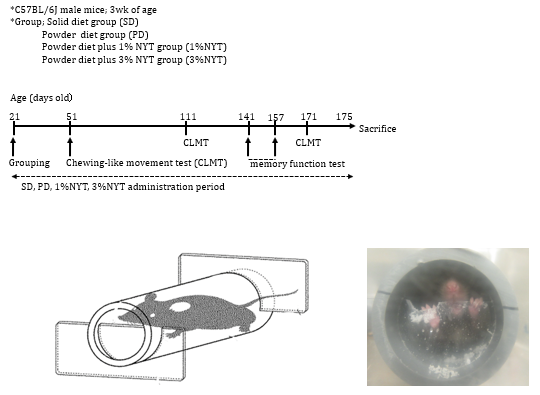
Figure 1: Experimental schedule for chewing-like movement and memory function of mice impaired by soft diet feeding.

Passive Avoidance Learning Test

The passive avoidance learning test was conducted from 120 days after the start of powder feeding (141 days of age). A grid was installed on the floor of an experimental device, and the space consisted of a white-light-illuminated bright room (9x25x32 cm) and dark room (30x29x32 cm). A plastic door was present between the two rooms. This test consisted of 3 parts: pre-training, training, and retaining trials. Pre-training trial (Day 120): Each mouse was placed in a bright room with the door closed and acclimated for 30 seconds. Subsequently, the door was opened. After the posterior limbs of the mice entered a dark room, the door was closed. The mice was acclimated in the dark room for 30 seconds, and collected from the device. Training trial (Day 121): Each mouse was placed in a bright room with the door closed. After 30 seconds, the door was opened. After the posterior limbs of the mice entered a dark room, the door was closed. After 3 seconds, electric stimulation (0.25 mA, 2 seconds) loading was conducted. The mice was collected from the dark room 30 seconds after electric stimulation, and placed in a breeding cage. Retaining trial (Days 122, 125, and 136): Each mouse was placed in a bright room, with the door closed. After 30 seconds, the door was opened. The latency time (cut off 300 seconds) until the posterior limbs or half body of the mice entered a dark room was measured.

Measurement of the Plasma NO levels

Plasma was centrifuged at 4°C and 14,000 g for 15 minutes using Amicon Ultra-0.5-PLGC Ultracel-10 membrane (UFC501096, Merck KGaA) for deproteinization. For measurement of the plasma NO level after deproteinization, a Nitrate/Nitrite Colorimetric Assay Kit (Item No. 760871, Cayman Chemical Company) was used.

Measurement of the Plasma Albumin Levels

For measurement of the plasma albumin level, an LBIS Mouse Albumin ELISA Kit (AKRAL-121, FUJIFILM Wako Chemicals) was used.

Statistical Analysis

The results are expressed as the mean±standard error (means±S.E.M.). Significance tests were conducted using Dunnett’s method with Statcel [3] software. P value of less than 0.05 was considered to indicate statistical significance. For the significance tests with serial data, repeated measure-variance analysis (repeated measure ANOVA) was performed. P value of less than 0.05 was considered to indicate statistical significance.

Results

Measurement of Chewing-Like Movement

The amount of chewing-like movement was serially measured 30, 90, and 150 days after the start of powder feeding. As shown in Figure 2, in the powder diet group, the amount of change in the plastic plates was smaller than in the solid diet group, and there was a reduction in the amount of chewing-like movement. The powder diet plus 3% NYT group, significantly suppressed the reduction in the amount of chewing-like movement compared to the powder diet group, but the powder diet plus 1% NYT did not affect.

biomedres-openaccess-journal-bjstr

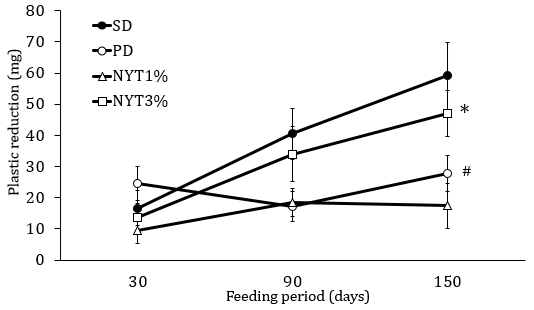
Figure 2: Effect of NYT on chewing-like movement.

Note: The amount of chewing-like movement was serially measured 30, 90, and 150 days after the start of powder feeding. The murine tail was fixed with tape for a specific time, and the amount of change in the plastic plates for 1 hour was calculated. Mice were divided into the following 4 groups: solid diet group (SD), powder diet group (PD), powder diet plus NYT 1% group (NYT1%), powder diet plus NYT 3% group (NYT3%). Closed circle: SD; open circle: PD; open square: NYT 1%; open square: NYT 3%. Each value represents the mean ± S.E.M., n=12, #p<0.05 vs. SD and *p<0.05 vs. PD (repeated measure ANOVA).

Passive Avoidance Learning Test

To measure mice memory function 120 days after the start of powder diet, the passive avoidance learning test was conducted. As shown in Figure 3, a retaining trial was performed 122, 125, and 136 days after the start of powder diet. In the solid diet group, memory was maintained throughout the test period, but in the solid diet group, the latency time until the mouse entered a dark room was shortened at Day 136, suggesting a reduction in memory. In the powder diet plus 3% NYT group, the latency time until entering a dark room was prolonged in comparison with powder diet fed mice; a powder-diet-related reduction in memory was inhibited.

biomedres-openaccess-journal-bjstr

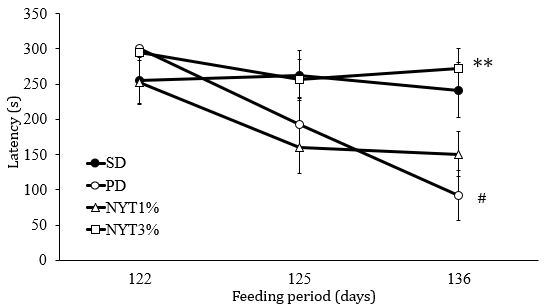
Figure 3: Effect of NYT on memory function.

Note: Latency to enter the dark compartment before and after conditioning was measured in passive avoidance test. The cut off latency was set at 300s. Mice were divided into the following 4 groups: solid diet group (SD), powder diet group (PD), powder diet plus NYT 1% group (NYT1%), powder diet plus NYT 3% group (NYT3%). Closed circle: SD; open circle: PD; open square: NYT 1%; open square: NYT 3%. Each value represents the mean ± S.E.M., n=12, #p<0.05 vs. SD and *p<0.05 vs. PD (repeated measure ANOVA).

Body Weight/Food Intake/Water Intakes

The body weight, food intake and water intake were serially measured. As shown in Figures 4 & 5, in the powder diet group, food/water intake increased in comparison with the solid diet group. In addition, weight gain was noted in the powder diet group but was not significantly different among the powder diet group, powder diet plus 1% and 3% NYT groups.

biomedres-openaccess-journal-bjstr

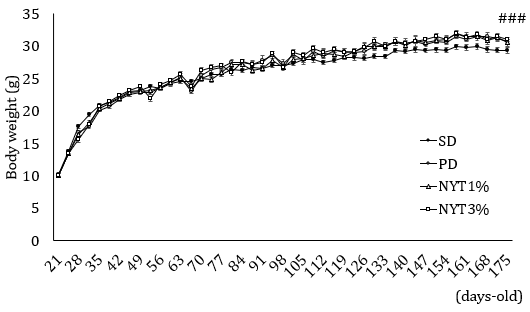
Figure 4: Effect of NYT on body weight.

Note: Whole-body weight was measured throughout the experimental period. Mice were divided into the following 4 groups: solid diet group (SD), powder diet group (PD), powder diet plus NYT 1% group (NYT1%), powder diet plus NYT 3% group (NYT3%). Closed circle: SD; open circle: PD; open square: NYT 1%; open square: NYT 3%. Each value represents the mean ± S.E.M., n=11-12, ###p<0.001 vs. SD (repeated measure ANOVA).
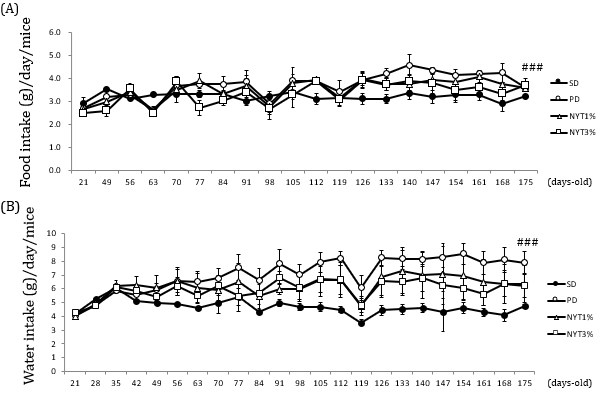
biomedres-openaccess-journal-bjstr

Figure 5:

(A) Effect of NYT on food intake and

(B) Water intake.

Note: Whole food and water intake were measured throughout the experimental period. Mice were divided into the following 4 groups: solid diet group (SD), powder diet group (PD), powder diet plus NYT 1% group (NYT1%), powder diet plus NYT 3% group (NYT3%). Closed circle: SD; open circle: PD; open square: NYT 1%; open square: NYT 3%. Each value represents the mean ± S.E.M., n=4, ###p<0.001 vs. SD (repeated measure ANOVA).

Wet Weights of Tissues

As shown in Figure 6, the epididymal adipose tissue weight significantly decreased in the powder diet group. Whereas, there was a slight increase in the powder diet plus 1% NYT group. However, there were no differences in the weights of masseter muscle, temporal muscle, gastrocnemius muscle, or soleus muscle among the groups (data not shown).

biomedres-openaccess-journal-bjstr

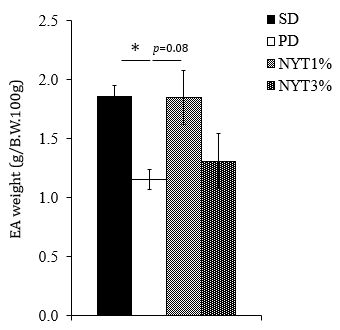
Figure 6: Effect of NYT on epididymal adipose tissue weight.

Note: Mice were divided into following 4 groups: solid diet group (SD), powder diet group (PD), powder diet plus NYT 1% group (NYT1%), powder diet plus NYT 3% group (NYT3%). Each value represents the mean ± S.E.M., n=8-9, *p<0.05 vs. PD (Dunnett’s test).

Plasma NO Levels

As shown in Figure 7A, the plasma NO level in the powder diet group was slightly lower than in the solid diet group. In the powder diet plus 3% NYT group, there was a significant increase compared to the powder diet group, and the plasma NO level was maintained at the same level as the solid diet group.

Plasma Albumin Levels

As shown in Figure 7B, the blood albumin level in the powder diet group was significantly lower than in the solid diet group. In the powder diet plus 1% NYT group, there was a significant increase.

biomedres-openaccess-journal-bjstr

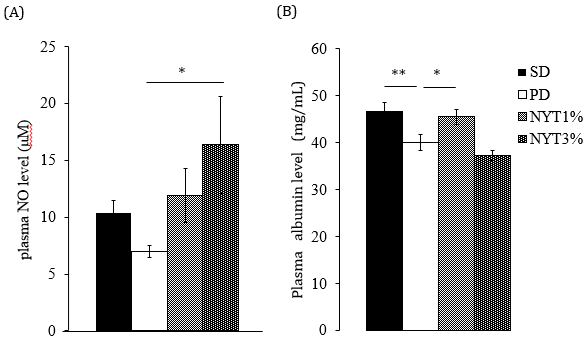
Figure 7: (A) Effect of NYT on plasma NO level and

(B) Plasma albumin level.

Note: Mice were divided into the following 4 groups: solid diet group (SD), powder diet group (PD), powder diet plus NYT 1% group (NYT1%), powder diet plus NYT3% group (NYT 3%). Each value represents the mean ± S.E.M., n=8-9, *p<0.05 vs. PD (Dunnett’s test).

Discussion

Solid diet serially increased the amount of chewing-like movement in mice, whereas there was no serial increase during powder diet. 3% NYT-containing powder diet serially increased the amount of chewing-like movement, as demonstrated for solid feeding. However, there were no changes in the weights of masseter muscle, temporal muscle, or large salivary gland among the groups (data not shown). As the cause, it is possible that NYT administration contribute to the actions of other masticatory organs, such as the mouse jaw and mouth-opening muscle.

A reduction in masticatory movement reduces memory [8]. As nerves are extensively distributed in the brain area responsible for oral-tissue domination, so the mechanism of masticatory function and memory is complicated. Mastication-related mechanical stimuli from the oral area potentiate central nervous stimulation, leading to the activation of cholinergic neurons in the pedunculopontine tegmental nucleus, neurogenesis in the hippocampus, and increases in BDNF secretion and synapse transmission efficiency [9]. Furthermore, several studies indicated that masticatory movement increased intracerebral blood flow [10,11]. Recently, it was shown that an increase in cerebral blood flow was mediated by the nucleus basalis of Meynert [12]. This nucleus is known as a cholinergic nucleus, and NO released by the vascular endothelium may activate cholinergic nerves. In this study, powder feeding resulted in a reduction in memory on the passive avoidance test, and NYT administration improved it. Although cerebral blood flow was not measured in this study, NYT administration suppressed the decrease in blood NO level induced by powder feeding. Thus, it was suggested that NYT contribute to memory improvement by increasing cerebral blood flow through the enhancement of NO production. NYT consists of 12 crude drugs (Table 1).

biomedres-openaccess-journal-bjstr

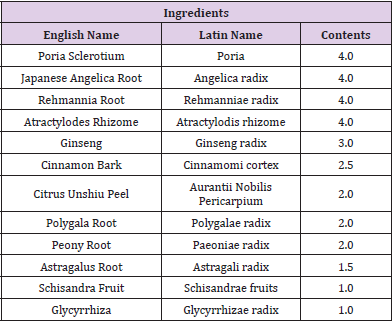
Table 1: Composition (daily dosea) of Ninjin’yoeito Formulations.

Note: aApproximate 6700 mg of dried water extract of NYT was prepared in GMP-standardized factory of Kracie Pharma, Ltd. (Japan) on the basis of above described composition.

Ginsenoside Rb1, which is contained in ginseng, was reported to increase the NO level [13]. In addition, a study indicated that cinnamaldehyde contained in Cinnamon Twig and paeoniflorin contained in Peony Root exhibited NO- or inducible NO synthase (iNOS)-mediated anti-inflammatory or vasodilative actions [14]. Several studies reported the assessment of memory using the passive avoidance test in powder-fed mice [8,15]. Fukushima-Nakayama et al indicated that powder feeding reduced memory in mice and confirmed a reduction in the hippocampal BDNF level as a part of the action mechanism [15]. It was also reported that reductions in the hippocampal nerve activity, neuron count, acetylcholine level [16], and neuron density [17] involved in powder-feedinginduced memory impairment. Furthermore, in addition to the hippocampus, powder-feeding-related decreases in the cerebral cortex levels of BDNF [18], dopamine, and acetylcholine [19] were indicated. However, in this study, there were no significant changes in the mouse hippocampal BDNF level (data not shown). In the future, changes in the above neurotransmitters should be examined using the hippocampus and cerebral cortex to clarify the action mechanism of NYT.

Powder feeding increased food/water intake in comparison with solid feeding. With this, weight gain was noted. Several studies indicated that powder feeding slightly increased the body weight [20,21], and it suggests that the satiety center is not stimulated through a decrease in the opportunity of mastication, leading to weight gain in some cases. Mastication promotes saliva secretion, assisting digestion/absorption [2]. However, powder feeding decreased the fat volume, although there were no changes in the gastrocnemius or soleus muscle weights (data not shown), suggesting some change in nutrient absorption in mice. The blood albumin level, which reflects the nutritional status, significantly decreased through powder feeding in comparison with solid feeding, suggesting that intestinal nutrient absorption is reduced in the absence of mastication. Furthermore, the maintenance of plasma colloid osmotic pressure is known as the function of albumin, and when the plasma albumin level decreases, a specific blood osmotic pressure is maintained.

Therefore, clinical symptoms, such as edema and ascites, occur through extravascular water leakage [22]. From these results, powder feeding may have affected intestinal nutrient absorption, reducing the blood albumin level, influencing water metabolism, and resulting in a heavy body weight despite a small fat volume, that is, swelling or a flabby body. NYT administration increased the blood albumin level, with a slight improvement in the fat volume. A study indicated that NYT improved the small intestinal morphology and intestinal absorption function in old mice [23]. In this study, neither the small intestinal morphology nor intestinal absorption function of mice after NYT ingestion was measured. However, the albumin-level- and fat-volume-improving effects of NYT may be associated with improvements in the small intestinal morphology and intestinal absorption function of mice.

Conclusion

This study showed that NYT inhibited a reduction in chewinglike movement and cognitive hypofunction in powder-fed mice.

For More Articles: Biomedical Journal Impact Factor: https://biomedres.us

Open Access Journals on Microbiology Research

Multiaxial Tensile Properties of Soft Biological Tissues

Short Communication

The results of virtual simulation of soft biological tissues often differ significantly from their real behaviour. Possible reason is that only data from unidirectional tensile test is considered. The aim is therefore to provide usable information on the mechanical behaviour of tissues under multiaxial loadings. The bulge test is the simplest way to realize biaxial tensile loadings on soft tissues. Several literature sources are critically examined and the known test specifications for the biaxial tensile test are significantly improved, see [1-5] among others. Our method supplies data for understanding human health and for reliable material modelling in adjustment of components for medical industries.

The implemented optical 3D measurement during the loading allows the precise capture of the mechanical response of the tissues until failure. The data from new test specification improves the material modelling thus providing the basis for an enhanced design quality in medical techniques and applications. The method was originally applied on elastomer sheets. In this way, parts for automobiles, components in aircraft construction or products for sports, medicine, and household can be designed more reliably and cost-effectively.

Mechanical Tests

Soft biological tissues obviously have some properties comparable to elastomers. The first standards on mechanical testing of elastomers date back to 1912 [6]. The state-of-theart recommendations are summarised in BS 903-5:2004 [7]. The characterization of elastomers occurs as experimental determination of the stress / strain relations. Often, only the measurements in tension are carried out according to ASTM D412 or DIN 53504:2017-03. Although the required material parameters can be determined from this test, the reliability of the material answer under multi-axial loadings is unsatisfactory.

For reliable material modelling, it is necessary to consider further measured data under shear and uniaxial compression.

Some testing standards for these tests like:

• Quadruple test according to ASTM D4014 and

• Compression test according to ASTM D395-18, D6049- 03, D6147-97, DIN ISO 815-1:2016, DIN ISO 7743:2016 are sometimes hard to apply to soft biological tissues. An alternative to the uniaxial compression test is the biaxial tensile test. Both tests describe the same deformation mode and, with the assumption of incompressibility, are convertible. The biaxial tensile loading on tissues can be implemented as bubble inflation test or bulge test. The disadvantage is that this test is not specified in any standard and provide results, which can often be arbitrarily interpreted. Large deviations in measurement series happen due to the different sample dimensions, ways of fixation, and test settings.

Bulge Test

The test setup consists of a base plate and a circular ring with an orifice (Figure 1). The tissue is clamped in the fixture and inflated with water, causing it to expand as a bubble. Stress singularities in the clamping area are reduced by a special design of the edges of the orifice. To ensure optimum fixation of the test specimen, the circular ring is centred and carefully bolted to the base plate. The protrusion of the specimen in the test area during clamping is minimised by design of the ring. A balanced biaxial stress occurs in the centre of the bubble during the loading (Figure 2). The ruler is used only for visual control of the height of the bubble. The evaluation of the geometry change in the bubble is performed in a subsequent post-processing step using the GOM Aramis 3D software. Alternative fluids like physiological saline solution can be used as a pressure medium. The tests can be performed according to customer specifications or our standard.

biomedres-openaccess-journal-bjstr

Figure 1: Inflated test specimen without black & white pattern, applying the orifice of the Ø50 mm diameter. Photo: Fraunhofer LBF.

biomedres-openaccess-journal-bjstr

Figure 2: Inflated test specimen without black & white pattern close to failure. Stress whitening can be observed. Photo: Fraunhofer LBF.

Specimen

Optimal results are obtained for specimens with an external diameter until Ø110 mm. The thickness of the materials is measured before the test at three positions. This measurement is based on a method developed at the Fraunhofer LBF, which avoids the induction of stress concentrations in the specimen. The specimen is speckled with a statistically distributed black & white pattern and then tested directly to ensure optimum adhesion between the specimen and pattern (Figure 3). This allows the evaluation of two- dimensional strains on the specimen surface by digital image correlation as function of pressure. To obtain data on possible anisotropy of the tissue, all specimens are mounted in the test fixture in the same position, considering their orientation when taken out. The setup allows the sample to be placed on the base plate without air bubbles, ensuring that the incompressibility assumption for the pressurized media is met.

biomedres-openaccess-journal-bjstr

Figure 3: Inflated test specimen with black & white pattern. A spot of Ø16 mm without pattern is left unpainted in the fourth quadrant of the specimen to study possible stress whitening during the loading. Photo: Fraunhofer LBF.

Evaluation of Three-Dimensional Deformation by Digital Image Correlation

The test results can be evaluated up to an approximate height of the bubble of 45 mm. Here, the maximum height is set by varying the diameter of the circular orifice. The inner diameter of the circular orifice of Ø40 to 50 mm is recommended for a test specimen (e.g., pleura or peritoneum) to obtain useful results in the evaluation. For thin tissues such as foetus vesicae, the diameter is reduced to Ø30 mm. An elliptical orifice can also be used to obtain additional stress states in the bubble for more in-depth material analysis.

Design engineers may be provided with the following data (Figure 4):

1. Time,

2. Pressure,

3. Height and curvature of bubble,

4. Principal strain,

5. Max. strain in x and y direction, and

6. Max. VON MISES equivalent strain.

biomedres-openaccess-journal-bjstr

Figure 4: Results of the evaluation of the bulge test: logarithmic strain s𝑦𝑦 at maximum load. Photo: Fraunhofer LBF.

All experimental data are available as ASCII, .jpg, and .mov files.

Modelling

Soft biological tissues are often modeled as a perfect hyperelastic material. For 3D description, the existence of the strain-energy function W is assumed: the stress response can be determined from the applied deformations alone [5].

with 𝜆i – principal stretches and 𝜎i – principal stresses related to the undeformed condition.

The W-function is unknown. Different approaches are compared in [1,8-12] among others. The polynomial RIVLIN equation for hyperelastic material behaviour, postulated without material structure considerations

contains some known W-functions. It is formulated as function of the irreducible invariants of the left CAUCHY-GREEN stretch tensor.

This RIVLIN equation can be reformulated as function of the trace 𝐼1 and residual invariants 𝐼′2 and 𝐼′3 with subtracted influence of the axiator by analogy with the axiatoric-deviatoric invariants of the stress or strain tensor [13,14]

to exclude the superposition effects in the fitting of measured data.

The first order approximation provides the neo-HOOKE model W(𝐼1) = 𝑅100 (𝐼1 − 3). The truncated series of the second order

includes the MOONEY-RIVLIN model, cf. SATO [14, 15]. The third order approximation W(𝐼1, 𝐼2 ′ , 𝐼′ 3) for compressible materials

With this method, the impact of each term in the modified equation is easy to assess. For the FEM application, the parameters are converted back into the parameters of the original RIVLIN equation which allows the use of standard implemented routines.

Conclusion

Multiaxial test data are required for reliable material description. In addition to the uniaxial tensile test, the data from the planar tensile test and bulge test should be considered. In this paper, we discuss the valid test specification for the biaxial tensile test on soft biological tissues. The setup dimensions can be easily adapted to the properties of the specimen. The approximations are visualized in 𝜆 − 𝜎, the MOONEY plot, and further diagrams. Clearly better quality of the modelling is achieved. Our tests have gained acceptance in industry and research [15-17]. The scientists analyse the individual challenges of modelling elastomeric materials and provide expertise at all levels of the design process [18,19].

For More Articles: Biomedical Journal Impact Factor: https://biomedres.us

Journals on Biomedical Research

Study on Compound Animal Feed Demand and Animal Products, Supply, Price and Marketing in Ethiopia

Introduction

In developing economies, the livestock sector is evolving in response to rapidly increasing demand for livestock products due to the human population growth, higher prosperity and urbanization [1]. Animal feed and nutrition are the essential link in the livestock production chain that is between crop cultivation and animal protein production and processing. Surging demands and struggling supplies result in stressed surroundings in which animal feed operators and farmers need to balance their activities continuously, taking into account animal performance as well as customer, consumer and societal demands [2]. Earlier study FAO [3] indicated that producing the additional food needed to feed all people and livestock in 2050 will require a 9 percent expansion of arable land, a 14 percent increase in cropping intensity and a 77 percent increase in yields. Ethiopia is a country with largest livestock population in Africa and with a huge livestock genetic diversity.

However, due to various factors, the country is far beyond the utilization of these huge resources. In the second Growth and Transformation Plan (GTP) of 2015, Ethiopian government has identified livestock sector as a new source of economic growth. In order to achieve the GTP plan on livestock sectors, feed subsector is central for all livestock commodities and is a key pillar of livestock growth and transformation from various perspectives. From economic point of view, about 70 percent of the cost of animal production is feed and suggesting economic feasibility of animal agriculture is mainly a function of quantity and quality of nutrients and the science of feeding. Thus feed is a point of convergence and a critical commodity for which all livestock species compete and it is a major pillar towards ensuring economic, social and environmental goals of livestock production [4]. Historically, the development of feed processing plants in Ethiopia dates back to the beginning of modern livestock husbandry in the early 1950’s followed by establishment of feed processing enterprises during the socialist regime. As a follow up of the new economic policy since 1991, the feed processing enterprises operated by government were privatized and a number of feed processing plants of various capacities came into operation [5].

Availability, quality and escalation of price of commercially manufactured feeds have been reported to be a major problem affecting the feed and livestock industries involved and consumers. Commercially manufactured feeds are important input for marketoriented poultry, dairy and beef production system in Ethiopia accounting for about 70-80% of total cost of production. The share of commercial feed in the total supply of all feed sources in the country is increasing from time to time to satisfy the emerging sector of poultry, dairy and beef enterprises. From [6], data on supply, demand and price over the last five years indicates that there has been a steady increase of demand, price and supply shortage of this commercially processed feeds. This situation is feared to reach a crisis proportion unless there is an emergent response to this very important demand and supply gaps that lead to high price. This issue needs attention of policy makers, development agencies and the private sector concerned to draft short- and long-term intervention plans to minimize the effects on the general economy, consumers and private sector to survive in the face of this harsh marketing realities.

Statement of the Problem

In the recent years supply and price situation of feeds and feed ingredients have shown a steady decrease and increase respectively but the dimension of this general trend was highly aggravated in the last one or two years probably due to current development related to the general inflation of food commodities in the country negatively affecting the feed and animal production sub-sector as well [4]. Commercial feed processors and modern poultry, dairy and beef farms which are seriously confronted by this supply and escalation of price are voicing their concern requesting the responsible government bodies to intervene to solve this issue through forming positive environment that encourages both private sectors involved in feed manufacturing and modern animal production.Therefore the ministry of trade and industry precedes initiative to handle the issue and establish study team from different institutions to assess the cause of the problems mentioned above and propose policy recommendation.

Scope of the study

The scope of the study is focused on commercial feed processors, price and marketing situations in market-oriented poultry, dairy and beef farms. Hence, this study was initiated with the following objectives:

General Objectives

Assessing the current compound feed and livestock product supply, price and market related constraints.

Specific objectives of the study are:

a) Studying the current status and dimension of compound feed demand, supply, price and marketing constraints

b) Indicating the major factors or reasons contributed to the development compound feed related problems particularly for the past five years

c) Identify possible strategic directions for the commercial feed sub-sector and livestock product processing industries

Methodology

The study was undertaken from March-July 2021. In this study data were collected from different private and farmers Union animal feed processors, suppliers, flour and oil industries, associations. Besides, data were collected from livestock farms like poultry, dairy, beef and others.

The methodology employed during the course of the study is indicated as follows:

a) Basic information was collected by using check list

b) Informant discussions were used to understand details of particular issues regarding key challenges and strategic directions of feed processing plants

c) Desk reviews were made from print media including published and unpublished materials, websites and others

Data Source

Primary and secondary data were collected from feed processors, poultry, dairy and beef farms, Government organizations, different associations, previous studies, different reports, prospective plans.

Data Type Used for the Study

Data were collected on production, consumption, market supply of compound feed of the year 2016/17-2020. Compound feed price, livestock product price data for the past five years were collected. Current data on direct employees at on farm, feed industry and livestock product processing industries were included.

Statistical Analysis

A Generalized linear model (Proc GLM) procedure of SAS (SAS, 2008) was used for the analysis of cereals and oil crops production and utilization from 2016-2020. The effects of year and crop type were included in the model. Then the analyzed data were organized using descriptive and inferential statistics. When there was significant difference of dependent variables among independent variables mean, comparison was undertaken using Tukey-test at P value of 95%. The model was:

Result and Discussion

Feed Ingredients Demand and Supply Dynamics

The major ingredients used to formulate compound feed include maize, sorghum, flour processing by-products (wheat bran, wheat short, rice bran), different kind of oil seed cakes (soyabean meal, Nuog seed cake, linseed cake, groundnut cake, cotton seed cake, sesame seed cake, and others), molasses, and ingredients that are added in tiny quantities to boost production (vitamins, minerals, amino acids and premixes). A list of the ingredients demanded by feed industry in 2020/21 is presented in (Table 1). As indicated the highest amount of ingredient required by feed industries is wheat followed by maize and soyabean. This is because compound feed for ruminant required more volume of maize and wheat by products (wheat bran and wheat middling) and soyabean is mainly required for poultry. Generally, demands for feed ingredients by feed processing industries were increased from 120,897 to 574,734 tons between the study periods. However, the supply of feed ingredients for feed industries was only around 50% (Table 2) and (Figure1).

biomedres-openaccess-journal-bjstr

Table 1: Feed processing ingredient quantity demand by types in 2020/2021 EC.

Note: Source: Calculated from design capacity of feed companies.

biomedres-openaccess-journal-bjstr

Table 2: Total feed ingredient demand, supplied and deficit quantity.

Note: Source: calculated from the Feed company design capacity.

biomedres-openaccess-journal-bjstr

Figure 1: Total feed ingredient demand, supply and deficit.

As Figure 2 shows demand of feed industries was increased at a faster rate than supply in the study periods. With this deficit, the feed industries had performed below their capacity. The deficit in feed industries is related with low market supply of wheat for flour industries to produce wheat bran and wheat middling, absence of the produced maize for the industries and the lower local market supply of oil seeds. This shows that as livestock sectors intensifies protein meal and cereal use would expand. This expansion should be supported by increasing oil seeds and cereal production and supply to the market. However, as observed in Table 1 market supply (sale to the market) for oil seeds and cereals were lower than the demand. The study [3], indicated that as livestock production intensifies in the coming years, protein meal use expands across most of SSA, with the fastest growth recorded in Western Africa (43%) and Eastern Africa (32%). This implies that the demand for oil seed and oil seed cake would be increased and it could be a good opportunity to produce more oil seed to utilize locally and to export.

biomedres-openaccess-journal-bjstr

Figure 2: Animal feed price increment index.

The production of cereal grain crops in Ethiopia is destined for human consumption. Consequently, only the milling by-products such as maize bran and wheat bran are available for livestock feed production. Maize bran and wheat bran are the most commonly used cereals. The most widely available oilseed cakes are Noug and sunflower. All the feed premixes are imported. The raw materials available to the animal feed industry are generally those that are produced within the country. These include oilseeds (soya, cotton and sunflower seeds maize, maize bran, wheat bran, soya cake and cotton cake.). The livestock industry is a driving demand for animal feeds especially for poultry, and poultry feed accounts over 60- 96% of the compound feed. The high demand for poultry feed is driven by increasing demand for poultry products especially due to population increase that is becoming urbanized, and higher levels of disposable income.

The highest demand for livestock products would appear that growth in the animal feeds industry will be driven by growing demand for livestock products. However, this growth has been slow owing to limited production of the major ingredients. The projected increase in demand for animal feed will put pressure on the availability of raw materials. It follows then that to meet this demand, there needs to be a corresponding increase in production of raw materials such as maize, wheat and oil seeds and as a result their by-products would be available for feed processing industries.

Compound Feed Demand by Species

The demand for animal feed is a function of livestock population, price of feed, price of substitutes, and other exogenous factors. From the data generated in 2020/21 from 60 (sixty) feed industries found throughout the country dairy, beef and poultry demanded higher volume of compound feed in their order of importance (Tables 3 & 4 and Figure 3). However, only 6.3, 2.6 and 68.7% of the compound feed were supplied for dairy, beef and poultry farms respectively. The highest gap between supply and demand was recorded for dairy feed followed by beef and poultry farms. The higher gap for ruminant is due to scarcity of wheat and non-appearance of maize in the market. Generally, the gap in supply and demand implies scarcity of cereals and oil seeds in the market, inaccessibility of some cereal (maize) in the market and as a result rising of prices and affordability of compound feed to the livestock farms. From production point of view, animal production is essentially a conversion of feed into animal product which dictates the level of production and product quality and safety. From economic point of view about 70 percent of the cost of animal production is feed and suggesting economic feasibility of animal agriculture is mainly a function of feed. The demand for animal feeds is derived from the demand for animal source food. The general trend in this regards is that demand rises in animal source food is in response to urbanization, increasing in population (3%) annually, increases in income at disposal, GDP growing at 7-8%, and preferences to ASF [7].

biomedres-openaccess-journal-bjstr

Figure 3: Total feed ingredient demand, supplied and deficit quantity for the year 2020/2021.

biomedres-openaccess-journal-bjstr

Table 3: Feed demand and supply for the years 2020/21.

Note: Source: Calculated from number of animals need this feed.

biomedres-openaccess-journal-bjstr

Table 4: Employment created by feed industries and commercial farms.

These demands justify the demand for compound feed is associated with intensification of livestock production to meet the growing demand. The demand for livestock commodities in Ethiopia is rapidly growing. Compared to the production base year of 2014/15 with estimated 167million liters of milk, 1.3 million tons of red meat and 419 million eggs, the projected demand is expected to be 1490 million liters of milk, 1.9 million tons of red meat and 3.9 billion eggs by 2020 [3]. There is a policy push to improve the current per capita consumption of livestock products in Ethiopia. However, currently one of the lowest in the World (9 kg meat, 56.2 liters milk, 4 eggs; [3] which is urgently calling for production increment and productivity improvement. Projected increment in the demand and production of beef, poultry, and others lead to substantially higher demand for compound feed. Under the baseline, the combined demand for cereals and oilseeds used as livestock feeds increases from 304,300 MT in 2010 to 608,900 MT in 2030 and 1,085,100 MT in 2050.

For this increment population growth, urbanization and income growth are important factors. These projections of feed demand quantities reflect impacts of both future economic and climatic change and are more variable in 2050 than in 2030. (FAO, 2019).

Feed and Feed Ingredient Price

Compound feeds are the sole diet for semi-intensive and intensive poultry and commonly used by dairy and fattening farms. The supply of these feed ingredients is challenged by low production of feed ingredients, rising prices and quality. Consequently, affect the access and affordability of processed feeds to livestock producers. Feed prices are determined mainly by the supply of feed, the number of animal units to be fed, and the level of livestock product prices. In recent years there are several reports from feed processors, policy makers and farmers on the rise of feed price. According to producers’ associations this situation is leading to the closing of some commercial farms both dairy and beef producers, due to low return on investment. This is supported by Joe (2008) stated that when grain prices spike can be more production of red meat and poultry, as herd sizes are reduced and/or as more animals and milk are sold to maintain cash flow to cover higher prices. This can depress farm (and wholesale) prices at least temporarily, further exacerbating the cost-price squeeze.

If current market conditions persist, meat supplies will decline and prices rise through producer attrition and reduced capacity. According to Figure 3, price of feed ingredient has shown continues increment over the past five years from 2016/17 to 2020/21. Comparing the increment growth between the base year 2016/17 and 2020/21 has shown 303.8, 244, 416, 443.5, 627.3, 112.5 and 211% for wheat bran, wheat middling, noug, groundnut, soya, linseed cake and maize respectively. The highest price increment was observed in soya bean followed by ground nut and noug seed cake. Similarly, compound feed price for different species was increased by 85.5,80, 89.6, 110.8, 239.4 and 148.8% for layer, broiler, chicken, dairy, beef and others respectively (Figure 4). The highest average price growth rate of compound feed for five years was observed in beef and dairy farms which are negatively related with the highest gap for demand and supply of compound feed for dairy and beef farms.

biomedres-openaccess-journal-bjstr

Figure 4: Feed ingredients price (9ETB/quintals).

biomedres-openaccess-journal-bjstr

Figure 5: Animal feed price (ETB/quintals).

This implies that feed supply and feed prices are negatively correlated. The lower production of cereals and oil seeds in 2019 production years have brought the maximum inflation rate in 2020 on different feed ingredients and compound feed of different species. This price surge of animal feed is induced by significant rises in the price of feed ingredients due to supply shortage and other factors. From the point of view of the supply of compound feeds, the principal cost is that of raw materials, which amount as much as 80% of operating costs and additionally there is high transport costs. According to a study by MOA and ATA 2021 the other reasons for the high prices of feed ingredients and feeds are VAT and other taxes imposed on the feed ingredients. Multiple taxations due to unnecessary long supply chain could add the VAT imposed on feed ingredients up to 60% or more (Figure 5). The involvements of brokers along the marketing chain lead to multiple taxation and elevate the price of ingredients and compound feed.

Animal Feed Ingredients and Compound Feed Inflation Rate (Price Index) for Different Species

As observed in Figure 6 the highest inflation rate (price index) for compound feed was observed in the year 2020/2021 as compared with the previous year on shoat farms followed by beef and dairy farms with the value of 55, 48 and 45% respectively. Lower price index with one digit was observed in 2017/18 production year which result from high production of oil seeds and cereals in the previous year. With regard to feed ingredients of soya bean, inflation rate (price index) was higher (>50%) than all in 2020/21 followed by ground nut, noug cake and wheat products (Figure 7). As [6-10] indicated, the country level food inflation rate was 24.1 percent in July 2021 as compared to the previous year. This shows the animal feeds inflation rate (45-55%) was much higher than food inflation rate on the same year in Ethiopia. This implies the abnormal inflation of animal feed which may be due to less production and scarcity in the market of oil seed and cereals. In addition there are many factors including illegal marketing in long value chain and artificial/ manmade.

biomedres-openaccess-journal-bjstr

Figure 6: Feed ingredient price increment index.

biomedres-openaccess-journal-bjstr

Figure 7: Average animal product price.

Price Increment Trend of Animal Source Food

As Figure 8 indicate the price of milk, beef, egg and poultry meat has raised at least three folds in the past four years with highest increment in 2020. Feed is the largest single cost item for livestock production, accounting for 70%– 80% of the total cost although energy, labor, and other inputs have increased in the last 5 years. As Figure 9 indicated, inflation rate between 2020 and 2021 for egg, milk, beef and chicken meat were 46, 37, 35.5 and 55.8% respectively. As price takers in competitive markets, animal producers cannot simply pass their higher costs on to consumers. To date, rising costs have largely been absorbed by livestock and poultry producers, often with significant financial loss. However, higher costs of production will ultimately reflected in higher prices for meat, milk, and eggs at retail counters. This apparently reduces the affordability of livestock products by consumers and will reduce purchasing power of consumers.

biomedres-openaccess-journal-bjstr

Figure 8: Animal product price increment index (%).

biomedres-openaccess-journal-bjstr

Figure 9: Industry product is plagued by inefficient linkage between actors leading to decrease production quantity, multiple taxes and higher price.

This in turn reduces the demand of livestock product by the consumers and livestock producers reduce their supply and would go to bankruptcy or financial loss. This will also affect the current per capita consumption of livestock products in Ethiopia, which is one of the lowest in the World (9 kg meat, 56.2 liters milk, 4 eggs; [3]. In contrary to the current higher inflation rate on beef meat in Ethiopia which would reduce beef consumption and production, the study [2] described that beef consumption growth is strong across the region (SSA), expanding by 2.6% to 2025. Growth is particularly strong in Eastern and Western Africa, where rates exceed 4%. Within these regions, consumption growth is mainly driven by Kenya, Tanzania, Ethiopia, Zambia and Nigeria, all of which increase consumption by an annual average of at least 3%. The same study continued that notwithstanding the small base, the projected expansion of 35% in total meat consumption by 2025 outpaces any other region in the world.

Underpinned by rising incomes, urbanization and sustained population growth, robust consumption growth is projected across most of SSA, with an expansion of more than 38% evident in Central, Western and Eastern Africa. Egg consumption provides an important alternative that reflects consumption growth of 36% over the ten year period. Consumption growth is also robust across the region and exceeds 50% in Eastern Africa. This all shows the high demand of animal products in Africa which provide high local and export market for Ethiopia. Livestock improve food and nutrition security as ASF are rich in major and micro-nutrients. ASF are a major source of iron, zinc, calcium, riboflavin, vitamin A, vitamin B-12, and retinol, which have numerous benefits including linear growth, cognitive development and general health, leading to long term improvements in income and productivity.

Milk in particular contains several critical micronutrients such as calcium, vitamin A, riboflavin and vitamin B12 that are essential for growth and development of children older than 12 months. Children, pregnant and lactating mothers should be receiving ASF, whose consumption currently is quite low. However, to assure that this increased local demand can be met by local supply and not by imports, more attention will need to be paid to feed price and the facilitation of an enabling environment that will allow for efficient livestock feed industry.

The Status of Compound Feed Industry

Over the past decade, the use of compound feed and feed supplements has increased. In the year 2020/21the livestock feed industry required 1,944,490tons of compound feed. Unfortunately, despite adequate installed production capacity, only 292,761.90tons of feed were produced. The shortfall in production was attributed to an inadequate supply of raw materials. A total of about 32 privately owned and 28 cooperatives feed processing plants are currently operational in Ethiopia. The feed processing plants owned by private companies and cooperatives engaged in production of compound feed. In terms of facilities, all the privately owned feed processing plants have feed mill, mixer and storage places for ingredients and for processed feeds. Only few plants mill limestone and make multi-nutrient blocks.

Pellet maker is limited to two feed processing plants, liquid mixer exists only in one feed processing plant and no feed processing plant has a laboratory for analysis of ingredients and feeds. Most feed processing plants are currently operating below their installed capacity mainly due to low demand for the product, shortage of ingredients supply and inconsistent supply of electricity. Average operational capacity of feed processing plants at farmers’ unions level is 2.0 tones per hour [5]. In terms of operational capacity as percentage of installed capacity for the feed mixer, farmers’ unions are currently operating at an average processing capacity of 66 percent. Traditionally the feed industry has been linked to the supply of the raw materials, as these were generally the by-products of other processes and of low value relative to the main product. However, market orientation mainly as a result of advances in nutritional science the value has improved to great degree. At the same time nutritional knowledge has become more widespread, so that the demand for byproducts has increased and their prices have risen, thereby reducing the advantages of supply orientation. At the same time, since the distribution system is often poor, and since feeds are usually made for particular markets, sales advantages are likely to be gained from market proximity.

Employment and Socio-Economic Importance

The feed manufacturing industry also plays an important role in the socio-economic development in the country, making important contributions to employment, income generation, and to linkages within the value chain. Furthermore, an efficient animal feed industry, producing affordable feed of high quality, can help and ensure that smallholder livestock keepers are not excluded from the market opportunities presented by the socio-economic transformation taking place.

Marketing of Compund Feed

Even though Agro-industrial factories (flour mills, oil mills) are VAT registered, they sell their products to middlemen, and the brokers without a receipt. This make that the market is engulfed in illegal trade and leading to widespread shortages and inflation. On the other hand, the lack of market linkages and the lack of chain of command have created favorable conditions for brokers and traders. Several government institutions are actors in supporting the feed industry development; however, there are weak interests to collaborate and coordination efforts. It is common practice of making decisions on feed industries without taking situation of the food processing industries into account. The lack of a formal marketing system for the by-products of the flour and oil mills used by the feed industry and the lack of a single institution around the market is creating a serious problem for the feed and fodder inputs and creating favorable conditions for brokers and greedy traders to lower their prices.

Conclusion

The highest gap between demand and supply was recorded for dairy compound feed followed by beef and poultry. Inflation rate of feed ingredients and livestock products (the product of feed ingredients) were higher as compared to inflation rate of food items. Feed prices are determined mainly by the supply of feed, the number of animal units to be fed, and the level of livestock product prices. Main reasons for the high prices of feed ingredients and processed feeds are VAT and other taxes imposed on the feed ingredients, export of feed ingredients, oil seeds and oil factory by products. Multiple taxes due to unnecessary long supply chain adds the VAT imposed on feed ingredients up to 60% or more.

For More Articles: Biomedical Journal Impact Factor: https://biomedres.us

Journals on Biomedical Journal Articles

Bio Actives from Albizia Lebbeck on Acute Lung Injury/ Acute Respiratory Distress Syndrome Molecular Targets: In-Silico Study

Introduction

A precipitating cause, such as pneumonia, shock, aspiration of stomach contents, sepsis, or trauma, is invariably present in Acute Respiratory Distress Syndrome (ARDS). Because of comorbidities such as sepsis, multiorgan failure, refractory shock, and refractory hypoxemia, patients with ARDS have a significant death rate (50 percent) [1]. Chronic unfavorable outcomes such as fibrosis, tracheal stenosis, pulmonary function decrease, muscle weakness, ambulatory dysfunction, and overall poor quality of life were common among ARDS survivors [2]. Acute inflammation, micro vascular damage, and increased lung vascular and epithelial permeability are all characteristics of ARDS [3]. The immune system is a key player in the etiology of ARDS, according to current knowledge [4]. The severity of lung injury in ARDS patients was linked to serum cytokine and chemokine levels [5]. Infected epithelial cells release cytokines, which attract leukocytes, macrophages, and nearby endothelial cells, causing an increase in cytokine and chemokine production and the symptom known as cytokine storm [6]. Despite significant advances in understanding the etiology of ARDS, little progress has been achieved in developing particular medicines to address the inflammatory damage that occurs in the disease. As a result, medications to treat ARDS, particularly the inflammatory damage associated with the disease, are desperately needed.

Nuclear factor-kappa B (NF-B), a transcription factor, was called after its ability to bind to the enhancer element of the immunoglobulin kappa light-chain of B cells [7]. It is an important inflammatory inducible factor that regulates the transcription of a number of pro inflammatory cytokines, chemokines, and adhesion molecules to mediate the inflammatory response. Punicalagin, for example, inhibits Lipopolysaccharide (LPS)- induced neuroinflammation, oxidative stress, and memory loss by blocking NF-kB activation [8]. Furthermore, when the NF-B signaling pathway is engaged, secreted inflammatory cytokines and chemokines such as IL-1, IL-6, and TNF-α have been shown to have important effects on the course of ALI. Another study confirms that NF-B activation can speed up the transcription of IL-1, IL-6, and TNF-α [5]. TLR-4 plays a role in a variety of inflammatory diseases, including ischemic heart disease and Ventilator-Associated Pneumonia (VAP) [9]. Alveolar epithelial cells are divided into two types: Alveolar Type I (ATI) and Alveolar Type II (ATI) (ATII). AT1 cells are common in the body and can be readily harmed. When type I cells are damaged, fluid leaks into the alveoli, disrupting regular alveolar clearance. Surfactant secretion is controlled by ATII cells, which is an important role in lowering alveolar tension. In addition, ATII cells have a role in ion transport. Although ATII cells are few in number, they are more resistant to injury [10,11].

A combination of alveolar epithelial cells and capillary vascular cells may be involved in the condition. Endothelial injury, on the other hand, is more common. There is a leakage of fluids and proteins into the interstitium in ARDS due to increased permeability of the capillaries. Fluids, red blood cells, and neutrophils enter the alveolar space through the injured epithelial cells after that. In the exudative phase of ARDS, interstitial and alveolar edema are common [12]. TLR4 is found on both alveolar macrophages and epithelial cells in the lungs. TLR4 detects key ligands like as hyaluronic, LPS, heat shock proteins, and the High Mobility Group Box-1 (HMGB) protein during ARDS propagation [13]. TLR4 activation causes the generation of pro-inflammatory cytokines, which can increase the severity of injuries, as previously stated. Many studies have been conducted in recent years to determine TLR4’s exact role in ARDS. The TLR4/Nuclear Factor (NF)-B pathway could be a key target for inflammatory damage. TLR4 is a pattern recognition receptor from the TLR protein family that activates NF-B and causes the production of inflammatory cytokines and chemokines including TNF- and IL-6 in lung cells.

Medicinal plants can be used in this direction as they come with minimum and in some cases no toxicity as well as strengthen immune system via various pathways. Abizia lebbeck, a native tree to Asian and subtropical regions across the world, is a perennial, deciduous tree which is used as a shelter tree for cash crops, for erosion control, as a forage crop and as a source of hardwood [14]. In Ayurveda it is used for various medicinal purposes as it is a non-toxic tree. This tree contains alkaloids, tannins, saponins and flavonoids which have medicinal action and it is used especially in treating bites and stings from poisonous animals such as snake. Pharmacologically A.lebbeck is used in treatment of various respiratory ailments including bronchial asthma (Tables 1 & 2). In the present study, phytoconstituents of A.lebbeck were analyzed using molecular docking software and the best docked compounds were further processed for drug-likeness and ADMET profile analysis using Lipinski Rule of Five and ADMET SAR studies.

biomedres-openaccess-journal-bjstr

Table 1.

biomedres-openaccess-journal-bjstr

Table 2.

Material and Methods

Preparation of Protein

RCSB Protein Data Bank (https://www.rcsb.org/) [15] was used to retrieve the crystal structure of TNF-alpha (PDB ID: 2AZ5), TLR4 (PDB ID: 3FXI), NfkB (PDB ID: 1NFK), IL-6(PDB ID: 1ALU). Protein preparation was done with the help of Discovery studio 4.0 by the removal of water molecule and other heteroatoms present in the crystal structure. Further, the active site identification was done for the prepared protein model with the help of Discovery studio 4.0.

Selection of Active Phytochemicals-Ligands

Total 59 active phytochemicals from medicinal plant Albizzia lebbeck were retrieved from literature and database. PubChem compound database (https://pubchem.ncbi.nlm.nih.gov/) was used for retrieval of structure in 2D SDF format. Ligand optimization, energy minimization and conversion of retrieved ligands to 3D PDB format were done with the help of Discovery Studio 4.0.

Molecular Docking

For molecular docking, YASARA software was used [16]. Using YASARA, selected 59 active phytochemicals of Albizzia lebbeck were docked with TNF-alpha (2AZ5), TLR4 (3FXI), NFkb (1NFKB), IL-6(1ALU). For docking study, prepared receptor and ligand files were used to set target and play macro in YASARA software. For the calculation of interaction energy between receptor and selected ligands individually, the macro file dockrun_mcr was used. Afterward, with the help of YASARA software, docked complexes visualize and changed in PDB files for 2D-3D interaction visualization study using Discovery studio 4.0. For the docking calculation study, the result log files from YASARA were taken. Sortening on the basis of binding energy [kcal/mol] and dissociation constant [pM], 25 VINA docking runs of the ligand object 2 to the receptor object 1 was done. The compound having more positive binding energies indicates stronger binding, and negative energies indicate no binding.

Drug-Likeness and Molecular Property Prediction- ADMET Analysis

The topmost selected active phytochemicals on the basis of binding energy [kcal/mol] and dissociation constant [pM], from Albizzia lebbeck were used for the drug likeness test with the help of Lipinski rule of five (http://www.scfbio-iitd.res.in/software/ drugdesign/lipinski.jsp) [17]. admetSAR server (An Inclusive server for Valuation of Chemical ADMET Properties; (http://lmmd. ecust.edu.cn/admetsar1/predict/) [18] was used for molecular property prediction (ADMET).

Result

Molecular Docking

Molecular docking study revealed that 19 out of 59 phytochemicals from A.lebbeck showed significant binding affinity with TLR-4, Nf-kB IL-6, TNF-alpha, of inflammatory cascade. Table 3 shows the list of phytochemicals showing significant binding energy (≥7.0 kcal/mol) with above mentioned targets (Figure 1).

biomedres-openaccess-journal-bjstr

Table 3: Binding energy (Kcal/mole) of selected phytoconstituents of A.lebbeck against proteins of ARDS. (Phytoconstituents with>7 Kcal/mole of binding energy are mentioned here.

biomedres-openaccess-journal-bjstr

Figure 1: Bio actives from Albizia lebbeck against molecular target of ALI/ARDS. This is a 2D interaction diagram of ligandreceptor binding interaction where light green bond shows van der waals interaction and dark green bond shows conventional hydrogen bond.

Drug-Likeness and ADMET Analysis

Drug-likeness test for best docked compounds was predicted using Lipinski’s filter and ADMET molecular property prediction test was performed out by admetSAR server. Lipinski rule of five is a thumb rule of five which helps in differentiating between drug like and non-drug like molecules by obeying its five parameters (Molecular mass, Hydrogen bond donor, Hydrogen bond acceptor, Log P, and Molar refractivity), it must obey 2 or more of their parameters. Consequently our best docked compounds (Table 4) follows more than 2 parameters of Lipinski rule of five. admetSAR server provides ADMET profiles of drug candidates. The molecular property profile results indicate positive sign towards Human Intestinal Absorption (HIA) and have no carcinogenic effects, indicating all drugs like properties (Table 4).

biomedres-openaccess-journal-bjstr

Table 4: Drug-likeness and ADMET profile of selected phytocnstituents of A.lebbeck.

Discussion

Since its original description 50 years ago, molecular aetiology and pathophysiology for the development of ALI/ARDS have become better understood. However, “lung-protective ventilation” in mechanically ventilated patients with ARDS is now the best practice, with no specific therapy aimed at lung inflammation. A complex network of proinflammatory signaling pathways and oxidative stress created by a range of cell types in the lungs initiate, amplify, and control the inflammatory response in patients with ARDS. Here in this work we have used in-silico study to screen out the bio actives from the Albizia lebbeck against molecular target of acute lung injury. A.lebbeck is an astringent that is used to cure boils, coughs, eye infections, flu, gingivitis, lung difficulties, chest problems, as a tonic, and to treat abdominal tumors in some cultures [19]. It is a medicinal plant as per Ayurveda the bark can be used to treat inflammations [20]. This formed the hypothesis of the present work as ALI is a clinical condition of respiratory distress involving deregulated inflammatory system. It begins with accumulation of fluid in the alveolar region due to infiltration of neutrophil. Neutrophils serve as the defense mechanism regulated by macrophage polarization [21] in normal condition. However under the influence of endotoxins the toll like receptors (TLR-4) are activated and they secretes chemokine to flush out the invading pathogens. In ALI/ARDS this mechanism goes out of control especially in cases of septicemia influenced ARDS and creates storm of inflammatory cytokines [22]. From the molecular docking study we found that phytoconstituents from A.lebbeck such as Globularicitrin (9.94 kcal) and Vicenin-2 (9.64 kcal) showed significant binding energy suggesting that they can down regulate TLR-4 receptors in ARDS condition and can save the patient from deleterious effects.

Another pathway involved in pathogenesis of ARDS in Nf-KB. In the lungs of patients with Acute Respiratory Distress Syndrome (ARDS), the nuclear regulatory factor NF-kappaB is activated, which may contribute to increased expression of immune-regulatory cytokines and other pro inflammatory mediators [23]. In our study we found that Terpenoids and Tannins have significant binding interaction with Nf-kB suggesting it could control the inflammatory cytokine storm. The major inflammatory cytokines responsible for destructive effect of ARDS are Il-6 and TNF-α [24]. From this insilico work we found that Friedelin (IL-6), Lupeol (IL-6), Albigenin (TNF-alpha) and Alpha Amyrin (TNF-alpha) were able to inhibit these cytokine by binding with them. All the reported bio actives (Figure 2) from A.lebbeck showed drug-like property as per LPINSKI RULE OF FIVE and were safe as per optimal scoring by ADMETSar software. Despite significant progress in delineating molecular pathways for ALI and ARDS over the previous several decades, these discoveries have not resulted in substantial advances in medical treatment for ARDS patients. From this in-silico work we are reporting for the first time that a medicinal plant from Indian traditional system could be utilized as add on therapy under clinical supervision for management of acute lung injury/acute respiratory distress syndrome.

For More Articles: Biomedical Journal Impact Factor: https://biomedres.us

Open Access Journals on Microbiology Research

The Two-Way Link Between Diabetes Mellitus and Periodontal Disease: Medical- Healthcare Professionals’ Clinical Practice

Introduction

Although the notion “Oral health and general health are inseparable” is most frequently and widely narrated in the scientific literature, it has not infiltrated well enough into the medical community. Quite understandably, since the beginning, there is a dental-medical divide that has not been closed, and it is not going to change anytime soon as these two disciplines are also structurally separated. Diabetes mellitus and periodontal disease are global epidemic ailment with severe health consequences. Medical professionals provide primary care to patients with diabetes mellitus for their general health needs. Periodontal disease, along with other complications, has been suggested as the sixth most common complication of diabetes mellitus [1,2]. Furthermore, recent evidence confirms the mutual and bidirectional relationship between periodontal disease and diabetes mellitus [3,4] which means that severe periodontal disease adversely influences the glycaemic control in persons living with diabetes and vice versa [5-7]. Hence, logically, persons living with diabetes require collaborative care by medical and dental professionals for their health needs [8,9]. However, worldwide, this is not actively practised or even considered in most of the instances [10].

The recent statistics on Australian healthcare workforce (2015) reports around 392 fulltime medical providers per 100,000 populations [11]. According to the current data from the Department of Health, Australia (2018), there are around 98,400 medical practitioners and 20,600 dental healthcare practitioners registered with AHPRA. This number is around 5.5 times more than oral health professionals, where only 72 oral healthcare professionals are available to look after 100,000 individuals [12]. Among them, nearly 85% of dentists work in the private sector. Australian Institute of Health and Welfare (AIHW) also reports that during 2016-17 approximately 70,200 patients were hospitalised due to dental complications that could have been avoided with timely treatment [13].

Inter-professional collaboration between medical and oral health professionals have been implicated in the effective prevention and management of diabetes-related complications. Such coordinated care is challenging as it is dependent on multiple providers across different disciplines. The critical aspect of this care is the allied knowledge of the disease (periodontal and diabetes) by the disciplines involved. This knowledge includes but not limited to the aetiology, pathogenesis, associated risk factors, and the management strategies of the particular disease. Recent evidence suggests that medical professionals, including general medical practitioners, specialists, nurses and allied healthcare workers, do not receive any training and knowledge in oral health, resulting in poor understanding of oral health problems [14].

A study reported developing an inter-professional learning tool for qualified pharmacists, nurses, healthcare assistants and junior doctors to improve care for the persons living with diabetes [15]. The study completely overlooked the importance of involving oral healthcare professionals to manage patients with diabetes mellitus. In contrast, Silk, [16] suggested that a comprehensive approach can achieve improved oral health outcomes. This holistic approach involves improving oral health literacy and practice in patients, learning new skills by medical and dental professionals and adopting a collaborative approach in patient management. In this regard, a recent systematic review noted that one-third of medical professionals were unaware of the relationship between oral health and diabetes. Only 30% reported referring their patients for an oral health assessment to dentists [17]. They also highlighted the importance of inter-professional education for medical and dental professionals. The literature regarding medical professionals’ knowledge, attitude, and practices of diabetes mellitus and periodontal disease from Australia is missing. Therefore, the study investigates medical professionals’ understanding of the link between periodontal disease and diabetes mellitus in a cohort of medical professionals practising in Australia.

Methodology

A convenience sample of medical professionals participated in this pilot study to complete an 31-item questionnaire. A power calculation was not necessary for this pilot study. An online survey was designed to investigate the knowledge and understanding of periodontal disease (gingivitis and periodontitis) and the link between periodontal disease and diabetes mellitus. The questionnaire was created with the help of a panel of experts that have experience in research methods to assess the relevancy, clarity, simplicity and necessity of the questions. The panel conducted the content validity of the survey questionnaire for appropriateness. The survey questions were finalised after completing the systematic review of the literature investigating the medical professional’s knowledge and understanding of the link. Five medical healthcare professionals also did the initial piloting of the questionnaire before disseminating the questionnaire. The ethical approval was obtained from the institutional Human Research Ethics Committee (HREC – CSU, approval # H16154). The survey invitation with the web link was available to the medical practitioners for a period of four months. Medical healthcare professionals were also contacted by the authors at their practices in a face to face meeting requesting to participate in the research. A reminder to complete the survey questionnaire was also circulated after one month. The questionnaire consisted of four categories (Table 1). Most items were in multiple-choice format, with options of “other” where the participants could elaborate further in text free fields if they deemed appropriate. Some questions also had the option of selecting multiple choices with the possibility of reporting others.

biomedres-openaccess-journal-bjstr

Table 1: Survey tool and the related theme.

Study Sample

The study’s inclusion criteria dictated that participants had to be a practising general and/or specialist medical practitioner registered with the Australian Health Practitioner Regulation Agency (AHPRA). The survey was anonymous, and the responses of the participants were not identifiable.

Data Analysis

The responses were collated electronically on Qualtrics and transferred onto an Excel® spread-sheet (Microsoft Corp., Redmond, Wash., USA) and analysed using a commercially available statistical software package (IBM SPSS® Statistics for Windows, Version 27.0. Armonk, NY: IBM Corp). The bivariate analyses using Fisher’s Exact and Chi-Square Test (in SPSS® 27) were utilised to analyse whether participants’ awareness regarding periodontal disease and the bidirectional association was associated with educational level and their clinical practice. A p-value of <.05 was considered to be statistically significant. The output of data was presented in a table format (total responses and percentage) and a graphical format.

Results

Category 1: Demographic and Diabetes Care Data

A total of 46 medical professionals completed the survey (response rate of 64%). Male to female ratio was 3:1, and their age ranged from 24-64. Over 82% of the participants reported providing services at the general medical practices, while 6.5% providing services at the hospitals and specialist practices.

Category 2: Data on the Discussion of Oral Health with the Patient Living with Diabetes and the Appropriate Referral to the Dentist

Just over 40% of the participants reported seeing 6-10 patients living with diabetes per week. This figure ranged to 8.70% (for more than 30 patients per week), 6.52% (26-30 patients/week), and 19.57% (for 16-20 patients per week) respectively. Concerning the oral health discussion with the patients living with diabetes, around 48% of participants occasionally discussed oral health during their consultation. While 37% of participants reported, some times and only 4.35% of participants reported always discussing oral health with their patients. On the other hand, around 9% of medical professionals never discuss oral health with their patients living with diabetes. When asked regarding the referral for the dental consultation, the response rate showed a similar trend, with only 15.2% always refer to a dental checkup, and 13% don’t refer their patients at all (Table 2). Similarly, only 15.22% of participants reported insisting their patients seek dental consultation. Just over 42% occasionally and 17.78% sometimes ask on their patients for a dental visit. Only 4.44% of participants always insist on their patients to see a dentist (Table 2).

biomedres-openaccess-journal-bjstr

Table 2: The frequency of patients living with diabetes with whom medical professionals discuss oral health and made the referral for a dental consultation.

Category 3: Data on the Fundamental Understanding of Periodontal Disease (Gingivitis and Periodontitis)

In the third category of survey questions, participants responded to some basic oral health/periodontology related questions. The questions were about understanding the periodontal disease, including gingivitis and periodontitis and the associated risk factors, for example, smoking). In response to the description of gingivitis, most of the participants (54.35%) opted inflammation in the marginal gum area that is reversible, while 26% selected gingivitis as an infection of the gums. In response to the first sign of gingivitis, bleeding gums was correctly indicated by 78.26% participants, while, around 21.74% attributed bad breath as the first sign of gingivitis. Just over 60% of the participants ticked smoking as a relevant factor in gingivitis and approximately 24% to glycaemic instability and 13% to diet high in carbohydrate. Around 2% of participants also attributed this to old age. When the distinction between gingivitis and periodontitis was asked, 56% of participants correctly selected bone destruction around teeth. At the same time, 26.67% still considered it as an inflammation in the marginal gum area that is reversible. Around 13% of participants thought periodontitis as the infection of the gums.

Category 4: Data on Overall Knowledge and Understanding of the Link between Periodontal Disease and Diabetes Mellitus

In the fourth category, the knowledge of the bidirectional association between periodontal disease and diabetes mellitus was evaluated. All participants agreed that people with diabetes are at increased risk of having severe periodontal disease. Majority of participants (89%) selected the option that poor/uncontrolled glycaemic control encourages the growth of oral bacteria. Similarly, 89% of participants agreed on the statement that the treatment of the periodontal disease could improve glycaemic management (Table 3). Only 16% of participants agree with the statement that the research is inconclusive regarding the bidirectional relationship between systemic health and periodontal health. On the other hand, only 28% strongly agreed that the association between periodontal health and diabetes is a reality, while, 31% of participants opted unsure for this statement. Regarding the question on the awareness of the recent literature on diabetes and periodontal relationship, only 34% of the participants chose to agree or strongly agree with the statement. In contrast, the rest (66%) selected unsure and disagree with the statement. Around 80% of the participants agreed/strongly agreed with the statement that patients with poor glycaemic control are more likely to have poor oral hygiene and periodontal disease. Majority of the participants (85%) agreed upon having a close collaboration with the dental practitioners to reduce their patient’s risk of developing periodontal disease, On the other hand, around 14% participants were still unsure about it (Table 4).

Around 80% of participants showed an interest in more education regarding patients’ periodontal health with diabetes. In response to the question regarding conducting oral health examination of their patients, almost 40% of the participants disagree with the statement. Only 42% were confident in doing oral health examination of their patients (2.63% strongly agree, and 39.47% agree). Around 40% of the participants were of the view that homecare measures could manage severe gum diseases. On the other hand, 32.5% of the participants were uncertain to answer this question. Just over 75% of the participants showed interest in including an oral health component in diabetes continuing education, while 25% opted unsure to answer this question. Missing values at random were below 2% hence were ignored.

biomedres-openaccess-journal-bjstr

Table 3: Response to question related to periodontal and diabetes link.

biomedres-openaccess-journal-bjstr

Table 4: Response to questions concerning oral health and its impact on patient’s health and its related evidence.

Discussion

The results of the pilot study demonstrate higher understanding and awareness of the bidirectional relationship between diabetes mellitus and periodontal disease among this cohort of medical professionals. Majority of the medical practitioners (89%) knew that by providing periodontal therapy, the glycaemic index of patients living with diabetes (having the periodontal disease) could be improved. Similarly, a higher number of participants (93%) agreed with the statement that “Good oral health is vital to the overall wellbeing of the patient”. However, when asked regarding the recent literature on the bidirectional relationship between systemic health and periodontal health, only 40% responded correctly. Around 25% of the participants acknowledged that they are unaware of the recent literature regarding diabetes and periodontal health.

A range of outcomes has been reported by other studies that have investigated the knowledge and awareness of medical professionals regarding the bidirectional association between periodontal health and diabetes mellitus. Owens and colleagues [18] noted around 66% of endocrinologists agreed with the statement that the treatment of the periodontal disease might improve glycaemic control. Similarly, almost 74% of the medical professionals agreed with the above statement in the study by Bahammam [19]. In the present study, a higher number of medical professionals (89%) responded positively to this statement.

These outcomes demonstrate a gap between awareness/ knowledge and evidence-based clinical practice. Medical professionals are aware of the association between periodontal disease and systemic health, but they are not convinced. This lack of confidence is mainly due to the absence of appraisal of the topic’s pertinent literature. This is evident by the fact that majority (82%) of the medical professionals showed interest in more education regarding periodontal health of patients with diabetes and around 75% of participants agreed on including an oral health component in diabetes continuing education. Similar findings have been reported by other studies like Obulareddy, et al. [20] (90%) and Owens, et al. [18] (88%) that have shown interest of medical professionals in oral health education and training. This lack of confidence is prominently reflected in their clinical practice as most medical professionals don’t discuss oral health with their patients on regular bases, nor do they refer their patients for the oral health/ dental assessment.

The study noted that a small percentage (15.2%) of medical professionals always refer patients with diabetes for a dental consultation. Gholami, et al. [21], on the other hand, reported a higher percentage of medical practitioners (95.8%) who refer patients with diabetes mellitus to the dentists for a consultation. A higher (100%) frequency of medical professionals that provide advice to their patients was noted in a recent report by Bahammam [19]. However, when the same cohort was asked about periodontal health information, only 56.5% deliver such information to their patients. Similarly, Owens, et al. [18] reported around 48.72% endocrinologists and 25% internists to refer their patients for dental consultation [18].

The results of the present study endorse the outcomes of the survey by Al-Habashneh, et al. [22] as they also reported the mismatch between the awareness of the bidirectional link and the clinical practice in their cohort of 164 medical professionals. However, the referral to the dentist was not found related to the knowledge or speciality status of the medical professionals in the present study as was found (direct relationship) in the survey by Al-Habashneh, et al. [22] They reported that specialists instruct and refer their patients living with diabetes more frequently to dentists compared with the general practitioners Lin, et al. [23] reported similar outcomes as around 77% endocrinologists reported in their study often referring their patients for a dental checkup.

Several studies have investigated medical professionals’ knowledge of oral/periodontal health. The present study found a moderate level of understanding and awareness of the periodontal disease among medical professionals. In this regard, 78.26% of participants knew the signs of gingivitis, while only 56% of the medical professionals were aware that periodontitis involves the destruction of the alveolar bone around the teeth. Al-Khabbaz, et al. [14] reported a lower level of understanding of alveolar bone loss in periodontal disease (39%) in their cohort of medical professionals. Owens, et al. [18] reported 92% of the participants, while the present study reported 54.35% of the medical professionals showed the understanding of gingivitis as the reversible inflammation of the gingival margin.

The outcomes of the present study highlighted a critical missing link “inter-professional education”. In health education, collaborative learning is a tool in which members of different professions learn together and from each other to improve patients’ quality of care (Centre for the advancement of interprofessional education – CAIPE) [14,22,23]. Recently, inter-professional education (IPE) has gained high importance in patient-centred care and has been included in most medical and dental curricula [16]. These courses and modules develop skills for complex patient needs and foster awareness of oral-systemic health interactions. These modules guide the professionals to institute inter-professional collaborative practise (IPCP) [16,24]. In this regard, medical-dental integration of the curriculum could provide the most favourable outcomes for the optimised care of patients with diabetes. The present study noted that medical professionals are quite welcoming to receive training in oral health examination and wants to improve the understanding of periodontal diseases.

The outcomes of the present study lead to the fact that if medical professionals are not fully equipped with the current literature (concerning diabetes mellitus and periodontal relationship) then ultimately patients under their care will not receive optimised preventive care. The information will not pass on to the patients, and hence both diseases will negatively influence each other. The results of the present pilot study should be interpreted carefully as they represent only a small percentage of medical healthcare professionals. The main limitations of the study are the low sample size, some unanswered responses, and the potential of unconscientious responses. Future research with the better methodological design that evaluates the barriers in the mutual and collaborative care of diabetes patients by medical professionals and the dental team should be conducted. Furthermore, the influence of information sources, medical healthcare professionals use to become informed and make clinical decisions should be explored. It is acknowledged that the bidirectional relationship between periodontal disease and diabetes is not causal. However, these two conditions strongly influence each other, mainly arbitrated by the hyper-inflammatory response [25]. The present study urged the need for effective collaboration between medical and oral healthcare providers to break professional silos for integrated disease prevention. The best example for the oral healthcare professionals, to follow, is the integrated oral health practice model that helps in the early detection of the disease by health screening and health promotion activities and instigating lifelong coordinated patient care with the support of medical healthcare professionals [26,27].

Conclusion

Within the limitations of the pilot study, it can be concluded that the investigated cohort is aware of the association between periodontal disease and diabetes mellitus. However, they are not fully convinced due to the lack of interactive forums that discuss such clinical management issues. Hence, this knowledge is not reflected in their clinical practice resulting in a low frequency of referral and communication with the dentist. It is the time medical professionals should realise the fact that “No health without oral health”.

For More Articles: Biomedical Journal Impact Factor: https://biomedres.us

Open Access Journals on NanoScience

Inventing of Macrocyclic Formazan Compounds with Their Evaluation in Nano- Behavior in the Scanning Microscope and Chromatography

Introduction

Cyclo- Formazan is one of the modern compounds in the field of organic chemistry and is considered an innovation by Dr. Nagham Aljamali in April 2021 when it was prepared for the first time globally [1,2]. And because their studies and references are a few for this cause the researcher Dr. Nagham Aljamali prepared and carried out various compounds from Macrocyclic-Formazan by using various conditions and different basic medium [3-7] like (Pyridine ,Pipridine ,5 % Sodium hydroxide, Triethyl amine,…) [3], and linked them with heterocyclic compounds and other compounds with more than two hetero atoms to increase their effectiveness [7-11] , biological [13,16] and industrial applications [17,20]. Cyclic Formazan has cyclic structure of (-N=N=C-N- in cyclic structure) or (-N=N-C-N-NH- in cyclic structure) according to type of amine in reaction [1,2]., They were considered among the organic compounds of importance in organic chemistry because they contain two highly effective groups in several fields of chemistry [1,21-24], especially in coordination chemistry [25-27], as a ligands because they contain free electrons of donor atoms to coordinate with ions to form complexes [28-30]. Formazan also tested in many studies as anti-bacterial [31-34] and anti-fungal compounds [35-36] and types of cancer [37-39], especially breast [40] and laryngeal cancers [41], as anti-bacterial [42] and antifungal [43,44], and other studies [40-44].

Instruments and Experimental Part

All melting points were uncorrected and dignified on an electro-thermal apparatus (Switzerland) in an open capillary tube. FT.IR spectra were detailed on Fourier transform infrared spectrometer (FT-IR) in (FT-IR- 3600) infrared spectrometer via employing KBr Pellet technique., 1H.NMR spectra were recorded in DMSO-d6 as solvent using (TMS) as internal standard and chemical shifts are expressed as (δ ppm)., also Mass– Spectra for some of them other studies represented by evolution them as Nanocompounds by {Scanning Electron Microscopy (FESEM), and their Chromatographic behavior}.

Procedures

Preparation of Compounds {1, 2, 3}: Terephthalic acid (0.01 mole) was dissolved in (30 ml) absolute ethanol (2ml) of Sulfuric acid with refluxing for (2 hrs) in esterification step, then the ester will cyclize with semicarbazide (0.02 mole) with refluxing for (4 hrs) in presence of phosphoric acid as closing agent in cyclization step, according to procedures [4-7], the product filtered, dried, recrystallized to yield Ox diazole amine Compound [1], which reacted (0.01 mole) with (0.02 mole) hydrazine in refluxing step for (3 hrs) according to procedures [4-7], the product filtered ,dried, recrystallized to yield Oxadiazole hydrazine Compound [2], which refluxed (0.01 mole) with (0.02 mole) of p-nitrobenzaldehyde for (3 hrs) in presence of (3 drops of glacial acetic acid), according to procedure [4-7], the product filtered ,dried ,recrystallized to yield Imine -Compound [3] (Scheme 1).

biomedres-openaccess-journal-bjstr

Scheme 1: Synthesis of Compounds {1, 2, 3}.

Creation of Inventive Macrocyclic Formazan Compound {4}: Compound [3] was (0.01 mole) reacted in presence of (Pyridine) with (0.01 mole) of diazo salt of p- phenyl diamine via many steps in basic medium to formation Invented Macrocyclic Formazan after (15 hrs), the product filtered, dried, washed by distilled water, recrystallized to yield Invented Macrocyclic Formazan [4] by following literatures [1,2].

Creation of Inventive Macrocyclic Formazan Compound {5}: Compound [2] refluxed (0.01 mole with (0.02 mole) of p-formal benzoic acid in presence of (2-3 drops) of glacial acetic acid for (2 hrs) in absolute ethanol according to procedure [4-7], the product filtered ,dried ,recrystallized to yield Imine -Compound that (0.01 mole) was reacted in presence [1-3] of (Triethyl amine) with (0.01 mole) of diazo salt of p- phenyl diamine via many steps in basic medium to formation Invented Macrocyclic Formazan after (12 hrs), the product filtered, dried, washed by distilled water, recrystallized to yield Invented Macrocyclic Formazan [5] by following literatures [1,2] (Scheme 2).

biomedres-openaccess-journal-bjstr

Scheme 2: Creation of Invented Macrocyclic Formazan Compounds {4, 5}.

Creation of Inventive Macrocyclic Formazan Compound{6}: Compound [2] refluxed (0.01 mole with (0.02 mole) of p-formal phenol in presence of (2-3 drops) of glacial acetic acid for (3 hrs) in absolute ethanol according to procedure [3-7], the product filtered ,dried ,recrystallized to yield Imine -Compound that (0.01 mole) was reacted in presence [1,2] of (Pipyridine) with (0.01 mole) of diazo salt of p- phenyl diamine via many steps in basic medium to formation Invented Macrocyclic Formazan after (10 hrs), the product filtered ,dried ,washed by distilled water, recrystallized to yield Invented Macrocyclic Formazan [6] by following literatures [1,2].

Creation of Inventive Macrocyclic Formazan Compound{7}: Compound [2] refluxed (0.01 mole with (0.02 mole) of 4-N,Ndimethylamine benzaldehyde in presence of (2-3 drops) of glacial acetic acid for (2 hrs) in absolute ethanol according to procedure[3-7], the product filtered ,dried ,recrystallized to yield Imine -Compound that (0.01 mole) was reacted in presence [1-3] of (5 % NaOH) with (0.01 mole) of diazo salt of p- phenyl diamine via many steps in basic medium to formation Invented Macrocyclic Formazan after (20 hrs), the product filtered, dried, washed by distilled water, recrystallized to yield Invented Macrocyclic Formazan [7] by following literatures [1,2] (Scheme 3).

biomedres-openaccess-journal-bjstr

Scheme 3: Creation of Invented Macrocyclic Formazan Compounds {6, 7}.

Results and Discussion

In recently scientific paper, various of Invented Macrocyclic Formazan Compounds have been created in same procedure that followed and invented [1,2] by Dr. Nagham in April 2021 that got a patent to invention of Macrocyclic Formazan compounds, then several studies were carried out to improve these innovative compounds by the using of spectral identification like : 1H.NMR spectra, FT.IR- Spectra, Mass- Spectra., other studies represented by (Melting points, other studies represented by evolution them as Nano-compounds via {Scanning Electron Microscopy (FESEM) ,and their Chromatographic behavior}., all the results are shown in tables and figures.

Spectral Investigation

FT.IR- Spectral Indication of Invented Macrocyclic Formazan Compounds: The first characterization of innovative compounds by shifting of frequencies of Imine group (CH=N) in starting compounds (Imine compounds) that were about at (1615 , 1610, 1618, 1620) Cm-1 respectively in all starting materials of imine compounds that were shifted to (1630 , 1627 , 1631, 1642) Cm-1 for (-C=N-) due to formation of Macrocyclic Formazan, also appearance of three bands due to partitions of azo group of Formazan in Macrocycle (-N=N-) are (1429 ,1451, 1476) Cm-1 for (-N=N-C-) in compound {4}., and other compound like this., all frequencies clarified according to reference [1,33].

1H.NMR- Spectral Indication of Invented Macrocyclic Formazan Compounds: The second characterization of innovative compounds by disappearance of peak for imine group (CH=N) in starting compound (Imine compound) that were at δ (8.13) in Compound {3} (starting compound) due to formation of (N=CN= N) for (Formazan groups) in innovated compounds [4, 5, 6, 7], also in compound [5] appeared peak at δ (12.31) due to proton of carboxyl group (COOH), while compound [6] appeared peak at δ (10. 82) due to proton of hydroxyl group (OH), all peaks explained according to reference [33].

Mass– Spectral Indication of Invented Macrocyclic Formazan Compounds: The third characterization of inventive compounds by partition of innovative cyclic compounds via appearance of fragments in spectra in (Figures 1 & 2).

Other Characterization: All Invented Macrocyclic Formazan derivatives were studied to collect all the chemical and physical properties, in (Table 1).

biomedres-openaccess-journal-bjstr

Figure 1: Mass–Spectrum of Invented Macrocyclic Formazan Compound [4].

biomedres-openaccess-journal-bjstr

Figure 2: Mass–Spectrum of Invented Macrocyclic Formazan Compound [7].

biomedres-openaccess-journal-bjstr

Figure 3: Scanning Electron Microscopy of Invented Cyclic Formazan [4].

biomedres-openaccess-journal-bjstr

Table 1: Other characterization of Invented Macrocyclic Formazan Compounds.

Scanning Electron Microscopy (FESEM): Scanning Electron Microscopy (FESEM) of the Innovated Cyclic Formazan compounds (for morphological properties) that revealed in this research that they have a spherical shape and have granular sizes within the Nano-scale they have an average size of (44. 23 , 40. 12 , 46. 61, 55. 97) nanometers for Cyclic Formazan Compounds [4, 5, 6, 7] respectively, so the surface area increases and this characteristic makes it eligible for medical uses because it has a small granular size , spherical shape within the nano-scale that is used in medical fields as a treatment for many types of cancers as well as in the industrial field, (Figures 3-6).

biomedres-openaccess-journal-bjstr

Figure 4: Scanning Electron Microscopy of Invented Cyclic Formazan [5].

biomedres-openaccess-journal-bjstr

Figure 5: Scanning Electron Microscopy of Invented Cyclic Formazan [6].

biomedres-openaccess-journal-bjstr

Figure 6: Scanning Electron Microscopy of Invented Cyclic Formazan [7].

Chromatographic Study for Invented Cyclic Formazan Compounds: This section of the study involved a study of the chromatographic separation of the invented cyclic formazan compounds to know the effect of the effective groups in the chemical composition on the separation according to procedures [39-43], such as polar groups. In this work, Cyclic Formazan Compound {5} is the slowest compound in the separation because it contains two polar carboxyl groups (OH) that are affected when descending during the season and followed by Cyclic Formazan compound {6} according to polarity, then compound [4], and last one is compound [7], for this reason the compound [7] separated faster than other compounds due to its structure is less polarity and less interaction with column, (Figures 7-10).

biomedres-openaccess-journal-bjstr

Figure 7: Chromatogram of Invented Cyclic Formazan Compound [4].

biomedres-openaccess-journal-bjstr

Figure 8: Chromatogram of Invented Cyclic Formazan Compound [5].

biomedres-openaccess-journal-bjstr

Figure 9: Chromatogram of Invented Cyclic Formazan Compound [6].

biomedres-openaccess-journal-bjstr

Figure 10: Chromatogram of Invented Cyclic Formazan Compounds [7].

Conclusion

All Invented Macrocyclic Formazan compounds gave good evidences for their structures via various spectral techniques, also some of them studied like scanning microscope appeared Nanoproperties for these compounds, which means that the cyclic Formazan compounds can be good drug delivery to treatment and medical applications.

For More Articles: Biomedical Journal Impact Factor: https://biomedres.us

Open Access Journals on Case Reports

Growing Teratoma Syndrome, A Rare Case

Introduction

Germ cell tumors are widely considered to be morphologically and immunophenotypically homologous to germ neoplasms arising in the gonads and extra-gonads. Classification of germ cell tumors based on the World Health Organization (WHO) was divided into germinoma (resembling seminoma of the testis and dysgerminomas the ovaries), teratoma (mature, immature, and secondary malignancies), tumor yolk sac, embryonal carcinoma, choriocarcinoma, and tumor mix [1]. Germ cell malignancies account for 10% of all non-epithelial malignancies of the ovary. The most common types of germinal malignancies include dysgerminoma and immature teratoma. 99% of teratoma in ovary was benign and the others was malignant. Histological analysis of immature teratomas showed that they consist not only of an immature component but also a mature component, the latter containing most of the immature neural tissue. Immature teratomas are classified into three grades due to the relative amount of immature neural tissue. Treatment were surgery and chemotherapy. This malignancy has a fairly good cure rate among ovarian malignancies [2].

Growing teratoma syndrome (GTS) is a rare complication between patients with germinal ovarian cell tumors. The incidence of growing teratoma syndrome occurs in 1.9-7.4% in all immature teratomas, characterized by an enlarged metastatic mass during adequate systemic chemotherapy and normal serum markers. Retro-peritoneal residual mass is a common finding after chemotherapy. It may contain mature teratomas, fibrotic tissue, or tumors. Mature teratomas, which unresponse to chemotherapy, may result from the evolution of malignant lesions after chemotherapy or may represent metastases from mature teratoma foci [3].

Case Illustration

An 18-year-old woman from Acehnese ethnicity, unmarried, came for routine check-ups to the Gynecological Oncology Polyclinic at Dr. Zainoel Abidin Hospital, Banda Aceh with complaint of abdominal pain that was felt occasionally. Other complaints such as bleeding from vaginal, nausea and vomiting were denied. The urination and defecation were still within normal limits. History of menarche at the age of 12 years, regular menstruation, 7 days of menstruation, changing sanitary napkins 3-4 times a day (before illness), and denied dysmenorrhea. Currently, the patient has no complaints during menstruation. The patient has undergone unilateral salpingo-oophorectomy due to ovarian tumor indications in 2019 with histopathological results of immature teratoma. After that, the patient underwent chemotherapy with a regimen of bleomycin, etoposide and cisplatin for 6 cycles in the same year. After chemotherapy, patients routinely underwent ultrasound evaluation and tumor markers. In the evaluation, there were no abnormalities in the ultrasound findings and tumor markers.

At this time, the patient claimed to feel a lump in the lower abdomen. Examination of vital signs were within normal limits. On physical examination found a flexible abdomen, intestinal peristalsis was found within normal limits and did not increase a palpable mass at the level of the symphysis pubis, mobile, without tenderness. Supportive examinations were carried out in the form of transabdominal gynecological ultrasonography, alpha fetoprotein (AFP) and β hCG values. The ultrasound showed an anteflexed uterus measuring 7.9×2.73×3.77 cm, endometrial line (+) measuring 5.42 mm, showing a hypo hyperechoic picture with a size of 6.24×4.48×4.61 cm, the origin of the mass is difficult to assess, no ascites is found, the impression is in the form of intraabdominal mass (Figure 1). AFP value is 1.82 ng/ml. Furthermore, upon the finding of a growing mass, the patient was suspected of having a new intra-abdominal mass and planned a second look laparotomy.

biomedres-openaccess-journal-bjstr

Figure 1: Mass Ultrasonography Results.

biomedres-openaccess-journal-bjstr

Figure 2: Intraoperative findings.

On exploration, we found the uterine and right ovary were within normal limit. It also was found 3 nodules on the peritoneum and omentum that conglomerated in the superior uterine, with the largest being 3×4 cm and the smallest being 2×2 cm (Figure 2), then adhesiolysis was performed and it was decided to take a mass and omentectomy for histopathological examination. Further exploration found nodules in the intestine measuring 2×2 cm, then a mass was taken for histopathological examination (Figure 3). Further exploration revealed no nodules in the liver. After the procedure, the patient underwent 2 days of treatment and went home after the second day of treatment. Histopathological results after surgery showed the results of glandular structures lined with cuboidal epithelial cells with cell nucleus morphology within normal limit. In the histopathological preparations, there were no signs leading to malignancy and no signs leading back to immature teratoma.

biomedres-openaccess-journal-bjstr

Figure 3: (a) Nodules on the peritoneum and omentum;
(b) Nodules in the intestines.

Discussion

Immature teratoma is a type of non-epithelial malignancy in the ovary. The degree of malignancy depends on the appearance of the neuroepithelium in the tumor. The incidence of this immature teratoma is about 10-20% among germinal malignancies of the ovary. Age up to 20 years is the largest population with this disease [4]. Immature teratomas occur generally in the first 2 decades of life and are mostly absent at menopause. This tumor was determined histologically based on the grade number and degree of immaturity of the cells [5]. The patient was first diagnosed with an immature teratoma at the age of 16 years with complaints of a palpable mass in his abdomen. Then the patient was decided to undergo a surgical procedure and the histopathological results of an immature teratoma were obtained. The growth of immature teratomas is quite fast with a median time between onset of symptoms and diagnosis of 5-12 weeks. The patients were present with complain of palpable pelvic mass, and abdominal pain. Experiences of other patients with abnormal vaginal bleeding were found 12% patients presented with abdominal pain, which may be associated with capsule rupture or twisting [6,7]. Immature teratomas consist of all germ cell networks, which is endoderm, mesoderm, and ectoderm and assessed histologically. The five-year survival rate of immature teratomas is around 90% in stage I and II but it descent to 82% for stage III and 72% for stage IV. High grade histology significantly get worsens the prognosis [8].

Incidence of immature teratoma on both ovaries at the same time is very rare. These tumors can have other implants in the surrounding tissue such as the peritoneum which is usually found intraoperatively. Prognosis is depending on the histological grade of the tumor and metastatic implants [9]. Peritoneal dissemination on immature teratoma mainly on the age of the children is a rare case and often provide a poor prognosis[10]. In the pediatric population with immature teratoma, elevated serum AFP levels were found in 50% of cases, but in adult there was found in one-third of cases. Levels of cancer antigen-125 (CA-125) were also found to have a less significant increase. Immature ovarian teratoma was not associated with elevated levels of human chorionic gonadotropin (hCG). Ultrasound may or may not describe the diagnosis of this disease, depending on the number of solid or immature tissue components [6].

In pre-menopausal patients in whom the tumor usually appears on one ovary, unilateral oophorectomy and limited grade surgery should be performed. Resection of other tumors that may cause morbidity and making delay for chemotherapy should not be performed. Resection of residual mass should be happened after completion of chemotherapy [4]. Patients with early-stage disease such as stage IA have a better prognosis, and adjuvant therapy after surgery is not required. In patients with high-grade, stage 1A immature teratoma, adjuvant chemotherapy is generally given, although this is sometimes questioned [4]. The commonly used combination chemotherapy regimen in the past was VAC (vincristin, actinomycin, and cyclophosphamide), however a study by the Gynecologic Oncology Group (GOG) reported that the relapse free rate in patients with incompletely resected disease was only 75%. Over past 20 years have incorporated cisplatin into the treatment of these disease, and mostly with VBP (vinblastine, bleomycin, and cisplatin) in the past and now with BEP (bleomycin, etoposide, and cisplatin) [4]. GOG has evaluated of three cycle BEP therapy in fully resected stage I, II, and III ovarian germ cell tumors patients. 91 of the 93 patients (97.8%) with non dysgerminomatous tumors were clinically disease free [4]. Administration of cisplatin can reduce the components of immature cells in teratoma derived from embryonic stem cells and pluripotent stem cells which are believed to cause apoptosis and also induce differentiation [2].

The second look laparotomy for ovarian germ cell tumor is not indicated for patients who have received adjuvant chemotherapy (eg, stages 1A, 2, and 3). However, this procedure is considered in suspected metastatic residual immature teratoma because it can lead to a rare complication such growing teratoma syndrome [4]. GTS was defined by Logothetis et al. in 1982 as a growth of benign tumor phenomenon, after removal of the primary malignant tumor during or after chemotherapy [11]. The incidence of GTS in testicular nonseminomatous germ cell is 1.9% to 7.6%, and occure in 12% of ovarian germ cell tumors [12,13]. GTS was determined based on the following criteria:
1. Continued growth of extra-gonadal tumor foci after diagnosis of immature teratoma or mixed germ cell tumor containing immature teratoma during or after chemotherapy with.
2. Serum markers (AFP and hCG) previously increased become normal and.
3. Histopathology shows mature teratoma in the resected tumors.6 Complete resection is important for the treatment of GTS. The presence of residual mass after surgery is a risk factor for recurrence GTS [14,15].

Patients who have undergone a laparotomy have a mass taken in the omentum and intestine. The histopathological results that we found did not find any malignancy in the nodule preparation. Preoperative findings with the presence of a mass after chemotherapy and a normal level of tumor marker AFP in the patient, two of the three GTS criteria proposed by Logotheis were met. The third condition that is met is the presence of a mature teratoma mass in a new mass histopathological preparation. In terms of histopathological results, this patient had histopathological results that did not show malignancy in the preparation. Treatment of GTS is multi-disciplinary approach, such as chemotherapy and surgery. GTS is diagnosed during or after the completion of chemotherapy. In case when GTS is recognized during chemotherapy, completion the early chemotherapy cycle is highly recommended. Discontinuation of chemotherapy is warranted only in the presence of vital symptoms caused by an increase in tumor size and in the presence of compression in surrounding organs (eg, intestine, lung, liver) with life- threatening organ failure. Only in this case, early resection of mass is acceptable. Improvements in oncological outcomes were achieved by following three steps:
1. Early recognition growing tumor size and elevated tumor markers during chemotherapy,
2. Completion of a number of early stages of the chemotherapy course under thorough monitoring of clinical size and appearance, and
3. Complete resection of growing mass [16,17].

According to Hamayun Imran et al. in his study stated that majority of GTS case have been reported in adults after adjuvant chemotherapy for all women except grade 1 tumor stage IA [18]. In a study conducted by Julie My Van Nguyen et al., stated that currently the incidence of GTS after adjuvant chemotherapy is becoming more common, as evidenced by the fact that there were 15 samples receiving adjuvant chemotherapy, 6 of whom had GTS so that further examination or required. The follow up was periodic patients with a history of immature teratoma through examination of tumor markers and imaging [19]. In a study conducted by Song Li et al., stated that GTS has a very good prognosis. Patients with GTS were found to be disease-free for 40.3 months (range 1-216 months, n=48) based on the median follow-up score. In addition, regular imaging and serum tumor markers follow-up are important [15]. GTS can develop in children, and the tumor size are same between adolescents and adults. Furthermore, GTS progression from primary germ cell tumors may be more rapid in children than adolescents and adults. Complete resection of all GTS tissue is recommended, although fertility sparing surgery should be considered whenever possible [20].

Conclusion

Immature teratoma can leave residual disease which will later become a rare complication, namely growing teratoma syndrome. Treatments of GTS are multi- disciplinary approach such as chemotherapy and surgery.

For More Articles: Biomedical Journal Impact Factor: https://biomedres.us

Open Access Journals on Biomedical Research

Review of Prevalence and Mechanism of Achilles Tendon Injury Among Athletes

Introduction

Achilles’ tendon is a thick fibrous tissue that serves as insertion of calf muscle on the calcaneus; it also called the calcaneal ligament. This tendon is the toughest and strongest tendon the body. The Achilles tendon is susceptible to many injuries such as rupture [1] and tendonitis because of excessive usage of the tendon. Injury to the tendon is of great medical importance because of the functions played by this tendon in some movement around the ankle such as planterflexion and evertion which are important during walking and also in weight bearing as the tendon plays a key function in the transfer of weight to the ground while standing. Some previous studies has reported of incidence of Achilles tendon injury among athletes engaged in different forms of sport such as football, sprinting, basketball and others [2-5] and also in among different categories of people such as military personnel [6-9]. Reasons for this may be due to increase activities around the ankles among individuals of this professions thereby leading to increase shear stress on the Achilles tendon resulting mostly into tear injury. This research reviews the prevalence of Achilles tendon injury among athletes and military personnel, looking critically to some associated factors seen in these set of people that predisposes them to this injury.

Methodology

Literature search of articles on reports and incidence of Achilles tendon injury was made on different databases which about 60 articles were collected and about 52 were exclude because they couldn’t meet the inclusion criteria. The inclusion criteria include those cases of Achilles tendon injury shouldn’t be secondary to any cause such trauma, osteoarthritis, indicated drugs such as quinolonoes, congenital or metabolic problems and also the occupation of the subjects must be stated since the research is focused. Some of the articles were discarded because they were duplicate of others or had similar findings to other selected articles. The occupations focusing on athletes engaging in various sporting activities and prevalence in each article are recorded. The Prisma flow chart showing the analysis of processes of articles selection is shown below.

Results

A total of 60 articles were retrieved from different databases and only 8 articles were eventually used in these studies (Figure 1).

biomedres-openaccess-journal-bjstr

Figure 1: Prisma Flow chart.

Studies on Athletes

In a cross-sectional studies done on 173 athletes reveals that development of Achilles tendon injury in them cannot linked to any identifiable risk factor such as age, sex, height and weight other than that they are athletes who partook in sporting activities which includes track and field athletics [10]. However, the limitation to this study is that athletes with severe Achilles tendon injuries may not have been included due to the fact that the severity of injury might not have allow them to partook in the track and field events where the study was made. The relationship between age and sporting activity involved among athletes with Achilles’ tendon injury was drafted from research carried out to reveal the epidemiology of Achilles tendon injury in the United States between the year 2012 – 2016 [11]. The observations are recorded in Table 1 below.

biomedres-openaccess-journal-bjstr

Table 1: Showing the prevalence of Achilles tendon injury among athletes with different activities drafted from [11].

Note: *R/H/S = Running/Hiking/Stretching, *SR = Stairs Related, *BS = Ball Sport, *DR = Door Related.

Discussion

The prevalence of Achilles tendon injury seen among athletes [10,11] and military personnel [12] could have resulted from excessive activities around the ankle which resulted to increase tension and shear stress on the tendon leading to either tear of the Achilles tendon or Inflammation (Achilles’ tendonitis). Although, some additional risk was identified in some of the articles reviewed such alcohol intake, obesity, age and sex; we considered them as potentiating factors to development of Achilles tendon injury with the major risk being the nature of their occupation which requires increase activities around their ankles. Compared to the general population with the same potentiating factors (age, sex, weight, height) there is increase risk of development of Achilles tendon injury among athletes [12] with basketball being the most associated sporting activities in the United States [11this may be linked to increase activities such as jumping, bouncing and others that increase the load on Achilles tendon during basketball game professional. There is increase incidence among athletes within ages of 20-39 showing a strong association between age of athletes and development of Achilles tendon injury because athletes within this age bracket are more likely to be doing athletics on full term basis thereby exposing them to longer period of activities.

Mechanism of Injury (Achilles Tendinopathy)

The mechanism of Achilles tendon injury can be described under the following

a) Overuse: Typical Mechanism of Injury: Achilles’ tendinitis usually develops from overuse. This can occur with excessive jumping and landing type activities. Repetitive micro traumas due to overload (Compressive or Tensile) cause inflammation of the tendon sheath, degeneration or combination of both. This can lead to tendinopathy It can also occur as a result of trauma such as from a direct blow to the tendon. (Acute rupture).

b) Decreased arterial blood flow, local hypoxia, decreased metabolic activity, nutrition, and persistent inflammatory response have been suggested as possible factors that could lead to chronic tendon overuse injuries and tendon degeneration.

Other Contributory Factors to Achiles Tendinopathy

Recent research showed older age, higher android fat mass ratio, and waist circumference > 83cm, in men is associated with a higher chance of having Achilles Tendinopathy [13-15]. The presence of t-The presence of the COL5A1 gene variant was also found to be a possible risk factor. This gene is normally responsible for the production of tendon protein, but patients with the condition were shown to have significantly different allele frequencies of the COL5A1 BstUI RFLP compared with normal subjects [16]. Therefore, besides overuse and degeneration, Achilles Tendinopathy was proposed to have a strong metabolic influence due to poor anatomical vascularity, association with body fat, and the genetic factor. A prospective study identified both female sex and the diminished blood flow response after running as significant risk factors for the development of Achilles tendinopathy [17].

Staging of Injury (The Tendon continuum)

Stages of Tendon Pathophysiology includes

• Reactive tendinopathy

• Tendon disrepair

• Degenerative tendinopathy

Achilles’ tendinopathy can be described as an insertional or mid-portion, the difference is in the localization. The insertional form is situated at the level of transition between the Achilles tendon and the bone, the mid-portion form is located at the level of the tendon body [18].

a) Reactive Tendon: 1st stage on the tendon continuum and is a non-inflammatory proliferative response in the cell matrix. This is as a result of compressive or tensile overload. Straining the tendon during physical exercise has been seen as one of the biggest pathological stimuli and systematic overloading of the Achilles tendon above the physiological limit can cause a micro-trauma.

b) Tendon Disrepair: The progression of the reactive tendinopathy to TENDON DYSREPAIR can occur if the tendon is not offloaded and allowed to regress back to the normal state. During this phase, there is the continuation of increased protein production which has been shown to result in separation of the collagen and disorganization within the cell matrix. This is the attempt of tendon healing as with the 1st phase but with greater involvement and breakdown physiologically.

c) Degenerative Tendinopathy: is the final stage on the continuum and it is suggested that at this stage there is a poor prognosis for the tendon and changes are now irreversible. Often, tendon degeneration is found in combination with peri-tendinous adhesions, but this does not mean that one condition causes the other one.

Sex Differences in Achilles Tendinopathy

The incidence of Achilles tendon rupture has been rising over the past few decades in both men and women, with about 84 percent of cases occurring in men. Some studies have suggested that- female hormones like estrogen reduce the risk of rupture in women, but the hormones’ precise role has been unclear. In addition, some scientists have argued that the typically larger, stronger calf muscles in men would exert greater forces on the tendon and increase the risk of rupture. To gain a better understanding of the factors influencing sex-specific differences in vulnerability to damage, a team of investigators led by Louis J. Soslowsky, Ph.D., of the University of Pennsylvania, compared the material properties of the Achilles tendon/muscle unit in male and female rats. To specifically test for effects of female sex hormones, they also studied female rats that had been made estrogen-deficient by having their ovaries removed [19]. Their measurements showed that while Achilles tendons from males are larger, those from females are stronger and remain more elastic during movement. They also noted that muscle fibers were larger in male rats compared to females, as expected. These findings suggest that inferior properties of the tendon coupled with greater muscle size could explain men’s increased susceptibility to Achilles’ tendon ruptures [19].

Conclusion

This research reveals the relationship between being athlete or military personnel and development of Achilles tendon injury as seen in the prevalence of the condition among individuals with these professions.

For More Articles: Biomedical Journal Impact Factor: https://biomedres.us

Journals on Infectious diseases

On Politics, Bad Science, and the End that Justifies the Means: The Case Against Forced Vaccinations in Previously COVID-19-Infected and Recovered Individuals

Introduction

Validity is the ability of a research tool or experiment to accurately measure a predefined endpoint in order to assess a rational hypothesis. But, when erroneous conclusions are drawn based on a convoluted study design that lacks validity, this becomes bad science. Worse yet, when the scientific process is undertaken teleologically with a predetermined outcome as its goal, it becomes misconduct. If teleological “science” is intentionally generated to help promote a politically or financially biased narrative, serious harm to individuals and society at large may ensue. In line with those definitions, the paper recently published by the Centers for Disease Control and Prevention (CDC) in their Morbidity and Mortality Weekly Report, which claims superiority of vaccine immunity over natural immunity, represents the textbook definition of poor validity and, at the very least, bad science [1].

Background: A Teleological Emergency?

Through a systematic review and pooled analysis of the literature, we recently compiled the best available scientific evidence comparing the effectiveness of natural immunity and vaccine immunity to COVID-19 [2]. Using stringent inclusion criteria, we limited our analysis to 7 high-quality publications, including a total of 279,107 patients and 56,161 patient-years of follow-up. Compared with the unvaccinated COVID-19-naive cohort, vaccinated patients (i.e. the “vaccine immunity cohort”) had a significantly reduced infection rate (0.9% vs. 4.7% per personyear), yielding a number needed to treat (NNT) of only 6.5 patients to prevent 1 COVID-19 infection per year. Similarly, the previously infected, unvaccinated cohort (i.e., the “natural immunity cohort) had a significantly reduced risk of reinfection (0.25% per personyear) compared with the same COVID-19- naive cohort. When compared head-to-head with the natural immunity group, the vaccine immunity cohort had a 1.86 relative risk (RR) of infection, which was found to be non-statistically significant, but a 0.049% absolute risk (AR) increase, which was statistically significant. Thus, natural immunity against COVID-19 was found to be at least equivalent to vaccine immunity in conferring protection against infection or reinfection. Among all groups, the risk of COVID-19 infection/reinfection was lowest (0.15% per person-year) in previously infected, vaccinated individuals, suggesting a marginal but statistically significant incremental benefit of vaccination in the previously infected and recovered population (RR: 1.82, AR reduction: 0.0039%).

This small benefit of vaccination translated into a very high NNT of 218 in the previously infected and recovered cohort, raising serious doubts about the favorability of the risk-benefit ratio of routine vaccination in this population, even if only well-established, short-term risks of vaccination are taken into account (potential long-term risks, especially in young people, remain unknown at this point). Almost immediately following the publication of our study after in-depth peer review, the CDC released a paper in their Morbidity and Mortality Weekly Report (MMWR), reporting on a cross-sectional study of hospitalized patients with “COVID-19- like illness” within a network of several US hospitals (the “VISION Network”), which putatively demonstrates the superiority of vaccine immunity over natural immunity, thereby attempting to negate the findings of our study [1]. Not surprisingly, the CDC paper was immediately and heavily publicized by media companies and on social media, claiming that vaccines are five times as effective as natural immunity in this regard and that the debate on this issue has essentially been settled in favor of vaccines [3-9]. The implications of this study, according to CDC, is that “all eligible persons should be vaccinated against COVID-19 as soon as possible, including unvaccinated persons previously infected with SARS-CoV-2” [1]. Unfortunately, as stated above and detailed below, the CDC paper represents bad science, of the kind we warn our youngest and most inexperienced research students to avoid at all costs, as they start learning the basics of medical and clinical research. Political analysis and opinions remain beyond the scope of this letter. Specifically, the reasons and exact circumstances underlying this scientific mishap by the CDC, traditionally a highly respected and credible source of medical information, will not be discussed here. Only the merits (lack thereof) of their paper will be discussed.

The Fundamental Problem: Study Validity (Lack Thereof)

The fundamental and primordial problem with the CDC study is its total lack of validity. The CDC sought to compare protection against COVID-19 infection/reinfection between vaccinated patients and those unvaccinated, but with natural immunity from a previous infection. Unfortunately, what they ended up measuring in this study was a totally unrelated and quite irrelevant endpoint. Rather than using a longitudinal, population-based (community + hospital) observational cohort design to help answer this research question, the authors relied on an awkward hospital-based crosssectional design, looking at all patients within their VISION Network hospitals who, in the first 8 months of calendar year 2021 (January 1 – September 2):
1) Were admitted with a COVID-19-like illness (i.e., largely a population of patients with various flu syndromes),
2) Underwent molecular testing for COVID-19, and
3) Had, 3-6 months earlier, either had a laboratory-proven COVID-19 infection or completed a two-dose vaccination with an FDA-approved mRNA vaccine.

Interestingly, of an initial grand total of 201,269 hospitalizations, only 7,348 patients (3.7% of the entire cohort), 6,328 in the vaccine immunity group and 1,020 in the natural immunity group, satisfied the inclusion criteria and were analyzed. The authors compared the proportions of COVID-19 positive tests in the two groups of patients and found a higher rate of COVID-19 positivity in the unvaccinated, previously infected group, with a crude odds ratio of 1.77 (8.7% vs. 5.1%). Using ill-defined, seemingly acrobatic, and largely opaque statistical adjustments and propensity-based calculations (not detailed or explained in the paper), the authors present a final adjusted odds ratio of 5.49 in favor of vaccines. Those and other methodological red flags and flaws will be discussed below. However, the most fundamental flaw of this paper, its absolute lack of validity, needs to be addressed first. In fact, what the authors claim they have proven is not at all what their data has actually shown. At best, the authors can conclude that a hospitalized patient with clinical symptoms suspicious for COVID-19 who [3-6] months ago, had prior infection with SARS-CoV-2, would be more likely (1.8- 5.5x) to test positive for COVID- 19, but less likely to test positive for other flu viruses or respiratory infections than an otherwise similar patient that, 3-6 months ago, received an mRNA vaccine. In other words, what the authors measure here is merely the rate of COVID-19 positivity relative to other infectious agents with similar clinical presentation in each of those two patient populations. Given the lack of longitudinal follow-up, this does not at all mean that vaccinated patients developed less COVID-19 infections than their naturally immune counterparts. For instance, one could potentially argue that mRNA vaccines might have led to higher rates of viral illnesses and hospitalizations relative to natural immunity, but that its negative impact on non-COVID-19 infections might have been even worse than that on COVID-19, hence a lower proportion of in-hospital SARS-CoV-2 positivity relative to other infectious agents. If that assumption was true, then increased rates of both COVID-19 and COVID-19-like illnesses and related hospitalizations would be accurately uncovered by a longitudinal observational cohort study. In contrast, a cross-sectional study design would lead to the erroneous conclusion that the relative rate of COVID-19 is lower in the vaccinated group. Interestingly enough, in the CDCanalyzed in-hospital cohort, the absolute number of patients with COVID-19-like illnesses who were previously vaccinated is over 6 times larger than that of patients with natural immunity (6,328 vs. 1,020). Even the absolute number of hospitalized patients with laboratory-proven COVID-19 is over 3.5 times higher in the vaccinated group (324 vs. 89). Such ratios (6:1 and 3.5:1) are way out of proportion to the rates of vaccination in the US population. Perhaps, one would rather conclude from this study that, in sharp contrast to the authors’ claim, patients with natural immunity tend to stay healthier and away from hospitals compared with those who received mRNA vaccines.

More Methodological Frailty: Flaws, Biases, and Red Flags

Aside from the fundamental validity problem presented above, the CDC study is replete with methodological mishaps, which we summarize below.

Selection Bias: The analyzed patient cohort is relatively very small, representing only 3.7% of the original cohort of hospitalized patients with COVID-19-like illness. While large numbers of patients had to be excluded based on the authors’ (otherwise reasonable) inclusion criteria, such a large number of excluded patients almost invariably introduces significant selection biases into the statistical analysis.

Subject Misclassification: To be included in the vaccine immunity cohort, a patient had to have had at least 1 negative molecular COVID-19 test, at least 14 days prior to the index hospitalization. Given that a single negative test does not cover the entire 3 to 6-month period preceding the index hospitalization, it is entirely possible that many patients with prior undiagnosed COVID-19 infections were mistakenly misclassified into the vaccine immunity group, which could potentially affect the results of the study.

Unorthodox Statistical Adjustments: The questionable, poorly defined, very opaque statistical adjustments and propensitybased calculations performed by the authors managed to convert a crude odds ratio of only 1.77 into an “adjusted” odds ratio of 5.5 in favor of vaccines, which has since been widely publicized by the media (i.e. vaccines are being advertised as “five times more effective” than natural immunity) [3-9]. For instance, propensity score matching should generally not be used in groups with very little overlap, since it can introduce significant error. Yet, their data set falls precisely under this category. For the sake of transparency and credibility, we invite the authors to publish a follow-up publication detailing their statistical methodology and presenting their raw data.

Selective Time Filtering: The authors excluded patients with prior COVID-19 infection 14-90 days before the index hospitalization and those with mRNA vaccinations over 6 months prior. This convenient cherry-picking is likely to favor vaccine immunity by design, given that natural immunity is typically robust in the weeks following COVID-19 infection, while vaccine immunity has been shown to wane after 6 months [10-14].

Exclusion of Janssen Vaccine Recipients: It is a blaring fact that the authors entirely excluded recipients of the Janssen vaccine, which is generally known to be the least effective of the 3 FDA-approved COVID-19 vaccines. Excluding this small subset of vaccinated subjects from the analysis is an undeniable “fudge factor” in this paper, which is likely to skew the analysis even further in favor of vaccine immunity.

Conclusion

The paper recently published by the CDC has little, if any, merits and should have no impact whatsoever on the decision to vaccinate previously COVID-19-infected and recovered individuals, let alone mandate and force such vaccinations on them [1]. We urge the CDC to retract this paper or, at the very least, issue a clear and unequivocal statement acknowledging its severe methodological limitations. This agency’s credibility is truly at stake here. The CDC has to strive to free itself from overreaching politics, regain the trust of the population, and restore its image as a uniquely credible and authoritative public health resource for America and the world. Finally, we would like to reiterate that, to date, the best available evidence on the topic of natural vs. vaccine COVID-19 immunity is clearly laid out in our recent systematic review [2], and its conclusions are clear:
1) Natural immunity to COVID-19 is at least equivalent, if not superior, to that conferred by vaccines.
2) Administering vaccines to previously infected and recovered individuals may provide a slim benefit, but one so slim it would likely be outweighed by the known short-term risks of vaccination, as well as its unknown potential long-term risks in young people.
3) The decision to receive added vaccination in the naturally immune must be left to remain a matter of personal choice and individual consent, in line with the person’s right to bodily autonomy, a basic and sacred tenet of medical ethics.

For More Articles: Biomedical Journal Impact Factor: https://biomedres.us

Open Access Journals on Medical Microbiology

Foliar Versus Soil Biofortification of Zn in Citrus (Citrus Reticulata Blanco) Effect on Mineral Nutrition and Fruit Yield and Quality

Introduction

Gaining maximum yield and benefit with optimum use of nutrients source is the common objective of the growers worldwide. Most of the nutrient element are soil applied whereas few are applied on the foliage. Soil application needs higher dose and is more often and most effective for the nutrients (Fageria et al. [1]). However there are few circumstances that foliar application of nutrient is more economic and effective. Application of soil fertilizers is done on the basis of soil test where as foliar application is done on the basis of visible cues or detailed plant tissue examination. So correct diagnosis of the nutrient deficiency is the fundamental for the successful foliar fertilization (Fageria, et al. [1]). Moreover some peculiar traits which are required for foliar application of nutrient elements are higher leaf area index so as to absorb nutrients elements instantly. The nutrient elements should be applied more than once based on the severity symptoms. Highly soluble fertilizer can be applied in the optimum temperature and sunshine avoiding leaf burning. Foliar application of the fertilizer can complement to the soil application. Such foliar application can be sprayed in combination with insecticides, postemergence herbicides or fungicides with increased the net benefit by reducing the cost of application (Fageria, et al. [1]). Moreover multiple nutrient elements such as Fe, Zn and Cu can be mixed and sprayed together which saves both time and money (Bhantana, et al. [2]).
The growth and development of plant is enhanced by effective application of proper amount of nutrient in the root zone. And adverse effect on plant growth and development is appeared due to failure to apply balanced fertilization. So not only Zn but also each and every nutrient required for balanced fertilization i.e. an application of macro and micro nutrient elements such as N, P, K, Ca, Mg, S, Fe, Mn, Zn, B, Mo, Cu, Cl, Ni etc in proper amount (Kumar, et al. [3]). Zn is an important micronutrient for plants. Zinc in soil and plant nutrition is becoming major concern over the more than forty different countries worldwide (Alloway [4]). Some examples of soil which are deficient in Zn are calcareous soil, sandy soil, tropical weathered soil, saline soil, waterlogged soil and heavy clay soil etc. (Alloway [4]). In the soil solution there is decrease in Zn by 30 fold with each unit increase in pH from 5- 7. When soil pH is higher than 8 the zinc bound more strongly causing poor availability of the Zn in soil solution (Cakmak, et al. [5]). Heavy fertilization with nitrogen is reported to have Zn deficiency in citrus of Florida. This is because that the application of nitrogen increases tissues numbers and sizes and eventually increases Zn hunger, the dilution effect. Similarly nitrogenous fertilizer increase acidity in the soil which increases Zn availability (Swietlik [6]). So a study of physiological response of Zn on fruit yield and quality parameters is taken for this study. Lack of Zn supplementation in daily diet is the major issue for the health of the global citizen (Bhantana et al. [2]). In the present scenario more than 1.1 billion people are suffering from lack of Zn nutrition (Kumssa, et al. [7]). Zinc can be applied to the soil or foliage respectively. There is a huge gap between the Zn supply and Zn requirement. Combined application of both soil and foliar application of Zn is practiced from the time ahead to minimize the gap (Bhantana et al. [2]). Inadequate supply of Zn in human food cause to lead several symptoms. Major symptoms of the Zn deficiency are growth retardation, delayed sexual and mental development, eczema and hair loss (Barokah, et al. [8]). And it is also reported that about 300 proteins in the human body are Zn dependent (Krezel, et al. [9]).
Some agronomic, breeding and biotechnological aspect of biofortification are essential to acquire the diversification of food. Monoculture is the key aspect of the reduced Zn fortification to the crop and their final product. Similarly people in the developing countries are highly dependent on plant based food rather than animal based diets (Cakmak, et al. [5]). A gap between daily requirement (40-50 mg Kg-1) and supplement (20 mg Kg- 1) is observed (Cakmak, et al. [5]). This is how an agronomic biofortification of cereals and fruits needs to be done. In this study both crop hunger with Zn and Zn hunger for food for the humans is addressed. In citrus orchard Zn is the most frequently occurring nutritional disorder. This is how two conventional used methods soil and foliar application are concurrently practiced. After N, Zn is the most widespread nutritional element frequently threatening the citrus industry. Both flowering and fruit set are affected by the Zn fertilization. Superiority of foliar application over soil application increase the fruit number and weight (Srivastava [10]). So both the methods and amount of application of Zn pertains importance over citrus quality and production (Razzaq, et al. [11]). Use of foliar spray with 0.6% increase tree height, crown width and stem girth. Also fruit diameter, fruit weight, vitamin C and total phenolics is increased in treated plant than untreated (Razzaq, et al. [11]). Hence the use of soil or foliar application solely in agreement to the field condition is practiced in this research. This is how this project is specially focused to deal with crop hunger and human hunger for the Zn.

Materials and Methods

The research was carried out in the Huazhong Agricultural University (HZAU; 30°28′26″N, 114°20′51″E), Wuhan, China. A study on the response of foilar cum soil biofortification of Zn on citrus trees was done in the two varieties namely Wenzhou and Nanfeng in the five year old orchard. Similarly the SPAD (Soil Plant Analysis Development) value of the five leaves per tree were measured as described in the (Ling, et al. [12]). Twenty seedlings of ‘Wenzhou’ and ‘Nanfeng’ each were planted in the plant nutrition research block in the year 2014. The treatment consisted of three different levels of Zn application. The three different concentrations of foliar Zn application were 0, 0.5 and 1.0 percentage and the three different concentration of soil applied Zn were 0, 40 and 80 g/tree. Chlorophyll concentration, including Chlorophyll A, Chlorophyll B and caretenoids were measured by treating with 95% ethanol based on the following equation with spectrophotometric observation (Sumanta, et al. [13]).

Similarly the data on SPAD was measured on three different dates 13 May 2019, 10 June, 2019 and 20 July 2019. For the determination of NPK concentration in plant samples, plant samples were dried in forced air oven at 70oC to constant weight. Grinding and sieving of dried samples were done through 0.5 mm screen. 0.12g of finely grounded samples were mixed with 5ml of sulphuric acid (H2SO4) and wait for 12 hour for digestion. Then the samples were digested in digestion system of fume hood. The samples were heated to 180oC for 3 hour with addition of H202. After fully digested samples to clear white are transferred to 50 ml volumetric flask and dilute to 50 ml with deionized water. The Barbano and Clark 1990; method is used for the determination of N by using Kjeldahl apparatus. Similarly, colorometric method (Lu, [14]) was used to determine the concentration of P after digestion of the plant samples in H2SO4-H2O2. Moreover flame photometric technique was used for the determination of K in plant samples after the samples were completely digested in H2SO4-H2O2. The digested solution were distillated, filtrated and transferred to 50 ml volumetric flask and diluted to 50 ml with deionized water. The Zn in plant tissue in this study was determined by DTPA (Diethyltriamine pentaacetic acid) extraction-atomic absorption spectrophotometer method as described in (Katyal, et al. [15]). Similarly the vitamin C was measured by titration with 20% oxalic acid as quoted in (Najwa, et al. [16]) and hand held refractrometer was used for the measurement of total soluble solids as described in Echeverria, University of Florida, IFAS. Similarly titrable acididty was measured by titration of fruit juice with NaOH as described in the (Islam, et al. [17,18]).

Results

biomedres-openaccess-journal-bjstr

Figure 1: Microgram per litre (μg/L) concentration of chlorophyll A, Chlorophyll B and caretenoids in varying level of Zn application
(A) Foliar application and
(B) Soil Application in the variety Wenzhou.

The determination of chlorophyll A, chlorophyll B and caretenoids of the variety Wenzhou are shown in the –(Figures 1A-1B)) with foliar spray of 0, 0.5 and 1 percentages and soil application of 0, 40 and 80 g/tree ZnSO4 respectively. In both figure Chlorophyll A is appeared on the top, Chlorophyll B in the middle and caretenoids in the bottom. Similarly, the determination of chlorophyll A, chlorophyll B and caretenoids of the variety Nanfemg are shown in the (Figures 2A-2B)) with foliar spray of 0, 0.5 and 1 percentages and soil application of 0, 40 and 80 g/tree ZnSO4 respectively. Again in the both figures Chlorophyll A is appeared in the top, Chlorophyll B in the middle and caretenoids in the bottom. The concentration of chlorophyll A, chlorophyll B and caretenoids in Wenzhou and Nanfeng as expressed in μg/L showed similar results. The data on soil plant analysis development (SPAD) is shown of in the Figures 3 & 4. The data were recorded in three different dates 13-May, 10-June and 20-July 2019 respectively. More mature the leaf the higher the reading of the SPAD. These SPAD values were arranged in ascending order 13-May, 10-June and 20-July. Besides the SPAD values in two varieties of citrus was observed similar. Also it appeared that the SPAD values observed similar with foliar application 0, 0.5 and 1 percentages and soil application of 0, 40 and 80 g ZnSO4 per tree (Figures 3 & 4). In most of the cases on an average the value of SPAD varied between 40-85. There is no distinct variation in SPAD values with foliar application of ZnSO4 0, 0.5 and 1% and soil application of ZnSO4 0, 40 and 80 g/tree respectively. Based on the chlorophyll measurement (Figures 1 & 2) and SPAD value (Figures 3 & 4) and that there is not a significant variation in Wenzhou and Nanfeng. Similarly there is no difference between foliar application and soil application of ZnSO4 in this attributes. Percentages of N, P, K with application of Zn as foliar spray or soil application is shown in the (Figures 4A & 4B)) of the respective (Figures 5-7) respectively. The concentration of nitrogen is higher in Nanfeng than Wenzhou in the parameter N in the study (Figure 5). Conversely the parameter Wenzhou is higher than Nanfeng in the parameter P study (Figure 6).

biomedres-openaccess-journal-bjstr

Figure 2: Microgram per litre (μg/L) concentration of chlorophyll A, Chlorophyll B and caretenoids in varying level of Zn application.
(A) Foliar application and
(B) Soil Application in the variety Nanfeng.

biomedres-openaccess-journal-bjstr

Figure 3: SPAD values recorded in varying levels of Zn application
(A) Foliar application and
(B) Soil Application in the variety Wenzhou.

biomedres-openaccess-journal-bjstr

Figure 4: SPAD values recorded in varying levels of Zn application
(A) Foliar application and
(B) Soil Application in the variety Nanfeng.

biomedres-openaccess-journal-bjstr

Figure 5: Percentages of N recorded in varying levels of Zn application
(A) Foliar application and
(B) Soil Application in the variety Wenzhou and Nanfeng.

biomedres-openaccess-journal-bjstr

Figure 6: Percentages of P recorded in varying levels of Zn application
(A) Foliar application and
(B) Soil Application in the variety Wenzhou and Nanfeng.

Moreover an interaction between Wenzhou and Nanfeng is observed in the (Figure 7) with percentages of K application. When the values of Nanfeng is higher the Wenzhou is lower and vice versa. As shown in all the figures from (Figures 1 & 7) that there is no significant difference in between Nanfeng and Wenzhou varieties. Similarly, the mg of Zn per Kg DM is shown in the (Figure 8). Both in the foliar application and the soil appliation, the Zn content in the Nanfeng is higher than Wenzhou. In the (Figure 8), it seemed a weak interaction between these two varieties for the parameter Zinc concentration. At zero concentration the Nanfeng has higher value of Zn supply than Wenzhou and other higher concentrations for example at 0.5 and 1 percentages of the foliar spray or 40 and 80 g/tree of soil application of ZnSO4. Likewise total fruit yield t/ ha is shown in (Figure 9). The fruit yield varied between 30-10 t/ ha in Wenzhou and it varied between 10-5 t/ha in Nanfeng. Also the vitamin C content in relation to the soil and foliar application in the foliar versus soil application of Zn is shown in the (Figure 10). However the analyzed data are not significant the value of vitamin C is higher in case of the variety Wenzhou than Nanfeng. It is observed that at zero concentration of foliar application of ZnSO4 and at Zero concentration of soil application the vitamin c amount is higher than other amount. Even more the total soluble sugars (TSS) is presented in the (Figure 11). The data are not statistically significant the presented values are similar with the application of foliar or soil applied Zn. Last but not the least another parameters for the study of Zn response is titrable acidity (TA). There is interaction between two varieties for the TA. In the variety Nanfeng there is higher value of TA with application of 0.5% foliar applied Zinc and 40 g/tree application of ZnSO4. In the variety Wenzhou the response soil cum foliar application in TA of Zn is the straight line (Figure 12).

biomedres-openaccess-journal-bjstr

Figure 7: Percentages of K recorded in varying levels of Zn application
(A) Foliar application and
(B) Soil Application in the variety Wenzhou and Nanfeng.

biomedres-openaccess-journal-bjstr

Figure 8: Milligram of Zn per Kg dry matter recorded in varying levels of Zn application
(A) Foliar application and
(B) Soil Application in the variety Wenzhou and Nanfeng.

biomedres-openaccess-journal-bjstr

Figure 9: Total fruit yield (t/ha) recorded in varying levels of Zn application
(A) Foliar application and
(B) Soil Application in the variety Wenzhou and Nanfeng.

biomedres-openaccess-journal-bjstr

Figure 10: Vitamin C (mg/100g) recorded in varying levels of Zn application
(A) Foliar application and
(B) Soil Application in the variety Wenzhou and Nanfeng.

biomedres-openaccess-journal-bjstr

Figure 11: Total soluble solids (oBrix) recorded in varying levels of Zn application
(A) Foliar application and
(B) Soil Application in the variety Wenzhou and Nanfeng.

biomedres-openaccess-journal-bjstr

Figure 12: Titrable Acidity (%) recorded in varying levels of Zn application
(A) Foliar application and
(B) Soil Application in the variety Wenzhou and Nanfeng.

Discussion

Micronutrient like Zn plays pivotal role in the growth and development of plant and occupy an important position due to its essentiality (Dewal, et al. [19]). Even more the role of Zn in plant nutrition and increasing soil productivity increase the importance greater. With regards to increase cropping intensity, intensive cropping with high yielding crop and their varieties even increasing the importance of the micronutrient like Zn in agriculture (Dewal, et al. [19]). The present era farming is highly focused to top yield and quality so the attempt has to be paid for the application of Zn. An emphasis in soil or foliar application or combined application of Zn enhanced plant growth, grain yield and the components of grain quality. Zn is an essential attribute of the plant hormones, green chlorophyll and cytochrome (Dewal, et al. [19]). Similarly Zinc is one of the key nutrient element for the growth and production of plant. It helps in the production of chlorophyll pigment in the crop. There are instances to which production of chlorophyll, caretenoids and increase in yield and quality is achieved by application of Zn (Kandoliya, et al. [20]). For example increase in the chlorophyll is achieved at 45 and 70 days after sowing (DAS) (Kandoliya, et al. [20]). Not only foliar application also soil application of Zn increase the grain yield, protein and gluten content of wheat. This is due to increased photosynthesis with the help of increasing leaf pigment and enhanced mineral nutrition (Kandoliya, et al. [20]). The highest Zn content in straw and grain is recorded in chelated Zn treatments. Regarding plant nutrition content the chelated Zn appeared highest than the soil application. Similarly, the use of foliar spray increased the fertilizer use efficiency and wheat nutrient content (Kandoliya, et al. [21]).
But in this research as shown in Figures 1 & 2, the chlorophyll A, Chlorophyll B and Caretenoids did not differ in relation to soil and foliar application of the nutrients. Both variety used in the study showed similar response for the chlorophyll A, chlorophyll B and caretenoids (Kandoliya, et al. [21]). SPAD stands for the soil plant analysis development. SPAD is a hand held device used for the rapid, accurate and non-destructive measurement of leaf chlorophyll concentrations. SPAD is used extensively both in the research and agricultural operation with a range of plant species (Ling, et al. [12]). There are a number of scientific papers published in the area of using SPAD measurement (Uddling, et al. [22]). The SPAD meter (Konica- Minolta, Japan) provides alternative to the data provided through the destructive measurement of ethanol based formulation of leaf chlorophyll as shown in the Figures 1 & 2. This alternative method accounts for overcoming the disadvantages of leaf chlorophyll measurement. SPAD is a tool not very expensive, hand held device based on two light-emitting diodes. Measurement of a silicon photodiode receptor with the measurement of leaf transmittance in the red 650 nm wavelength and 940 nm. The transmittance values are used to derive the relative SPAD meter value are in between 0-50 which is proportional to the chlorophyll concentration in the leaf sample (Uddling, et al. [22]). But in our case the SPAD values varied between 40-80. The recording of the SPAD value differed by the age of the leaf, solar radiation, time of the day, cloudiness etc. Leaf chlorophyll concentration is an important parameter that frequently measures as an indicator of chloroplast development, nitrogen content, photosynthetic capacity or plant health. As mentioned in the (Figures 1 & 2), leaf chlorophyll is destructively quantified in the laboratory. Leaf chlorophyll concentration is an important parameter which correlated with SPAD readings in this study. So in vivo measurement of chlorophyll by SPAD should be focused. Yield and quality of the citrus fruit are subjected to balanced fertilization. New shoots in citrus are correlated with fruit yield. Citrus leaves accounts for 21% and 31-44 % of the above ground biomass and above ground nutrients respectively (Roccuzzo, et al. [23]). Earlier study showed distribution of N in different parts of the citrus such as shoots, leaves and fruits (Roccuzzo, et al. [24]). Measurement of the top shoot leaf nitrogen prior to start of the experiment is 1.72% (Wenzhou) and 2.11% (Nanfeng) (Unpublished data). Similarly in the study after application of Zn varied in between 1.18 to 2.25 in both of the varieties either with the application of foliar nutrition or soil. Mineral nutrients composition in the citrus fruits is optimized by application of balanced nutrition. Concentration of nutrients in citrus fruit varied with amount of N(52.70–71.4%), P (66.5–80.4%) and K (68.9–85.9%) (Fan, et al. [25]).
Furthermore, the nutrient requirements per unit of newly developed shoots and fruits were gradually decreased and increased. These information is useful for the pruning and fruit thinning of the citrus orchard (Fan, et al. [25]). Moreover, the concentration of N and K is increased highly in the citrus fruit. Whereas the P is required for the tree growth (Zambrosi, et al. [26]). As presented in the (Figure 5). the concentration of N is higher in the variety Nanfeng in comparison to Wenzhou. The value of N percentage is significant at 0.5% of the foliar application than Wenzhou as shown in the (Figure 5A). In addition an alternate bearing is closely looked and the citrus tree fetched great amount of nutrition which is still unresolved (Martinez-Alcantara, et al. [27,28]. China is one of the key producers of citrus but still there is problematic situation due to low yield, excessive fertilization and alternate bearing. Practice of rational fertilization, quantification of new tissues, nutrient demand rules are suggested for the improvement. Moreover high and stable yield, and high citrus quality in citrus plantation can be achieved (Li, et al. [29]). Application of 180 lb N ac-1yr-1 is recommended to sustain optimal tree growth, maintain high fruit quality and production in the citrus orchard of the Florida (Alva, et al. [30]). The rate, placement and timing is essential to meet the proper application of the fertilizer. Also organic sources of nutrient for example the leaf litter can be incorporated as fertilizer. However the leaf analysis showed important parameter for the evaluation of nutritional status of the trees an identification of the nutrient budget is important. Measurement of nutrient budget is one of the way to the fertilizer recommendation for the nutrient uptake efficiency (Alva, et al. [30]). The composition of mineral nutrients for example N, P and K in the fruits varied from 1-1.19, 0.14-0.16 and 1.19 to 1.26 respectively (Alva, et al. [31]). The citrus production is higher than other tropical and subtropical fruits including Banana, Mango, Apple , Pear and Peach (Alva et al., 2006). China alone occupies the highest production of citrus fruit in the world (Li, et al. [29]). Citrus production is mainly suited to sandy to clay loam soil. Soil pH of 6.0 is optimal for citrus production however the pH value between 5.5-7.5 is also adequate based on the different rootstock (Alva, et al. [30]). China ranked the first in position to the production of citrus both in the area and yield.
Citrus is one of the key commodity fruit in terms of farmers income, industrialization, poverty alleviation and provides occupation to needy farmers in the south China mountainous region (Li, et al. [29]). Increment in the fruit quality parameters namely yield and quality, vitamin C, total soluble solids, TA, etc with increased application of N, P and K is recorded (Han, et al. [1]). Application of urea 1.75 Kg plant-1 affect the quality of citrus fruit increasing the content of invert sugar by 12.2% and by reducing the vitamin C by 13.3% (Li, et al. [29]). So it has been observed that application of P increase fruit yield but decrease total soluble solids (Obreza, et al. [32]). Despite the numerous attempts has been paid towards the application of N, P, K on citrus fertilization yields mainly depend on cultivar, age, climate and soil physiochemical properties. In Brazil increase application of P increase the yield of lemons (Obreza, et al. [32]). Increase in the size of the fruit and number are accredited to the increased yield in citrus fruit. Firstly balanced fertilization application increase the number of fruits per tree and secondly the increment in the fruit size is recorded (Li, et al. [29]). An speculation was made towards decrease in aluminium toxicity in the soil with an amount of surplus P fertilization (Nakagawa, et al. [33]). P amendment increase TSS in citrus fruit. Application of P increase the citrus yield and quality (Quaggio, et al. [34]). So application of P increase the yield of citrus by 32.6% with increase both in number and size of the fruit. But the mineral nutrients N and P do not have effect on TSS (Li, et al. [29]). Due to limitation of rootstock and plant growth; a high application for P uptake are desirable. So an experiment was designed for the application of 20, 40 an 80 mg Kg-1 P. Increased in the root growth, shoot growth, P nutrition by the uptake of greater number of other nutrients. In case of Rangpur lime there is increase uptake of P by 13-126%. So P use efficiency of citrus tree can be increased by applying the P in the deeper strata of the soil and use of better rootstock (Zambrosi, et al.
[26]). Potassium has important contribution in yield and quality of the citrus fruit. High amount of K application increase the fruit size and thick and coarse peel. Whereas low amount reduced the size of the fruit with thin peel (Alva, et al. [31]). Similarly the juice acidity is directly proportional to K concentration in the fruit. High acidity is caused by high amount of K and vice versa. Highly available K in soil enduce the uptake of some ions such as magnesium, calcium and ammonium ions (Alva, et al. [31]). The concentration of K in leaf tissue varied between 0.30 to 0.37% before initiation of the treatment (Data not shown). But after initiation of the treatment the value changes to 0.4 to 0.8% in the variety Wenzhou and Nanfeng respectively (Figures 7A & 7B)) in foliar cum soil application of nutrients.
These figures are quiet similar to the data observed in this study. In combined application of 1% urea and 0.8% Zinc sulphate in a every two week interval applied for six year increase the yield and quality of 15 year old apple trees. Increase in yield is solely due to the increase in the mean fruit size (Amiri, et al. [35]). The highest yield observed is 49 Kg/tree with the maximum fruit size (202g). Whereas the lowest yield recorded was 35 Kg/tree with the maximum fruit size 175 g (Amiri, et al. [35]). Lower record of the fruit in the control treatment is due to pre-harvest fruit drop and smaller size of the fruit. As shown in the (Figure 9A); in this study the fruit yield varied from 30 to 15 t/ha in Wenzhou and 5 to 15 t/ha in Nanfeng respectively in the foliar application. But in the (Figure 9B) with soil application of Zn fertilizer increased the yield in Wenzhou to 15-35 t/ha. These Figures also showed the fruit yield in the Nanfeng with foliar or soil application of Zn. The differences in the yield observed is varietal and has not any relation with the Zn application under both soil and foliar application. The concentration of P in top shoot samples prior to start of the experiment are 0.17 and 0.16% in the top shoots of oranges respectively (unpublished data). And in the current study the P concentration varied between 0.15-0.35% respectively. The amount of vitamin C quantified in the concentration of mg per 100 g of fruit is presented in the Figure 10. The vitamin C is measured with titration method. As shown in the Figures 10A & 10B, the vitamin C ranges from 10-25 mg/100 g of the fruit. According to the Najwa and Azrina, 2016, the vitamin C content of the orange, grapefruit, lemon, kaffir lime, lime and musk lime are 58.3, 49.15, 43.96, 37.24, 27.78 and 18.62 mg per 100g respectively. The finding of our research is below than the aforementioned value except in musk lime. However the different method used in the determination has different values for the vitamin C. The use of HPLC method is closely suited to our values as determined by (Najwa, et al. [36]). In the HPLC the 43.61, 31.33, 26.4, 22.36, 21.58 and 16.78 mg/100 g of orange, lemon, grapefruit, lime, kaffir lime and musk lime is observed respectively. Significant variation is observed in the study of vitamin C of samples by both methods. Both of the methods are suitable for the determination of vitamin C, however the HPLC method is more accurate, precise and specific (Najwa, et al. [36]).
TSS value as measured by the hand refractrometer is shown in the Figure 11. Similarly the value of TA is shown in the Figure 12 by titration with 0.1 N sodium hydroxide solution and phenolphthalein indicator (Suszek, et al. [37]). Total fruit yield ranges from 2.04 to 11.70 Kg/tree in the year 2009 and 5.52 to 32.94 Kg/tree in the year 2010 (Suszek, et al. [37]). Occurrence of drought spell in flowering and fruiting time may cause the difference in the yield. Smaller size of the fruit in the year 2009 cause lower yield. The average size of the fruit as observed was 323g and 310g respectively in the year 2010 and 2009 respectively. The value of TSS in the year 2009 is 6.23 to 8.65 oBrix and in the year 2010 is 6.18 to 9.11 oBrix (Suszek, et al. [37]). These values are close to the values presented in the (Figure 11). Similarly the value of titrable acidity (TA) as observed in this study is shown in the Figure 12. The TA value ranges from 0.53-0.99 % in the year 2009 and 0.40-0.71 % in the year 2010 (Suszek, et al. [37]). These values are in close connection with the data presented in the (Figure 12). Soil Zn concentration measured by DTPA method in mg per kg dry matter is 22.35 (unpublished data) before start of the experiment. This value is higher than the critical value of the Zn in soil. So the plant do not experience Zn deficiency in the treatment. As shown in Figure 9, the yield of two varieties as known as Wenzhou and Nanfeng under foliar as well as soil application of Zn do not differed each other. Symptoms of chlorosis is appeared in some instances but not so severe. So there is no significant difference in the foliar cum soil application of Zn in this study. Based on the feasibility farmers are recommended to choose foliar application Zn than soil application. Since there is not significant variation in the yield and yield attributing parameters in these two treatment in the citrus trees of Wuhan.

Conclusion

Zinc is not only an essential nutrient element but also a heavy metal. So, in spite of the ameliorating effect, Zn has a deleterious effect when applied in excess. This is how due care has to be paid for the successful incorporation of Zn in cropping system. Soil test values are required to judge the concentration of the Zn in soil. Similarly the evaluation of Zn in plant tissue are required. However Zn value differed from soil types, plants and their varieties and crop growth stages. The critical limit for the Zn concentration from the soil in Wuhan, China is 22.35 mg Kg-1. So attention has to be paid for successful incorporation of Zn in an agro ecosystem. In regards to the critical limit research has to be carried out more frequently to access the ground reality in connection with the published literature. Moreover fruit yield and quality like vitamin C, total soluble solids, titrable acidity etc are increased with the application of Zn in different crops grown. So the human demand for Zn and crop hunger can be satisfied (Krezel, A et al. [38]).

For More Articles: Biomedical Journal Impact Factor: https://biomedres.us