Biomedical Journal of Scientific & Technical Research (BJSTR) is a multidisciplinary, scholarly Open Access publisher focused on Genetic, Biomedical and Remedial missions in relation with Technical Knowledge as well.
Comparison of Three Treatment Methods of Ⅰ-Ⅲ Degree Hemorrhoids: A Meta Analysis
Introduction
Hemorrhoids is a common clinical disease and its pathogenesis is not yet clear. The theory of anal cushion displacement is widely accepted at present, that is, supporting tissue degeneration, including fibrous tissue fragmentation, elastic connective tissue and submucosal muscle fiber weakening, which may be related to lack of dietary fiber, constipation, improper defecation habits and lifestyle. The main clinical manifestations of hemorrhoids are bleeding during defecation, pain, anal prolapse, swelling, pruritus and perianal secretions [1]. Depending on the location of the disease, hemorrhoids can be divided into internal hemorrhoids, external hemorrhoids and mixed (internal and external) hemorrhoids. Internal hemorrhoids are formed by tissue covered by columnar epithelium, and located above the dentate line; External hemorrhoids are formed by tissue covered by squamous epithelium, and located below the dentate [2]. Mixed hemorrhoids appear at the top and bottom of the dentate line. The staging of internal hemorrhoids is not completely unified in the world. Goligher’s classification is more commonly used, which divides internal hemorrhoids into gradeⅠ-Ⅳ.
i. Grade Ⅰ: Bleeding during defecation, but not prolapse, most patients have no obvious symptoms. ii. Grade Ⅱ: The hemorrhoids protrude out of the anus during defecation, and the prolapse can be returned by itself. iii. Grade III: Prolapse out of the anus during defecation, fatigue, long walking, or coughing. After prolapse, internal hemorrhoids cannot be repaid by themselves, and they need to be repaid by hand. iv. Grade Ⅳ: With external hemorrhoids, the hemorrhoids remain outside the anus for a long time and cannot be repaid or prolapse immediately after being repaid. The treatment methods of internal hemorrhoids include non-surgical treatment and surgical treatment. Most internal hemorrhoids of grade I-III can be alleviated by non-surgical treatment such as drug treatment, RBL, IS, and IRC; grade IV internal hemorrhoids, internal hemorrhoids that fail or have complications should undergo surgical treatment [3]. RBL is a simple, quick and effective method for treating patients with grade I-II and part of grade III internal hemorrhoids. The method is to ligate with ligator above the dentate line, and the internal hemorrhoids are necrotic due to blood flow blockade and fall off automatically [4]. IS is an endoscopic or anal endoscopic injection of sclerosis agent into the submucosal layer of internal hemorrhoids, forming fibrosis and scars. IRC is to coagulate the hemorrhoid blood vessels or cause fibrosis of the hemorrhoid submucosa through the instant high heat generated by infrared rays, to fix the anal cushion. IRC is mainly used for the treatment of internal hemorrhoids of grade I – III [2]. The purpose of this study was to compare the efficacy and safety of RBL, IS and IRC in the treatment of internal hemorrhoids. We evaluated the evidence from the random control trial (RCT) and the research data from the systematic review of the RCT, and performed a meta-analysis, which is reported below.
Materials and Methods
Search strategy
Use keywords such as “Hemorrhoids”, “Hemorrhoid sclerotherapy”, “Injection sclerotherapy”, “Rubber band ligation”, “Hemorrhoid ligation”, “Infrared coagulation”, “Hemorrhoid infrared coagulation”. Searched the literatures from PubMed, Cochrane Library, and Embase database up to 2021. The research method limited the RCT to improve the sensitivity and did not limit the language, and the related references in the included literature were manually searched, and consistent standards were used to determine the included and excluded literature.
Inclusion and Exclusion Criteria
• Participants of the study included patients ≥18 years of age who met the Goligher’s grading classification criteria and patients with grade I-Ⅲ internal hemorrhoids; patients diagnosed with grade IV hemorrhoids and patients with other anorectal diseases other than the study disease were excluded. • The original text is publicly published literature; it is limited to RCT, in which patients are randomly assigned to two or more treatment groups, clinical results are recorded, and follow-up time is at least 3 months. • The original literature provides corresponding indicators of effectiveness and safety: including effective rate, recurrence rate, complication rate, etc. • The type of literature is limited to treatises, and literatures with incomplete original data are excluded. reviews, conference reports, reviews, case reports, etc. are excluded. • The included RCTs are all evaluated by the Cochrane handbook to evaluate the quality of the literature.
Data Extraction
General data of the literature were extracted: including the first author, year of publication, number of patients included, observation data, etc. The extraction of all data was done independently by two researchers. For the controversial data, the third researcher participated in the discussion and decided.
Outcome Indicators
Main Outcomes: Effective Rate, Recurrence Rate. Secondary Outcome: Complications.
Statistical Analysis
Meta-analysis was conducted with Review Manager 5.4 software to study the effective rate, recurrence rate and complication rate of RBL, IS and IRC in the treatment of patients with internal hemorrhoids. As a dichotomous variable analysis, odds ratio (OR) was used as the effect index, and 95% confidence intervals (95%CI) is calculated. The Cochrane Q test was used to evaluate the heterogeneity among studies, and the magnitude of heterogeneity among studies was determined by combining the I2 value. Moderate to high heterogeneity was considered when I2 was greater than 50%, and the test level was α=0.1. The data were combined and analyzed for heterogeneity. If there was no heterogeneity (I2≤50% and P≥0.1), the fixed-effect model was selected for analysis; If there was heterogeneity (I2>50% and/or P<0.1), then analyze its sources and discuss, choose random effects model analysis. Meta analysis test level was α=0.05. For highly heterogeneous variables, the single study deletion method was used to conduct sensitivity analysis to find the source of heterogeneity. If the heterogeneity decreased after deleting the document, the document was the source of heterogeneity, and the forest figure was finally made. Regarding the analysis of publication bias, by observing whether the two sides of the funnel chart were symmetrical, if the two sides were symmetrical, there was no obvious publication bias, and if the two sides were asymmetric, there may be publication bias.
Meta Analysis Results
A total of 379 relevant literatures were retrieved, 159 duplicate literatures were excluded, 155 were excluded after reading the title, 39 were excluded after reading the abstract, and 14 were excluded after reading the full text. A total of 12 literatures were screened according to the inclusion criteria (Figure 1). A total of 1438 patients were included, including 592 patients in the RBL group, 350 patients in the IS group, and 496 patients in the IRC group. The detailed data of the included literatures were shown in Table 1 (Figure 2).
Figure 1: Literature retrieval process and results Table 1 Features of the included literatures.
Figure 2: Risk assessment of inclusion literature.
Effective Rate
a. RBL vs IRC: A total of 782 cases are included in 6 literatures, and heterogeneity analysis indicates no heterogeneity (P=0.60, I2=0%). The fixed-effect model analysis is carried out, and the results shows that there is no significant difference in the effective rate between the RBL group and the IRC group (OR=1.36, 95%CI:0.89-2.09, P=0.16), indicating that the treatment effect of the two groups is similar, as shown in Figure 3.
Figure 3: RBL vs IRC effective rate.
b. RBL vs IS8: A total of 480 patients are included in 5 literatures. Fixed effect model analysis is used, and the heterogeneity analysis indicates that there is heterogeneity (P=0.06, I2=55%). By eliminating literatures one by one, it is found that the heterogeneity decreases after eliminating literatures Greca.1981, with statistical difference (OR = 2.56, 95% CI: 1.53-4.27, I2 = 46%, P = 0.0003). It suggests that the effective rate of RBL group is better than that of IS group, as shown in Figure 4.
Figure 4: RBL vs IS effective rate.
c. IS vs IRC: A total of 267 patients are included in 2 literatures. Heterogeneity analysis shows that there is no heterogeneity (P = 0.77, I2 = 0%). Fixed effect model analysis is carried out. The results shows that there is no significant difference in the effective rate between IS group and IRC group (OR = 0.66, 95% CI: 0.37-1.19, P = 0.17), indicating that the treatment effect of the two groups is similar, as shown in Figure 5.
Figure 5: IS vs IRC effective rate.
The Recurrence Rate
a. RBL vs IRC: A total of 612 patients are included in 4 literatures. Fixed effect model analysis is used and the heterogeneity analysis indicates that there is heterogeneity (P=0.004, I2=77%). By eliminating literatures one by one, it is found that the heterogeneity decreases after eliminating literatures Walker.1990, with statistical difference.(OR=0.40, 95%CI:0.24-0.67, I2=44%, P=0.0003), suggesting that the recurrence rate of the RBL group is lower than that of the IRC group, as shown in Figure 6.
Figure 6: RBL vs IRC recurrence rate.
b. RBL vs IS: A total of 480 patients are included in 5 literatures. Fixed effect model analysis is used and the heterogeneity analysis indicates that there is heterogeneity (P=0.02, I2=67%). By eliminating literatures one by one, it is found that the heterogeneity decreases after eliminating literatures Walker.1990, with statistical difference (OR=0.34, 95%CI:0.19-0.61, I2=264%, P=0.0003), suggesting that the recurrence rate of the RBL group is lower than that of the IS group, as shown in Figure 7.
Figure 7: RBL vs IS recurrence rate.
c. IS vs IRC: A total of 267 patients are included in 2 literatures, and the heterogeneity analysis indicates that there is heterogeneity (P=0.04, I2=76%). Since there are only 2 literatures, random effect model analysis is carried out, and the results showed that there is no significant statistical difference in the recurrence rate between IS group and IRC group(OR=0.59,95%CI:0.14- 2.39,P=0.46), suggesting that the recurrence rate of IS group and IRC group is similar, as shown in Figure 8.
Figure 8: IS vs IRC recurrence.
Incidence of Complications
a. RBL vs IRC: A total of 782 patients are included in 6 literatures. Fixed-effects model is used and the heterogeneity analysis indicates that there is heterogeneity (P=0.03, I2=59%). By eliminating literatures one by one, it is found that the heterogeneity decreases after eliminating literatures Walker.1990, with statistical difference (OR=1.91, 95%CI: 1.15~3.16, I2=19%, P=0.01), suggesting that the incidence of complications in the RBL group is lower than that in the IRC group, as shown in Figure 9.
Figure 9: RBL vs IRC complication rate.
b. RBL vs IS: A total of 554 patients are included in 6 articles and heterogeneity analysis indicates no heterogeneity (P=0.49, I2=0%). The fixed-effect model analysis is carried, and the results shows that there is no significant difference in the incidence of complications between the RBL group and the IS group (OR =0.02, 95%CI: -0.03~0.07, P=0.42), as shown in Figure 10.
Figure 10: RBL vs IS complication rate.
Discussion
Hemorrhoid is a soft venous mass produced by the dilation and flexion of the submucosal and cutaneous inferior venous plexus at the end of the rectum, which contains normal spongy tissue structures such as minute arteriovenous anastomosis, connective tissue, and nerve tissue, thus playing an important role in assisting and controlling defecation. Hemorrhoids are the most common anorectal diseases in adults, accounting for 89.25% of all anorectal diseases, and treatment needs are huge. The main clinical manifestations of internal hemorrhoids include bleeding, prolapse, pain and perianal itching, and in several cases, it can be complicated with thrombosis, incarceration, strangulation and difficulty in defecation, which significantly affects the patient’s quality of life. The treatment of internal hemorrhoids focuses on the elimination of symptoms caused by internal hemorrhoids. The commonly used treatment methods for internal hemorrhoids include non-surgical treatment and surgical treatment, among which non-surgical treatment includes RBL, IS, and IRC. The national guidelines of the United States, Japan, France, and China countries recommend that the above methods are mainly used for the treatment of I-III degree internal hemorrhoids [1,5,6], but the efficacy and safety of various methods are still controversial. In this article, the efficacy, recurrence rate and complication rate of the above three methods for the treatment of internal hemorrhoids are analyzed and compared in order to comprehensively and objectively evaluate the efficacy and safety of RBL, IS and IRC in the treatment of internal hemorrhoids. The results of this study show that the efficiency of RBL group is better than that of IS group, which is consistent with the research results of Jacobs, D et al. it is mentioned in the research report that the long-term effective rate of RBL group is about 90% among patients with internal hemorrhoids of grade I-III, while the long-term remission rate of only one-third of the patients treated with IS, indicating that the long-term effective rate of RBL is superior to that of the IS group [7]. Similarly, the research results of MacRae HM et al. also show that for I-III degree internal hemorrhoids, it is recommended to use RBL as the first-line treatment, and its curative effect is better than IS. Compared with patients receiving IS or IRC treatment, the need for retreatment in RBL group is obviously reduced [8]. This study has shown that the efficacy of the RBL group was comparable to that of the IRC group. The research by Ricci MP et al. also reported that the success rate of 4 weeks after RBL was not different from that of IRC, that is, the short-term clinical efficacy of RBL was comparable to that of IRC [9]. This study shows that the efficiency of IS group is equivalent to that of IRC group, which is similar to the research results of MacRae, MD et al. . It is mentioned in the research report that there is no difference in any outcome index between IS group and IRC group [10]. IS is the most effective for I-II degree internal hemorrhoids, and postoperative bleeding is rare. For patients with high risk of bleeding, such as patients receiving anticoagulant therapy, this method should be considered [7]. This study suggests that the incidence of complications in RBL group is lower than that in IRC group. However, the research of Johanson JF et al. Showed that RBL has better long-term efficiency, but the incidence of pain after treatment is higher. In contrast, the complications of IRC are few and not serious [11]. The reason for the analysis may be that the current guidelines classify pain as a type of complication. This article does not analyze pain alone, but classifies it as a complication for analysis. This study shows that the recurrence rate of RBL group is lower than that of IS group and IRC group. A C Poen et al. reported that 18% of the patients receiving RBL treatment had symptomatic recurrence, while 20% of the patients receiving IRC treatment had symptomatic recurrence to the level before treatment [12], and the longer the follow-up time was, the higher the symptom recurrence rate was [13]. Meta-analysis of non-surgical treatment showed that the recurrence rate of Ⅰ-II internal hemorrhoids patients after IS was relatively high, while the discomfort caused by RBL was relatively high [14-24].
The Limitations of this Study
1) Although the research documents included in the systematic review are all RCTs, the follow-up time varies, and there is a lack of multi-center, large-scale, long-term follow-up RCT research results. 2) Some studies have a small sample size, and some evaluation indicators only have 2-3 literatures for effect combination, and the outcome indicators of the analysis are not fully mentioned, such as: surgical recovery time, cost-benefit ratio, patient satisfaction, etc. To systematically evaluate the three methods, there is still a lack of high-quality RCTs research. 3) The cases of internal hemorrhoids in some literatures are not classified. In conclusion, for the treatment of grade I – III internal hemorrhoids, the safety of RBL group is better than IS group and IRC group, and the efficacy is better than IS group or equivalent to IRC group. Therefore, RBL can be the first choice among the three treatment methods, but it still needs to be verified by multi-center, large-sample and high-quality RCTs.
Optimization of Ovulation Induction in Clomifene Resistant Patient with Infertility
Introduction
It has been proven that the induction of ovulation is the main method of treatment in infertile women with PCOS [1-3]. According to the WHO, from 10 to 15% of married couples suffer from infertility. In the conditions of Central Asia, where large families are common and this is traditionally encouraged, childlessness is considered a great misfortune and often leads to family disintegration [4,5]. Up to 20-25% of women with PCOS are resistant to clomiphene citrate [6,7].
Materials and Research Methods
Our randomized trials were carried out in the central polyclinic of Urgench from 2018 to 2020. It included 40 clomiphene-resistant women with PCOS. In group I (n = 20) women, we used clomiphene citrate 100mg + recombinant follicle-stimulating hormone p FSH 37.5 IU / day. Group II (n = 20) received only p FSH 37.5 using a low dose escalating protocol. Informed written consent was obtained from all patients. Women were considered clomiphene resistant if ovulation did not occur when taking CC at a dose of 150 mg / day. PCOS was diagnosed based on the Rotterdam criteria, in which at least 2 of the following three criteria were met: 1) Oligo menorrhea (a cycle lasting 35 or more days) and / or amenorrhea (absence of menstruation for 6 or more months); 2) Hyperandrogenism (defined as a Ferriman-Gallvi index of more than 8) which is clinically manifested by acne / hirsutism and / or biochemical – the determination of testosterone in the blood serum of more than 0.7ng / mg; 3) Sonographic manifestations of polycystic ovary: if the ovary contains 12 or more follicles with a diameter of 2 to 9 mm and / or the volume of the ovaries is more than 10 ml. Inclusion criteria are, clomiphene citrate resistant women with PCOS aged 20 to 38 years, BMI, no previous ovulation induction, partners with normal sperm counts according to WHO standards, opening of the fallopian tubes (confirmed by hysterosalpingography in the previous 6 months), without presence operations on the genitals. The exclusion criterion is the presence of any factors of infertility, except for CV-resistant women with PCOS. The study also included the measurement of blood pressure, abdominal circumference, hormonal study of the serum of patients such as basal FSH, LH / FSH ratio, free testosterone (T), insulin, progesterone, AMG on the 3rd day of the menstrual cycle. HDL High Density Lipoproteins, serum estradiol was determined on the day of ovulation trigger administration. Insulin resistance (HOMA-IR) was determined as follows: HOMA-IR = fasting insulin (IU / ml) x fasting glucose (mol / l) / 22.5. Ultrasound of the ovaries with a transvaginal sensor on the 2nd – 3rd day of the menstrual cycle to assess the number of antral follicles with a diameter of 2 to 9 mm (in an amount of 12 or more is considered polycystic) and an assessment of the volume of the ovary, which is determined by measuring three perpendicularly directed ovarian diameters and applying the formula: D1xD2xD3x0.5236.
Results of the Study
(Table 1) shows the results of clinical and laboratory studies of both groups, which reflects the average age of a woman, type of infertility, BMI, abdominal circumference, ovarian volume, type of menstruation disorder, hormonal and biochemical studies (Table 1). As our study showed, group I (CC + rFSH) received a lower dose of rFSH (532.5 ± 315) and the duration of stimulation days (12.34 ± 4.5) was less than in group II (18.42 ± 6.2 days of stimulation). The number of growth of the middle and dominant follicle, the thickness of the endometrium, the number of ovulations and the frequency of pregnancy are shown in (Table 2). The study showed that the dose of gonadotropin preparations for obtaining ovulation can be reduced by the simultaneous administration of CC + rFSH.
Table 1: Results of clinical and laboratory studies.
Table 2: Induction cycle indicators with results.
Conclusion
The combined administration of CC + rFSH in clomipheneresistant women with PCOS compared to the use of rFSH alone, gives higher ovulation rates and lower financial costs. The use of this protocol enables monofollicular growth and a decrease in the risk of multiple pregnancies and, in turn, is the prevention of ovarian hyper stimulation.
Coats Disease in Young Patient with Congenital Cataracts History
Case Report
He is 14-year-old boy, attended at the Ophthalmology Unit of High Specialty at Hospital Civil de Guadalajara Fray Antonio Alcalde since 2013. He had an ophthalmologic precedent of bilateral congenital cataract, treated with cataract faco aspiration and capsular bag implantation of intraocular lens (IOL) of both eyes in the same year, as well as correction of air lenses after the surgical procedure and visual therapy, with adequate evolution. Nevertheless, the patient loses his follow up as of 2018. Later, in May 2021 he requests a new assessment due to progressive visual loss of the right eye of 5 months of evolution, with no other association. Left eye reports no symptomatology. Other personal precedents without significant data.
Ophthalmologic Exploration
Best corrected VA OD 20/400, OS 20/30. No alterations in OU eyelids and annexes, eucromic conjunctiva, clear cornea, formed anterior chamber, isochoric pupils, nomoreflectic, Pseudofaquia, intraocular lens in capsular bag (Figures 1 and 2).
Figure 1: Clinical picture of IOL in situ, opacity of posterior capsule is observed, as well as fibrosis with free visual axis right eye (A), left eye (B).
Figure 2: fundus image: right eye (A), left eye (B).
Fundoscopy
OD clear vitreous, isochoric pupil, normochromic, retina with exudation at inferior and superior temporal arcade level with presence of vascular tortuosity, macular exudates. OS without alterations (Figures 3-5). In ultrasound of OD, we observe normal ocular globe contour, with intraocular lens of posterior chamber, vitreous with small mobile condensations of low reflection, thickened retina due to important cystic edema with macular involvement, thickened choroid secondary edema, irregular papilla. OS is reported without alterations (Figure 4). Macular spectral domain ocular coherence tomography of OD, where 242-micron central foveal thickness is observed, in presence of intra-retinal cysts and sub-retinal fluid.
Figure 3: Mode B ultrasound, right eye (A), left eye (B).
Figure 4: Macular SD- OCT.
OS with central foveal thickness of 286-micron, within normal parameters (Figure 4). In the fluorescein angiography (FA) of OD we observe retinal vessels with dilation and leaks, with telangiectasias in retina surrounded by hard exudates, in peripheric retina with hyperfluorescent zones corresponding with areas of capillary closure. FA of the OS is observed without alterations (Figure 5) In accordance with clinical characteristics of the patient, as well as findings in complementary studies, Coats disease is diagnosed. Treatment with scheme of intra vitreous anti-VEGF (Aflibercept) of OD, and with previous informed acceptance from his parents, first dose was applied on Aug 05, 2021. After three weeks he is evaluated, and patient refers recovery of visual quality. Nevertheless, BCVA of OD didn´t improve further than 20/400. A second dose of anti-VEGF was applied in September 2021. He was evaluated one week later presenting vision improvement, with a BCVA 20/200 and reduction of retinal exudation as shown in Figure 6.
Figure 5: Fundus images, right eye (A1), left eye (B1). Red-free images of the retina, right eye (A2), left eye (B2). Flouoresceine angiography of right eye (A3- A6), left eye (B3- B6).
Figure 6: Fundus image A) and macular SD OCT (B) of the right eye.
Discussion
Coats Disease is a retinal vascular disease, characterized by telangiectasias and vascular leaks that lead to exudation. It is typically found in young males, between the first and second decade of life, with a peak of incidence between 5 and 11 years old. In 85- 90% of patients, it is a unilateral affectation. In cases of bilateral disease, the other eye shows no symptoms with slight telangiectasic changes in the periphery. There is no preference for race, and is a sporadic non inherited condition, without systemic association; the gold standard for the diagnosis of this disease is the eye fundus clinical exploration through direct ophthalmoscopy [1,2] and as our patient fitted in the above-mentioned characteristics, the diagnosis of Coats has reached. However, there are very few reports regarding the association of this pathology with the presentation of Congenital cataracts, even less in a bilateral way, as is the case of our patient [3,4]. The etiology of Coats disease is not completely defined; however, it is well known that retinal vascular leak is one of the main pathologic processes found in this disease. Several studies have been recently found that where an increase of cytokines is evidenced in the aqueous humor of patients with Coats disease, mainly the vascular endothelial growth factor (VEGF) of the aqueous humor was strongly elevated in this entity and had correlation with the extension of the retinal exudation. Tingy Liang et al. analyzed the aqueous humor of two groups of patients. One of them had 36 patients with Coats disease and another one with 15 patients as a control group with congenital cataract. Concentrations of 22 different cytokines, of which, concentrations of 8 cytokines (VEGF, IL-6, IL-8, MCP-1, MIP-1α, IP-10, VCAM-1 e ICAM-1) were significantly higher in the group of Coats disease, however, significant differences were observed in bFGF, TNF-a and IFN-y between the group of Coats disease and the control group, being this of importance for our patient since he presented both diseases and thus the use of anti-VEGF drugs for his treatment is sustained [5]. Broadly speaking, the objective of the treatment for slight and moderate disease is preservation of the vision and prevention of progression of the disease as retinal detachment and all the other complications already mentioned. That is why treatment is focused in ablation of the actual abnormal vasculature of the retina by means of photocoagulation with laser and cryotherapy. However, the innovative therapy is the use of intra vitreous VEGF, which is also recommended as a contributory manner with the traditional therapies already mentioned, since it seems to reduce macular edema and exudates, stabilize visual acuity and enhance regression of abnormal vessels, as observed in our patient, with a vision improvement and reduction of posterior retinal exudation to the first dose of intra vitreous anti-VEGF. Even though a complete regression of the disease is not expected, our objective is to stop progression and avoid appearance of future complications. [2,6,7]. Even though association of the appearance of cataracts is reported, after presentation of Coats disease, as mentioned by Daruich A. et al. [7], inverse association (that means, late presentation of Coats disease with bilateral congenic cataracts background) without a syndromic association is very rare.
Overview of Carbapenem-Resistant Enterobacteriaceae
Introduction
Respiratory infection is one of the most common diseases in the world, with high incidence and mortality. Enterobacteriaceae is the most clinically important gram-negative pathogenic bacteria, which are increasingly being reported worldwide. Antimicrobial resistance is globally recognized as one of the greatest threats to public health. For years, carbapenems have been used successfully to treat infections due to resistant Enterobacteriaceae, such as Escherichia coli and Klebsiella pneumoniae. However, recently Carbapenem-resistant Enterobacteriaceae have emerged, which confer broad resistance to most ß-lactam antibiotics including lastline carbapenems. Carbapenem-resistant Enterobacteriaceae refers to Enterobacteriaceae that are resistant to any drug of ertapenem, Doripenem, imipenem, meropenem, or enterobacteriaceae that produce carbapenemase. Infection with Carbapenem-resistant Enterobacteriaceae is emerging as an important challenge in healthcare settings and a growing concern worldwide, it is very easy to spread in patients with long-term hospitalization or low immunity, leading to nosocomial infection, and may even cause a small- or large-scale outbreak [1-3]. Most Enterobacteriaceae belong to the normal flora in the intestinal tract and can become opportunistic pathogens once the body’s immunity declines. Enterobacteriaceae obtain genetic material mainly by horizontal gene transfer mediated by plasmids and transposons [4] Carbapenem-resistant Enterobacteriaceae can cause a number of serious infection types (such as pneumonia, abdominal cavity infection, urinary tract infections, Bloodstream infection, skin and soft tissue infection, central nervous system infection, and device-associated infections) or asymptomatic colonization, among which Ventilator-associated pneumonia (VAP) was the most common [5]. Severe pneumonia has always been a common respiratory disease, which can endanger life. Statistics [6] show that infectious diseases account for 30% of all deaths worldwide, with severe pneumonia leading the way. Carbapenem-resistant Enterobacteriaceae infection was reported in 68.8% of patients with hospital acquired bacterial pneumonia [7]. Consistent mortality rates of 40-50% are observed among inpatients with infections caused by CRE in hospitals worldwide, while the mortality rate from CRE infection in pneumonia patients is as high as 60% [8]. Carbapenem-resistant Enterobacteriaceae infection is a very difficult problem in clinical practice.
Risk Factors of Acquisition of CRE Infection
There are a number of factors that predispose persons to infections by CRE. Exposure to these resistant organisms can cause serious infections in patients with the following reported risk factors: immune-suppression, advanced age, admission to intensive care unit (ICU), mechanical ventilation, previous exposure to antimicrobials, organ or stem-cell transplantation and prolonged hospital stays. Healthcare associated infections caused by CRE, mainly Klebsiella pneumoniae, have been encountered most commonly in ventilator-associated pneumonia, bacteremia, urinary tract and surgical site infections. Growing evidence suggests early detection of CRE-colonized patients on admission to long-term care facilities may help to prevent institutional outbreaks and limit regional spread of this emerging public health threat. Respiratory disease is one of the risk factors for CRE infection, probably because a variety of bacteria grow in the respiratory tract and maintain a dynamic balance in the body. Elderly patients with respiratory diseases have low immunity and are vulnerable to infection. Moreover, most patients with respiratory diseases have a history of invasive operation. When tracheotomy or endotracheal intubation is performed, the respiratory mucosa will be damaged, resulting in a variety of complications. Some bacteria are easy to form biofilm in the open airway, which leads to abnormal expression of outer membrane pore protein and bacterial drug resistance. In particular, frequent aerosol inhalation and other operations change the airway environment, requiring frequent contact with patients by medical staff, which makes patients susceptible to colonization and infection by multi-resistant bacteria.
Prevention and Control measures for CRE Infections
2.1 There are reports which suggest that overuse of carbapenems is closely related to the incidence of CRE infection, and unreasonable use of carbapenems can easily induce bacterial resistance and spread [9]. One of the chief difficulties in the treatment of CRE is the excessive use of antibiotics, not only those acquired by the community but also in hospitals. On the one hand, the use of broad-spectrum antibiotics can kill the sensitive bacteria, and the resistant bacteria can survive and become the dominant growth, thus increasing the probability of CRE infection. On the other hand, drug resistance may occur due to the change of drug binding sites after drug use, resulting in carbapenemases and other drug resistance mechanisms [10]. Growing evidence suggests that carbapenem-resistant Gram-negative bacteria are sufficient to develop in the intestinal flora of intensive care patients just a few days of application of carbapenems antibiotics [11]. Therefore, it is necessary to strengthen the supervision and management of clinical application of carbapenems, and strictly implement the classification of antibiotics and the management of doctors’ prescribing rights, limiting the over-use and abuse of antibiotics in humans and agriculture.
Standardized Collection and Correct Interpretation of Microbial Test Reports
Specimens should be collected before antibiotic treatment, sterile site specimens should be collected as far as possible and microbial reports should be correctly interpreted, eliminating contamination and colonization and avoiding unnecessary use of antibiotics. Therefore, clinical microbiology laboratories at all levels of medical institutions should establish the ability to receive and process microbial specimens within 24 hours. There are reports which suggest that that patient carrying other multidrug-resistant bacteria are mostly in serious and complex conditions, with low immunity and relatively long stay in intensive care units, leading to the development of CRE. Therefore, it is necessary to strengthen the contact and isolation of MDR-resistant bacteria to avoid the spread of MDR-resistant bacteria in hospitals. Hand hygiene is the simplest, most effective, most convenient and economical method to control the infection in hospitals, which can significantly reduce the incidence of CRE infection. Mobile water sinks, non-contact faucets, hand sanitizers, hand drying facilities, quick-drying hand disinfectants, and related charts can reduce the colonization rate of CRE [12]. Studies show that the wash basin and its surrounding environment are seriously polluted, which is an important source of CRE pollution. Therefore, medical institutions should pay attention to the cleaning, disinfection and management of the location of the sink in the diagnosis and treatment area, taking anti-splash measures. Symptomatic colonized patients can become potential sources of infection. The significance of active screening lies in early identification of CRE colonized patients so that timely isolation measures can be taken to reduce the risk of transmission. Stool is the best specimen for active screening, and if not readily available, a rectal swab is taken. If the patient has a definite history of CRE infection, specimens from the infected site should be screened again. Patients with positive initial screening and hospitalized for less than 30 days do not need further screening, while patients hospitalized for more than 30 days were screened once a month. Those who have been screened negative for the first time should be screened regularly, either once a week or every two weeks, or twice a week, depending on the severity of the outbreak. Health care facilities should implement isolation of all CRE infected/colonized persons. Isolation refers not only to the establishment of physical spatial barriers, but also to the strict enforcement of isolation measures.
Treatment Options for CRE Infections
There are numerous different types of carbapenemase enzymes, each conferring varying spectrums of resistance. In general, the presence of a carbapenemase confers broad resistance to most ß-lactam antibiotics including penicillins, cephalosporins, and the monobactam aztreonam (excluding metallo-β-lactamases [MBLs] and oxacillinases [OXAs]) [13]. At present, the main drugs for the treatment of CRE in the world are polymyxins, Tigecycline, fosfomycin, Ceftazidime-Avibatam and aminoglycoside antibiotics. Polymyxins and tigecycline were highly sensitive to CRE in vitro and were not affected by the type of carbapenemases produced by bacteria. Due to heterogeneous drug resistance and positive correlation between dose and renal toxicity, polymyxins are often used in combination with other antibacterial agents. The conventional dose of tigecycline is difficult to reach sufficient concentration in the areas including the blood flow and alveolar lining fluid, so it is often necessary to increase the dose and use it in combination with other drugs. Ceftazidime-avibactam lacks effective antibacterial activity against metalloenzyme-producing CRE, so it may be an important choice for the treatment of nonmetalloenzyme- producing CRE infection. The most common adverse drug reactions of Ceftazidime-avibactam in trials were vomiting, nausea, constipation, and anxiety [14]. Combination therapy for CRE infections may decrease mortality compared with monotherapy. Benefits of combination therapy include reduction of initial inappropriate antimicrobial therapy, potential synergistic effects, and suppression of emerging resistance [15]. For patients who are critically ill or with deep-seated infections, consider empiric and antibiogram-directed combination therapy with 3 drugs, basing on antimicrobial sensitivity results. Polymyxins may be most effective as part of a combination for serious CRE infections [15,16].
Conclusion
In summary, the burden of carbapenem-resistant Enterobacteriaceae is increasing rapidly worldwide. CRE is widely spread and is now a major factor in morbidity and mortality in health-care settings. The results at present are still not good, especially in elderly patients with a history of CRE infection. The extremely high mortality rates of patients with CRE infections have driven efforts to prevent the acquisition and spread of these bacteria in hospitals. Although the above measures are simple, they can prevent the spread of CRE to some extent. However, continued research is desperately needed to determine the most appropriate treatment for serious CRE infections.
Oscillatory Diffusion and Chemical Vortices in Multicomponent Plasma
Introduction
Often laboratory and astrophysical plasmas are multicomponent, and diffusion of elements is important for some phenomena. For instance, diffusion processes can lead to chemical inhomogeneities and, as a result, to change the emission, heat transport, and conductivity [1-3]. In thermonuclear fusion, the source of impurities is usually the chamber walls, and diffusion determines the distribution impurities [4-6]. Even a small number of heavy ions influences the rate of radiative losses in plasma and changes its thermal properties. In astrophysical conditions, chemical inhomogeneities have been detected in the surface layers of many stars of various spectral types. It is widely accepted that these inhomogeneities are determined by diffusion processes but, however, the mechanisms resulting information of chemical spots is still uncertain. Diffusion in plasma can differ qualitatively from that in neutral gases because of the presence of charged particles – electrons. This particularly concerns hydrogen plasma [7]. In such plasma, the influence of electrons on diffusion of heavy ions is especially pronounced. Chemical inhomogeneities can appear because of various reasons, for instance, it is often thought that chemical spots occur due to the presence of magnetic fields. The magnetic field B can magnetize electrons and produce a non-uniform distribution of ions. Anisotropy of transport is characterized by the Hall parameter, xe =ωBeτ where is the gyrofrequency of electrons and τe is their relaxation time. In hydrogen plasma, where n and T are the number density and temperature of electrons, respectively, L is the Coulomb logarithm. The current-driven diffusion can lead to a formation of chemical inhomogeneities like other diffusion processes. Using a simple model, we show that the interaction of the current and field with impurities leads to their diffusion in the direction perpendicular to both. This type of diffusion can contribute to formation of chemical spots even in a relatively weak magnetic field with xe << 1. We also show that such diffusion can be accompanied by a particular type of waves in which only the impurity number density oscillates.
Formulation of the Problem and Basic Equations
Consider a cylindrical magnetic configuration with the field in a z-direction, are cylindrical coordinates and the corresponding unit vectors. Then, the electric current is given by
If jϕ → 0 at large s then B→ B0 =const at s→∞. Note that such magnetic configurations can be unstable for some dependences B(s) [9-11] but we assume that the instability does not occur for chosen dependencies B(s). Plasma is assumed to be fully ionized and consists of electrons e, protons p, and small amount of heavy ions i. A small admixture of heavy ions does not influence the dynamics of a background hydrogen plasma and these ions can be considered as test particles. The partial momentum equations in ionized plasma have been discussed by [7,12]. The paper [12] considers transport processes in the hydrogen-helium plasma but the derived equations describe the hydrogen plasma with a small admixture of heavy test ions. Then, the partial momentum equation for ions i has the form
where is the velocity, Zi is the charge of the species i, pi and ni are the partial pressure and number density, respectively, and is the electric field; is the external force on species i. We neglect the external force in our model since its influence is often insignificant. The forces and are caused by the interaction of ions i with electrons and protons, respectively. The forces and are internal and their sum over all components is zero.
The velocity can be represented as a sum of and where is the hydrodynamic velocity of plasma and ~V i is a diffusive velocity of ions i relative plasma. Since in our model ni is small compared to np, the hydrodynamic velocity is approximately equal to the mean velocity of protons, . In this paper, we assume that background plasma is in hydrostatic equilibrium. Then, = 0 and, hence, . If the temperature is uniform, the friction force has only a component proportional to the relative velocity of ions i and protons, . This force can be easily calculated if Ai = mi /mp >>1. Since the velocity of a background plasma is zero, can be represented as
[12], where is the characteristic time of scattering between protons and heavy ions; L is assumed to be the same for all types of scattering.
The friction force on the l.h.s of Eq. (2), , can be estimated as and the first term in this equation is where Dt is the timescale of diffusion processes. Therefore, this term is much smaller than the friction force . The second term on the l.h.s. of Eq. (2) is of the order of where L is the characteristic length scale. Since L ~ Vi Δt , this term can also be neglected if . Then, Eq. (2) transforms into
If ni << np , then, is given by [12], where is the force acting on the electrons. Since ni<< n, is determined by scattering of electrons on protons but scattering of electrons on heavy ions gives a small contribution. Therefore, one can use for the expression obtained by [7] for one-component plasma. In the case of a cylindrical isothermal configuration, this force reads
where is the velocity of electric current; ; coefficients α ⊥ and α ∧ have been calculated by Braginskii [7]. The force (5) is caused a friction due to a relative motion of the electron and proton gases. Then, Eq.(1) yields for the current velocity
Consider the current-driven diffusion in a magnetic field with xe <<1 . Substituting into Eq.(5) and using coefficients α ⊥, ∧ we obtain with the accuracy in linear terms in xe
The momentum equation for the species i (Eq.(4)) depends on s E and Eϕ components of the electric field. The momentum equations for e and p, containing these electric fields, read
Using Eq. (5), we obtain
Substituting Eqs.(6), (3), and (9) into the s- and ϕ -components of Eq.(4), we arrive to the expression for a diffusion velocity, ,
Vni is the standard diffusion velocity and VB is the velocity of diffusion caused by the current. The corresponding diffusion coefficients are
where .
Distribution of Ions Under the Influence of Electric Currents
The condition of hydrostatic equilibrium reads in our model
where p and r are the total pressure and density of plasma, respectively. In hydrogen plasma, we have p ≈ 2nkB T where kB is the Boltzmann constant. Integrating Eq. (14) and assuming the temperature to be constant, we obtain
where are the values of (p, n, T, b) at s → ∞.
Consider the distribution of elements in equilibrium. Since Vis = 0 in equilibrium, Eq.(10) yields
The r.h.s. is responsible for the influence of currents on the distribution of impurities. One has from Eq. (16)
Taking into account Eq. (16) and integrating Eq.(17), we have
where μ = − 2Zi (0.21Zi− 0.71) and ni0 is ni at s →∞. If the local abundance of i is γi = ni/ n , then taking into account Eq. (17), obtain
where γi0 = ni0 /n Local abundances depend essentially on the field strength. These dependences are particular sensitive to B in the case of heavy ions with large charge numbers. If other diffusion mechanisms are negligible, then the exponent (μ − 1) reaches large negative values for large Zi and, as a result, strong abundance anormalies can be produced in this case. For instance, (μ − 1) is equal 1.16, -0.52, and -2.04 for Zi =2, 3, and 4, respectively. Note that (μ − 1) changes its sign with an increase of Zi : (μ − 1) > 0 if Zi = 2 but (μ − 1) < 0 for Zi ≥ 3. Therefore, elements with Zi ≥ 3 are in deficit (γi <γi0 ) in the region with a weak magnetic field (B < B0) but these elements should be overabundant in the region with a stronger field, B > B0.
Eq. (20) describes the distribution of impurities in diffusive equilibrium. The characteristic timescale to reach this equilibrium, tB, can be estimated as
where L is the length scale of the magnetic field, L = |d In B/ds|-1 . The characteristic timescale of baro-diffusion is given by the wellknown expression
Hence, the current-driven diffusion operates on a shorter timescale if DB > D or
where cs is the sound speed, . Therefore, the current-driven diffusion is more efficient if the magnetic pressure exceeds the gas pressure.
Chemical Vortices
In our simplified model of cylindrical magnetic configuration and velocity (10), the continuity equation for ions i has the form
Consider the behaviour of small perturbations of ni by making use of a linear analysis of Eq. (23). In the unperturbed state, we assume that plasma is in a diffusive equilibrium and, therefore„ the unperturbed impurity number density satisfies Eq. (18). For the sake of simplicity, we assume that small perturnations are independent of z. Denoting disturbances of the impurity number density by i δ n and linearizing Eq.(23), we obtain the equation that describes the evolution of such small perturbations,
Consider only disturbances with a short radial wavelength. If this wavelength is shorter than the length scale of unperturbed quantities, then we can use the so-called local approximation. Then small disturbances are α exp(−iks)where k is the radial wavevector, ks >>1. Since the basic state does not depend on time and ϕ , perturbations can be represented in the form where m is the azimuthal wavenumber and ω should be calculated from the dispersion equation. Such disturbances have a shape of cylindrical vortices of a chemical composition. Substituting i δ n into Eq. (24), we derive the dispersion equation for such perturbations in the form
This dispersion equation describes a special type of magnetohydrodynamic waves where only the number density of impurities oscillates. Note that there are many different sorts of waves in magnetized plasma that can produce oscillations of a chemical composition. Such oscillations, for example, can be generated by standard magnetohydrodynamic waves [12] but, usually, fluctuations of impurities in such waves are accompanied by fluctuations of other hydrodynamic quantities. Indeed, the electric field has actively to take part in such waves and interact more efficiently with heavily charged ions than with protons. As a result, MHD waves can produce fluctuations of a chemical composition. However, these fluctuations are typically very small because the period of MHD waves is much shorter than the diffusion timescale. Chemical fluctuations become significant only if the period of a wave is comparable to the diffusion timescale. The waves considered in this paper are caused by diffusion processes and their period is generally comparable to the diffusion timescale. Therefore, fluctuations of a chemical composition can reach a significant value in such waves. The quantity ωR is responsible for decay of these waves with the timescale typical for standard diffusion. The frequencies ωI and ωH describe oscillations of the impurities caused by the combined action of electric current and the Hall effect. The considered waves are oscillatory if | ωI + ωH|> ωR. The latter condition is equivalent to
Therefore, the waves are oscillatory if the magnetic pressure is substantially greater than the gas pressure. The frequency of diffusion waves is higher in the region where the magnetic field has strong gradients. The order of estimate of ωI is
Where li = ciτi Note that different impurities in such waves oscillate with different frequencies.
Conclusion
Diffusion of heavy ions in plasma under the influence of the current-driven mechanism has a number of features. Generally, the diffusion velocity can be comparable to (or even greater than) that caused by other diffusion mechanisms. The currentdriven mechanism can lead to a formation of chemical spot even if the magnetic field is relatively weak. Note that other diffusion mechanisms usually require a much stronger magnetic field. The current-driven 83 diffusion is caused by the Hall effect and electric current and, therefore, it leads to diffusion of heavy ions in the direction perpendicular to both the magnetic field and current. Therefore, a distribution of elements is determined by a geometry of the magnetic fields and electric currents. Chemical inhomogeneities can manifest themself, for instance, by a nonuniform distribution of plasma temperature and emission. Note that this type of diffusion can be important also in some conductive fluids if the magnetic field is sufficiently strong. Our consideration shows that a special type of magnetohydrodynamic waves may exist in multicomponent plasma.
These waves can be periodic if the magnetic field is sufficiently strong, and they are characterized by oscillations of the impurity number density alone. The frequency of such waves is rather low and is determined by a characteristic diffusion time. The order of magnitude estimates of this frequency yields Lλ where λ = 2π / k is the wavelength. In stellar conditions, such waves can manifest themselves in pecular magnetic stars where the magnetic field is ∼ 104 G and the number density and temperature are ∼ 1014 cm−3 and ∼ 104 K, respectively. If the length scale, L, and λ are of the same order of magnitude (for instance, ∼ 1011 cm), then the period of such compositional waves is ∼ 3 × 10³ yrs. This is much shorter than the magnetic timescale and generation of such waves should lead to short-term spectral variability. Such waves can exist in laboratory plasmas as well, but their frequency is much higher in this case. If B ∼ 105 G, n ∼ 1015 cm−3, T ∼ 106K, and L ∼ l ∼ 102 cm, then the period of compositional waves is ∼ 10−8 s. Note that frequencies of waves with various impurities can differ essentially since they depend on the sort of heavy ions.
In terrestrial conditions, the compositional waves also can manifest themselves by oscillations in spectra. In astrophysical conditions, the magnetic field has usually more complex topology than that considered in our model. In some cases, however, cylindrical magnetic configurations can mimic the magnetic field in certain regions. For example, the field near the magnetic poles in stars has approximately cylindrical symmetry [13] and our results describe qualitatively diffusion in the region near the poles. Therefore, the current-driven mechanism in combination with other diffusion processes contributes to a formation of chemical spots in various types of stars. For example, this mechanism can contribute to formation of element spots in Ap-stars where the magnetic fields have been detected. Also, many neutron stars have strong magnetic fields and topology of these fields is rather complex with spot-like structures at the surface. Such magnetic configurations can be responsible for formation of a spot-like chemical distribution at the surface. For example, evolution of neutron stars is very complicated, particularly, in binary systems [14] and, therefore, their surface chemistry can be complicated as well. Diffusion processes may play an important role in this chemistry.
Palatability Evaluation, DNA Analyses, and Functional Processing of Rice
Evaluation of Palatability of Cooked Rice
Abstract
Rice is one of the most important crops in the world. It is useful not only for the supply of energy, but also for giving palatability and good health to the people. The rice quality depends on various aspects such as consumer safety, nutrition, appearance, price level, and palatability. Sensory test and physico-chemical measurements are important measures for quality assay of rice grains. Sensory test is a fundamental method that requires large amounts of samples, many panel members, and long hours. Physico-chemical measurements estimate the eating quality based on the results of various kinds of measurements, such as chemical composition analyses, cooking quality test, gelatinization property test, and the measurements of physical properties of cooked rice. Novel method to evaluate the quality of the cooked rice is necessary to breed high-quality rice cultivars and to select the suitable rice for each consumer and each utilization purpose. It is necessary to develop the novel method to evaluate the rice quality using various kinds of novel measurements, such as Texture Analyzer, Tensipresser, RVA, NIR, and spectrophotometer. Simple, rapid, and accurate method to assay the quality of rice grains would be very valuable.
Introduction
Rice, wheat, and maize are the most important crops in the world. Rice consumers need not only enough amount of rice but also high-quality rice grains. The many rice cultivars grown in the world vary markedly in their cooking, sensory, and processing quality [1]. Consumers are heterogeneous with respect to their perceived differentiation of rice quality among regions, countries, cities, and urbanization levels [2] The rice quality depends on various aspects such as consumer safety, nutrition, appearance, price level, and palatability. Because rice is eaten every day, it is indispensable that it should be safe to eat and highly nutritious. Furthermore, because rice provides income for farmers and is prepared, milled, and sold by wholesalers and retailers, the rice yield and price are extremely important to the farmers. Consumers have been asking for more palatable rice because they have recently become more affluent. Calingacion et al engaged local experts across the world and they showed that there are at least 18 different quality types of rice that are favored around the world and this complexity immediately reveals the extent of the specificity of consumer preference [3]. As described by Juliano, rice quality evaluation includes eating quality assays for sensory evaluation and aroma testing, as well as physical property measurements using Instron, Texturometer, or Tensipresser etc., which were highlighted as indirect methods, in addition to amylose content, starch gelatinization temperature, gel consistency, amylography, and protein content determination [4]. Ohtsubo et al. reported on the quality assay of rice using traditional and novel tools, such as the measurements of amylose, physical properties and pasting properties [5].
Starch comprises the most abundant component in rice grain and con-sists of am- ylose (linear ƒ¿-1,4-glucan) and amylopectin (highly branched molecule with ƒ¿-1,4 bonds and ƒ¿-1,6 bonds). Apparent amylose content (AAC) is measured by the iodine colorimetric method [6] and high-AAC rice becomes harder and non-sticky on cooking [1,6,7]. Lian et al. investigated on the identification of the main retrogradation-related properties of rice starch and reported that retrogradation rates of different rice starch showed significant positive correlation with proportion of the chains (DP>10) in amy- lopectin [8]. Protein content is another extremely important factor that determines rice quality [1]. Protein contents are measured by Kieldahl method, combustion method or NIR method. As Juliano [8] and Bhattacharya [9] pointed out, the physical properties of cooked rice grains are important determinants of the eating quality of rice. The pasting properties of rice are useful indicators in the quality assay of cooked rice, rice cake, rice bread, rice extrudate, etc. In several countries, such as Australia, China, Japan, and the United States, the RVA has become the standard method with which the rice processing industry and breeding programs determine rice pasting properties [1]. A rapid, simple, and accurate method is required to evaluate rice. Therefore, if a such novel method could be developed, it would become a great help to the producers and the consumers of rice all over the world. Sensory testing is the fundamental method that evaluates the eating quality of rice grains. The members of a trained panel taste cooked rice samples and give scores based on appearance, flavor, taste, hardness, stickiness, and overall sensory evaluation.
Sensory Test and Physicochemical Measurement [10]
Sensory Test: Sensory testing is the fundamental method that evaluates the eating quality of rice grains. The members of a trained panel taste cooked rice samples and give scores based on appearance, flavor, taste, hardness, stickiness, and overall sensory evaluation. The test results can be expressed as numerical values and treated statistically; there are disadvantages to using this test. The results differ depending on the preference of panel members, and the results cannot be directly compared if the time or country differs.
Physicochemical Evaluations: Physicochemical evaluation is only indirect evaluation of rice palatability, its results are common all over the world if we use the same method and apparatus. Physicochemical measurements include component analysis, such as protein, amylose, and fibers, pasting properties of starch, texture measurements of the cooked rice grains, etc. For the sake of estimating the total palatability, statistical treatment is adopted using the results of each measurement as the variables. Multiple regression analysis, principal com-ponent analysis, and PLS analysis are very useful to clarify the characteristics of the rice samples. Recently, spectrophotometric analyses, such as NIR or visible-light spectrometer, are utilized to estimate the chemical components and to develop the estimation formulae for palatability. “Taste Analyzer” is an example of the NIR system as a non-destructive estimation apparatus for palatability of rice grains. Examples of sensory test and physico-chemical evaluation of rice palatability are shown in Table 1.
Table 1: Evaluation of rice palatability.
Amylose Content and Amylopectin Molecular Structure: Amylose content is the most important factor that determines rice quality because starch shares approximately 85% (w/w, dry basis) of the milled rice grains. Because North- east Asian consumers prefer soft and sticky cooked rice, low amylose rice is the dominant rice sold in the rice market. Amylose content is generally measured by the iodine colorimetric method of Juliano [6]. Li, et al. [10] reported that stickiness of cooked rice is affected not only by AAC but also the proportion of short amylopectin chain. They found that the autoclave cooking, which is used to produce sticky “convenience rice”, effects on sensory properties and increase leached amylopectin [11].
Protein Content: Protein content is another extremely important factor that determines the eating quality of rice. Cooked rice with high protein content tends to be hard and non-sticky. Protein content is measured by the Kieldahl or the combustion method. It can be measured by NIR method (Near Infrared Reflectance) easily and non-destructively. Recently, not only protein content, but also molecular compositions of protein, such as glutelin or prolamin, is reported to affect the quality of rice [12,13].
Gelatinization Properties Using an RVA: The RVA (Figure 1) provides various information, for examples, as indicators in cerealbased products, on apparent viscosity of cake batters and quality of flour for cake making, about interactions between starch and other compounds, on extruded products and the measurement of the degree of cook, as quality indicators for hydrocolloids and fibers, for simulation and monitoring of processes, and on enzymatic reactions [14]. Comejo and Rosell used RVA in the research on the influence of germination time of brown rice in relation to flour and gluten free bread quality [15]. Although the Brabender Viscoamylograph has been used to assess rice pasting properties [1], Blakeney, et al. [16] and Champagne, et al. [17] showed that the RVA is useful in determining the “degree of cook” after processing of rice into precooked and extruded products. Yao et al. reported that the high temperature during ripening of rice decreased setback and trough viscosities and increased breakdown, implying that the pasting properties were slightly better [18]. Zhu et al. investigated the effect of soaking and cooking on structure formation of cooked rice through thermal properties, dynamic viscoelasticity, and enzyme activity, in which they used RVA for the measurements of enzyme activity [19].
Figure 1: Rapid visco analyzer (RVA).
Nakamura et al. developed a novel estimation formula for AAC and resistant starch (RS) based on the pasting properties measured by an RVA [20], enabling evaluation of the starch properties and processing suitability of material rice flours. Furthermore, we developed novel estimation formulae for oleic and linoleic acid contents based on the pasting properties of brown rice flours using an RVA, making it possible to predict easily and rapidly the nutritive and bio-functional characteristics of material rice [21]. To evaluate the pasting properties, the behavior of rice starch at temperatures higher than 100 ‹C should be examined to elucidate the changes in rice quality after cooking and processing, such as extrusion cooking [22] or super-heated moisture treatment [23]. Recently, Nakamura et al. reported about the comparison of the three different programs and estimating the hardness and retrogradation of cooked rice based on its pasting properties using a novel high-temperaturetype programs [24]. They have made improvements to analyzing pasting properties in a new program using RVA 4800 (Figure 2), and novel estimation formulae were developed in this paper for estimates of the retrograded hardness of cooked rice H1(R) and the degree of retrogradation H1(RD), which has led to an easy and rapid evaluation of the cooking qualities of various rice samples. The following are the main features; 1. Among the three kinds of RVA programs, Program 2 (120‹C) showed the highest correlations with starch microstructure (Amax), RS, physical properties, and degree of retrogradation of the cooked rice grains. 2. The novel Program 2 (120 ‹C) showed high determination coefficients for hard-ness and the degree of retrogradation of cooked rice grains. 3. The novel RVA Program 2 enables us to estimate easily and rapidly the cooking and processing characteristics of various kinds of rice cultivars. Commercial rice of Japonica rice cultivars Consistency (93°C) Consistency (120°C) Consistency (140°C).
Figure 2: Comparison of “Consistency” among the three programs using an RVA 4800.
Fat Acidity: Fat acidity is a good index to measure the quality deterioration of rice grains during storage. In Japan, newlyharvested rice is preferred to aged rice because consumers like soft and sticky cooked rice. Ohtsubo proposed a new colorimetric method to accurately measure fat acidity [25].
Cooking Quality Test [26]: A cooking quality test was developed by the researchers of USDA in 1950s. An expanded volume and water uptake ratios are measured after cooking rice samples in excess amounts of water. Dissolved amylose is measured by color generation by combining iodine and amylose.
Physical Properties of Cooked Rice Grains: Physical properties of cooked rice grains, such as hardness and stickiness, are measured by a Texturometer, Tensipresser, Texture analyzer, or Rheolograph-micro. Okabe reported the texture measurement of cooked rice and its relationship to eating quality using a Texturometer [27]. Low-compression and high-compression test using a Tensipresser [28] is shown in Figure 3. Recently, Texture Analyser has been used for measuring the physical properties of the cooked rice [29] or the parboiled rice [30]. And dynamic viscoelasticity gives valuable information for the elucidation of the relationship between the texture and the molecular structure of starch, which showed that gconsistency coefficient h affected hardness and tanƒÂ affected stickiness of cooked rice grains [31].
Figure 3: Tensipresser used for texture measurement of cooked rice grains.
Palatability Estimation Formula: Chikubu et al. developed a new equation to estimate the palatability of rice grains using a multiple regression analysis based on physico-chemical measurements, such as an amylograph viscosity profile, protein assay, and iodine blue value measurements [32]. The formula showed a high correlation between the results of a sensory test (R = 0.84) and the rice samples that will be harvested next year.
Application of Near Infra-Red Spectroscopy to Evaluate Rice Quality: Near Infra-red spectroscopy is a rapid, non-destructive, and extremely promising technique to evaluate qualities of the rice grains. In Japan, NIR spectroscopy was initially used to determine the protein and moisture content of the rice flours. Satake Co. Ltd subsequently combined NIR and palatability estimation formula and developed a new system called “Taste Analyser”.
Protein Content: Iwamoto et al. reported that NIR was equally sensitive to both rice and wheat proteins. A standard error of estimation (SEP) was decreased for calibrations using a derivative absorbance. However, the derivative procedure may possibly make an increment bias in cases that predict unknown sam-ples [33]. Inatsu utilized NIR spectroscopy to select palatable rice cultivars by measuring the protein content of rice because low protein rice is preferred in Japan because of their palatability [34].
Estimation of Rice Amylose Contents by NIR [35]: Japanese rice breeders have tried to develop palatable rice cultivars by selecting low amylose rice; however, the amylose contents among Japanese rice grains are not significantly different (15% – 20%). NIR spectroscopy can easily compare protein and moisture; however, it does not easily differentiate amylose from amylopectin. Villareal and Delwiche had already developed excel-lent calibrations to detect amylose in various rice samples through NIR spectroscopy [36,37]. Japanese consumers request high-performance calibration for the measurement of narrow range amylose of Japanese rice cultivars. Ap-parent amylose content (AAC) analysis is a rapid and simple technique uses NIT spectroscopy. It was developed based on the near infrared transmission spectra and the reference value of AAC determined by the iodine colorimetric method. The wide AAC range (0%-35.3%) PLS model was inadequate for the accurate prediction of the extremely narrow range of the AAC (13.2% 20.7%) of Japanese milled rice samples. The statistics performed on the 11 factor PLS model for the extremely narrow range of AAC analyses was 0.78, 0.74, and 2.01 in SECv, r2, and RPD, respectively. The performance of this model was 1.25 and 0.49 for SEP and r2, respectively, on the validation set. The previous models developed a wide range of AAC samples, which were difficult to apply to the narrow range of AAC rice. The present AAC analysis technique is based on NIT spectroscopy, which can discriminate between the extremely narrow differences in AAC of Japanese milled rice in the same sub family.
Eating Quality Evaluation System by NIR: Satake Co. Ltd. Developed a taste analyser in the 1980s that combined the palatability estimation formula that was based on the physicochemical measurements and NIR. The taste analyzer principle is based on the multiple regression analysis that uses NIR data (protein, moisture, amylose and fat acidity) against the sensory test results. A previous study by the Japanese As-sociation of Milling Companies evaluated 3 different types of palatability evaluation system using NIR. The results showed that the taste scores significantly correlated significantly with the results of the sensory test (r = 0.54 to 0.63), but the scores were affected by the moisture contents and milling yield [38]. There were 8 Japanese 2 companies that developed the characteristic systems to evaluate the palatability of rice 3 grains based on the spectroscopic technique. More than 1000 agricultural cooperatives, 4 wholesalers, and retailers introduced these NIR systems to evaluate the quality of their rice 5 grains (Figure 4). In 1996, the Japanese Food Agency conducted a survey regarding the palatability evaluation system, and the results showed that 67% users were satisfied with the performance of the system. The protein and moisture data were extremely reliable, but 8 some users requested an improvement in the taste score and amylase accuracy.
Figure 4: Taste Analyzer using NIR technology (Satake Co.).
Proposal as Novel Physicochemical Measurement, Iodine Colorimetric Analysis, for Rice Palatability Evaluation [39]
Introduction: As described in section 3, physicochemical test is very important because it is time- saving and labor-saving objective test for rice palatability. Main component of rice grains is starch, therefore, amylose content affects eating quality [6]. Low-amylose rice generally be-comes soft and sticky after cooking, whereas high-amylose rice be-comes hard with fluffy separated grains [40]. The most widely used method for amylose determination is a colorimetric assay where io-dine binds with amylose to produce a blue-purple color, which is measured spectrophotometrically at a single wavelength (620nm) [6]. Nakamura et al. characterized the starch of various rice cultivars; evaluated the relationship between their iodine absorption curve and apparent amylose contents, amylopectin fractions, and resistant starch. They improved the iodine colorimetric method, and developed the novel estimation formulae against the amylose contents, resistant starch or certain fractions of definite chain-length amylopectin. This novel method would lead to an easy and low-cost spectroscopic method for analyses of starch characteristics.
Figure 5: Estimation of apparent amylose contents based on iodine colorimetric analyses.
Iodine Scanning Colorimetric Measurement: Nakamura et al. used Japonica rice, Iindica rice, Indi-ca-Japonica hybrid rice, ae mutant rice, and waxy rice produced in Japan and China. They found that the iodine absorption curve differed between the Indica rice, Japonica rice, Japonica-Indica hybrid rice, ae mutant rice cultivars, and glutinous rice cultivars. And they proposed a novel index, “new max” based on iodine absorption curve, which shows higher correlation with amylose, resistant starch or CD of amylopectin than ordinary max. Furthermore, they developed the novel estimation formulae for AAC, RS contents, amylopectin chain lengths (Fa; DP<12, Fb3; DP>37), and fraction of DP10 (short chain glucans of amylopectin) and fraction of DP22 (medium chain glucans of amylopectin) based on the iodine absorption curve. These formulae would lead to an easy and low-cost spectroscopic method for the starch characteristics [39] (Figure 5).
Examples of Physicochemical Measurements of Rice Palatability
Comparison of Physicochemical Properties between Japanese and Chinese Rice Cultivars: As described in section 3, in the case of physicochemical evaluation, we can get the common results for the rice samples produced in the different countries if we use the same method. As an example, we report the results of physicochemical measurements of rice pal- atability using rice samples produced in Japan and China. China is the largest riceproducing country, accounting for 32% of the global production from 20% of the global rice-growing area. China produces Indica subspecies mainly in the southern region and Japonica subspecies mainly in the northern region (Heilongjiang, Liaoning), and eastern or southern region (Jilin, Jiangsu, Zhejiang, and Yunnan), whereas the other three countries, India, Indonesia, and Bangradesh, primarily grow Indica rice. In China, consumers are now choosing Japonica rice based on its shape and color as well as its texture and taste. Zhang et al. performed a sensory test of Chinese Japonica rice cultivars [41], in which a Chinese panel mainly determined the overall eating quality based on the stickiness and hardness. In the present section, we conducted physicochemical evaluations of some Chinese and Japanese Japonica rice cultivars using traditional and novel indicators based on the iodine absorption curve and RVA.
Recently, Nakamura et al. evaluated 16 Japanese and Chinese rice cultivars in terms of their main chemical components, iodine absorption curve, apparent amylose content (AAC), pasting property, resistant starch content, texture of cooked rice grains, and SDS PAGE of proteins [42]. Based on these quality evaluations, we can conclude that Chinese rice cultivars are characterized by their high protein content. The hardness of the surface layer (H1) and overall layer (H2) were higher in the Chinese rice cultivars than the Japanese rice cultivars, whereas the stickiness of the surface layer, and the balance degree of the surface layer were lower in the Chinese rice cultivars than the Japanese rice cultivars, although the stickiness of the overall layer |H2 was higher in the Chinese rice cultivars than the Japanese rice cultivars. In addition, rate of staling of cooked rice was faster for Chinese rice than Japanese one. In a previous study, they developed a novel formula for estimating AAC based on the iodine absorption curve [39]. The validation test showed a determination coefficient of 0.996 for estimating AAC of these Chinese rice cultivars as unknown samples as shown in Figure 6. Therefore, it became possible to estimate AAC, using iodine scanning colorimetric method [39], or the RVA method [20], easily and rapidly not only for Japanese rice but also various japonica rice cultivars produced in all over the world.
Figure 6: Validation test of the formula for estimating AAC in Chinese rice cultivars.
Summary of Evaluation of Rice Palatability
There are various kinds of rice cultivars of which qualities are diversified, such as hard Indica rice and soft Japonica rice in the world. Consumers in the Southern Asia prefer to hard rice grains and people in the North-eastern Asia like soft and sticky rice grains. Novel method to evaluate the quality of the cooked rice is necessary to breed high-quality rice cultivars and to select the suitable rice for each consumer and each purpose. Many researchers are trying to develop the novel method to evaluate the rice quality using various kinds of apparatus, such as Tensipresser, RVA, NIR, and spectrophotometer, etc. Simple, rapid, and accurate method to evaluate the quality of rice grains is very valuable.
Cultivar Identification of Rice (Oryza Sativa L.) by PCR Method and its Application to Processed Rice Products
Abstract
As the cultivars of rice affect markedly eating quality, processing suit-ability and price, identification or differentiation of rice cultivar is very important. The present authors developed suitable STS (sequence-tagged-site) primers for PCR (Polymerase Chainm Reaction) and it became possible to identify rice cultivar using template DNA extracted and purified from rice grains. Multiplex primer set was shown to be useful to differentiate effectively rice cultivars produced in various countries by PCR. Two kinds of multiplex kit for identification of “Koshihikari”, dominant cultivar in Japan, have been developed. Application of cultivar identification method by PCR method to processed rice products was investigated. The present authors developed “enzyme treatment method”, in which the gelatinized starch is decomposed by the heat stable alpha-amylase at 80°C, followed by hydrolysis of proteins by proteinase K with SDS and purification of extracted DNAs by PCI (Phenol/Chloroform/iso-amyl alcohol). It became possible to identify the material rice cultivars of the processed rice products, such as cooked rice and rice cake, by PCR method using template DNA prepared by the “enzyme treatment method” [43].
Introduction
Rice grains of the famous cultivars are traded or distributed at higher price as “Premium rice” than the ordinary rice because of their high palatability, processing suitability or special aroma, etc. As those premium rice grains sell at high price, some dishonest rice wholesalers or retailers blend low quality cheap rice to high quality premium rice and mislabel to be “high-quality premium rice”. Recently, rice consumers are tend to demand more information, such as cultivar name, location of production, year of production, etc., about rice which they purchase. For example, it is obliged to display the name of rice cultivar on its package under the JAS LAW (Law Concerning Standardization and Proper Labeling of Agricultural and Forestry Products in Japan). Therefore, technology to identify rice cultivar is very important for breeders, farmers, inspectors, wholesalers, retailers, food industries and consumers. Rice cultivar has been identified based on morphological characteristics of rice plant or grains, ripening ratio after crossing, or the isozyme patterns, etc. Cultivated rice (Oryza sativa L.) is one of the most polymorphic crop species in the world.
On the contrary, many high-quality rice or premium rice is closely related because inbred lines are often used for their development. Therefore, it is necessary to develop a time-saving technology to differentiate rice cultivars clearly and precisely. DNA fingerprinting was developed in 1985 [44] and is used for criminal investigation and trial at court. Recently, novel cultivar identification method based on DNA polymorphism has been developed accompanied with the progress in molecular biology. DNA-based markers have the obvious advantage of sampling the genome directly and RFLP analysis has been widely used for assessing variation of plants [45,46].
RFLP analysis has been used to distinguish between species of Oryza [47] and particularly between indica and japonica type of Oryza sativa [48]. Recently, PCR-based marker system has been developed by Williams et al [49]. In this RAPD (Random Amplified Polymorphic DNA) method, short oligo-nucleotides of arbitrary sequence are used to support the amplification of regions of the test plant genome and amplified DNAs are separated by gel electrophoresis. There are some reports on RAPD analysis of rice germplasm including indica and japonica types, to identify suitable parents for linkage map construction, and for gene tagging for drought resistance [50,51]. RAPD analysis was revealed to be reproducible and amenable for identification of each single plant line of F1 hybrid rice in China [52] and Australian rice cultivars [53]. Diversified rice cultivars were classified into separate groups by PCR using RAPD markers, but many primers were needed to resolve closely related japonica cultivars [54-56]. In case of RAPD markers, many other DNA bands than the target DNA for cultivar differentiation appear in the electrophoregram after PCR. Therefore, it is recommended to develop the STS (sequence tagged site) markers or SCAR (sequence characterized amplified region) markers based on RAPD markers. In addition to RAPD markers, microsatellites or simple sequence repeats (SSRs), which are DNA sequences with repeat lengths of a few base pairs and variation in the number of nucleotide repeats, can be detected with PCR by selecting the conserved DNA sequences flanking the SSR as primers. In 1993, SSR markers were developed for rice [57,58].
SSR markers are useful not only characterize the relationship between heterosis and marker genotype heterozygosity but also to identify chromosome segments that may have significant effects on yield and its component traits in rice [59]. Genetic diversity among Indian elite rice varieties was evaluated using three different types of DNA markers and parentage analysis [60]. SSLP was reported to be more reliable than AFLP for identify rice cultivars [61]. RAPD, RFLP, nuclear SSLP and chloroplast SSLP analyses were carried out to clarify the phylogenetic relationships among A-genome species of rice [62]. SSR was reported to provide useful genetic information on weedy rice [63]. Development of genome-wide DNA polymorphism database for map-based cloning of rice genes was investigated using SNP markers [64]. And SNPs were used for the discussion on the sequence variations between the rice cultivars [65]. Although SSR and SNPs are very useful DNA markers, it is impossible to use several PCR primers simultaneously, which is “multiplex PCR”, to simplify the PCR and electrophoresis and save time.
Furthermore, it was not reported to identify or differentiate the material rice cultivars by PCR method using the processed rice products, such as boiled rice or the rice cake. The present authors have investigated about the cultivar identification of rice by PCR method [66-70]. In the present study, application of PCR technology to cultivar identification of rice grains was investigated. SCAR markers and multiplex primer sets were developed based on RAPD marker analyses to differentiate closely related rice cultivars clearly and efficiently by PCR. The efficient method to prepare the template DNA for PCR from the processed rice products, such as cooked rice or rice cake, was investigated. The identification or the differentiation of material rice cultivars by the multiplex PCR was carried out using the processed rice products as samples.
Materials and Methods
Materials: Fifteen various kinds of rices were collected or purchased. Sample rice grains used are as follows; Koganemochi (Japan), Hinohikari (Japan), Akitakomachi (Japan), Kirara397 (Japan), Ilpum (Korea), Calmochi101 (USA), Medium grain (USA), Fobidden rice (USA), Pelde (Australia), Kyeema (Australia), Paellea (USA), Long grain (USA), Doongara (Australia), Nanjing 11 (China), IR2061 (Philippines). Thirty three original Koshihikari rice seeds, produced in 1999, 2000 and 2001, were used for DNA extraction and purification. All the rice samples including other 49 different cultivar rice samples than Koshihikari were kindly provided by National Food Agency, Japan. Forty nine cultivars are Hitomebore, Hinohikari, Akitakomachi, Kirara397, Kinuhikari, Hosh-inoyume, Haenuki, Mutsuhomare, Niopponbare, Sasanishiki, Tsuga- ruroman, Hanaechizen, Yumetsukushi, Hatsushimo, Asanohikari, Tsukinohikari, Aichinokaori, Matsuribare, Akiho, Yukimaru, Mutsukaori, Mana-musume, Kakehashi, Kiyonishiki, Domannaka, Koshijiwase, Yukinosei, Hohohonoho, Yumeakari, Notohikari, Akitsuho, Akebono, Asahi, Yama-houshi, Yamahikari, Koganenishiki, Koganemasari, Reiho, Mineasahi, Fusaotome, Karinomai, Dontokoi, Akinishiki, Naganohomare, Fukuhikari, Goropikari, Hatsuboshi, Nakateshinsenbon and Morinokumasan. Paddy rice samples were hulled by an experimental huller (Ketto Science Laboratory, Tokyo) and milled to the yield of 90% by an experimental rice polisher (Pearlest, Ketto Science Laboratory, Tokyo). Milled rice flours were prepared by a coffee mill (Millser IFM- 100, Iwatani, Tokyo).
Physical and Chemical Properties of the 20 Rice Cultivars: Amylose contents were measured by the iodine-colorimetric method using the milled rice flours by Juliano [6]. Protein contents were calculated by the multiplication of nitrogen- protein conversion coefficient (5.95 for rice) to the nitrogen contents measured by the Kjeldahl method [71]. Physical properties of the boiled rice grains were measured by the method of Okadome [28] using a Tensipresser.
Preparation of Boiled Rice and Rice Cake: White rice prepared by the experimental rice polisher (Ketto Science Laboratory) was boiled by an electric rice cooker (RC183, Toshiba, Tokyo) after soaking for 1 hr and each single boiled rice grain was subjected to the extraction of template DNA for PCR. Milled waxy rice was pulverized using experimental impact mill (Udy cyclone Mill, Udy Corporation, Fort Collins, USA). Thirty five gram of water was added to 50g of the rice powder and kneaded manually. Rice cake was prepared using electric rice cake maker for home-use (SMK-1800, Tiger Co. Ltd, Tokyo). Rice cake was lyophilized and pulverized using a coffee-mill (IFM-100) and subjected to DNA extraction.
Extraction and Purification of Template DNA from Milled Rice Flours: According to the CTAB method [64,65], DNAs of the milled rice flours were extracted. Milled rice flours (0.4g) were placed in the micro-centrifugal tube (2 ml) and DNAs were extracted into the 0.6ml of 2 x CTAB (Cetyl tri-methylammonium bromide, 2% CTAB, 20 mM EDTA (ethylenediamine-N, N, N’, N’- tetraacetic acid), 1.4 M NaCl, 0.1 M tris-hydroxyl aminomethane/ HCl buffer, pH 8.0) solution and 0.2 ml distilled water for 30 min at 65 °C. The solution of chloroform and isoamyl alcohol (24:1, v/v) (0.8 ml) was added and stirred gently for 15 min using a rotator. Thereafter, the solution was centrifuged (8,000 g, 15 min) by a refrigerated centrifuge (hi-mac CR21F, Hitachi, Hitachi) and the upper layer was transferred to another micro-tube. CTAB solution (10%, 0.08 ml) and chloroform/isoamyl alcohol (24:1, v/v) were added to the solution and was stirred gently for 15 min followed by centrifugation (8,000 g, 15 min). The upper layer was transferred to another tube and was stood for 5 min in the freezer (-80°C) after the addition of 2.5 times volumes of the precipitation buffer (50mM Tris-HCl, pH 8.0, 10 mM EDTA, 1% CTAB). The precipitate was collected by the centrifugation (6,000 g, 15 min) and dissolved in the 0.5 ml of Tris-EDTA buffer (TE) and was added with the same volume of isopropyl alcohol. After the gentle stirring by a rotator for 15 min, the precipitate was collected by the centrifugation (6,000 g, 15 min). The precipitate was dissolved in 0.2 ml of TE followed by the decomposition of RNAs by the addition of 1 μl of RNase (RNase A, bovine pancreas, 10 mg/ml, Nippon-gene Inc. Tokyo) and incubation for 1 hr at 55°C. Thereafter, neutral phenol solution was added and upper layer was transferred to another tube after the centrifugation (8,000 g, 15 min). The same volume of the solution of phenol/chloroform (1:1, v/v) was added to the solution followed by the cen-trifugation (8,000 g, 15 min) and the upper layer was transferred to another tube. The solution was added with 0.2 M NaCl and two times volume of cold ethanol to generate the precipitate of DNAs. The DNAs were washed by the 50 μl of 70% ethyl alcohol and dissolved in 30 μl of 0.1 TE and were subjected to PCR.
Preparation of DNA in Case of Processed Rice Products: In case of processed rice products, such as boiled rice grains or rice cake, different DNA extraction/purification method was developed [57,58]. Processed rice product, such as a cooked rice grain, was subjected to the de-composition of starch by heat-stable alphaamylase (790 unit/mg solid, 30 mg/ml, from Batillus richenoformis, Sigma, USA) for 60 min at 80°C. For the starch digestion, 20 μl of above mentioned alpha-amylase (1mg/1ml) was added to the 1.5 ml of the sample solution (0.1 g of single boiled rice grain in the solution of 50 mM Tris-HCL buffer, pH 8.0) and digestion was performed for 1 hr at 80°C. Thereafter, the protein hydrolysis was carried out by pro-teinase K (Takara-bio, Otsu, Japan) 55°C or 2 hrs at 37°C. For the protein digestion, 10 μl of proteinase K solution (27.7 u/mg, 20 mg/ml) was added to the starch digested solution with 1% of sodium- dodecylsulphate (SDS). The protein digestion was carried out for 1 hr at 55°C. Thereafter, DNAs were extracted by the same amount of Tris-EDTA saturated phenol solution and purified by the phenol/chloroform/iso-amyl alcohol (PCI, 25/24/1, v/v/v) and 70% ethyl alcohol. For the control, commercial DNA extraction kit (Isoplant, Nippongene, Tokyo) was used.
Polymerase Chain Reaction (PCR): DNAs were proliferated by the PCR method using 600 commercial random primers (10 mers or 12 mers) as primers [56]. Taq-DNA polymerase (Takarabio Inc., Otsu, Japan) was used for amplification of DNAs. Each DNA was denatured for 1 min at 94°C, annealed for 1 min at 62°C and elongated for 2 min at 72°C. This procedure was repeated for 40 times. As a PCR apparatus, Thermal Cycler MP (Takara-bio, Otsu, Japan) was adopted.
Electrophoreses of the Amplified DNAs: Proliferated DNAs were subjected to the electrophoresis for 30 min through the agarose gel (2%) using a Mupid-2 electrophoresis system (Advance, Tokyo, Japan) at the charge of direct current of 100 V. After the electrophoresis, the DNAs were stained by the ethydium bromide and detected by the irradiation of UV light.
Development of SCAR Markers and Multiplex Primer Sets: In the present study, SCAR markers were developed based on RAPD analysis to differentiate rice cultivars by PCR (25-28). DNAs were extracted from the agarose gel after the electrophoresis of the PCR products using “Easy trapTM” (Takara-bio, Otsu, Japan). DNA cloning was carried out using “TOPO XL PCR Cloning KitT M” (Invitorogen Corporation, Carlsbad, USA). DNA sequence was determined using a commercial DNA preparation kit (QIAprep Spin Miniprep kit, Qiagen, K.K, Tokyo) and DNA proriferation kit (Big Dye Terminator Cycle sequencing kit, V1-1, Applied Biosystems Japan) and automatic DNA sequencing system (DNA sequenser ABI PRISM Genetic Analyzer 310, Applied Biosystems Japan, Tokyo). SCAR markers were designed based on the DNA sequences with from 20 mers to 29 mers so that the transition temperatures are around 62°C. The combinations of these SCAR markers, “multiplex primer set” were developed to identify Koshihikari, most dominant rice cultivar in Japan.
Results and Discussion
Table 2: Sequences of SCAR markers.
Note: F: forward, R: reverse.
Development of SCAR Markers: Example for the development of SCAR markers for identification or differentiation of rice cultivars is shown in Table 2. The sequence of the differential DNA, which was extracted from the electrophoresis agarose gel after PCR of RAPD method, was determined and the suitable forward and reverse primers were designated as shown in Table 2 [59,60]. As shown in Figure 7, SCAR markers are more useful than RAPD markers [59,60,66,67] because it is clearer in electrophoregram. Furthermore, it is possible to use several SCAR markers simultaneously in PCR, which leads to saving of time and labor. As shown in Table 2, several kinds of SCAR markers were developed. The length of markers was adjusted so that the transition temperatures of the markers are around same temperature, 62°C. Therefore, several SCAR markers can be used simultaneously in “multiplex PCR.”
Figure 7: Comparison of RAPD and SCAR markers in PCR and electrophoresis.
Properties of Rice Samples: Various rice samples were collected from different district in the world and their chemical and physical properties were measured [60]. The results are shown in Table 3. As shown in Table 3, Indica subspecies, such as IR2061 and Nanjing 11, showed high amylose content and less adhesiveness, on the contrary, Japonica sub-species, such as Hinohikari and Akitakomachi, revealed low amylose content and more adhesiveness. In case of trade con-tract, inspection or grading or the survey of traceability of rice grains, PCR method must be applied using rice grains as samples. Shoot or leaves are not available as sample specimen. Therefore, milled rice flour, single kernel of polished rice or even boiled rice is used as materials for PCR in the inspection carried out in post-harvest inspection.
Rice is markedly diversified from the viewpoint of genetics, morphology and properties. On the contrary, high-quality rice is closely related by inbred breeding to attain high-palatability, high processing suitability or characteristic aroma, etc. Rice grains of the famous cultivars are traded or distributed at higher price as “Premium rice” because of their high palatability, processing suitability or special aroma, etc. As those premium rice grains sell at high price [1]. In the present study, various rice samples were collected from different district in the world and their chemical and physical properties were measured. As shown in Table 3, the grain properties between Indica subspecies, such as IR2061, and Japonica sub-species, such as Hinohikari, were revealed to be very different, but those among the same sub-species are not different.
Table 3: Proximate components and physical properties of various cultivar rice.
Note: Adhesion was measured by a Tensipresser and the unit is mm. Consistency was measured by a Rapid Visco Analyser and the unit is RVU.
Application of PCR to Various Rice Samples: CTAB method can be applied to milled rice flour for extraction and purification of template DNA for PCR [72,73]. The result of PCR using 15 rice cultivars from various countries, such as USA, India, Thailand or Japan, as samples was successful. The primer set used for PCR was our commercial “Koshihikari Positive Kit” (Takara-bio). Four DNA bands appeared clearly in case of Hitomebore and three ones appeared clearly in case of Koshihikari, which were revealed to be useful to differentiate various rice cultivars by a single time PCR and electrophoresis. As shown in Figure 8, the multiplex primer set for PCR, “Koshihikari Positive Kit” is very useful to differentiate various rice cultivars from the different district in the world. It was shown that RAPD analysis is a useful tool in determining the genetic relationships among rice cultivars [51-56].
Figure 8: Example of the PCR using the primer set for the differentiation of various kinds of rice cultivars
Nevertheless, it is necessary to perform many PCRs and electrophoreses to distinguish rice cultivars by RAPD or SSR markers because those markers are difficult to use simultaneously in the same experiment. It became possible to save experiment time and cost using multiplex primer set based on SCAR markers. Figure 8 is an example that the multiplex SCAR marker set is useful to differentiate various rice cultivars by a single time PCR and electrophoresis. Three DNA bands appeared clearly in case of Koganemochi, premium Japonica waxy rice, and other three ones appeared clearly in case of Hinohikari, premium non-glutinous Japonica rice. In case of Nanjing 11, typical Indica non-glutinous rice, showed the different three bands, which are useful to differentiate with the other Indica rice, IR2061.
Primer Set for “Koshihikari” Identification: In Japan, leading variety Koshihikari shares more than one thirds of total cultivation area of rice because it is palatable and traded at higher price than other rice cultivars. It is obliged, in Japan, that the name of rice cultivar, location of cultivation, and year of rice production are labeled on the package of rice by the Japan Agricultural Standard (JAS) Act. Therefore, it was necessary to develop the technology to identify Koshihikari cultivar by DNA analysis. As shown in Figure 9A, Koshihikari can be discriminated from any other cultivars using this “primer set for identification” showing three specific DNA bands [69]. There is no other cultivar rice which shows the same three band pattern with Koshihikari among 50 dominant non-glutinous rice cultivars in Japan. All the Koshihikari from the different districts showed the same pattern of three DNA bands, which correspond to the same grouping under Japanese Seeds and Seedling Law based on representative characteristics of rice plant (Figure 9B). On the contrary, no cultivars other than Koshihikari showed the same DNA patterns with Koshihikari even Hitomebore or Hinohiari, which are descendant cultivars of Koshihikari as shown in Figure 9A [69].
Figure 9: Primer set for identification of Koshihikari. A: 50 different rice cultivars (No1 is Koshihikari) B: Koshihikari of 34 different prefectures.
Primer Set for Differentiation of Other Rice with Koshihikari: As the premium rice Koshihikari sells at high price, mislabeling “Koshihikari 100%” occurs by the dishonest rice retailers in Japan. For the purpose of detection of rice grains of other cultivars which were dishonestly blended into Koshihikari, “Detection-kit” was developed. In case of detection-kit, no DNA is proliferated in case of all Koshihikari rice grains of various prefectures (Figure 10A), and more than one DNA bands never fail to in-crease by PCR in case of rice grains of other cultivars (Figure 10B). This “primer set for detection” can be used to detect the illegal blending of other rice to Koshihikari labeled as “Koshihikari 100% premium rice.” [69] SSR markers are useful not only characterize the relationship between heterosis and marker genotype heterozygosity but also to identify chromosome segments that may have significant effects on yield and its component traits in rice [57-62]. And SNPs were used for the discussion on the sequence variations between the rice cultivars [64,65]. Nevertheless, “multiplex primer sets” using SCAR markers were revealed to be more useful and practical for efficient and precise cultivar differentiation.
Figure 10: Primer set for detection of other cultivar rice grains to Koshihikari. A: 50 different rice cultivars B: Koshihikari of 34 different prefectures
Novel DNA Extraction/Purification Method from Processed Rice Products and Differentiation of Material Rice Cultivars of Boiled Rice by PCR: In case of boiled white rice grain, gelatinized rice starch and heat de-natured proteins inhibit the extraction of DNA. Therefore, it is necessary to remove these starch and proteins without the damage or decomposition of DNAs themselves. Comparison of template DNAs prepared by the three methods, commercial kit method, CTAB method and “enzyme treatment method” was carried out [67]. “Enzyme treatment method” was shown to be profitable from the viewpoint of quality and quantity. High temperature of 80 degrees during the starch decomposition by the heat stable alpha-amylase and coexistence of SDS during the protein digestion are meaningful to inhibit the activity of endogenous DNase. Although commercial DNA extraction kit is very useful to prepare the template DNAs from rice leaves, it is not suitable for boiled rice. No amplified DNA bands appeared after PCR in case of template DNA prepared by the commercial kit [67].
In case of CTAB method, it is possible to prepare purified DNAs, but it was inferior to “enzyme treatment method” in terms of quantity of DNAs. Lysozyme is sometimes used for DNA preparation [58]. But lysozyme decomposes cell wall mainly, and it is difficult to digest the gelatinized starch and denatured proteins. It became possible to proliferate specific DNAs by PCR using template DNA prepared by the “enzyme treatment method” and the multiplex primer set is very useful to differentiate various rice cultivars by a single PCR and electrophoresis as shown in Figure 11 [67]. In case of boiled white rice grain, as shown in Figure 11, it became possible to differentiate Hitomebore or Hinohikari from Koshihikari, their parental cultivar by PCR using the template DNA prepared from each single grain of boiled rice by the “enzyme treatment method”, which was de-scribed in Materials and Methods [67].
Figure 11: Differentiation of Japanese rice cultivars by PCR using template DNA extracted from a single boiled rice grain by the “enzyme treatment method”
Differentiation of Material Rice Cultivars of Rice Cake by PCR: The results of PCR using template DNAs prepared from each rice cake by “enzyme treatment method” were same with those using template DNAs from Multiplex PCR for identification of material rice of rice cake. ”Ezymetreatment method” is also useful for preparation of template DNAs from rice cake. Solubility of rice cake in boiling water and expansion on heating varies depending on cultivar and producing area of the material glutinous rice [69]. Therefore, identification of cultivars of the material glutinous rice using rice cake as a sample is very important. The results of PCR using template DNAs prepared from each rice cake by “enzyme treatment method” were same with those using template DNAs from material raw rice flour directly by CTAB method as shown in Figure 12. It became possible to differentiate each material waxy rice cultivar by the single PCR and electrophoresis by the development of primer set for “multiplex PCR” to identify waxy rice cultivars [70]. material rice flour directly by CTAB method as shown in Figure 12 [68]. In conclusion, it became possible to identify or differentiate rice cultivars by PCR. Practical primer set for Koshihikari, dominant cultivar in Japan, was developed. It became possible to identify or differentiate the dominant cultivar by a single PCR without timeconsuming RAPD analysis or elaborate elec-trophoresis for SSR analysis. Furthermore, the results were same with ones based on the plant characteristics [1,69]. It became possible to use not only raw rice grains but also processed rice products, such as boiled rice or rice cake, as materials for cultivar identification by PCR method by the development of “enzyme treatment method.” The interference of DNA extraction by the ge-latinized starch and denatured proteins of the processed rice products is re-moved by the decomposition of starch and proteins. Heat-stable alpha-amylase was very useful because the high temperature of 80 degrees inhibits the DNase activities during the starch decomposition and SDS is useful to prohibit the DNase during the protein digestion [67]. Single boiled rice grain or rice cake can be used as a sample for identification or differentiation of material rice cultivars by PCR method [67,68].
Figure 12: Differentiation of Japanese rice cultivars by PCR using template DNA extracted from the raw rice flours or the rice cake using “enzyme treatment method” A: Raw Rice Flours B: Rice Cake
Recent Progress of Rice Authentication Technology: Hayashi et al. assessed the utility of single-nucleotide polymorphisms (SNPs) and small insertion/deletion polymorphisms (InDels) as DNA markers in genetic analysis and breeding of rice [74]. They surveyed SNPs and InDels in the chromosomal region containing the Piz and Piz-t rice blast resistance genes and developed PCRbased markers for typing the SNPs. Their findings suggest that, because of its ability to generate numerous markers within a target region and its simplicity in assaying genotypes, SNP genotyping with allele-specific PCR is a valuable tool for gene mapping, mapbased cloning, and marker-assisted selection in crops, especially rice. Satake Corporation developed and commercialized “Cultivar Identification System for Rice” in 2005 based on DNA tip method. It is an automatic system and it became possible to identify or differentiate rapidly and simply about 98% of Rice cultivars in Japan. Paddy, brown rice, polished rice, or the pre-washed rice samples are available for the system. It takes only 8 hours for 6 samples although it took about 3 days before (Figure 13). Starch characteristics determine the quality of various products of rice, e.g., eating, cooking and processing qualities. Bao et al. reported microsatel-lite polymorphism in the Waxy (Wx) gene, soluble starch synthase I gene (SS1) and starch branching enzyme 1 gene (SBE1), single nucleotide poly-morphism (SNP) in Wx and starch branching enzyme 3 gene (SBE3), and a sequence tagged site (STS) in starch branching enzyme 1 gene (SBE1) among 499 nonwaxy rice samples and their relationships with starch physicochemical properties [75].
Figure 13: Cultivar Identification System for Rice (Satake Inc.).
Analysis of the starch physicochemical properties of the samples withdifferent microsatellites, SNPs and STS groups indicated that these molecular markers can differentiate almost all the physicochemical properties examined, e.g., apparent amylose content (AAC), pasting viscosity characteristics, etc. These SSRs, SNPs and STS are useful in marker-assisted breeding for the improvement of starch quality of rice. To identify the chromosomal regions controlling the eating quality of cooked rice, Takeuchi et al. performed a quantitative trait locus (QTL) analysis using 93 backcross inbred lines (BILs) and 39 chromosome segment substitution lines (CSSLs) derived from crosses between a japonica rice cultivar Koshihikari (glossier appearance, tasty, sticky and soft eating quality of rice when cooked) and an indica cultivar Kasalath (less glossy appearance, less sticky and hard eating quality of rice when cooked) [76]. They evaluated the eating quality of rice including overall evaluation (OE), glossiness (GL), taste (TA), stickiness (ST) and hardness (HA) in each line based on the sensory test of cooked rice. They also mapped the QTLs for chemical properties, such as amylose content (AC) and protein content (PC), which affected the eating quality.
Consequently, QTL was mapped in the interval between the SSR markers RM1332 and RM6676 in the middle region of the short arm of chromosome 3 by fine mapping of three sub-CSSLs. Five QTLs, qOE6, qGL6, qTA6, qST6 and qHA6, seemed to be associated with the Waxy (Wx) gene located on chromosome 6. Evaluation of eating quality in early breeding generations of rice is critical to developing varieties with better palatability. Lestari et al. reported about DNA markers associated with eating quality of temperate japonica rice and an evaluation method aided by multiple regression analysis [77]. A total of 30 markers comprising STSs, SNPs, and SSRs were tested for their association with palatability using 22 temperate japonica varieties with different palatability values. Eating quality-related traits of the 22 varieties were also measured. Of the 30 markers, 18 were found to be significantly associated with palatability and, consequently, a model regression equation with an R2 value of 0.99 was formulated to estimate the palatability by the marker data set. Validation of the model equation using selected breeding lines indicated that the marker set and the equation are highly applicable to evaluation of the palatability of cooked rice in temperate japonica varieties.
X. Zhou et al. reviewed about the utilization of next generation sequencing (NGS) on direct identification of candidate genes [78]. The genome-wide association analysis (GWAS) has become a commonly used approach toward identifying the genetic loci and candidate genes for several traits that are closely associated with grain yield. The Multi- parent Advanced Generation Inter-Cross population (MAGIC) is introduced to discuss potential applications for mapping QTLs for rice varietal development. Their strategies broaden the capacity of functional gene identification and its application as a complementary method to insert mutants that comprise T-DNA and transposons. Moreover, accurate genome sequence information enables genome editing for the utilization of key recessive genes that control important agronomic traits. Their review summarized how NGS accelerates rice genetic improvements through the identification and utilization of key functional genes that regulate agronomic traits.
Bio-Functionality of Super-Hard Rice with Long- Chain Amylopectin- Multiple Prevention Against Diabetes and Dementia
Abstract
Diabetes and dementia are life-style related diseases, and patients have been increased all over the world. We tried to prevent diabetes using the high-amylose rice cultivars. It was shown that the postprandial BGL of high-amylose rice was lower than that of low-amylose rice. “Super hard rice”, of which starch contains longchain amylopectin, was developed in Kyushu University, Japan, and we clarified its characteristics by the cooperative re-search. It was very hard after cooking, and rich in resistant starch. “Super hard rice” lowered postprandial BGL not only as cooked rice grains but also as rice noodle and rice bread. We prepared super-hard rice bread blended with 5% of black rice bran (SRBBB), which contained much amylose and showed inhibitory activity against β- secretase after heating. Aged mice, which were fed SRBBB diet for 4 weeks, showed lower amyloid β40 in the blood than the control. We investigated the effects of the blend of ordinary brown rice and black rice cooked after a high-pressure treatment (HPTKO). A randomized, single-blind, crossover-designed study was conducted using 15 subjects, and BGLs at 90 and 120 min after ingesting the cooked HPTKO were significantly lower than that for cooked ordinary polished rice. Furthermore, postprandial blood amyloid β40 did not increased markedly compared with the control.
Introduction
According to WHO report, globally, an estimated 422 million adults were living with diabetes in 2014, and diabetes of all types can lead to complications in many parts of the body and increase the overall risk of dying prematurely [79]. Therefore, there is an urgent need to implement population-based interventions that prevent diabetes, enhance its early detection, and use lifestyle and pharmacological interventions to prevent or delay its progression to complications [80]. The WHO and Food and Agriculture Organization of the United Nations recommend foods with low glycemic index (GI) to prevent diabetes [81]. The concept of GI was introduced by Jenkins, et al. [82]. as a ranking system for carbohydrates based on their immediate impact on blood glucose levels, and low GI and glycemic load diets have more recently been widely recommended for the prevention of chronic diseases including diabetes, obesity, cancer and heart disease [83], because the re- sulting glycemic index classification of foods provided a numeric physiologic classification of relevant carbohydrate foods in the prevention and treatment of diseases such as diabetes [84]. Alzheimer’s disease affects more than 25 million people worldwide and is the most common form of dementia [85]. β-amyloid precursor protein (APP) is processed to generate β-amyloid (Aβ) by β- and γ-secretase, in a highly regulated process. Many drugs have been approved for the treatment of Alzheimer’s disease, at different stages of the disease, although they all have limited efficacy. Recent epidemiological studies have suggested a link between Alzheimer’s disease and type 2 diabetes mellitus associated with insulin resistance [86-88].
Diabetes is a lifestyle disease, and its prevention and treatment are extremely important. Low glycemic index (GI) foods inhibit rapid increases in blood glucose and insulin secretion after meals. The β-amyloid precursor protein (APP) generates the amyloid β peptide (Aβ) via β- and γ- secretase in a highly regulated process. Because working memory is impaired by AD, the disease has spawned dynamic research investigating the influence of gammaaminobutyric acid (GABA) on working memory performance in AD sufferers [89]. It is well-recognized that the prevalence of dementia is higher in diabetic patients than in non- diabetic subjects [90], and Tokutake, et al. [91] showed that there is a molecular link between AD and insulin signaling. Cereal grains are indispensable for the people all over the world. Intake of calories, 1st functions, satisfaction of sensory preference, 2nd functions, and the maintenance and promotion of health, 3rd functions, could be possible by the intake of various grains. For example, brown rice contains vitamin Bs, vitamin E, dietary fibers, gamma- oryzanol, ferulic acid, phytic acid, and gamma-Aminobutyric acid (GABA), various minerals, and polyphenols. Colored grains, such as red rice, purple wheat, purple barley, and purple corn, contain much amount of anti-oxidative polyphenolic substances.
Several studies have reported the development of highly resistant starch rice [92,93] as well as high-amylose and high-dietary fiber rice [94] via physical or chemical mutation. The hydrolysis of starch is a key factor in controlling the GI of foods. Functional foods that have α-glucosidase inhibi-tory activities have proven effective in controlling blood sugar levels in people at risk of developing diabetes [95]. Furthermore, epidemiological studies suggest that the low incidences of certain chronic diseases in rice-consuming regions of the world may be attributable to the antioxidant compounds found in rice. The molecules with antioxidant activity contained in rice include phenolic acids, flavonoids, anthocyanins, proanthocyanidins, tocopherols, tocotrienols, γ-oryzanol, and phytic acid. Rice bran also contains various functional substances, such as γ-oryzanol, ferulic acid, sterol, wax, ceramide, phytin, inositol, and protein [96].
Rice bran oil, the only domestic edible vegetable oil made from the rice bran produced in Japan, is known to have high oxidative stability and serum cholesterol- lowering activity [97,98]. You et al. showed that in mice fed a ferulic acid-enriched diet, exercise endurance capacity was enhanced and fatigue was reduced by elevating antioxidative potentials [99]. Matsuzaki et al. showed that bran rice and γ-oryzanol reduced hypothalamic endoplasmic reticulum stress and attenuated the preference for dietary fat in mice [100]. Matsuoka et al. showed that plant sterols/stanols decreased blood cholesterol levels through the inhibition of cholesterol absorption in the intestines [101]. Intake of fermented brown rice could minimize insulin secretion, thus attenuating any subsequent rise in the levels of blood sugar [102]. Abe et al. showed that rice components including inositol hexaphosphate significantly inhibited Aβ production in neuroblastoma cells without causing cytotoxicity, suggesting such foods may prevent Alzheimer’s disease [103]. Pigmented rice contains naturally occurring colored substances that be-long to the flavonoid group called anthocyanins. Positive health effects of these pigments present in the bran layer of rice have been reported [104].
Ling et al. showed that red and black rice decreases atherosclerotic plaque formation and increase antioxidant status in rabbits due to their enhanced serum high-density lipoprotein (HDL) cholesterol and apolipoprotein A1 concentrations [105]. Recently, food technology to prevent the decrease of those biofunctional components during the cooking and increase their functions by the germination, high- pressure treatment, or the coextrusion cooking have been reported. High-pressure treatment (HPT), a technological process that limits the negative effects of food preparation on hydro-soluble vitamins, is recognized as being very useful in preserving nutritional quality in foods [106,107]. Yamakura, et al. [108] showed that subjecting rice to HPT before cooking results in more free amino acids and stickier cooked rice. The consumption of a western diet, which is characterized by a high in-take of red meats and high-fat dairy products, may contribute to obesity and metabolic syndrome, as well as increase the risk of developing type 2 diabetes and cardiovascular disease. In contrast, the traditional Asian diet, which is rich in soy and fish but low in animal protein and fat, may help reduce the frequency of severe chronic diseases [109]. There is also a significant association between a Mediterranean diet and reduced risk of major chronic de- generative diseases, including Alzheimer’s disease. The optimal diet for the prevention of cardiovascular and other major chronic diseases has rapidly evolved [110].
Development of Specialty Rice Cultivars (High-Amylose Rice, Black Rice)
Super rice research project of Japan started in 1989. It was supported by Ministry of Agriculture, Forestry and Fisheries, Japan, to enhance rice consumption. Low-amylose, high-amylose, giant embryo, aromatic, pigmented and high-prolamin rice cultivars were bred and utilized (Figure 14). We prepared wheat/rice bread blending three kinds of specialty rice, high-amylose, sugary, and purple rice cultivars. The bread showed good taste and maintained softness even after 4 days [111].
Utilization of High-Amylose Rice (Prevention of Diabetes)
Diabetes patients are more than 8.2 million and 18.7 million including those to be diabetes in near future in Japan. It is indispensable to prevent diabetes for the reduction of the increase of the medical costs. It has been reported by the large-scale medical tests that the inhibition of drastic increase of the blood glucose after meals reduce the rate of diabetes initiation [81-84,93]. Cristiana reviewed about the rice compounds with impact on diabetic control [112]. They pointed out that rice macro nutrients, such as starch, proteins, lipids, and dietary fiber, and rice bran compounds, such as gam-ma-oryzanol, phytic acid, ferulic acid, and gamma-aminobutyric acid (GABA)and vitamin E, and elucidated the metabolic mechanisms and bioactive towards diabetes [112]. We aimed to evaluate the palatability of the high-amylose rice of which eating qualities are inferior to ordinary Japonica rice. Another objective of this research was to clarify the mechanism to pre-vent diabetes initiation by the high-amylose rice by the feeding test of rats and diet test by the human beings. Proximate components and gelatinization properties of the high-amylose rice were clarified and texture and eating qualities of the cooked rice from high-amylose rice were reported [113]. In the case of highamylose rice, drastic increase of blood glucose and insulin after meals were inhibited (Figure 15) [113]. By serving the retrograded rice samples (2hrs after cooking), increase of blood insulin was more inhibited for high-amylose rice than for low-amylose one in animal feeding test [113].
Figure 14: Specialty rice cultivars and rice bread in Niigata Prefectural Agricultural Research Institute
Figure 15: Change in digestion degree between high-amylose rice and low- amylose one
Super-Hard Rice, Amylopectin Long Chain Rice (Prevention of Diabetes)
Super-hard rice (ae mutant rice) was developed through chemical mutation method (MNU method) by H. Sato et al. of Kyushu University Japan (Figure 16) [114]. Its starch is characteristic because its apparent amylose content is markedly high because its amylopectin has much amount of middle and long glucan chains [114]. Although its cooked rice is unpalatable due to hard texture, it contains high amount of resistant starch [115-118]. Therefore, super-hard rice is promising as a material to prevent obesity and diabetes. Nakamura and Ohtsubo [119], and Maeda, et al. [120] tried to improve the texture of cooked rice from super-hard rice (CRSH), and they showed that the high-pressure treatments improve the texture of CRSH and maintained the effect to inhibit abrupt increase of postprandial blood glucose level.
Figure 16: Super-hard rice and its molecular structure of starch amylopectin.
Diabetes/Dementia Multi-Prevention Rice Product by the Combination of Specialty Rice and High- Pressure Treatment
Bio-Chemical Test for Prevention of Life-Style Diseases
Type-2 diabetes and Alzheimer’s disease are very serious disease and the former has been suggested to be one of the causes of the latter [86-88]. Low glycemic index foods inhibit rapid increases in blood glucose and insulin secretion after meals [93,94]. Antioxidative capacity of brown rice and rice oil may be useful for the prevention of dementia [96,98,103]. In this study, we investigated the palatability of boiled rice and inhibition of an abrupt increase in blood glucose level (BGL) and amyloid β peptide production after eating blend of ordinary brown rice, “Koshihikari” and anthocyaninrich black-rice, “Okunomurasaki” unpolished rice cooked after a high-pressure treatment (HPT KO). “Okunomurasaki” showed a high antioxidant capacity and high inhibitory activity against β-secretase even after HPT and cooking [121].
Animal Feeding Test
Multiple prevention of type-2 diabetes and Alzheimer’s disease by the rice products would be very important objective for us [86,88,93,94]. Therefore, we prepared super- hard rice bread blended with black rice bran (SRBBB), which showed strong inhibitory activities against β-secretase and acetyl-cholinesterase and contained high amount of resistant starch even after heating. Black rice bran showed greater β-secretase inhibitory activity (3.6- fold) than Koshihikari rice [121]. The bran contained more oleic acid and anthocyanin, meaning that it is potentially a bio-functional food with a high antioxidant capacity. Furthermore, aged mice, which were fed a SRBBB diet for 4 weeks, showed lower amyloid β 40 peptide in the blood than mice fed a commercial diet (p < 0.01) [121] (Figure 17B). Additionally, their initial blood glucose levels after 12 weeks of being fed SRBBB were significantly lower than those in the control group (Figure 17A). Taken together, our results indicate that SRBBB seems to be promising for inhibiting not only amyloid β production but also abrupt in-creases in post prandial BGL.
Figure 17: Change in blood glucose and amyloid β40 in mice.
Human Intervention Test (Single-Dose Test)
It seemed to be necessary to conduct a human intervention test of the promising rice product in terms of inhibitory activity against the increase of BGL and amyloid β peptide production to prove the probability to prevent type-2 diabetes and Alzheimer’s disease. Therefore, we prepared heat moisture treatment cooked brown rice (HMT), and high- pressure treatment cooked brown rice (HPT), which contained higher amounts of resistant starch, antioxidant capacity, and β-secretase inhibitory activity than cooked ordinary white rice (Table 4) [122]. A randomized, single-blind, crossoverdesigned study was conducted using 15 subjects with a normal BGL. It was reported that GI varies depending on the subjects (e.g., young men and women), so we divided the 15 subjects into two groups; a high BGL subclass (seven subjects) and a low BGL subclass (eight subjects). BGL at 90, and 120 min after eating cooked HPT KO unpolished rice for 15 subjects showed a significantly lower BGL compared with that after eating cooked Koshihikari polished rice (p < 0.05). BGL at 90 min and 120 min after eating cooked HPT KO unpolished rice for high BGL subjects (n = 7) showed a significantly lower BGL compared with that after eating cooked Koshihikari polished rice (p < 0.05). AUC was significantly lower compared with cooked Koshihikari white rice 120 min after eating (p < 0.05) [122]. Furthermore, the increase in the amyloid β40 peptide in the blood 120 min after eating HPT KO (unpolished rice, blend of Koshihikari, ordinary rice, and Okunomurasaki, black rice (ratio was 6:4)) tended to be lower than that of cooked Koshihikari polished rice in human intervention test (single-dose test) [123].
Table 4: Bio-functional properties of raw rice and cooked samples.
Note: HPT, high pressure treatment; KO unpolished rice, blend Koshihikari and Okunomurasaki(6:4) unpolished rice, Significant difference(p<0.05) among the two cooked rice and the three raw rice is shown by a, b and c.
Long-Term Human Intervention Test (12-Week Test)
Furthermore, we conducted a long-term human intervention test using the HPSHRB (high-pressure treated super-hard rice (40%) blended with black rice (40%)) in terms of inhibitory activity against the abrupt increase of BGL (Figure 18) and amyloid β peptide production for the probability to prevent type-2 diabetes and Alzheimer’s disease. Tokutake et al. pointed out that amyloidβ secretion and hyperphosphorylation of tau are closely related [91], and we had ascertained it by the cell-culture test. By the long-term in- tervention test, we aimed to confirm the effects to inhibit both of abrupt in-crease of post- prandial blood glucose and amyloid β peptide production. And we could ascertain the safety and acceptability of our multi-preventive rice product by this long-term test. Test was performed under the permission of ethical committee for the human test. As a result, significant reduction of abrupt increase of blood glucose (Figure 18) and inhibition of decrease in amyloid β ratio (amyloid β42/amyloid β40, Figure 19), bio-marker of Alz- heimer’s disease [124], were shown after the 12-week human test [125]. And all 12 subjects accepted the rice sample and finished test with no adverse effects.
Figure 18: Change in IAUCg120 in subjects after eating cooked rice HPT KO (after 12 weeks).
Figure 19: Difference in blood amyloid β42/ amyloid β40 after 6 and 12 weeks in human test
Summary
Diabetes and dementia are life-style related diseases, and patients have been increased all over the world. Rice is a staple food for Japanese and they eat rice at least once or twice every day. Rice does not only supply calories and give tasty dishes but also maintains healthy life for consumers and prevents some diseases. Since 1989, specialty ricecultivars, such as hard rice, soft rice, colored rice, aromatic rice, giant-embryo rice, etc. have been developed in Japan. We tried to prevent diabetes using the highamylose rice cultivars. It was shown that the postprandial BGL of high-amylose rice was lower than that of ordinary rice. It was shown that not only high-amylose rice but also pre-germinated giantembryo rice have the effects to lower the postprandial BGL and to lower the bloodpressure compared with the ordinary rice. “Super hard rice”, of which starch contains long- chain amylopectin, was developed in Kyushu University and we showed its characteristics by the cooperative research. It was very hard after cooking, and rich in resistant starch. “Super hard rice” lowered postprandial BGL not only as cooked rice grains but also as rice noodle and rice bread. High pressure treatment was introduced to food processing by Hayashi in 1980’s. We showed that the super rice becomes softer and sticker by the high-pressure treatment preserving high amount of resistant starch.
We prepared super-hard rice bread blended with 5% of black rice bran (SRBBB), which contained a high amount of resistant starch that showed strong inhibitory activities against β-secretase after heating. Aged mice, which were fed SRBBB diet for 4 weeks, showed lower amyloid β 40 in the blood than the control. We investigated the effects of the blend of ordinary brown rice, super-hard rice, and black rice (2:4:4, w/w) cooked after a high-pressure treatment (HPT KO). A randomized,single-blind, crossover-designed study was conducted using 15 subjects with a normal BGL, and BGLs at 90 and 120 min after ingesting the cooked HPT KO were significantly lower than that for cooked ordinary polished rice (p < 0.05). Furthermore, we conducted a long-term test using the HPSHRB in terms of inhibitory activity against the abrupt increase of BGL and amyloid β peptide production for the probability to prevent type-2 diabetes and Alzheimer’s disease. As a result, significant reduction of abrupt increase of blood glucose and change in amyloid β ratio were shown after the 12-week human test. And all 12 subjects accepted HPSHRB and finished test with no adverse effects. Furthermore, the ratio ofamyloid β42 to amyloid β40, an indicator for the proceeding of Altzheimer disease, did not increase markedly compared with the control.
The Quadratic forms of Equations for Calculation of the Ki and Ka Constants of Enzyme Inhibition and Activation
Introduction
In previous articles [1-9], devoted to construction of a vector method representation of enzymatic reactions in the threedimensional coordinate system the properties of L vectors of enzymatic reactions was analyzed, from which the parametriacal classification of the types of enzymatic reactions and the equations for calculation of initial activated (Va ) and inhibited (Vi ) reaction rates was suggested. In these article the equations of traditional form (t.f.) for calculation of the constants of activation (Ka) and absent in practice nontrivial types of biparametrical constants of inhibition (Ki) of enzymes (Table 1), was deduced. This work is devoted to deduction of quadratic form (q.f.) of the equations for calculation of biparametrical constants of inhibition and activation of enzymes (Table 1t & 1f), opening additional ability in the analysis of enzyme action what help of quadratic forms of equation (Table 1q& 1f). The examples of comparative using traditional and quadratic form of equations for calculation of Ki and Ka constants of inhibition and activation are given.
Table 1: Equations for calculation of Ki and Ka constants (in traditional form).
*The symbol of a graph in Figs. 1-15 corresponds to the type of reaction under study. For example: the line (0) characterizes the position of initial (nonactivated) enzymatic reaction, line I – the position of a graph representing the type of activated enzymatic reaction etc.
Table 1 (continuation).
Deduction of Traditional form of Equations
From (Figures 1, 1a and 2) it easy to see, that ( Ii l ) length of (LIi) projection of LIi vector of biparametrically coordinated, i I type (or mixed type [10 -12]) of enzyme inhibition on Pi semiaxis will be determined by divide (i-0) parameters on ( Ii l ) length of (LIi) projection of LIi vector of – by summation of the quadratic (l2) lengths (orthogonal between them self) LIIIi and LIVi projections of monoparametrical LIIIi and LIVi vectors of i III and type of enzyme inhibition, (which also are the coordinate of these vectors) but in the same time they taking adjacent place relative to orthogonal LIi projection of LIi vector (Figure 2), determined by equation:
Figure 1: Three dimensional (incompletely) system of rectangular coordinate with separately Pi and Pa semiaxes of molar concentrations of [i] inhibitor and [a] activator. Only 8 L vectors of enzymatic reactions (the symbols: LIi, LIVi, LIIIi, LIIi, LIa, LIIIa, LIIa placed in appropriate parallelepipeds and four orthogonal projections of these L vectors (the symbols: LIi, LIVi, LIIIi and LIa) are placed on basic 0 σ plane (Io, IIo … quadrants of this plane), the magnitude of ϕ angle about 3400.
Figure 1a: Three dimensional (completely) coordinate system, (the same as Figure 1), bat with all 14 branched L vectors (7 type of additional L vectors placed without of appropriate arallelepipeds. The ends of all mobile L vectors are joined by dash line (broken part – activated, unbroken part– L vectors of inhibited reactions). The 15th L0 vector of initial reaction (and it L0 projection take place in P point of coordinate intersection. The all 14 orthogonal LIi, LIVi … LIa , LIa projections of L vectors on basic 0 σ plane, are placed completely in (Figure 2). quadrants of transient σ ” plane, VIIa/Vi σ and Va/VIIi σ – beginning and finishing ends of the line of orthogonal σ ” transient plane projection on basic σ0 plane (in Figures.1a and 2, market by broken lines), the magnitude of ϕ angle about 3400.
Figure 2: Two-dimensional (scalar) coordinate system. The symbols of kinetic parameters: the projections LIi, LIVi… LIa, LIVa of three-dimensional vectors: LIi, LIVi… LIa, LIVa on the basic 0 σ plane and symbols of coordinate semiaxes the same as in Figure. 1 and in the text, the magnitude of ϕ angle about 150.
The Ii l length of LIi projection on 0 σ plane of Figures.; (1 – 2) may be determined as
Having expressed from Eq. (2) the lIIIi length of LIIIi projection of LIIIi vector on P0V semiaxis of coordinate (Figures 1, 1a):
from Eq. (3) – the lIVi length of the second adjacent of LIVi vector projection on semiaxis:
and substituted them in Eq. (4):
we shall obtain traditional form (t.f.) of equation for calculation of the Ii K constant of biparametrically coordinated, i I type, inhibition of enzymes, taking in to consideration the lIi length of orthogonal projection of LIi vector on basic 0 σ plane of Figure (1a):
where , as it follows from (Figures 1&2).
It is analogous for length of adjacent projections: for all other lIIa, lVa … of vectors projections of biparametrical reactions (Figures 1,1a & 2).
Deduction of Quadratic form of Equations
From analysis of Equations (1-4) one can easily see that substitution in Eq. (4) of the dimensionless coordinates of the lengths of LIIIi and LIVi vector projections is equal to substitution in this equation of the i /KIIIi and i /KIVi parameters then it is not difficult to become the alternative equations for calculation of i K and a K constants of biparametrical types of inhibition and activation of enzymes. Having substituted in Eq. (4) of the dimensionless coordinates of the lengths of LIIIi and LIVi vector projections is equal to substitution in this equation of the i /KIIIi and i /KIVi parameters.
we find that such as:
this substitution will lead to equation:
or, in quadratic form:
convenient for calculation of constant inhibition of enzymes (Eq. 1, q.f., in Table 1).
It is analogous for all the other equations of biparametrical types of inhibition (Eqs: 2, 5 – 7), and activation (Eqs: 9 – 11 and 14-15 of enzymes, Table 1q & 1f) such as orthogonal projections of correspond L vectors on the basic 0 σ plane, easy to determine by data of two-dimensional (scalar) coordinate system (Figure 2), taking into account orthogonal L projections of tree-dimensional L vectors on basic 0 σ plane of (Figures 1a).
Examples of constants calculation.
Example 1: Calculation of Constant Inhibition
The inhibitory effect of Tungstic acid anions 2 4 4 WO − (0.5×10− M) on the initial rate of pNPP cleavage by calf alkaline phosphatase (Figure 3). shows that the presence 0.5×10⁻⁴M of these anions in the enzyme-substrate system makes the binding of the enzyme to the substrate cleaved difficult and leads to a decrease in the maximum reaction rate (V0= 2.56, V’= 1.74μmol/ (min per μg protein). This meets all the features of the biparametrically coordinated, i I type, of enzyme inhibition (Table 1, line 1). Hence, to calculate the Ii K constant of this phosphatase inhibition it is necessary to use Eq. (5, text), or (Eq. 1, Table 1t & 1f).
Figure 3: Inhibitory effect of anions on the initial rate V0, mol/ (min per g protein) of pNPP cleavage by calf alkaline phosphatase. Note: line 1 – the concentration of is 0.5×10⁻⁴M ; line (0) – the inhibitor is absent.
Substitution in this equation of the parameters and i obtained by data analysis of (Figure 3) allows the calculation of this constant of enzyme inhibition:
Substitution the same parameters (recalculated to values of constants) in equation (1 of Table 1t & 1f), result into next value of this Ii K constant:
Substitution of these parameters in (Eq. 1, q.f., Table 1)
result into the same value of the constant of enzyme inhibition:
From Eqs. (10 -13) it follows that dimension of constants in all cases, are the molar concentration of inhibitor:
Control. Determine the value of the IIIi K constant of this experiment (Figure 3) by values of Ii K and IVi K constants.
From equations (11) and (12), rewritten to the form,
it follows that:
Substitution the necessary parameters from (Eq. 15) to (Eq. 16), we find that:
which is in good agreement with the experimental value of this constant (Eq. 12).
Example 2: Calculation of Constant Inhibition
The inhibitory effect of Pyrrolidine dithiocarbonic acid (PDTA) on the initial rate of pNPP cleavage by canine alkaline phosphatase shows that in the presence of 1×10⁻³M PDTA the parameters and V0= 2.921 μmol/(min per μg protein) change as follows and V ‘ = 3.616 μmol/(min per μg protein) (Figure 4). This corresponds to the, Vi type, of enzyme pseudoinhibition (Table 1, line 5) and Eq. (5, t.f.) is applicable for calculation of the KVi constant of enzyme inhibition. Substitution all necessary parameters in this equation allows calculation of this constant of enzyme inhibition:
Figure 4: Inhibitory effect of PDTA on the initial rate V0 , mol/(min per g protein) of pNPP cleavage by canine alkaline phosphatase. Note: line 1 – the concentration of PDTA is 1×10⁻³M ; line (0) – the inhibitor is absent.
Substitution of recalculated parameters of (Figure 4) and to (Eq. 5, Table 1, q.f.) – result into value of Vi K constant inhibition:
Example 3: Calculation of Constant Activation
The activating effect of Guanosine (Guo) on canine alkaline phosphatase (Figure 5) shows that in the presence of 1×10⁻³M Guo the parameters of initial reaction of pNPP cleavage, i. e μmol/(min per μg protein), change as follows: μmol/(min per μg protein). This corresponds to the, Ia type, of unassociative enzyme activation.
Figure 5: Activating effect of Guo on the initial rate v0, mol/(min per g protein) of pNPP cleavage by canine alkaline phosphatase. Note: line 1 – the concentration of Guo is 1×10⁻³M ; line (0) – the activator is absent.
Hence, to calculate the KIIa constant of enzyme activation, one should use Eq. (14, t.f., Table 1).
Substitution of the obtained values of parameters in this equation allows calculation of this constant of enzyme activation:
Substitution of the: parameters of this experiment (Figure 5) in (Eq. 14, q.f., Table 1), result in to:
as it was to be expected, result in to the same value of activation constant:
From the length parts of equations: (12), (15), (19) and (21) may to see that all they obeys to the signs of Pifagor’s theorem and this may be used as for calculation any of the third constants by the two others known already and for correction the constants, determined by using any other equations.
Example 4: Calculate the value of KIIIi constant of experiment (Figure 3), by value of KIi and KIVi constants. From equation (1, Table 1t & 1f), rewritten to the quadratic form (23).
it follows that:
Having substitution all necessary parameters from (Eq. 23) to (Eq. 24), we shall become, that:
Ii is analogous for all biparametrically types of catalyzed reactions (Table 1).
Introduction in practice of quadratic forms of equations for calculation of Ki and Ka constants, will facilitates for many authors to interpret obtained data of nontrivial types of inhibition and activation by such definition as «essentially competitive inhibition», «similarly to competitive inhibition » and so on [13 -17].
Recently Reported Dual-Drug Co-Delivery of Liposomal-Based Chemotherapeutics to Treat Breast Cancer
Introduction
Globally, breast cancer is the leading cause of cancer death amongst women [1], and the administration of currently available chemotherapeutics can not only have negative side-effects associated with their use, but also can have limited overall drug efficacy. The use of nanocarriers can serve to alleviate potential deleterious side-effects of cytotoxic agents, and there are many different types of nanocarriers available for such delivery. Liposomes, however are currently of great interest with respect to the development of improved chemotherapeutics largely due to their clinical success. For example, Doxil is a clinically approved drug currently used to treat metastatic breast cancer [2-4], and there are various other liposomal-based chemotherapeutics in either preclinical stages or various phases of clinical trials [5-7]. The clinical success of liposomal-based drugs can be explained for many reasons. For example, their phospholipid bilayer not only makes them biocompatible, but also serves to shield the encapsulated drug from coming into contact with healthy tissue while in circulation. Furthermore, their size can be fine-tuned to the desired size (usually 100 nm in diameter or less) to take advantage of the enhanced permeability and retention (EPR) effect known to occur in-vivo [8-10]. The EPR effect arises from deregulated angiogenesis that occurs in and around solid tumors, as well as the poor lymphatic drainage associated with tumor sites. However, while these nanocarriers can effectively deliver cytotoxic agents to solid tumors such as breast cancer while minimizing negative unwanted side effects, there are still many challenges associated with the overall effectiveness of the drug.
In fact, one of the arguably biggest obstacles to overcome with respect to drug efficacy is multidrug resistance (MDR), which is the primary means by which cancer cells develop resistance to various chemotherapeutic agents [11,12]. For example, this is the case with doxorubicin, which is the encapsulated cytotoxic agent within the clinically approved drug Doxil, and the most widely- used drug to treat breast cancer [13,14], as well as many other commonly used chemotherapeutics [15]. Therefore, several research groups are working on the co-encapsulation of dual drugs in a single nanocarrier such as a liposome in order to improve overall drug efficacy. The strategy here being the use of two drugs, in some cases one is a chemosensitizer and the other a cytotoxic agent, or in other cases two cytotoxic agents with completely different mechanisms of action. For example, Rolle et al. have recently reported a dualdrug liposomal formulation involving the chemosensitizer drug disulfiram and the cytotoxic agent doxorubicin [14]. In this study, this formulation effectively reversed doxorubicin resistance in P-glycoprotein (Pgp)-expressing breast cancer cells. The authors also point out the benefits of using liposomes to both improve the solubility and enhance the stability of the disulfiram. In another recently reported study, Ghosh et al. co-loaded liposomes with two cytotoxic agents, vincristine and doxorubicin, and have determined that the synergistic effect of this combination significantly improved the therapeutic efficacy when tested on triple negative breast cancer (TNBC) cells [16].
Conclusion and Discussion
The use of dual-drug liposomal-based systems to treat breast cancer in order to overcome multidrug resistance is a promising area of study, and several encouraging formulations have been reported here. In fact, in the last study mentioned, Jose et al. uses temperature-sensitive liposomes in order to better facilitate the release of encapsulated drugs so that they can then be internalized into cancer cells. The transfer of encapsulated materials within liposomes to cancer cells can be challenging, and therefore many research groups are currently working on targeted drug delivery [5,21]. Generally, this type of delivery involves liposomal surface modification to include the addition of a targeting ligand that is specific to a known overexpressed breast cancer cell surface receptor. In fact, an interesting future construct may involve dualdrug targeted liposomal formulations, either a chemosensitizer and cytotoxic agent or two cytotoxic agents with completely different mechanisms of action as reported here, for improved delivery of co-encapsulated drugs to breast cancer cells.
Acknowledgment
This work was supported by funds generously provided by the Paul Engler Foundation (Dr. David R. Khan, Paul Engler Endowed Professor of Natural Sciences), the Welch Foundation (grant # AE-0025), the Ross Wilson Organization (Dr. Jason Yarbrough, Ross Wilson Endowed Chair in Chemistry), as well as the Killgore Research Center through the Research Enhancement and Killgore Research grant program at West Texas A&M University.
Beneficial Effects of a Topper with Fango Molecule Structure – Investigations with Organ-Specific Cells in Culture
Introduction
Basically, mud therapy is a simple and effective treatment of several disorders of neurological, rheumatologically, cardiovascular, gynecological and inflammatory origin [1,2]. The term “fango,” which originated in Italy, means a special kind of mud deposited from the thermal springs of sulfur bearing sulfuro or sulfated water [3] and its application is named as fangotherapy. In general, fango holds heat and is useful as a thermal application for chronic health conditions [4]. It also stimulates circulation and lymph flow, supports detoxification and helps the body to relax. Some types of fango have anti-inflammatory and pain relieving properties that make them useful for soft tissue injury [5]. The topper with fango molecule structure as tested in this study was primarily designed that the textile fibers of the topper correspond to the molecular structure of natural mineral mud and can, therefore, reflect infrared waves from the body. Thus, the topper might possess the beneficial health effects of fango. According to the manufacturer, many users report amazing improvements in vitality, health and well-being.In the present study, current cell biological test methods were used to investigate whether the topper might be able to inactivate an excess of endogenously generated radicals and thus prevent oxidative stress. Local oxidative stress in the tissue plays an important role in inflammatory reactions [6-9], in the course of wound healing [10,11] or after physical exercise or even overload [12-14]. Therefore, it was also examined whether the topper has a direct beneficial effect on the cell regeneration/wound healing process.
Material and Methods
Topper with Fango Molecule Structure
The company Physio Night GmbH from D-85134 Stammham, Germany, states that the textile fibers of the PHYSIO NIGHT DELUXE topper with fango molecule structure correspond to the molecular structure of natural mineral mud and can therefore reflect infrared waves from the body. In addition, the topper is complemented all around with a mix of stone pine and new wool. According to the company, a renowned textile manufacturer from Italy has succeeded with the help of nanotechnology in integrating the molecular structure responsible for the beneficial effects of fango into the cotton textile of the topper.
Basic Cell Culture
Human promyelocytes (cell line HL-60; ACC-3; ECACC 98070106; Leibniz-Institute; DSMZ German Collection for Microorganisms and Cell Cultures, Braunschweig, Germany) were cultivated for at least 10 passages upon receipt from the cell culture collection and were taken for the experiments over a period of several weeks to ensure independent experiments. Cells were routinely cultivated in RPMI 1640 medium supplemented with 10 % growth supplement and 0.5 % gentamycin. The non-adherent cells were routinely cultivated as suspended mass cultures in special culture flasks with a ventilated lid (25 cm2 growth area; TPP, Switzerland) and were routinely subculture twice a week with fresh culture medium. Cultures were incubated at 37 °C in an atmosphere of 5 % CO2 and 95 % air at almost 100 % humidity. By addition of 1.5 % dimethyl sulfoxide to the culture medium, cells were differentiated over a period of 6 days into functional neutrophils, which are capable of generating superoxide anion radicals in the course of an oxidative or respiratory burst after addition of phorbol- 12-myristate-13-acetate (Sigma-Aldrich, Deisenhofen, Germany) [15-19]. Connective tissue fibroblasts (cell line L-929; ACC-2; Leibniz Institute DSMZ – German Collection of Microorganisms and Cell Cultures, Braunschweig, Germany) were cultivated for at least 20 passages upon receipt from the cell culture collection and were taken for the experiments over a period of several weeks to ensure independent experiments. Cells were routinely grown in RPMI 1640 with 10 % growth supplement and 0.5 % gentamycin and incubated in an incubator at 37 °C in a humidified atmosphere of 5 % CO2 and 95 % air. All cell culture reagents were purchased from Pan-Biotech, Aiden Bach, Germany.
Anti-Inflammatory Effect (Functional Neutrophils)
For the entire duration of the differentiation process, cells were grown in culture flasks, which were placed on pieces of the topper (about 5 × 5 cm in size) and were shielded in several layers of aluminum foil to avoid any unwanted interactions between the exposed cells and the unexposed control cultures… Untreated control cells from the same basic culture were cultivated under identical conditions, but without the topper, and also shielded with multilayers of aluminum foil. Finally, the cells of each experimental series were prepared by two centrifugation steps (6 min at 190 × g) and repeated washings in phosphate buffered saline with calcium and magnesium. Aliquots of the suspended cells in phosphate buffered saline with calcium and magnesium containing 10 mm glucose were taken for the tests and induced to undergo an oxidative burst by the addition of phorbol-12-myristate-13-acetate to the reaction mixture. The reactive superoxide anion radicals in the reaction mixture caused the cleavage of the tetrazolium dye WST-1 (Roche Diagnostics, Mannheim, Germany), which was also present in the reaction mixture. The amount of superoxide anion radicals present in the reaction mixture was directly related to the cleavage and color change of the dye. The color change was recorded at various selected time points up to 40 min as a differential measurement ΔOD = 450 – 690 nm by an Elisa reader (Biotech Elks 808 with software Gen 5 version 3.00) and calculated with Microsoft Excel 2016. Three independent experiments (n = 3) with duplicate wells for each experiment were conducted.
Cells were seeded at a density of 100,000 cells/ml into the four cell culture compartments of silicone Culture-Insert 4 Well (ibidi, Gräfelfing, Germany). The four compartments are separated by a 500 μm thick silicone wall. Due to their especially designed surface, the inserts stick firmly to the cell culture dish and completely prevent any cell attachment and growth under their silicone walls. When the silicone frame is removed, a cell-free space (artificial wound) with sharp edges is left. The cell-free space is then closed by cell migration and proliferation. 48 h after seeding, the cells have become confluent and the silicone frames were removed. After placing the pieces of the topper (about 5 × 5 cm in size) below the cell cultures and shielding them in several layers of aluminum foil, the cells were allowed to migrate and proliferate into the cell-free space for 21 hours. Untreated control cells from the same basic culture were treated and cultivated at identical conditions, but without the topper, and also shielded with multi-layer aluminum foil. Finally, cells were fixed with methanol and stained with a Giemsa’s azur eosin methylene blue solution (Merck, Darmstadt, Germany), and air-dried. The width of the remaining wound space was measured at a minimum of six different areas. Three independent experiments were conducted.
Statistical Analysis
Statistical analysis was done by using the non-parametric, twotailed Wilcoxon-Mann-Whitney test.
Results
Anti-Inflammatory Effect
Exposure of HL-60 cells to the topper for six days during the differentiation process resulted in a reduced generation of endogenous radicals after stimulation (Figure 1). The radical generation in the exposed cell cultures was reduced by 22.6 ± 12.2% (mean value ± standard deviation, n = 3). This reduction was statistically significant (p ≤ 0.05).
Cell Regeneration/Wound Healing
The microscopic examination of the fixed and stained samples of cell regeneration showed at first sight a clear stimulation of the colonization of the cell-free space by exposure to the topper when compared to the untreated control (Fig. 2). The quantification documented a statistically significant improvement by the topper by 23.9 ± 8.8 % (mean value ± standard deviation; Fig. 1) in comparison to the untreated control (p ≤ 0.05).
Figure 1: Effect of the PHYSIO NIGHT DELUXE topper with fango molecule structure on the generation of superoxide anion radicals of functional neutrophils and the regeneration of connective tissue cells. Corresponding controls are set as “100 %. Note that radical generation is decreased, and cell regeneration is increased. Data represent mean values ± standard deviation of 3 independent experiments. *p ≤ 0.05 vs. control; non-parametric, two-tailed Wilcoxon-Mann-Whitney test.
Figure 2: Representative micrographs of fixed and stained cell cultures demonstrating regeneration and wound closure within 21 hours for the untreated control (A) in comparison to the culture which was treated with the PHYSIO NIGHT DELUXE topper (B). Note the significantly reduced cell-free space after treatment in (B). Olympus IX-50 inverted microscope equipped with an Olympus Planachromate 10x and an Olympus E-10 digital camera with 4-megapixel resolution at bright field illumination.
Discussion
Cell cultures are frequently used for a better understanding of the mechanisms that underlie cell activity in vivo. This includes differentiation, migration, proliferation, and metabolism. For over a century, two-dimensional cell cultures as used in this present study, have been used as in vitro models and are well accepted in preclinical research. However, one might argue that cell cultures do not represent the human body with its complex metabolic pathways and facets, but it should be considered that cell cultures can shed light on selected aspects of living matter and are a useful tool to reduce or even avoid animal experiments. Neutrophils are the most abundant type of granulocytes which make up about 60 % of all white blood cells in humans and are normally found in the bloodstream. They form an essential part of the innate immune system [20] and, therefore, play a key role in the front-line defense against invading microbial pathogens. However, neutrophils are also one of the first responders of inflammation and migrate from the blood into the inflamed tissue and generate highly reactive superoxide anion radicals in the course of an oxidative or respiratory burst [21]. The test results of this study indicate that the topper can have a direct effect on inflammatory processes in vivo. The generation of unwanted reactive oxygen radicals is reduced, so that a local oxidative stress in the tissue is also reduced. This can have a positive effect on the healing process of the inflamed tissue after occurrence of local oxidative stress. Synergistically to the first finding is the beneficial effect of the topper on cell regeneration. In this present test system, especially the granulation phase is simulated which is characterized by migration and proliferation of the cells in order to close the cell-free space (= wounded area) in vivo. However, a complicated wound healing process is also related to local oxidative stress [22-24] which is also reduced by the topper. Taken together, both effects can work synergistically and have a beneficial effect on inflammatory reactions or cell regenerative processes after excessive stress or physical burden or even overload. Thus, the PHYSIO NIGHT DELUXE topper might be able to maintain and improve individual health and well-being.
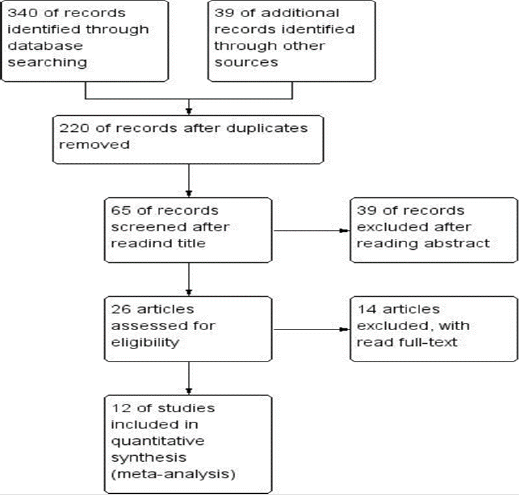
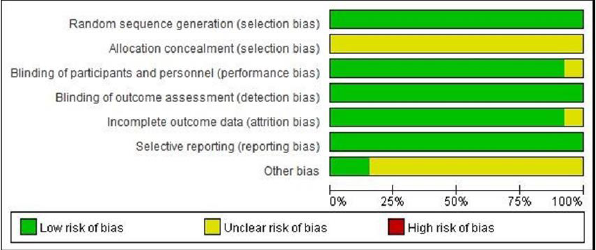
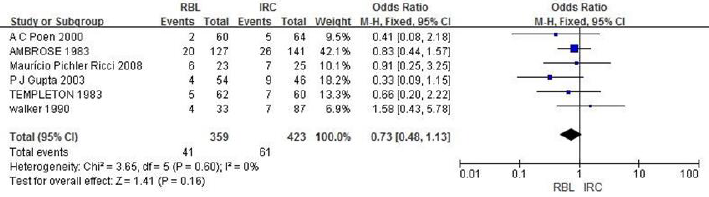
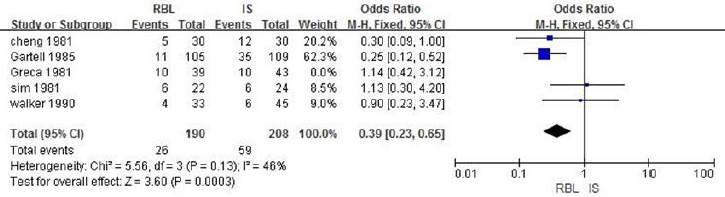
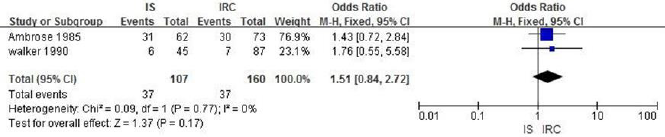
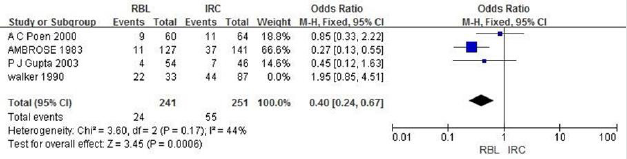
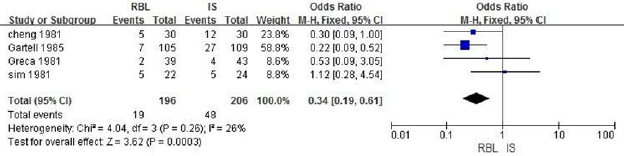
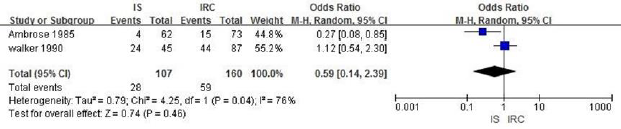
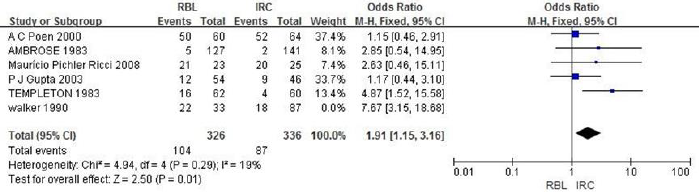
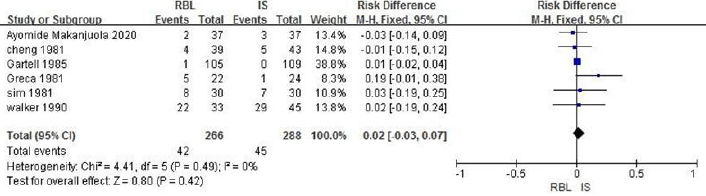
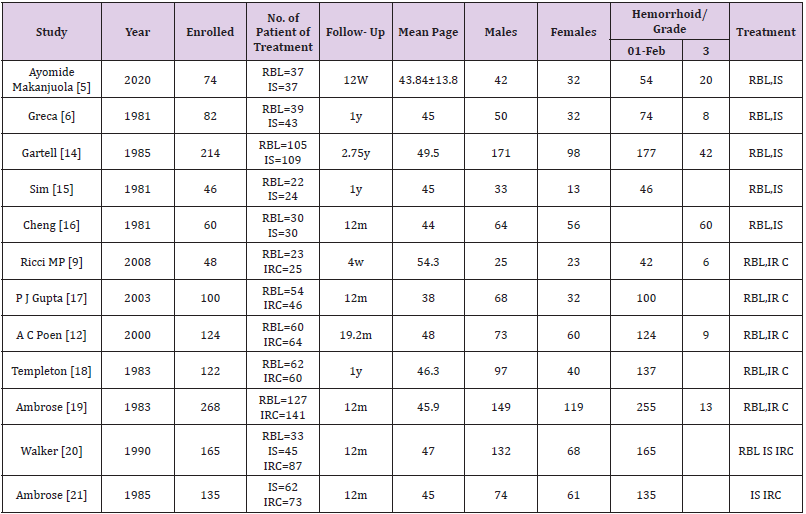
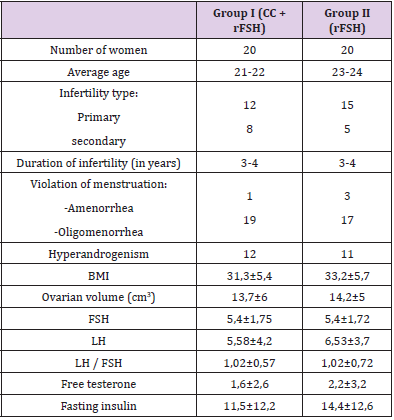
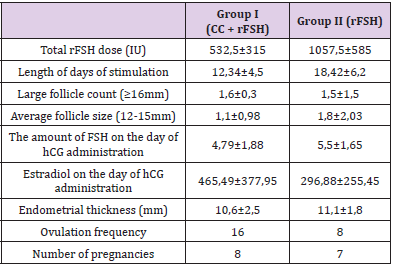
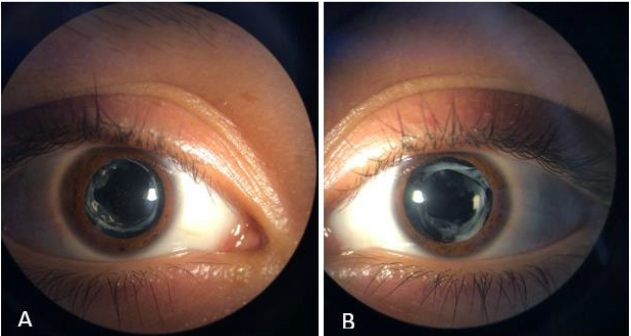
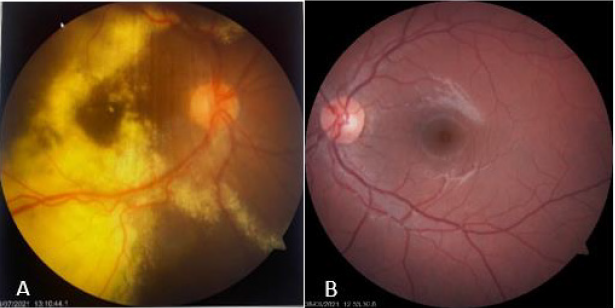
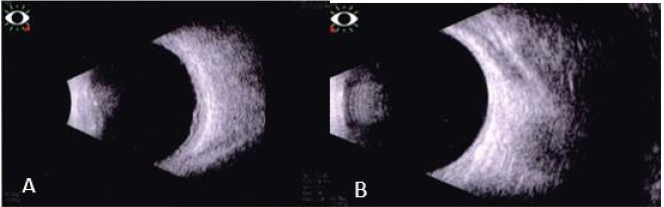
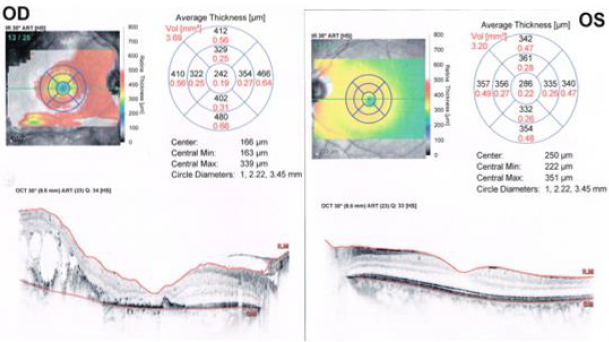
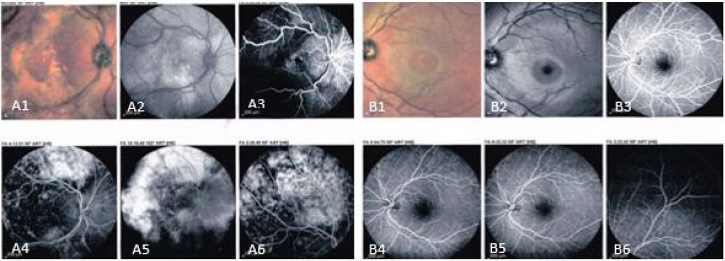
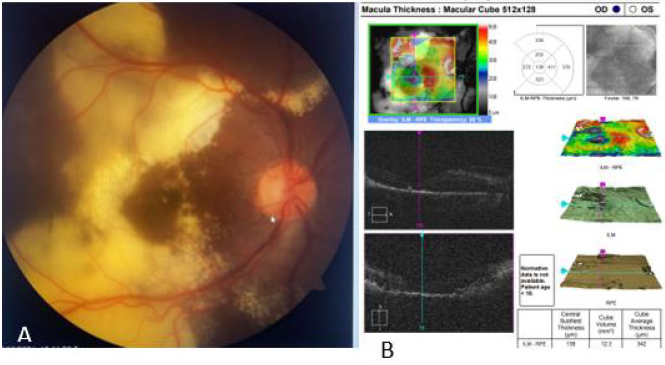
 is the gyrofrequency of electrons and τe is their relaxation time. In hydrogen plasma,
 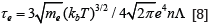 where n and T are the number density and temperature of electrons, respectively, L is the Coulomb logarithm. The current-driven diffusion can lead to a formation of chemical inhomogeneities like other diffusion processes. Using a simple model, we show that the interaction of the current and field with impurities leads to their diffusion in the direction perpendicular to both. This type of diffusion can contribute to formation of chemical spots even in a relatively weak magnetic field with xe << 1. We also show that such diffusion can be accompanied by a particular type of waves in which only the impurity number density oscillates.
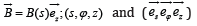 are cylindrical coordinates and the corresponding unit vectors. Then, the electric current is given by
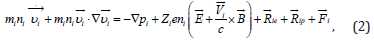
 is the velocity, Zi is the charge of the species i, pi and ni are the partial pressure and number density, respectively, and
  is the electric field;
  is the external force on species i. We neglect the external force in our model since its influence is often insignificant. The forces
  and
and  are caused by the interaction of ions i with electrons and protons, respectively. The forces
  and
and  where
where  . In this paper, we assume that background plasma is in hydrostatic equilibrium. Then,
  . If the temperature is uniform, the friction force
  has only a component proportional to the relative velocity of ions i and protons,
  . This force can be easily calculated if Ai = mi /mp >>1. Since the velocity of a background plasma is zero,
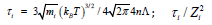 is the characteristic time of scattering between protons and heavy ions; L is assumed to be the same for all types of scattering.
 and the first term in this equation is
  where Dt is the timescale of diffusion processes. Therefore, this term is much smaller than the friction force
  . The second term on the l.h.s. of Eq. (2) is of the order of
  where L is the characteristic length scale. Since L ~ Vi Δt , this term can also be neglected if
  . Then, Eq. (2) transforms into
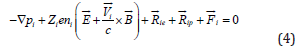
 [12], where
  is the force acting on the electrons. Since ni<< n,
 is the velocity of electric current;
  ; coefficients α ⊥ and α ∧ have been calculated by Braginskii [7]. The force (5) is caused a friction due to a relative motion of the electron and proton gases. Then, Eq.(1) yields for the current velocity
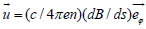
 into Eq.(5) and using coefficients α ⊥, ∧ we obtain with the accuracy in linear terms in xe
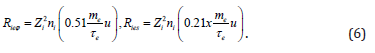
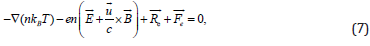


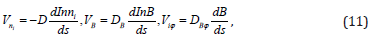
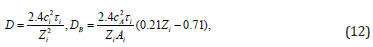
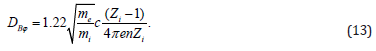
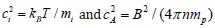 .
.

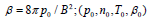 are the values of (p, n, T, b) at s → ∞.
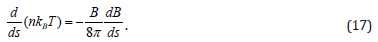
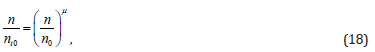
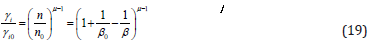


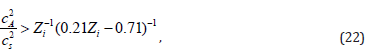
 . Therefore, the current-driven diffusion is more efficient if the magnetic pressure exceeds the gas pressure.
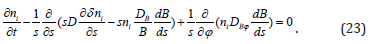

 where m is the azimuthal wavenumber and ω should be calculated from the dispersion equation. Such disturbances have a shape of cylindrical vortices of a chemical composition. Substituting i δ n into Eq. (24), we derive the dispersion equation for such perturbations in the form
 typical for standard diffusion. The frequencies ωI and ωH describe oscillations of the impurities caused by the combined action of electric current and the Hall effect. The considered waves are oscillatory if | ωI + ωH|> ωR. The latter condition is equivalent to

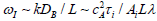 Lλ where λ = 2π / k is the wavelength. In stellar conditions, such waves can manifest themselves in pecular magnetic stars where the magnetic field is ∼ 104 G and the number density and temperature are ∼ 1014 cm−3 and ∼ 104 K, respectively. If the length scale, L, and λ are of the same order of magnitude (for instance, ∼ 1011 cm), then the period of such compositional waves is ∼ 3 × 10³ yrs. This is much shorter than the magnetic timescale and generation of such waves should lead to short-term spectral variability. Such waves can exist in laboratory plasmas as well, but their frequency is much higher in this case. If B ∼ 105 G, n ∼ 1015 cm−3, T ∼ 106K, and L ∼ l ∼ 102 cm, then the period of compositional waves is ∼ 10−8 s. Note that frequencies of waves with various impurities can differ essentially since they depend on the sort of heavy ions.
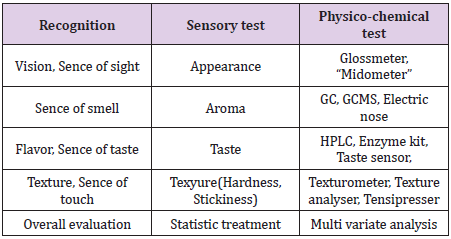
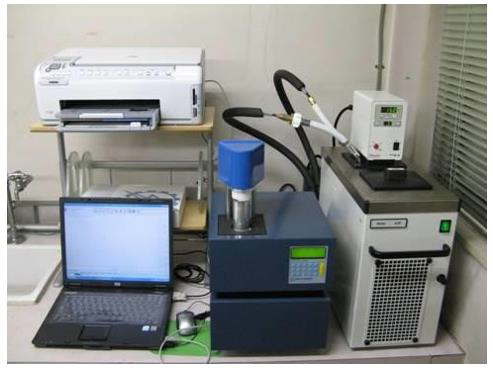
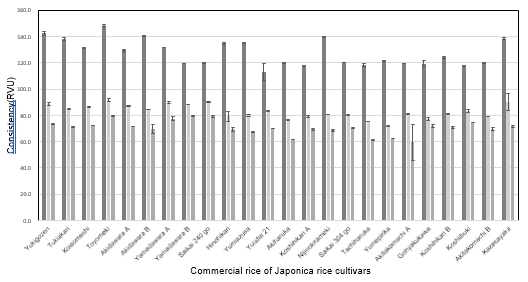
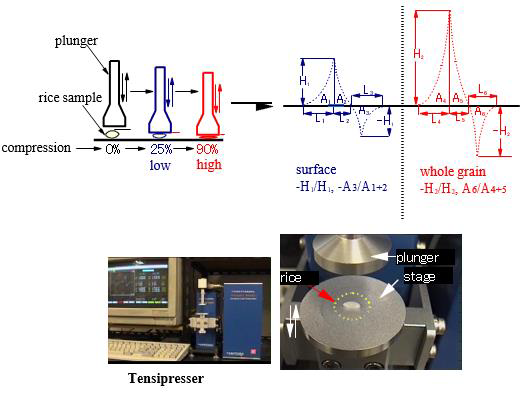
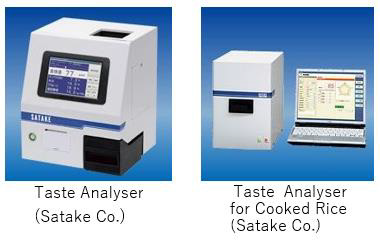
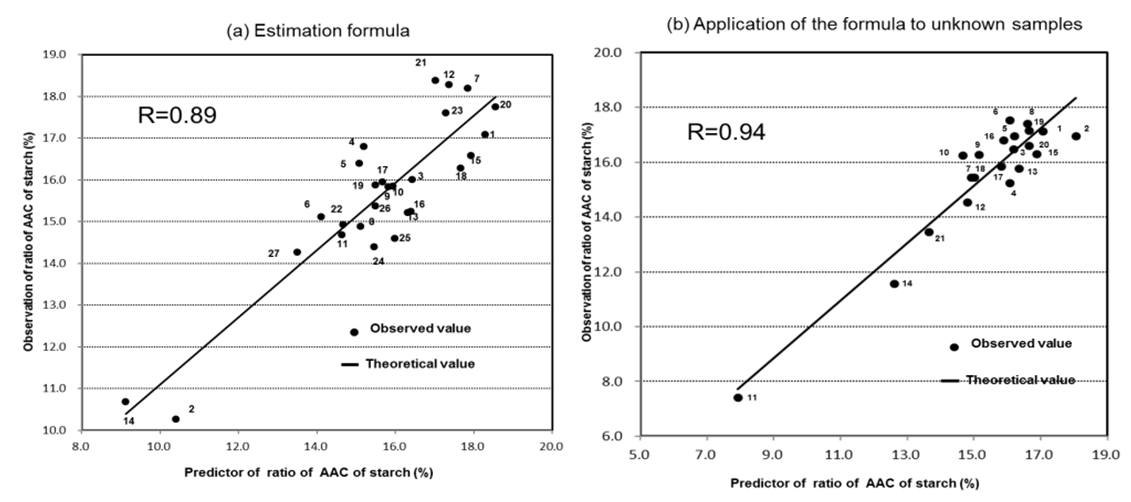
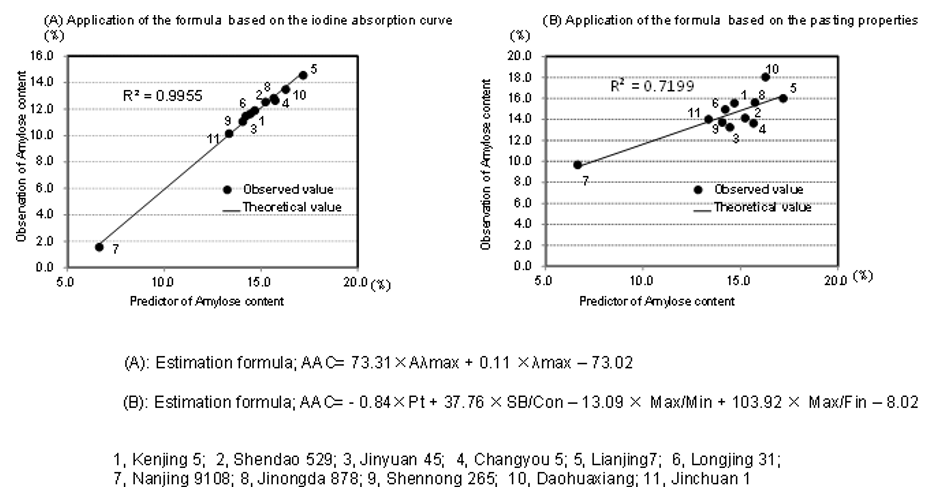
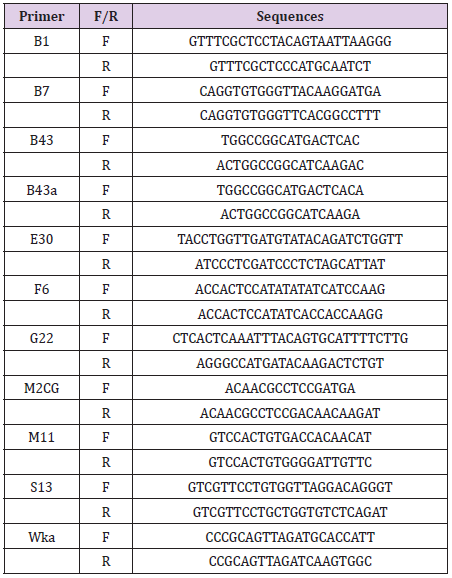
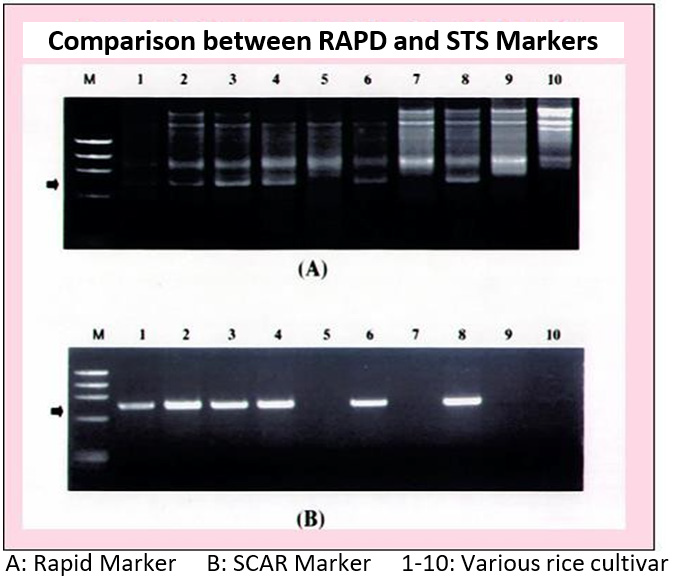
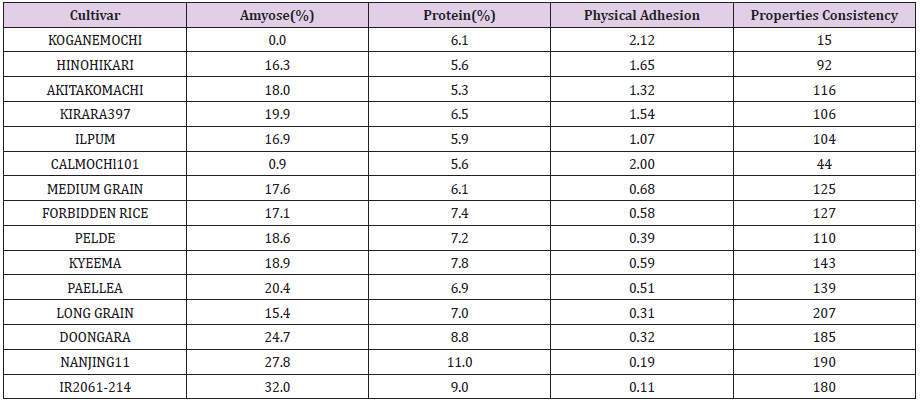
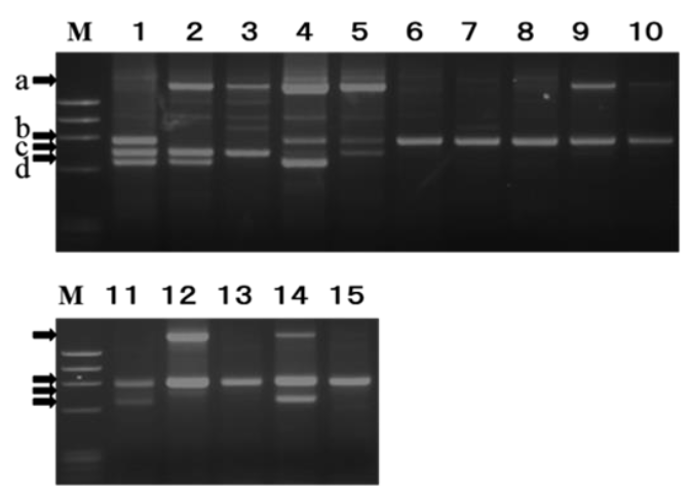
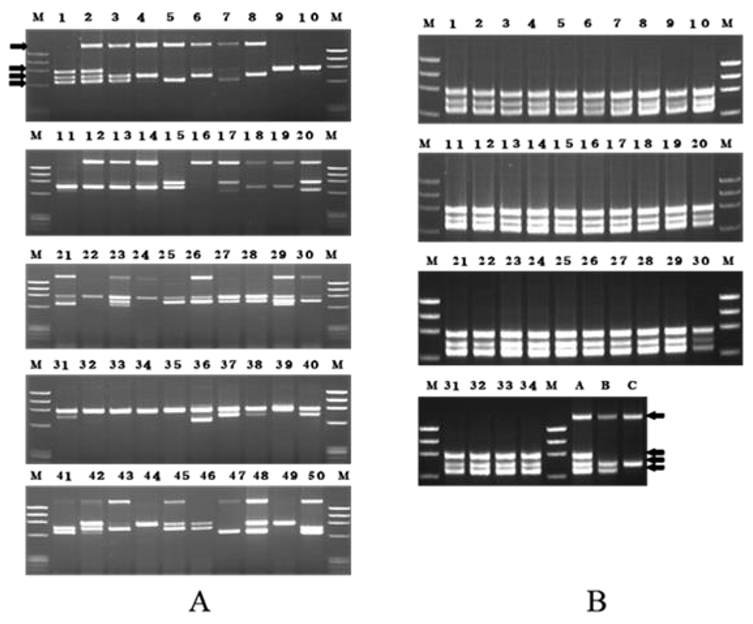
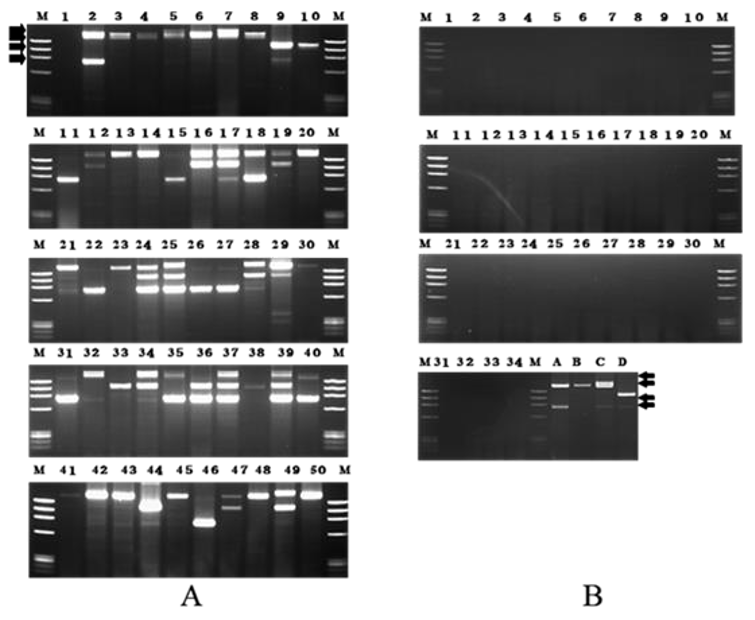
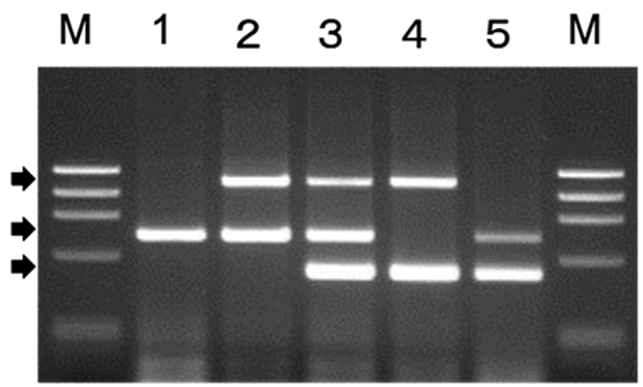
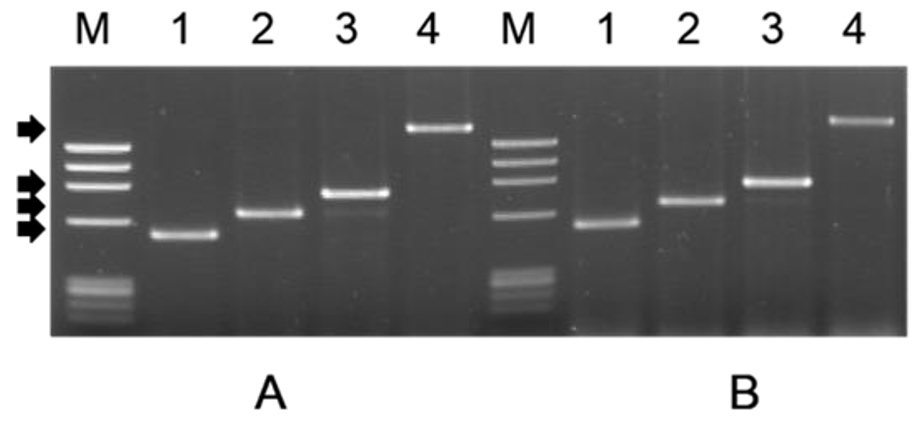

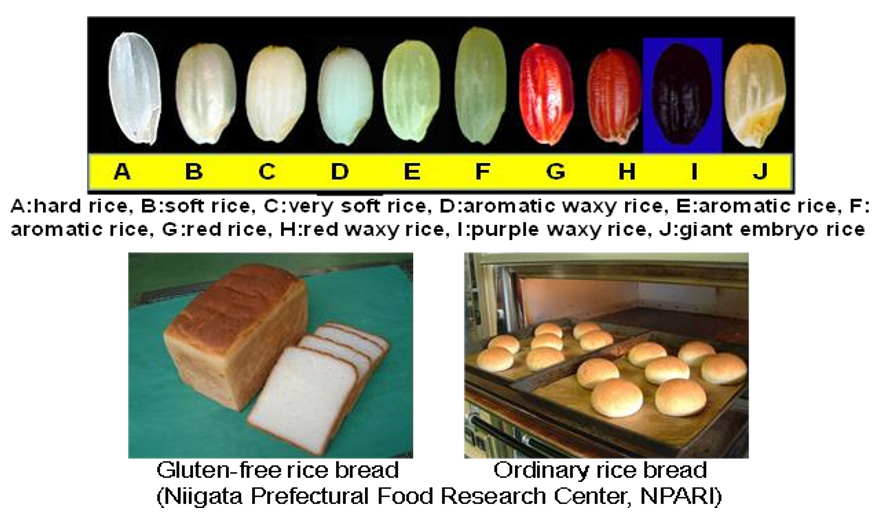
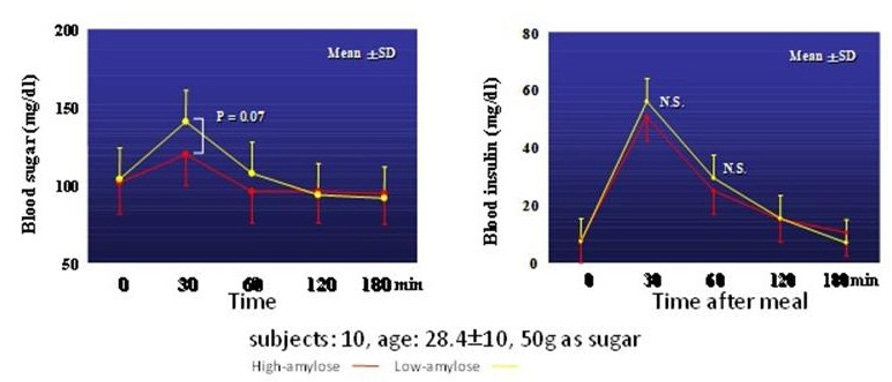
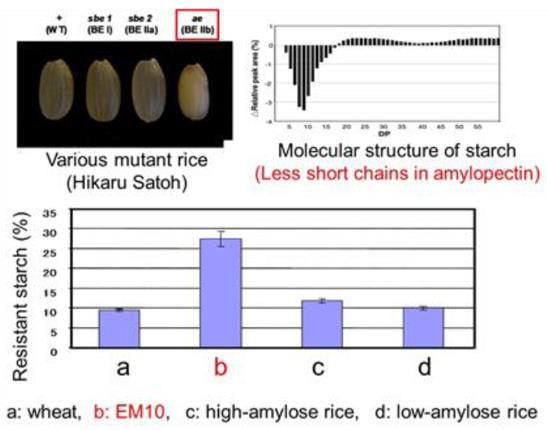

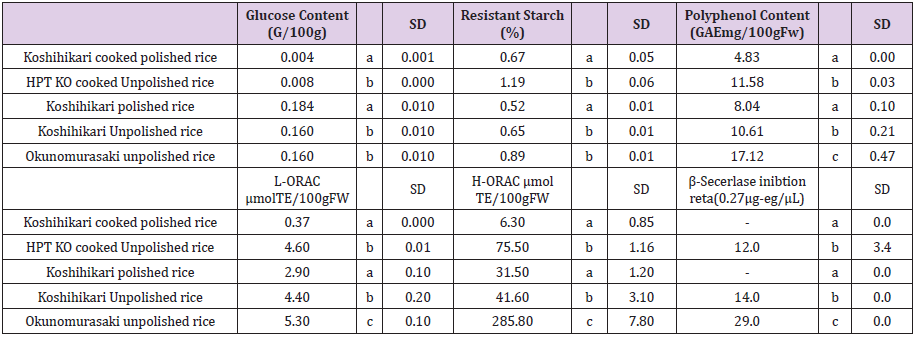
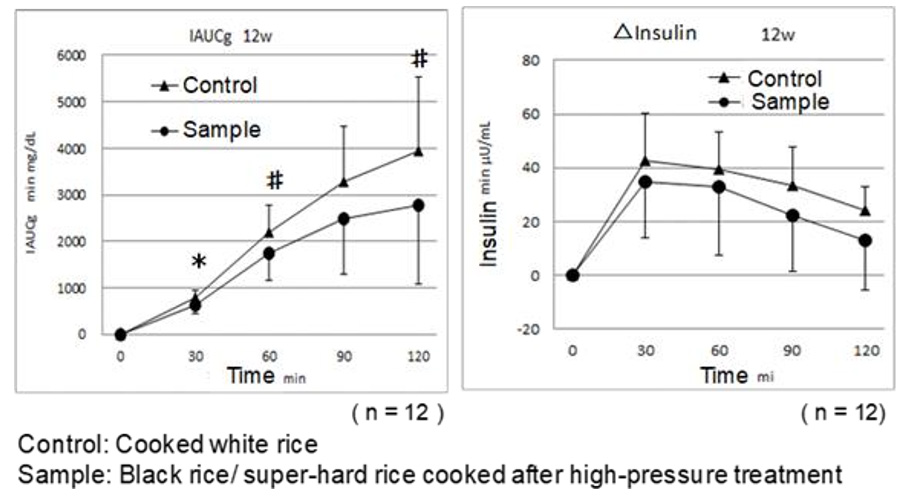
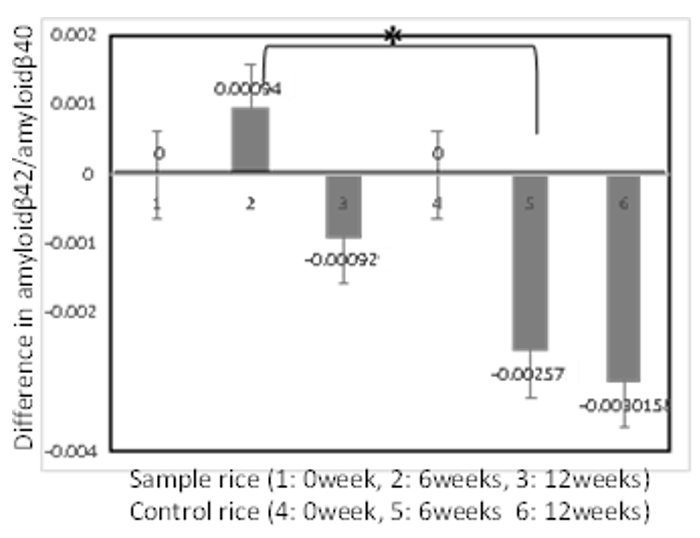
 coordinate system the properties of L vectors of enzymatic reactions was analyzed, from which the parametriacal classification of the types of enzymatic reactions and the equations for calculation of initial activated (Va ) and inhibited (Vi ) reaction rates was suggested. In these article the equations of traditional form (t.f.) for calculation of the constants of activation (Ka) and absent in practice nontrivial types of biparametrical constants of inhibition (Ki) of enzymes (Table 1), was deduced.
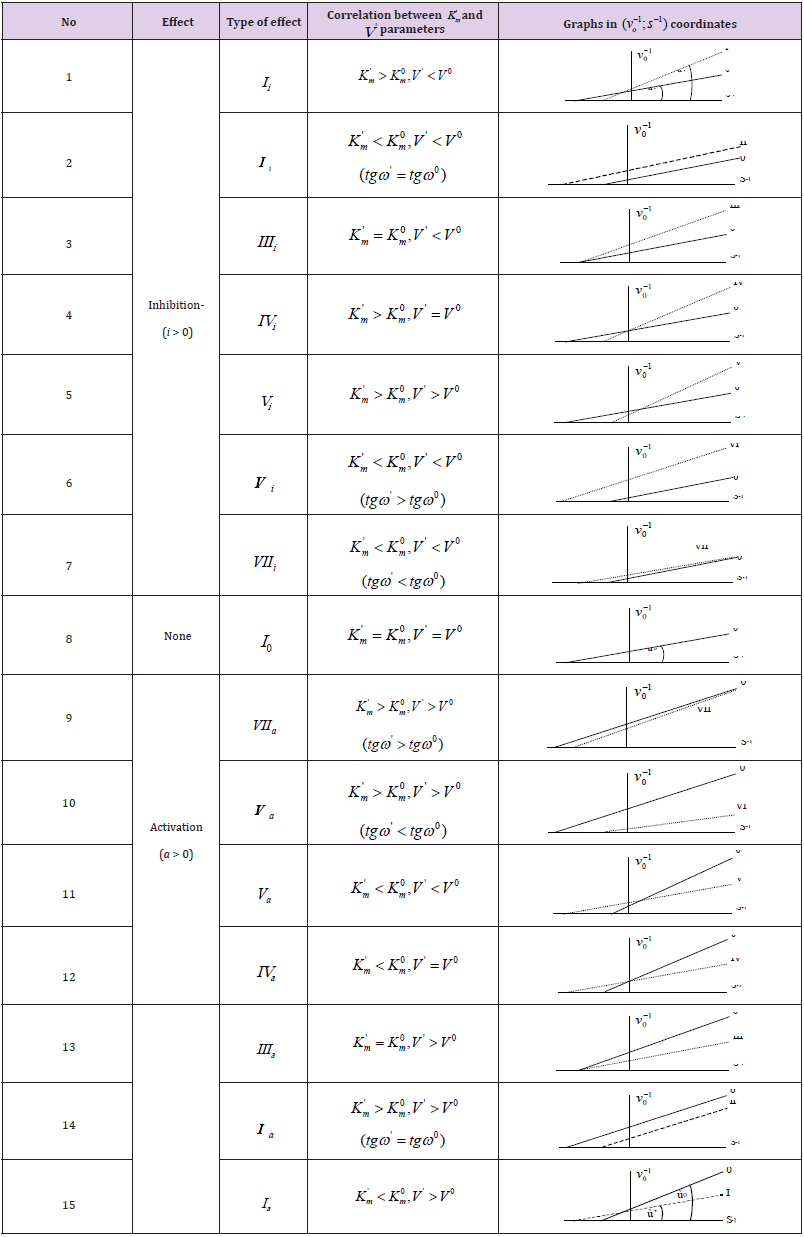
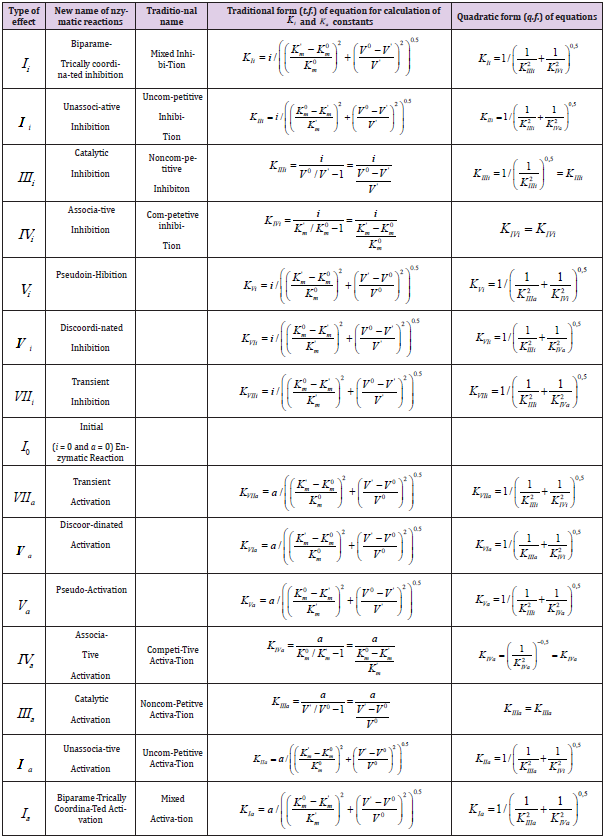
 type of enzyme inhibition, (which also are the coordinate of these vectors) but in the same time they taking adjacent place relative to orthogonal LIi projection of LIi vector (Figure 2), determined by equation:
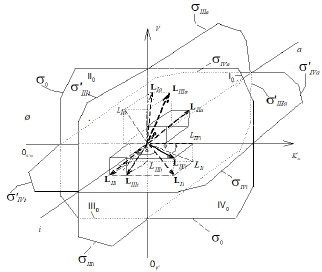
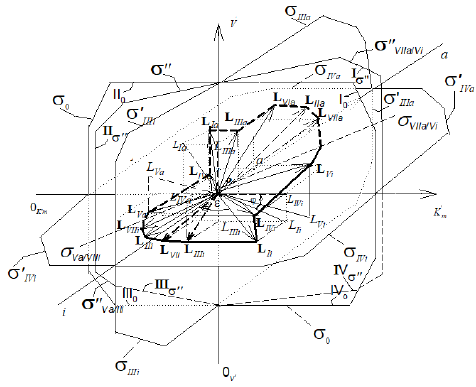
 coordinate system, (the same as Figure 1), bat with all 14 branched L vectors (7 type of additional L vectors placed without of appropriate arallelepipeds. The ends of all mobile L vectors are joined by dash line (broken part – activated, unbroken part– L vectors of inhibited reactions). The 15th L0 vector of initial reaction (and it L0 projection take place in P point of coordinate intersection. The all 14 orthogonal LIi, LIVi … LIa , LIa projections of L vectors on basic 0 σ plane, are placed completely in (Figure 2).
  quadrants of transient σ ” plane, VIIa/Vi σ and Va/VIIi σ – beginning and finishing ends of the line of orthogonal σ ” transient plane projection on basic σ0 plane (in Figures.1a and 2, market by broken lines), the magnitude of ϕ angle about 3400.
 coordinate system. The symbols of kinetic parameters:
  the projections LIi, LIVi… LIa, LIVa of three-dimensional vectors: LIi, LIVi… LIa, LIVa on the basic 0 σ plane and symbols of
  coordinate semiaxes the same as in Figure. 1 and in the text, the magnitude of ϕ angle about 150.
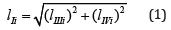
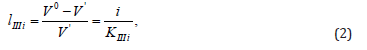
 semiaxis:
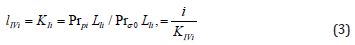

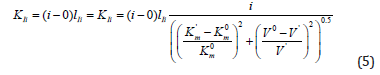
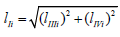 , as it follows from (Figures 1&2).
 for all other lIIa, lVa … of vectors projections of biparametrical reactions (Figures 1,1a & 2).
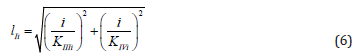
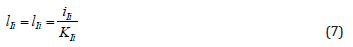
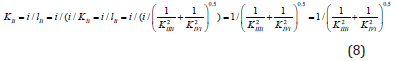
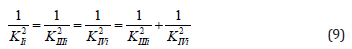
 difficult and leads to a decrease in the maximum reaction rate (V0= 2.56, V’= 1.74μmol/ (min per μg protein). This meets all the features
 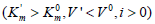 of the biparametrically coordinated, i I type, of enzyme inhibition (Table 1, line 1). Hence, to calculate the Ii K constant of this phosphatase inhibition it is necessary to use Eq. (5, text), or (Eq. 1, Table 1t & 1f).
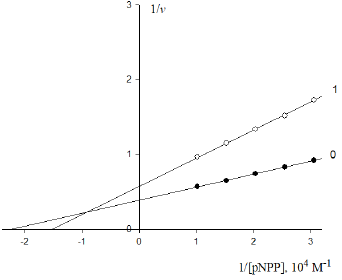
 on the initial rate V0, mol/ (min per g protein) of pNPP cleavage by calf alkaline phosphatase. Note: line 1 – the concentration of
  and i obtained by data analysis of (Figure 3) allows the calculation of this constant of enzyme inhibition:
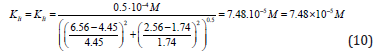
 constants) in equation (1 of Table 1t & 1f), result into next value of this Ii K constant:


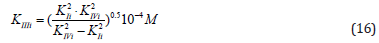
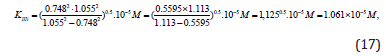
 and V0= 2.921 μmol/(min per μg protein) change as follows
  and V ‘ = 3.616 μmol/(min per μg protein) (Figure 4). This corresponds to the, Vi type, of enzyme pseudoinhibition
  (Table 1, line 5) and Eq. (5, t.f.) is applicable for calculation of the KVi constant of enzyme inhibition. Substitution all necessary parameters in this equation allows calculation of this constant of enzyme inhibition:
 and
and  to (Eq. 5, Table 1, q.f.) – result into value of Vi K constant inhibition:
 μmol/(min per μg protein), change as follows:
  μmol/(min per μg protein). This corresponds to the, Ia type, of unassociative enzyme activation.
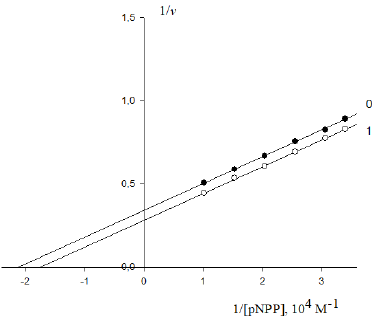
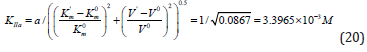
 parameters of this experiment (Figure 5) in (Eq. 14, q.f., Table 1), result in to: