Biomedical Journal of Scientific & Technical Research (BJSTR) is a multidisciplinary, scholarly Open Access publisher focused on Genetic, Biomedical and Remedial missions in relation with Technical Knowledge as well.
Technological Properties of Wheat-Triticale-Rye Flour
Introduction
In the diet of the population of this country a large proportion (up to 40 %) is taken by breadstuffs, the main part of which are products on the basis of various kinds of baking and macaroni flour. So, it looks quite promising and much in demand to make flour composite mixtures at flour mills with the specified contents of the main nutritious and biologically active substances: protein, carbohydrates, carbs, fats, vitamins, micro- and macro elements from the products of the main processed crops including wheat, triticale and rye. Such grain mixtures will become basic for particular manufactures which make bakery products, confectionary, pasta and extruded products, dairy and meat products for specific diet: dietary, preventive and curative nutrition [1-11,12-26]. The current trends in the development of one of the most important processing industries – flour grinding – are developing technologies of processing traditional crops (wheat and rye) as well as new technologies of processing non-traditional crops such as triticale. The ultimate goal of the branch development is to introduce new and to improve traditional technologies and to create products of procession of various kinds of crops with a specified composition and qualities. In addition, a co- processing of grain of various crops, including wheat, triticale and rye is most promising [1- 6,17,22,23]. Breadstuffs with products of processed triticale grain are characterized by higher nutritional value since there is more protein and indispensable amino acids, the main limiting acid – lysine. The combination of positive properties of rye – abundance of biologically active aromatic substances and wheat – rheological properties of dough makes it possible to make diet products.
Wheat protein has little lysine, so in the course of breadstuffs production of improved composition products the lack of lysine is compensated by the increase in digestibility and nutritional value of the product [14].
Materials and Methods
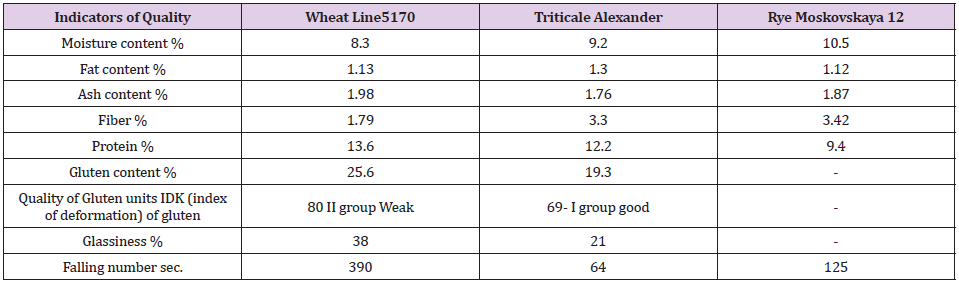
Wheat grain line 5170, triticale grain Alexander and winter rye grain Moscovskaya 12 of 2017 were used as the objects of study. The baseline of wheat and triticale grain quality was determined by the infra-red analyzer of grain SpectraStar 2500 XL and is presented on Table 1. The quality evaluation of the obtained samples of wheattriticale- rye flour was carried out in accordance with standards of GOST (State Standardization System) 26574 -2017 “Wheat bread flour. Technical specifications”, GOST 34142-2017 “Triticale flour. Technical specifications” and GOST 7045-2017 “Rye bread flour. Technical specifications“. The grain is grinded at a roller mill “Melnic 100 Lux”. The capacity of the mill is up to 100 kg/hr. and it grinds the grain of various crops into the flour of the higher-grade flour, class 1 and class 2. Cold air conditioning as the most common method was used as hydrothermal treatment. The original grain of wheat and wheat-triticale-rye grain mixture was moisturized up to 15.0-15.5% and was swelling up for 10 hours. In the course of grinding various sorts of triticale grain the mechanical-kinematic parameters of rollers (spacing between rollers, gradient of riffles, number of riffles per 1 cm. location of riffles, balance between rapidly rotating and slowly rotating rollers , the speed of the rapidly rotating roller) and the set of strainers was unchanged.
Table 1: Indicators of the original wheat and triticale grain quality.
Results and Discussion
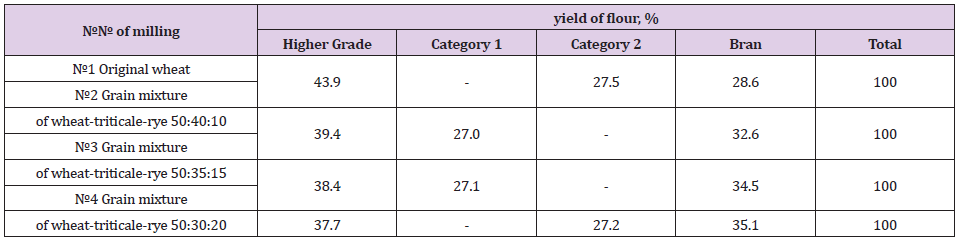
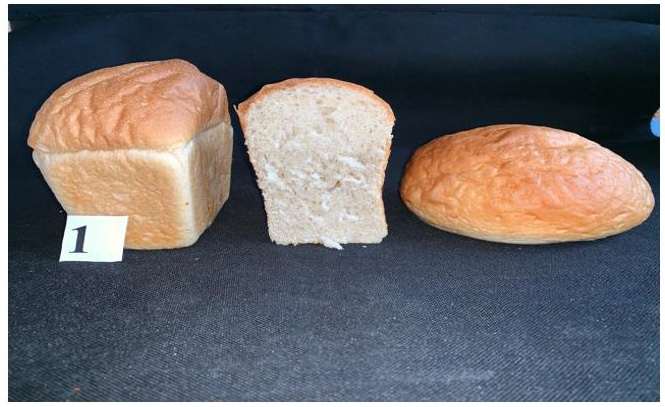
At the first stage of research the grinding of the original grain of wheat and various wheat-triticale –rye grain milling mixtures was made on a grinding unit “Melnic 100 lux”. To determine and compare the milling properties we processed the original grain of wheat and wheat – triticale – rye mixtures in proportions 50:40:10, 50:35:15 and 50:30:20. The obtained results of experimental grinding are shown on Table 2. According to the results of the tests, it can be concluded that the original grinding mixture of wheat, triticale and rye in proportions 50:40:10 is the most optimal since the yield of higher-grade flour and the total yield of flour from this grain mixture is the highest and exceeds not only the yield of all other grinding wheat-triticale-rye grain mixtures but also the control sample of the wheat. Besides, the flour obtained from that mixture has the highest whiteness typical of the higher grade flour. By analyzing the obtained data, it can be concluded that the quantity of gluten in the flour made from all mixtures, except the flour from the original wheat, does not meet the standards of GOST (State Standardization System) 26574-2017 “Wheat bread flour”, since according to the standard the gluten content is 28% for the higher grade flour. However, the obtained data on the quantity of gluten in all mixtures meet the standards of GOST 34142-2017 “Triticale flour. Technical specifications”.
Table 2: Yield of wheat and wheat-triticale-rye bread flour.
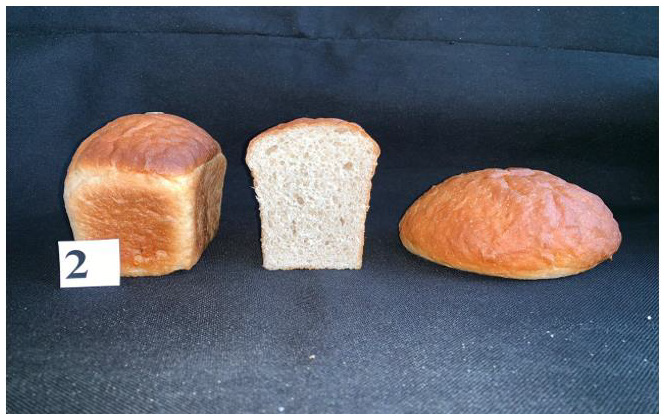
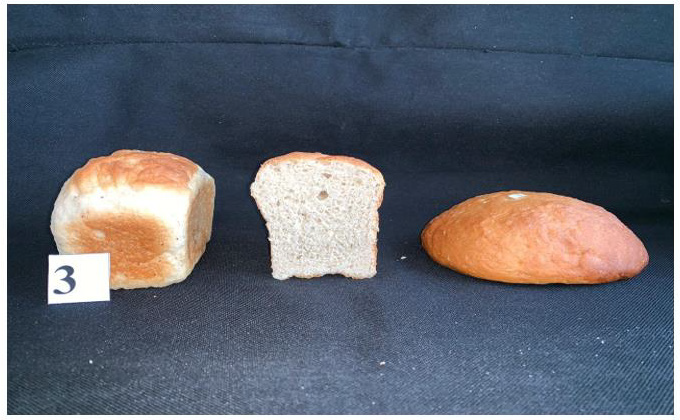
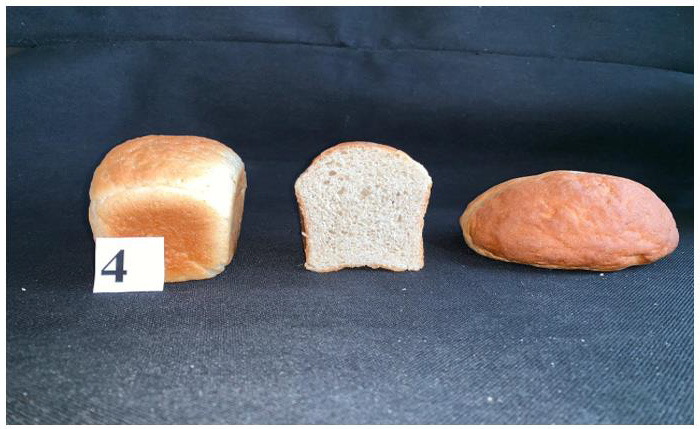
At the second stage of studies the baking properties of the original wheat and wheat- triticale- rye flour were specified. To study the baking properties of wheat and wheat-triticale–rye flour laboratory tests baking were carried out without dough. That method was developed by The Russian Center of assessment the quality of agricultural products [13]. The samples of the baked bread were tested on the total yield, shape stability, organoleptic indicators – appearance, dread pulp condition, taste, smell and physiochemical indicators – acidity and moisture of the bread crumb. The obtained results of the test laboratory baking are shown on Tables 3-6. The bread from wheat and wheat-triticale-rye flour had the total yield from 395 to 585 cm.3/100gr. of flour. Table 6 demonstrates that all bread samples appearance and sourdough were rather highly rated. The surface of the bread from wheat and wheat-triticale-rye flour in proportion 50:40:10 is even, while from other types of wheat-triticale-rye flour (50:35:15 and 50:30:20) is a bit rough and lumpy. The color of wheat bread crust is brown with golden hue, and the other types are light brown (Figures 1-4). The crumb of all breads is light colored and elastic enough. All samples have fine porosity, thin-walled, uneven, except for the sample of bread from wheat-triticale-rye flour in the proportion of 50:40:10 – it has even surface. All breads has taste and smells specific to wheat bread.
Table 3: Quality indicators of the obtained samples of higher-grade wheat and wheat-triticale-rye bread flour.
Table 4: Indicators of quality of the obtained samples of first-grade bread flour.
Table 5: Indicators of bread quality made from various samples of wheat and wheat–triticale-rye flour.
Table 6: Quality indicators from the main flow of wheat and wheat-triticale-rye flour.
Figure 1: Bread from the original wheat flour.
Figure 2: Bread from wheat-triticale-rye flour in proportions 50-40-10.
Figure 3: Bread from wheat–triticale-rye flour in proportions 50:35:15.
Figure 4: Bread from wheat–triticale-rye flour in proportions 50:30:20.
The maximum organoleptic assessment was 30 points of 35 possible the wheat bread sample can have. The wheat – triticale-rye bread from wheat flour in proportion 50:40:10 was a little behind with 29 points. According to the results of the test laboratory baking it can be concluded that the bread from wheat- triticalerye flour in proportion 50:40:10 is the most optimal in all tested quality indicators. It is a lot closer to the control variant in terms of moisture, porosity and acidity indicators in accordance with GOST 27842-88 “Wheat bread. Technical specifications”. In organoleptic indicators it exceeds the samples from wheat-triticale-rye flour in proportion 50:35:15 and 50:30:20.
Conclusion
According to the results of the conducted tests the milling properties of the grinding grain mixture from wheat and wheattriticale- rye grain in various proportions were determined. The tests were carried out at the “Melnic 100 lux” industrial mill. According to the results of the complex study it can be concluded that the grinding mixture of wheat and wheat-triticale-rye grain in proportion 50:40:10 is the most optimal since the yield and quality of the higher-grade flour and the total yield of flour from this grain mixture exceeds all other grinding mixtures and the control sample of the original wheat. In addition, the flour obtained from that mixture has the highest whiteness. The laboratory baking tests were carried out to determine the baking properties of the obtained samples of wheat and wheat-triticale-rye flour. As a result, the bread from wheat-triticale-rye flour in proportions 50:40:10, got the top rating in terms of organoleptic and physiochemical indicators. The obtained new bread from that flour will be healthier compared to the one made from wheat since it will differ in terms of digestibility, higher protein content with the limiting indispensable amino acid–lysine.
Jogging, Physical Exercise and Nutrition Over Time of COVID-19
Introduction
Exercise extends life expectancy and is recommended as a tool of prevention and even of treatment of different pathologies, including cancer. It is therefore not to be considered only a “good habit” for a healthy lifestyle, but it is even counted among the support therapies for cancer patients and several studies have shown its effectiveness both in terms of mortality and risk reduction of recidivism [1]. The current COVID-19 pandemic severely limits the individual’s ability to maintain constant physical activity due to forced quarantine at home. It also seems to contradict the initial assumption; Mattia, the first Italian patient who was diagnosed with a Covid-19 infection, was hospitalized in intensive care for pneumonia. He was 38 years old and was an endurance athlete, in particular a marathon runner. How could a young, healthy and trained man has manifested the symptoms of the infection so heavily? May have exercise influenced his ability to respond to the virus? Some days before the hospitalization, while the infection was incubating, unaware of what was happening in his body, Mattia intensified physical activity by participating in two half-marathons (21km) and in a soccer match, within 12 days [2]. These events, in addition to having potentially caused the infection of family members, teammates and colleagues, may have affected Mattia’s immune status, causing the infection to take root with so much virulence. Excessive physical stress can temporarily alter the athlete’s immune status increasing the risk of infections and their clinical manifestations, in particular affecting the upper respiratory tract and gastrointestinal tract. The aim of this work is to show the physiological pathways through which stress, induced by physical exercise, causes transient immunodepression and the behavior that can strengthen individual defenses and improve the quality of life (QoL). Adequate physical activity and a balanced diet could promote a better outcome in case of infection, in particular from COVID-19 and even in cancer patient. We hope to sensitize the population to maintain a correct lifestyle in order to strengthen their immune system.
Immunity and Microbiota
Immunity is the ability to defend against infections and diseases. The immune system is made up of several cells, tissues, molecules and systems [3]; among them human intestine plays a role of primary importance in the maintenance and development of the immune system. The human intestine contains about one trillion microbes, bacteria, fungi and viruses, the amount of these microorganisms is called intestinal microbiota [4,5]. The microbiota offers many benefits to the host through the maintenance of the integrity of the intestinal barrier, the production of nutrients such as vitamins, the remodeling of the epithelium and the protection against pathogens [4]. However, infections, antibiotic treatments and diet changes can change the microbiota’s composition [6] with direct effects on the individual health. Diet plays a major role on the microbiota: the bacteria present in the colon have the ability to ferment complex carbohydrates, generating different metabolites, including short chain fat acid (SCFA). SCFAs such as propionate, N-butyrate and acetate are rapidly absorbed by enteral cells and are involved in the regulation of cellular processes such as gene expression, chemotaxis, differentiation, cell proliferation and apoptosis [7]. Butyrate has been shown to have anti-inflammatory and anti-tumor properties and it is an important energy source for intestinal colon cells. Butyrate reduces bacterial translocation and enhances the barrier function of the intestinal mucosa, promoting the assemblage of tight-junctions and the synthesis of mucin. SCFAs also regulate lipid and glucidic homeostasis in the liver [7,8] and influence the regulation of appetite through a mediated receptor mechanism; in fact, propionate acts on beta cells, enhancing the sense of satiety [7]. SCAFAs regulate immune system and inflammatory response, influencing the production of cytokines; for example, they stimulate the production of interleukin 18 (IL-18), involved in the epithelium maintenance and repair. Furthermore, the presence of the microbiota in the intestine influences the colonization by pathogenic microorganisms, competing for adhesion sites and for nutritional resources and producing anti-microbial substances such as catelicidines, lectins C and prodefensins, as well as stimulating the production of IgA [4]. The intestinal microbiota is involved in the synthesis of de novo essential vitamins (vitamin B 12, folate, vitamin K, riboflavin, biotin, nicotinic acid, pantothenoic acid, pyridoxine and thiamine). All these factors can influence the guest health. For example, an alteration in the levels of bile acids, branched fatty acids, choline, vitamins and purine and phenolic compounds is associated with the development of obesity and type 2 diabetes [9,10].
Microbiota Response to Stress Induced by Physical Activity
Physical activity stimulates several neurohormonal systems common to stress answer. A recent review showed two different systems of correlation between stress and exercise: the sympatheticadrenal- medullary system (SAM) and the hypothalamic-pituitaryadrenal axis [7]. The activation of these axes leads to the release of catecholamines and glucocorticoids in the circulatory stream and the autonomic nervous system activation, with the release of neurotransmitters directed to the peripheral tissues, the gastrointestinal tract and the cardiovascular system. The brain-intestine axis through the activity of the vagus nerve connect the autonomic and the enteric nervous system which releases gamma amino butyric acid (GABA), neuropeptide (NPY), dopamine and SCFA and Tryptophan, molecules produced by the intestinal microbiota [7]. The physical and emotional stress, after hours of training, causes an alteration of the physiological homeostasis of the SAM and of the hypothalamic-pituitary-adrenal axis [11]. Recent studies have shown how the brain-intestine axis is linked to the development of the microbiota. Studies with germ-free mice show that minimal stress can induce an over-production of corticosteroids and ACTH (Figure 1); therefore, the composition and maintenance of the microbiota is of primary importance in the development of an appropriate response to stress [12]. During strenuous exercise, the body temperature rises and blood flows from the gastrointestinal tract to muscles and peripheral organs such as the heart and lungs. A redistribution of blood flow and thermal damage can cause a lack of integrity in the gastrointestinal barrier and the activation of an inflammatory response. Furthermore, prolonged intense exercise increases stress hormones and the translocation of lipopolysaccharides (LPS) in the gastrointestinal tract, with an increase in the production of proinflammatory cytokines and intestinal permeability. Hypoxia can also increase intestinal permeability due to reactive oxygen species (ROS) production and the alteration to the microbiota composition [13]. The gastrointestinal tract responds by releasing GABA, NPY and dopamine, which cause gastrointestinal (GI) disorders, anxiety, depression and reduced appetite. The production of butyrate and propionate can increase transepithelial resistance and can improve the function of the gastrointestinal barrier, reducing inflammation [7]. Approximately 20-50% of athletes suffer from gastro intestinal symptoms [13] linked to the type of exercise, intensity and age. In a study the incidence of GI disorders during a triathlon competition was of 93% [14] and 2 out of 29 athletes stopped the competition due to vomiting and diarrhea. Another study [15] showed that physical exercise conducted at 70% of Vo2Max leads to a 60-70% reduction in splanchnic blood flow. This hypoperfusion, together with the increase in the gastro intestinal barrier permeability, leads to ischemic intestinal damage. Stress also induces an increase in the translocation of LPS with a recall of pro-inflammatory cytokines. In fact, very high blood LPS values were recorded in marathon runners, triathletes and ultra endurance athletes and 90% of them developed digestive disorders [16]. It has also been observed that glucocorticoids, released during intense exercise, cause a reduction in the expression of the Toll Like Receptors (TLR), therefore the ability to produce anti-inflammatory cytokines and defense against unwanted bacteria is reduced [17] (Figure 2).
Figure 1: SAM releases epinephrine from the adrenal medullary which facilitates rapid mobilization of metabolic resources and regulation of stress response. Epinephrine increases circulating adrenaline and norepinephrine levels, heart rate, strength, peripheral vasoconstriction and energy mobilization. Stress activates the paraventricular nucleus of the hypothalamus that produces corticotropin (CRH) and vasopressin. CRH stimulate, at the level of the adenohypophysis, the release of adenocorticotropin (ACTH) into the circulatory system. ACTH binds to the receptors of the adrenal cortex and enhances the production of glucocorticoids, they, for a negative feedback system, bind to their brain receptors by inhibiting further secretion of CRH [82]. Intense physical exercise, above 60% of the maximum volume of oxygen consumed per minute (Vo2Max), stimulates the hypothalamic-pituitary-adrenal axis and the release of catabolic hormones; the release of cortisol is not stimulated below this threshold, while above 80% of Vo2Max a significant increase in ACTH is obtained [83]. Some studies have shown high levels of CRH in 60-80% of endurance athletes in the early stages of chronic stress, demonstrating the correlation between exercise-induced stress and hormone stress levels in athletes [84].
Figure 2: Correlation between exercise and immunity.
Exercise and Immunity Function
Moderate regular physical activity is more beneficial in terms of preventing infections than the sedentary lifestyle or intense training of elite athletes. This has been demonstrated in both observational and experimental studies conducted on animals and humans; in particular, many studies have focused on the prevention of upper respiratory tract infections (URTI) [13]. Mice which run 20-30 minutes per day compared to sedentary mice showed less mortality and reduced morbidity after pathogen inoculation [18]. In a study in elderly or obese individuals, it was shown that 30- 45min of physical activity at 60-70% of heart rate (HR), 5 times a week, for 12-15 weeks, led to a lower incidence of URTI and a shorter duration of symptoms compared to sedentary individuals [19,20]. The immunosurveillance is linked to physical activity in relation to the duration, intensity and type of physical activity. For example, an hour of cycling seems to enhance the dependent and independent receptor recognition of neutrophils [13,21]. A moderate and constant aerobic activity guarantees the homeostasis of IgA production (Figure 3), an important factor in URTI prevention [22].
Figure 3: Exercise stimulates the innate immune response and enhances immunosurveillance. Moderate physical activity enhances the type 1 immune response, mainly mediated by helper and cytotoxic T lymphocytes (for example during a viral infection), enhances the switch to TH2 lymphocytes and stimulates the anti-inflammatory response.
Endurance sports increase the concentration of neutrophils and monocytes in the blood during the activity and last about two hours, this process allows the infiltration, repair and regeneration of muscle tissue [22]. However, excessive workload, such as during a competition, and associated stress are linked to immune system dysfunction, increased oxidative stress and muscle damage. The concentration of NK lymphocytes, neutrophils, T and B lymphocytes, salivary IgA is modified after an intense training for more than two hours and the expression of class 2 histocompatibility molecules (MHC2) in macrophages [23], increases the serum content of various lipid compounds (including oxidolipids) and triggers an inflammatory process [7,18]. Oxidolipids are involved in promoting, regulating and turning off this inflammatory process. This inflammatory process induces an infiltration of inflammatory cells and cytokines and impairs the inflammation circulating pool with a weakening systemic defenses [7]. Increased risk of URTI has been shown in marathon runners and ultra-endurance athletes [13]. From 2311 runners of the Los Angeles Marathon, about 13% of the runners reported respiratory infection during the week following the competition, compared to 2.2% of the similarly experienced runners who did not participate (Odds Ratio = 5.9) [24]. In an under analysis, 40% of runners had experienced at least one infectious episode during the two winter months preceding the marathon; this percentage represented athletes who had run more than 96 km per week [24]. In a retrospective study endurance athletes who had a high load of stress and sleep deprivation showed a higher incidence of URTI [25]. Epidemiological data recorded during international competitions [26] have shown that 2 to 18% of athletes experience an episode of infection, with a higher percentage in women and athletes in endurance sports. About half of the infections involve the respiratory tract, while the other half involves the gastrointestinal tract, the skin and the genitourinary tract [26]. Regular physical activity has an anti-inflammatory effect, different pathways control the inflammatory signals (such as the interaction with toll like receptors) and induce the release of muscle myokines, the production of interleukins, the decrement of dysfunctional fat, and stimulate the tissue oxygenation. In this way the function of innate immunity and the homeostasis of the oxidolipins are stimulated [27,28]. Chronic high levels of inflammation biomarkers are linked to multiple pathologies, such as obesity, arthritis, atherosclerosis, renal failure, metabolic syndrome, insulin resistance, type 2 diabetes mellitus, sarcopenia, osteoporosis, dementia, depression and different types of cancer [26]. For example, obesity induces a constant state of inflammation, characterized by a proinflammatory infiltration with macrophages and granulocytes, an altered production of acute phase proteins, reactive oxygen species, metal-proteases, oxidolipins, adipokines and cytokines proinflammatory. After intense and prolonged exercise, the biomarkers of inflammation transiently increase, while they are chronically expressed at low levels in obese individuals [26]. In a study on the incidence of influenza A, Warren, et al. [29] have shown that exercise can restore the normal protective capacity of the immune system in obese patients. In fact, in the obese patient the immune response is often delayed or completely inhibited. Exercise balances energy expenditure, leptin response, INF production and increases specific IgG2c levels in response to influenza A infection and enhances the percentage of circulating CD8 T lymphocytes [29]. Epidemiological studies have shown reduced levels of leukocytes, C-reactive protein, interleukin 6 (IL-6), interleukin 18 (IL-18), TNFα, in fit adults (i.e. who do constant physical activity 3 times per week); however, many trials have failed to demonstrate wane of inflammatory processes due to physical activity, in the absence of weight loss [30]. In fact, the evidence shows a reduction in chronic inflammation only in subjects who train more than 300 minutes a week only when physical activity is associated with a weight loss [30].
How Nutrition Influence Exercise Immune Response
Diet can have a direct and indirect effect on the immune system. The availability of some nutrients in athletes under stress can affect energy metabolism, protein synthesis and endocrine-nervous and immune systems. In general, many athletes consume a high load of carbohydrates and proteins and a low load of fibers and fats to have fast energy resources, but this nutritional behavior can cause an alteration of the intestinal function due to the low fiber load in the diet [7]. Furthermore, the athletes’ diet contains some metals, calcium, amino acids and essential fatty acids and antioxidants. We are aware that the microbiota composition may affect the stress and performance (Figure 4). Carbohydrates supply the hepatic and muscle reserves of glycogen, during prolonged periods of intense exercise, reducing stress hormones such as cortisol and the immunosuppression associated with high physical activity [7,31]. However, post-workout is characterized by the so-called “Open Window”, that is, a temporary drop in the immune system due to the energy and metabolites consumption during exercise [31]. A carbohydrate intake of about 8-10g/kg of body weight per day is indicated to restore the pre-workout glycogen values in 24 hours [31]. At the same time, it is also important to restore body fluids, in fact during exercise there is a consumption of about 150% of fluids based on body weight [31]. Adequate availability of all amino acids is necessary to maintain immunocompetence. In the last decade, particular attention has been paid to some categories of amino acids. In particular, glutamine is the most abundant circulating amino acid, and it alone represents about 20% [32]. More than 70% of the circulating glutamine derives from skeletal muscles [33] where it is released by proteolysis or synthesized de novo [34]. Therefore, after prolonged exercise, there was a drop in the plasma glutamine concentration of about 20%, the so-called “the glutamine hypothesis” [31,35] seemed to explain the transient immunodepression after the exercise and the increased risk of infections. However, despite the essential role of glutamine in the synthesis of cytokines, and in the macrophage and leukocyte function, no study has confirmed that supplementation in the immediate post workout balanced this immune defense dysfunction [36]. Recent epidemiological data have shown how exercise reduces the risk of all types of cancer [37]. A very recent study investigated the role of glutamine on the development of tumor cells on mouse models with triple negative lung and breast tumors [38]. The hypothesis of this study is that physical activity, by reducing the share of circulating glutamine, reduced cancer uptake of glutamine inhibiting the tumor growth. Moreover, the study demonstrated that a decrease in the tumor bioavailability of glutamine, induced by pharmacological means or by physical activity (running on the wheel), caused a decrease in tumor growth. In addition, physical activity reduced the mRNA gene expression of muscle atrophy determining the state of sarcopenia and abolished weight loss [38]. Although the athletes follow a low-fat diet (15-30% of total daily calories) [31], the fat metabolism allows the protection of glycogen reserves during prolonged exercise, improving performance. A highfat diet reduces intestinal inflammation, bacterial translocation and intestinal damage following intestinal hypoperfusion during exercise, consequently reducing digestive disorders [7]. A dose of about 1-2 g / day of omega 3 seems to reduce the production of cytokines and reactive oxygen species (ROS) during exercise [7]. On the other hand, Pedersen, et al. [39] monitored the serum concentration of NK and cytokines in 10 sedentary individuals, who consumed a high carbohydrate diet (approximately 65% of the daily calorie intake), and 10 athletes, who consumed a high fat diet (approximately 62% of the daily calorie intake), during a training session 3-4 times a week for 7 weeks. Immune function was enhanced in the group that consumed the carbohydrate-rich diet. Furthermore, a high-fat diet can have a harmful effect on the composition of the microbiota, increasing the permeability of the GI barrier and the translocation of LPS [7]. A lack of micronutrients such as metals, zinc and vitamin A can have negative effects on the immune function; however, an excessive introduction compared to the real need does not seem to enhance its function. Although high doses of antioxidants can reduce cortisol and lL-6 levels, recent evidence has shown that healthy individuals do not benefit from preventing URTI [13]. Indeed, high doses of a single antioxidant, such as vitamin E, can be pro-oxidant and pro-inflammatory. Instead, suboptimal serum vitamin D levels lead to impaired immune defenses and an increased risk of infections [40,41]. In particular, vitamin D helps keep tight-junctions intact, stimulates the production of antimicrobial peptides, reduces the proinflammatory cytokine cascade, stimulates anti-inflammatory cytokines and promotes the formation of regulatory T lymphocytes [42]. Several observational studies and clinical trials have reported that a vitamin D supplement determines a lower risk of developing flu. However, the benefit of vitamin D supplementation is evident in individuals who lack it [43-45]. Vitamin D has recently been used for the prevention of Covid-19 infection thanks to its anti-inflammatory action and low side effects [45]. It would be interesting to evaluate its use for preventive purposes, we await clinical studies confirm this hypothesis. As for vitamin C, it keeps the alveolar barrier intact and promotes the transcription of protein channels, regulating the clearance of alveolar fluids. During an infection serum vitamin C levels decrease proportionally to the severity of the infection; an intravenous infusion of high dose vitamin C seems to have a protective effect in subjects whose sepsis is related to a respiratory distress syndrome [46]. A study has recently been recorded to evaluate the efficacy of vitamin C infusions in patients with SARSCovid 19 [47]. An insufficiency of a single nutrient is rare, the use of multivitamin complexes or mineral salt supplements can be a valid prevention choice. This method prevents the excessive introduction of a single nutrient, avoiding side effects. However, the benefits are obtained by correcting a slight nutrient insufficiency because of consumption during exercise. It should be considered that the association of some foods can naturally provide these micronutrients, increasing their bioavailability and having a synergistic effect [48]. In a previous study, there has been shown a reduction in the incidence of URTI in individuals who consume 3 servings of fruit per day, compared to those who consume less than two [49]. Many substances are considered potentially beneficial to the immune system, but often these benefits are only evident in in vitro studies which use them at high concentrations. Only a few supplements have shown some solid evidence in humans, such as bovine colostrum, echinacea, probiotics and some polyphenols. Bovine colostrum has beneficial effects on the integrity of the intestinal barrier, on the activity of phagocytes and on the production of salivary IgA [50-52]; however, these benefits are more evident in people who have a compromised immune system. Supplementation with selected families of probiotics is capable of modulating the intestinal flora and improving its homeostasis. These benefits are more evident in individuals who have a compromised immune status as a result of increased risk of gastrointestinal infections or, for example, to prevent antibiotic-induced diarrhea. Polyphenols are powerful antioxidants and in vitro have shown anti-microbial and anti-viral activity [53]. Quercetin is widely used in athletes since its consumption (1000mg / day for two weeks before and two weeks after the competition) has been shown to reduce the incidence of URTI (5% of incidence compared to 45% in the placebo arm) [21]. However, this flavonoid is present in many foods such as onions, fruit and berries, green leafy vegetables and tea; therefore a correct consumption of these foods can provide a protective effect against infections.
Figure 4: Effects of inadequate nutrition on the immune system.
Effect of Exercise on Immunosenescence
Aging is associated with a decreased functionality of organs and physiological systems, including the immune system. Aging causes immune dysfunction that it is called immunosenescence, it is related to a greater susceptibility to infections, autoimmune diseases, neoplasms, metabolic disorders, osteoporosis and neurological disorders [26]. Immunosenescence leads to a reduced response to vaccines, a reducted proliferative capacity and activity of T and natural killer (NK) lymphocytes, a reducted pool of circulating cytokines, a reducted phagocytic activity and an exaggerated inflammatory response to bacterial infections [54]. However, exercise and nutritional habits are important modifiable factors that can have a significant impact on strengthening the immune system in all stages of life. Recent studies have compared the immune function of elderly trained with sedentary population. In one study, 30 sedentary older women were compared to 12 women who had participated in senior running national teams [19]; in trained women there was a higher concentration of NK and an increase in the activity of T lymphocytes compared to sedentary women. In another study, the immune function of 17 senior runners who had been training for about 17 years and 19 sedentary control cases was compared. Also in this study, an increase in T lymphocyte activity was seen in runners [49]. These data show that constant physical activity can modulate the immune system, slowing down aging.
Exercise and COVID-19
The current SARS-COVID-19 pandemic began in China and since January 2020 has become the world’s largest calamity both in terms of contagiousness and death and in economic terms. No drug or vaccine is currently available for the treatment and prevention of the infection [55], and if on the one hand the few sources, constantly updated, are rapidly shared by the whole world scientific community, there is still no certainty on the mechanisms of spread, transmission, incubation, contagiousness and lethality of the virus [56]. Latest news agreed that the most symptomatic and serious patients would develop tissue damage, due to a tropism of the virus for cells expressing angiotensin 2 (ACE2) receptors at high levels (present both at the alveolar and at the level macrophage and endothelial), and an out-of-control inflammatory process, with the consequent formation of clots and thrombi that would cause cardiac, renal, encephalic and lung complications with possible patient is death [57]. The primary goal to date is to try to contain the infection by limiting the movement and social contacts of people. Quarantine, however, has negative consequences, such as, an increase in sedentary activities line watching television or playing video games. Low daily physical activity and reduced energy expenditure, if not balanced with a correct reduction in caloric intake, promote weight gain and worsening of pre-existing pathological conditions such as diabetes, hypertension, respiratory disorders, obesity, and the typical frailty of the elderly patient such as sarcopenia and dementia [58-60]. In obese patients, hormonal status, depression of the innate and specific immune system and sedentary lifestyle are determining factors in the manifestation of the severity of the infection. The UK’s National Intensive Care Audit and Research Center (ICNARC) on COVID-19 published a report (July 17, 2020) in which 73.7% of the 10492 hospitalized COVID-19 patients were observed to be overweight or obese and that among patients with BMI> 30 who had undergone intensive care, 71.9% died [61]. While the data from Istituto Superiore di Sanità (ISS) (July 9, 2020) show that, among 3857 patients who died from COVID-19, the 61.8% presented more than 3 comorbidities, and the overall prevalence of patients who presented obesity as the only comorbidity was of 10.9% [62]. In the obese patient there is a constant inflammatory state determined by a condition of hypoxia and dysfunction of the adipocytes, which results in an exuberant secretion of pro-inflammatory cytokines (TNF-α, IL-1β and IL-6) and the recruitment of macrophages, T and B lymphocytes, creating a self-regenerating inflammatory circuit [63]. Obesity alters the immune response by memory CD8 T lymphocytes in response to influenza virus infection, resulting in increased mortality, viral titer and worsening pulmonary clinic [64]. These adverse effects have been associated with obesity-induced failure to maintain influenza-specific CD8 + memory T cells, which are essential for ensuring vaccine efficacy [64]. Obesity is not only an individual risk but the increase in the number of obese individuals could allow the development of a more virulent viral strain and increase the mortality rate [65]. Chronic inflammation and impaired fibrinolysis contribute to increasing the risk of developing thrombosis, an event that worsens lung damage and death in patients with COVID-19 infection, which justifies the use of heparin for prophylactic and therapeutic purposes [66]. As illustrated above, physical exercise leads to significant benefits for both the healthy and the pathological individual [67,68]. Maintaining constant physical activity such as 30 minutes of moderate physical activity and 20 minutes of intense physical activity [67] per day is a fundamental way of prevention of sedentary lifestyle. Physical activity is of primary importance especially in the elderly individual to maintain physiological functions and reserves in order to fight the symptoms related to covid-19 infection [69].
Exercise and Cancer
Exercise in cancer patients improves the QoL and reduces the symptoms and side effects of treatments [1]. Physical activity and exercise can relieve side effects of antiblastic treatments such as tiredness, nausea, vomiting and significantly improve the patient’s QoL [70-73]. They can also implement strength, muscle elasticity and improve body composition with an increase in lean mass [73,74]. In fact, even in cancer patients, body composition is a determining QoL factor [75], and cancer patients should have an active lifestyle, an intense-moderate aerobic activity of at least 90 minutes per week and strength activities twice a week [76]. Several studies and reviews of the literature have shown that physical activity is safe and even beneficial in metastatic patients, for example with breast cancer [77] or with lung cancer [70,78,79]. The prospective DELCap study showed a linear correlation between intensity of physical activity and reduction of the risk of recurrence and mortality in patients treated for high-risk breast cancer [80]. Exercise lessens the endurance of symptoms, enhances the expectations and hopes, and allows the continuation of treatments. In essence, physical activity with specific and individualized exercises improves physical status and psycho-spiritual representations of the disease on daily life [56]. Other studies have focused attention on the psychosocial impact of exercise such as running for women treated for breast cancer [81], exercise is an important part to recover personal esteem, the challenge for life, the fight against the disease, the recovery of physical and aesthetic condition [82-84].
Conclusion
Moderate physical activity strengthens the immune system and improves health. However, the excessive physical effort associated with other stressful conditions can compromise the immune status, increasing the infections risk, in particular airways infections, because of dysbiosis, alteration of the permeability of the gastro intestinal barrier and immunodeficiency. Playing a moderate and constant physical activity, taking care of nutritional intake and filling any deficiencies is an essential way to maintain an efficient immune system. Sensitize the population to adopt healthier lifestyles, avoids the worsening of clinical conditions or the onset of new pathologies in the event of a COVID-19 infection is a priority. In conclusion, an excessive physical activity can worse the individual health. It is important to modulate it, and to take care of the food intake in order to develop an efficient immune system that can fight infections, such as COVID-19 infection, and the development of tumor pathologies, as well as enhancing the response to therapies and avoiding the onset of sarcopenia.
Contributions of the Integral Hypothesis to the Confrontation of the Severity of Dengue: A Brief Opinion
Opinion
Dengue is currently considered the most important arbovirus in the world in terms of human morbidity and mortality [1]. The number of cases notified by the World Health Organization (WHO) has increased eightfold in the last two decades, from 505.430 in 2000 to more than 2.4 million in 2019 [2]. The consideration of dengue as an immunopathogenic disease, where the immune response and not the virus per se is responsible for the clinical picture, emerges like a valuable perspective that offers helpful information for its successful confrontation [1]. As it is known, Dengue Hemorrhagic Fever (DHF) and Dengue Shock Syndrome (DSS) are the severe or fatal manifestations of Dengue Fever (DF), however, in numerous occasions some young students of Medical career expose as a personal concern their ignorance about how to act to prevent death [3]. In patients with DHF/DSS, the prognosis depends on the early and effective recognition of shock that is why it is necessary to have an adequate surveillance of them, especially during the critical period, framed in the transition from the febrile to the afebrile phase, which generally occurs after the third day of the onset of the clinical presentation [4]. In this sense, it is recognized that timely and adequate medical assistance reduces mortality rates below 1% [3]. The above makes us reflect on how much still needs to be learned and how much remains to be taught regarding this subject [4]. The relevant role of the immune response in the pathophysiology of severe forms of this illness dates from the late 1980s, but despite having tried to explain exactly, it still remains without a clear explanation. In fact, some valuable hypotheses have been raised to elucidate the serious condition [1], nevertheless, the author agree with other researchers [5] that the Integral Hypothesis proposed by Kouri P, et al. [6], is the most complete when pointing out like no one other, dengue like a multifactorial immunopathological phenomenon. It was in 1987 that Kouri P carried out a research in Cuban territory and came to the conclusion that a better understanding of the worsening of dengue would be possible through the analysis of various factors, to say: factors of individual risks (presence of anti-dengue antibodies, age, sex, race, chronic disease carrier), epidemiological (vector and interval between infections) and factors related to the virus (serotype and virulence of the strain) that, as a consequence of its interaction lead the development of severity [6]. In this way, it is considered paradoxical that, despite the usefulness of these postulates, the researches related to its verification have been so limited. In addition, not only the scientific value of its particular content is distinguished in this hypothesis, but also the advocacy of the ethical, the environmental and the sociocultural with a more dynamic vision of the still enigmatic health-disease process. Hence, the author commit with this viewpoint, since it exclusively conceives key elements that contribute to solving the problem raised, which from other prospects are often undervalued. It would be regrettable not to exploit the knowledge that this hypothesis contains and also the wide range of representational elements that it considers. Additionally, it must be emphasized that considerations emanated from this view contribute with the most complete and holistic professional training of sanitary personnel, by providing a conception in which, not only is the health sector positioned like the protagonist of the pertinent confrontation of the problem, but also conceives the population involved like a key element or active subjects with the right to make decisions regarding their reality. The need to address the shortcomings revealed in higher medical education regarding to the teaching learning of contents concerning to confronting the evolution of dengue towards its fatal forms, is imminent, and guides this author to discover in the mentioned hypothesis a particular form of the application of the scientific method in the medical profession. It is offering an invitation to reflecting about the possible solutions that may arise as result of a deep analysis of this point of view in order to diminish the uncertainty of students about the knowledge required in this area and thus to enrich the quality of health services. It is known that the problem associated with the way in which optimal decisions are made and should be made, has been treated in numerous studies. Among the elements of the analysis of said investigations, it is highlighted that: individuals have a limited capacity for processing and analyzing information, as well as knowledge, which allow making the most rational decisions [7]. This process is not only permeated by each individual’s own mental model and social relationships, the quality of the professional teaching educational process pursued by the subject is also considered a determining factor for the choice of the final decision. Based in previous, actually is evidenced a general acceptance to introduce activities that propitiate the clinical reasoning from the first stages of the formation of the doctors [8]. Finally, it is considered that the Integral Hypothesis offers a procedure that develops the incipient capabilities of clinical reasoning and illustrates the applicability of the contents referred in this paper.
Full Validation of a New Formula Estimating the Smoking Economic Burden by Morbidity
Introduction
Smoking is a significant health market weakness close related to tobacco consumption intensity. The smoking impact over the health finance management carries to big fiscal spends agree to the tobacco consumption intensity too [1]. In the Health Economy context is usually used the illness burden attributable to smoking (morbidity close related to smoking probability´s) as similar to the smoking economic burden by morbidity (probability to health spend because of smoking) [2]. This limitation is given because there isn´t a single generalized form estimating the smoking economic burden by morbidity because this risk factor is researched as other risk factor without take account the self-particular characteristic from smoking. Then, the precise measurement from this rate is a significant present necessity for epidemiologic researches and health Budget administration too [3]. Smoking is given by the tobacco consumption [4]. Smoking impact over the Public Health mean san opportunity cost because of financial pressure to the health financial administration attributable to tobacco consumption [5]. People agree to tobacco consumption support that smoke is a personal and single decision. However, this argument don´t take account the smoker dependence to tobacco consumption because of nicotine. Also make reference to the effective employment because of the tobacco economy. Nevertheless, this argument don´t consider the labor productivity lose attributable to smoking given by labor time lose smoking and smoker earlier death before retire age [6]. Also is supported that earlier smoker death carries to fiscal save because of reduction in retirement payments. However, this argument don´t take account all social costs attributable to smoking before the smoker death [7]. Acknowledge the whole smoking economic impact over the health financial administration is very important. As consequence is important a precise measurement from this economic impact to design and apply effective policies or the smoking control [8,9]. WHO is agree increasing tobacco price by tax. This economic policy must provide a context where fiscal income would increase and tobacco consumption would reduce because of the general behavior from these economic goods as ordinaries and necessaries goods [10]. Thus is evidenced the real necessity from the precise estimation from the smoking economic burden for the Public Health and the whole society too [11]. In Cuba, fiscal income related to tobacco consumption, the economic heavy from the tobacco industry over the external trade and the social and cultural conditions close related to tobacco consumption don´t make easy the effective smoking control [12]. Cuba had developed several researches describing the relation between tobacco consumption, Price and other economic variables. However, Cuba hasn´t an actualized cost – benefit relation quantified to support an economic policy for an effective reduction from the tobacco consumption. This situation is given by the unknowledge from the smoking economic burden measurement´s [13]. Also had been researched the use from the tributary policy for the smoking control, showing the fesiability from this policy type to reduce the tobacco consumption. Nevertheless, anyone from these researches shows the whole smoking economic burden over the Public Health [14,15]. From the ten main death causes in Cuba seven are close related to tobacco consumption. All of them are no – communicable illnesses [16]. Patients attention because of these morbidity and mortality causes are mainly present in health institutions with middle or high especialization, carring to more expensive health services because of smoking [17]. Cuban´s goverment organizations had established several measures for the smoking control. However, the empiric evidence shows that those measures aren´t applied wholy [18]. By other side, the salarial measures adopted since had contributed to raise the net salary. For example, in 2010 the middle salary in Cuba was $448.00. In 2018 was $777.00. This increasing represent more than 9% growing annualy. However, since 1990´s until 2019 the trade minor price from tobacco was the same, only $7.00 the box of 20 units. This price represent less than $0.30 USD per box. This position had done more available the tobacco products carring to increase the effective demand of health services attributables to smoking. However, the unknow from the smoking economic burden by morbidity don´t may make a detailled valuation from the smoking impact over the health services administration [19]. Estimating the smoking economic impact are used mainly two ways. One is using the standart cost agree to the illness protocol. This method is used in limited context as health institution, for example, because of the unavailable generalization use for big populational research, for example, esstimating the smoking economc impact over the health services in a whole economy. At same time, this situation conditiones the effective capability from fiscal authorities for the smoking control [20]. The second way is agree to the economic burden rate. This method looks for determine the expected relative value from the Public Health spend attributable to smoking. This method is largely used in populational researches and is the main supporting the designing and application of public policies for the smoking control. This is the main method analyzed in this research.
Smoking Economic Burden by Morbidity Agree to the Illness Burden
The illness burden is an epidemiologic concept to measure the morbidity impacto ver the researched population. In relative terms is equivaent to the probability from the selected morbidity in the reearched population. In the analysis from the illness burden is included the analysis from the economic burden from the morbidity cause or risk factor researched. This ter mis equivalent to the probability from the cost attributable to the morbidity cause or risk factor researched [21]. Respect to smoking researching as risk factor, the morbidity attributable is a necessary condition but not sufficient determining the smoking economic burden by morbidity. Since the economic point of view, the illness burden attributable to smoking determines the potential demand of health services because of smoking while the economic burden by morbidity determines the effective demand of health services attributable to smoking [22]. Much researches uses the rate for illness burden attributable to smoking as the rate for the economic burden attributable to smoking by morbidity. This practice carries to a methodologic mistake and may make less trustable the researches results. Especifically this position is assumed when researches uses the economic burden because of active smokers as similar of the smoking economic burden by morbidity. Nevertheless, not all health spend because of active smokers is attributable to smoking and from no smokers health spend a portion is attributable to smoking because of passive smokers [22]. Then, the smoking economic burden by morbidity because of active smokers is always less than the illness burden attributable to smoking. Using both rate as similar carries to over value the true smoking economic impact over the health services. As example of that is research from 2016 in Latin America. In this case authors used the rate from the economic burden by morbidity in a way wich interpretation suggests that illness burden attributable to smoking because of active smokers is equal to the whole smoking economic burden by morbidity [23]. Other authors as Ariel Barchad [24], Isaranuwatchai [25], Lightwood y Glantz [26], Sung Max [27] had developed similar researches with similar procedure too. This condition shows the necessity to remake the rate estimating the smoking economic burden by morbidity because of active smokers. In Cuba had been developed several researches related to the smoking economic impact. Much from these researches compare the health spends because of active smokers and no active smokers assuming that the difference between then is attributable to smoking. By this way is assumed the same position previosly analyzed where the health spend by active smokers is used as equal to the health spends attributable to smoking [28]. These researches are suppousing that smoking dimension depend only from the active smoker existence witout consider the relation between the tobacco consumption intensity and the added affect from smoking in the morbidity attributable and the economic burden by morbidity too [28]. By other side, in the analyze from the smoking economic burden by morbidity is usually excluded the passive smokers. This condition makes that the smoking economic burden by morbidity isn´t showed wholy. In this case is important appoint that passive smoking is determined by active smoking because the tobacco active consumption determines the active smoking which determines the passive smoking. Then, the tobacco active consumption and the smoker’s number are main variables explaining the smoking economic burden by morbidity and not only the smoker’s number [22]. Passive smoking plays an important role estimating the smoking economic burden by morbidity and particularly in the cost – benefit relation. Passive smokers induce to health spend attributable to smoking agree to the economic burden attributable to smoking because of active smokers. Also, passive smokers don´t carry to fiscal income because they don´t by tobacco. However, passive smokers spend attributable to smoking may be very significant too [29]. Abstracting, since the economic point of view the main limitation identified estimating the smoking economic burden by morbidity is given by attributating the whole smoking economic burden by morbidity to actie smokers. That´s why a precise estimation from the smoking economic burden by morbidity demand two main modification: 1. Remake the rate for the smoking economic burden by morbidity because of active smokers. 2. Include in the analyze the passive smokers. To answer these limitations Fé Fernández Hernández and Efraín Sánchez González introduced new conceptions that carried to propouse significant transformations estimating the smoking economic burden by morbidity agree to the Medical Journal of Pinar del Río [29]. Nevertheless, it is necessary to valorate the designed rate to measure the smoking economic burden by morbidity. This is the main objective from this research.
Methods
Was made a bibliographic research to describe the estimation process from the smoking economic burden by morbidity. Were utilized as theoretical method the analysis and synthesis, the comparative and the systematization. As empiric methods were used the Principle of Multiplication and the bibliographic research
Results
The economic burden attributable to someone risk factor is determined by the happening of three independient successes at same time: the existence of some person affected by the researched risk factor, the existence of the morbidity related to the researched risk factor and the effective demand of health services attributable to the researched risk factor [22]. Each one from these successes has a probability associated. Agree to the Multiplication Principle, if someone success A is determined by the happening of several independient successes at same time, the probability associated to A is equal to the product of the probabilities from all successes determining the A happening [30,31].
The Smoking Economic Burden Over the Public Health
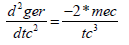
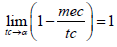
All tobacco consumption damages the human health. Then, the illness burden by smoking born since the minimun tobacco consumption. In the smoking economic burden by morbidity case´s isn´t thus because this rate is also determined by the effective demand of health services attributable to smoking. Given that the potential demand is higher than the effective demand, then, the effective demand of health services attributable to smoking is less than the potential demand of health services attributable to the same risk factor. In epidemiologic terms means that the illness burden attributable to smoking is higher than the economic burden attributable to smoking by morbidity all rate measured in reative terms as Fé Fernández Hernández and Efraín Sánchez González suggested. However, there is a direct proportional relation between the effective demand of health servics attributable to smoking and the tobacco consumption over the minimum tobacco consumption determining the existence of the effective demand of health services attributable to smoking. This means that higher tobacco consumption over that minimun consumption means higher effective demand of health services attributable to smoking. Also means that with the growing of tobacco consumption the difference between the illness burdens attributable to smoking and the smoking economic burden by morbidity will be closing. The cited authors introduce two main concepts showed in following. 1. Minimun economic consumption (mec): minimun tobacco consumption determining the effective demand of health services attributable to smoking. 2. Gross economic risk (ger): part from the illness burden by morbidity determined by the effective demand of health services attributable to smoking. It is equivalent to the probability of the effective demand of health services attributable to smoking. Agree to authors, the mathematic fuction ger determined by the tobacco consumption (tc) has two parts Ger(tc) = 0; tc ≤ mec and Ger(tc) = 1 – mec/tc; tc>mec [29]
Analizing Ger
The tobacco consumption intensity and the morbidity attributable to smoking save a proportional relation with a dynamic in the same sense. As result, the effective demand of health services too because the close relaton between these variables [30]. In analytic terms should be equivalent to support that:
By other side the several impact from smoking over the morbidity at same time determine a desacelerated growing because the same patient only recieve a single health service at same time including when must afford several morbidity consequences attributable to smoking at same time. This phenomenon is more evident while tobacco consumption increases because of the growing in the morbidity attributable [30]. In analytic terms should be equivalent to support that:
By other side, it is evident that the smoking economic burden by morbidity is determined by the illness burden attributable to smoking and that´s the main reason of why those rates is close related. However, the accumulative efect from smoking over morbidity suggest a faster growing from the smoking economic burden by morbidity agree to tobacco consumption intensity. This analysis close to the previous may support that:
Abstracting, the rate suggested estimating the effective demand of health services attributable to smoking is trustable and contexted. Also is agree to the main economic and epidemiologic characteristics from smoking related to the estimation of the smoking economic burden by morbidity. As result, the smoking economic burden by morbidity because of active smoker must be calculated as the multiplication of the probability of the morbidity close related to smoking, the probability to has an active smoker and the probability of the effective demand of health services attributable to smoking given by ger. It is very important take account that exposition to tobacco smoke by smoking or passive exposition is a main variable to understand the smoking economic burden by morbidity behavior´s [22]. That´s why passive smoking needs be explicated by tobacco consumption and tobacco passive exposition at same time [20]. Null tobacco consumption means null smoking economic burden by morbidity because of passive smokers. This is because the smoking economic burden by morbidity because of passive smokers is determined by the smoking economic burden by morbidity because of active smokers agree to passive exposition rate. Then, assuming that 1) Morbidity causes attributable to smoking are the same for active and passive smokers, each one agree to self exposition to tobacco consumption, 2) The successes to have an active smoker, a passive smoker and a no smoker person are mutually excluding and complementaries at same time in the researched population the whole suggested rate estimating the smoking economic burden by morbidity is aproppiate [20]. The new formula suggested estimating the smoking economic burden by morbidity also: a. Acknowledges that only a part from the illness burden attributable to smoking has economic consequences agree to the effective demand of health services attributable to smoking; b. Acknowledges the main role from the tobacco consumption intensity and the tobacco passive exposition estimating the smoking economic burden by morbidity, and; c. Acknowledges the self responsibilities from active and passive smokers in the formation of the smoking economic burden by morbidity. However, the most important from the new formula is given by identify the difference between the potential and the effective demand of health services both attributable to smoking. This suggestion solve the limitation identified previosly in this research. Nevertheless, ger rate isn´t perfect because other rate with similar characteristic may obtain similar results but it easy useful suggest their utilization estimating the smoking economic burden by morbidity. The new formulation was partially utilized in the Cuban context limited to active smokers for 2019. The result showed that the 11.1% from the health spend in 2019 was attributable to active smoking. If in the cited research should be used the illness burden attributable to smoking as similar to the smoking economic burden by morbidity because of active smoker the rate value would be 16.4%. This difference means an over valuation from the smoking economic burden by morbidity because of active smoker in 5.3%, agree to the journal ECronicon Pulmonology and Respiratory Medicine [20]. Moreover the number result, the new formula solve the necessity to acknowledge and include the effective demand of health services attributable to smoking estimating the whole smoking economic burden by morbidity.
Conclusion
The new rate will provide a better estimation from the smoking economic burden by morbidity. Its application will may identify the role of active smokers and passive smokers in the formation of the smoking economic burden. However, its application must be agreed to the supposes identified.
Diagnostic Significance of Fine Needle Biopsy and Cell Block in Skin and Subcutaneous Nodules
Introduction
Skin and subcutaneous lesions are a common reason for patients to visit family doctors. Ultrasound is increasingly being used to confirm the diagnosis, but deep lesions must be evaluated with magnetic resonance imaging (MRI) or computed tomography (CT) to exclude invasion of the underlying structures and/or malignancy [1]. People can experience a wide range of growths and skin changes over the course of their lives. Family physicians must be able to distinguish between different skin tumors specially to rule out malignancy [2]. Skin malignancy represents one of the most dangerous types of cancers. It spreads gradually in its early stages, so it is necessary to detect it as soon as possible. It is suggested that skin cancer results from the presence of unpaired strands of deoxyribonucleic acid (DNA) in skin cells, resulting in skin genetic defects or mutations [3]. Evaluation of patients with skin or subcutaneous nodules, especially if they are multiple, is a major problem for clinicians. But with full investigations, the problem becomes easier. However, the definitive diagnosis depends on the pathological reports of tissue biopsy [4]. Easy access to skin nodules provides a good platform for performing fine needle cytology and sampling by pathologists or clinicians. Smear cytology gives several default settings [5]. Depth is more important than width. The skin nodule may be mobile or fixed in the underlying tissue. Proper management of skin or subcutaneous nodules needs to know their exact nature, benign or malignant. These nodules can be accessed through needle aspiration, to make smears and cell blocks; this action is relatively non-invasive outpatient procedure and does not require an operating room or anesthesia. It is also a cheap and fast process. Furthermore, it has been suggested that FNAC breast exam is very useful, relatively quick, inexpensive and less invasive test due to the size of the fine needle, and is easier and safer in some lesions, such as very small lesions or those directly under the skin [6]. The question was how is his sensitivity and specificity, and to what extent can he be relied upon in making a treatment decision? Therefore, this study aimed to verify the reliability of examination of smears and cell masses in the diagnosis of skin and subcutaneous nodules and to compare them with examination of tissue biopsies.
Material and Methods
Study Design and Samples’ Preparation
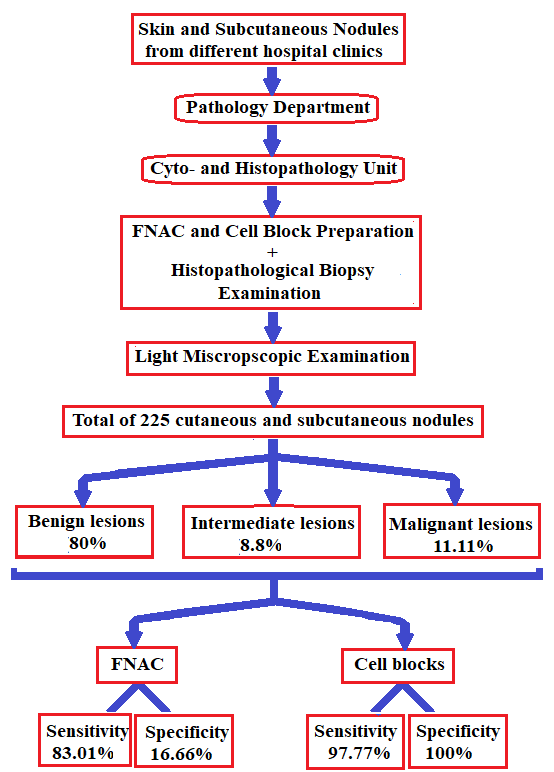
Samples of cutaneous or subcutaneous nodules from two hundred and twenty-five patients who decided and gave written consent to participate in the study were selected for this study. These patients were referred from various related clinics in University Hospitals to the Department of Pathology between January 2018 and December 2020. The patients underwent full history taking, general examination for pulse, temperature, respiration rate, body weight, and height. All malignant nodules were primary lesions. The nodules under study were examined clinically for location, size, plurality, shape, consistency, color, if hair was present or not, and whether there was change in color, size, shape, mobility or fixation. Then, a sterile 10 cc plastic syringe was opened, approximately 1 cc of air was taken, the cover was placed on the needle and it was ready for use. The lesion and the surrounding skin underwent a gentle massage with cotton gauze filled with 95% ethanol, then the needle was inserted close to the periphery of the node (avoiding the center where there may be necrotic material that hinders proper smear taking). The needle was moved in multiple directions with suction; then it was gently removed. Then, the suction site was under pressure with clean, sterile cotton gauze for at least 10 minutes to stop possible bleeding. The needle was gently removed from the syringe, and then 1 drop of the syringe’s content was placed on approximately 4 clean glass slides. The smear was prepared by gently moving the blunt end of the syringe.
The remainder of the fluid underwent addition of a mixture of10% neutral buffered formalin, and absolute ethanol, 1:1 solution by gentle suction of the previously prepared formalin/ ethanol mixture by the syringe. The smear was allowed to dry on the glass slides, then the slides are placed vertically in the staining container, with the addition of 95% ethanol, and left for 20 minutes to fix. Fixed smear slides were gently placed in water for 1 min, then in filtered hematoxylin for 5 min, then in tap water for 30 min, then in eosin for 1 min in tap water for 20 min. The slide smear then, underwent placing in ascending grades of ethanol till absolute alcohol. A cap was placed on the smear, which was then examined with an Olympus XL 30 binuclear microscope. The pellets of cells in the used syringe, were left for one day for fixation, then underwent processing to form paraffin blocks, according to Hegazy Method of tissue processing [7]. Unstained slides were prepared from the paraffin blocks then staining with Hematoxylin & eosin (H&E), Giemsa stain and Papaneacolou stain (PAP). Then, the slides were examined with an Olympus XL30 binuclear microscope and photographed with the digital camera on the microscope. Patients in this study underwent FNAC smears, performing cell masses if possible. Then, histological examinations of tissue biopsies were performed after surgical removal of the lesions.
Statistical Analysis
The correlation between results of FNAC smear and that of cell block study was examined by chi-square test and student T-test. Sensitivity test, & Specificity test for both FNAC smear and cell blocks were examined in relation to the tissue biopsy, considering the results of tissue biopsy examination as the reference positive cases [8]. All statistical tests were done with considering the significance value of chi-square test and T-test (P value significance =0.05 or less) using SPSS 16.0 for Windows (SPSS Inc. Chicago, Illinois, USA)
Results
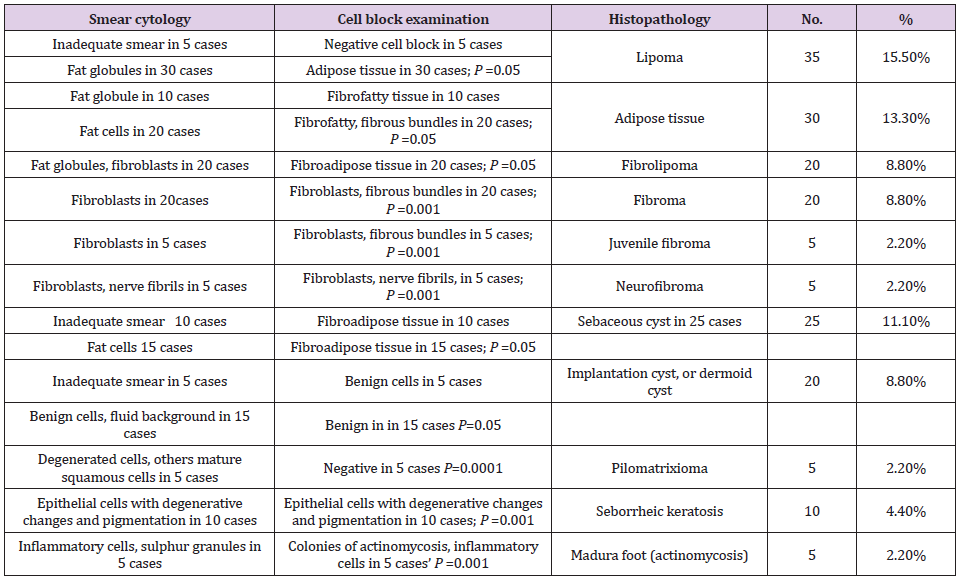
There was a wide range of ages in the patients who underwent this study. Their ages ranged between 2 and 76 years but most of them (80%) were between 40-45 years old. The genders of patients were predominantly female. The female to male ratio was 3 to 2, respectively. The results of the FNAC smear, cell block examination, and tissue biopsy examination are presented in Tables 1-3. The most relevant pictures of microscopic examination are placed in (Figures 1-10). Sensitivity and specificity test results of both FNAC smear and Cell block examination are summarized in the following data: For the FNAC smear examination: True positive cases = 220/225. True negative cases = 5 /225. False positive cases =25/225. False negative cases = 45/225. Sensitivity test = 220/220+45= 220/265=83.01%. Specificity test = 5/5+25=5/30= 16.66%. For the cell blocks examination: True positive cases = 220/225. True negative cases = 5 /225. False positive cases = 0/225. False negative cases =5/225. Sensitivity test = 220/220+5 =220/225 =97.77%. Specificity test = 5/5+0=5/5 = 100%.
Table 1: Results of FNAC smear, cell block examination, tissue biopsy in the benign nodules.
Table 2: Results of FNAC smear, cell block examination, tissue biopsy in the benign nodules.
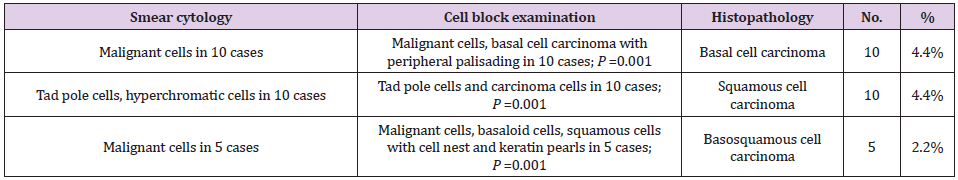
Table 3: Results of FNAC smear, cell blocks, and tissue biopsy in malignant nodules.
Discussion
In this study, we focused on the performance of cell mass and its importance in diagnosing and differentiating lesions due to its simplicity and reproducibility. We performed FNAC smear first, as it is a rapid test to detect the presence and types of cells in general and also to compare the features found in FNAC smear and those in cell blocks. FNAC is an easy to perform and inexpensive technique. It does not disturb the architecture of the lesion and has nothing to do with the promotion of metastasis of malignant lesions, because it is a non-invasive technique and does not harm the patient. It looks similar to intramuscular or subcutaneous injection of any medication using a fine needle. We utilized the clot method for preparation of cell blocks, other methods described by [9] and [10]. We preferred the clotting method because the structural forms of cells and tissues were more preserved. We utilized the same clotting method in preparation of cell blocks in two previous studies and gave excellent results [11]. Patients in this work ranged in age from 2 to 76 years with a greater transition to senescence (>40 years was about 70%), and the female to male ratio was 3 to 2, respectively with no significant outcome. This means that the appearance or complaint of the skin or subcutaneous nodules occurs more often in females and at older ages. For FNAC smear results, the test processed a sensitivity about 83% that is a significant percentage but lower than that of cell block (97.77%) This meant that cell block is more sensitive test than FNAC smear. Furthermore, cell block technique is more specific than FNAC smear, (100%) for cell block, and 16.66% for FNAC smear).
These results alluded to the role of cell block in appearance of cell orientations which give a picture resembling the tissue biopsy. Similarly, another study reported high sensitivity and specificity of FNAC in diagnosing skin lesions with sensitivity of up to 100% in epidermal cyst and inflammatory lesions, but showed only 67% for adnexal tumors [12]. The authors also reported specificity of 50% for adnexal tumors.In case of benign cyst, the cyst was filled of fluid, so the smear contains scanty cells, which may not appear, and the smear gave an insufficient result. Cell block provided more accurate result, but the performance of cell block may fail because of low cells and need gentle handling. In case of seborrehic keratosis, the smear was insignificant, because the cells were degenerated, with more brown pigmented cells; the features of cells were vague. On contrast in cell block, the benign features of cells were more obvious. This picture gives a confidence in diagnosis as a benign lesion. In cases of lipoma and fibrolipoma, the smear showed fat globules and/or mature fat cells, fibrous elements a picture found by other authors [13]. These features give a confidence of benign lesion, but the specific diagnosis cannot be achieved. The specific diagnosis of lipoma, fibrolipoma can be given easily in cell block. In cases of fibroma; the smear gave a suggestion of benign fibrotic lesion (spindle-shaped fibroblasts and some collagen fibers), but the cell block showed well-formed fibroma. In cases of juvenile fibromas, the smear may be negative because of the dense contents; however, the cell block is specific for diagnosis, moreover, it takes another importance to exclude juvenile fibrosarcoma and fibromatosis (the absence of mitotic activity).
On contrary of the previous lesions, FNAC smear provided satisfactory results that distinguished a benign lesion, and also specific for neurofibroma; because it gave us a picture of twisted nuclei, angulated and a hair-like background of neurofilaments a feature also found by [14]. In cases of pilomatrexioma, the smear gave a picture of benign lesion (ghost cells, mature epithelial cells, giant cells) the same picture found by[15], but the cell block failed in most cases because of the presence of admixed amounts of degenerated, or shadow cells. In cases of dermoid cysts or implantation cysts, the smear showed a mixture degenerated epithelial cells and keratinous material, a picture found also by [16], but the cell block also usually failed due to the keratinous material.In cases of atypical lipomas, FNAC smear showed a very useful picture; pleomorphic, hyperchromatic lipoblasts, mucoid background; the cell block did not add a more information. In cases of basal cell carcinoma; FNAC smear showed malignant cells with basophilic cytoplasm; the same results were found by [17], but the orientation of cells appeared in the cell block with peripheral palisading. In cases of squamous cell carcinoma, the malignant epithelial cells and the individual cell keratinization appeared in the smear. The FNAC smear showed a good picture but the specific feature of cell nests and keratin pearls appeared in the cell block. In cases of FNAC smear of basosqaumous cell carcinoma; the smear gave a picture of malignant epithelial cells, but the specific orientation of basosqaumous cell carcinoma appeared in the cell block,In cases of Madura foot, the smear showed mixed inflammatory cell infiltrate which was non-specific, but cell block was very useful to clarify the mycetoma colonies with appearance of peripheral esinophilic clubs; however, [18] could found this feature in the FNAC smear. The flowchart followed in the study and the main results are shown in Figure 11.
Figure 11: Flowchart showing main steps followed in the study and main findings.
Conclusion
Cell block study gives a more specific and more orientation of the cells similar to that of tissue biopsy. FNAC smear may give a useful advantage. Some lesions give negative results in smears, others give negative results in cell block. Therefore, we recommend performing FNAC smear as well as cell blocks whenever possible.
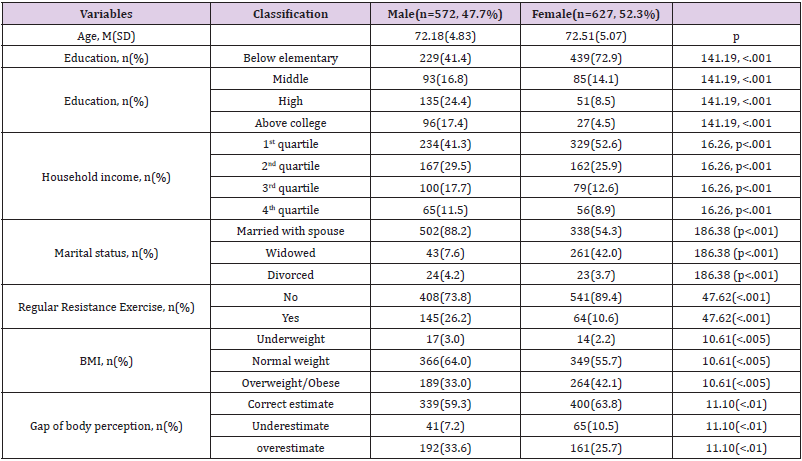
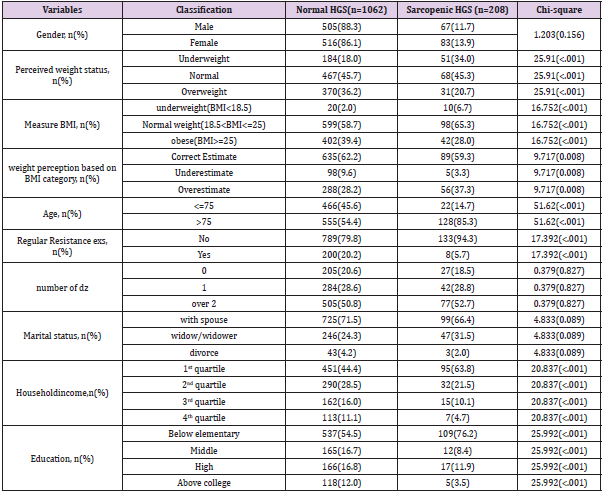
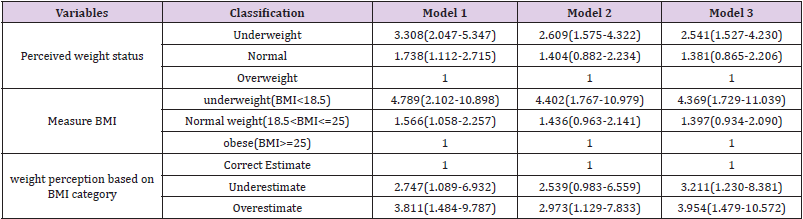
Association of Body Weight Misperception and Hand Grip Strength(HGS) in Korean Older Adults: KNHANES VII-1
ABSTRACT
This study aims to investigate the association of body weight misperception and handgrip strength (HGS) in elderly Koreans. A total of 1,199(male=572, female=627) elderly subjects (age ≥ 65 years), who participated in the Seventh Korea National Health and Nutrition Examination Survey (KNHANES VII-1, 2016) were analyzed. Participant’s hand grip strength, Body Mass Index (BMI), and perceived body weight were measured. By comparing participants’ perceived bodyweight category with their actual bodyweight category, participants were divided into three groups: correct estimate, underestimate, and overestimate. In results, the odds of sarcopenic HGS tended to increase with underweight perception but tended to decrease with normal weight perception(ORs: 2.54, 95% C.I: 1.527-4.230). Compared with the Obese group by BMI categorization, the underweight group, BMI under 18.5, increased ORs 4 times of sarcopenic HGS. Compared with correct estimated weight status, underestimation and overestimation of weight status were high odds of sarcopenic HGS (ORs: 3.21, 95% CI: 1.230-8.381 and ORs: 3.954, 95% C.I: 1.479-10.542). In conclusion, this study supports the hypothesis that weight misperception and the accuracy of the perceived weight are related to HGS.
Abbreviations: HGS: Handgrip Strength; BMI: Body Mass Index; ADLs: Activities of Daily Livings; ORs: Odds Ratio; CIs: Confidence Intervals
Introduction
Research on body weight perception in the adult population suggests that women have body shape ideals significantly smaller in size than their perceived current body shapes, whereas men are equally divided between those who want to be bigger than their perceived current shape. Research on the relationship between body weight perception in young adults suggests that regular participation in exercise can bring about positive changes in body image and self-concept. Handgrip strength (HGS) has been used to indicate muscle strength and as an important marker of frailty [1]. The reduction of dominant HGS in the older population undermines the Activities of Daily Livings (ADLs) such as washing, dressing, using the toilet, showering, defecating, and mobility. Further, HGS is largely proven as an explanator of overall strength, fractures, falls, cognitive impairment [2], and Metabolic syndrome [3]. To avoid weak muscle strength status and alleviate all risks above, we need to understand related factors and the relation between HGS and weight control in this population. Previous research, however, shows inconsistent results. Long-term overweight and obese status have been associated with lower HGS among the older population [4]. Others, however, reported that being underweight [5], higher fat mass, and weight loss are associated with weak muscle strength [6]. Meanwhile, the association between weight misperception perceived weight status, and handgrip strength is unclear. Recently, Lee [7] reported that fatter weight perception, correct weight estimation, and overestimated body weight was associated with a lower risk of decreased HGS in Korean adults. However, this association between HGS and bodyweight misperception in the senior population is unclear. Therefore, the present study was designed to examine the association between body weight misperception and handgrip strength in older adults.
Method
Study Population
This study is the second analysis of the data acquired in the KNHANES VII-1, 2016. The KNHANES has been examined since 1998 to assess the Korean population’s health and nutritional status. This survey utilized a multistage, complex, stratified, probability cluster survey of a representative sample of the noninstitutionalized population in South Korea. The annual sample of the survey is around 10,000-12,000 persons; 4600 households are selected and surveyed from a panel. The KNHANES VII-I consists of the nutrition survey, the health exam, and the health interview survey. Among a total of 8,150 persons age 19 and older who completed KNHANES VII-I, we used data 1,199 whose aged over 65 years and who had handgrip strength (HGS), BMI, body perception survey data (Figure 1).
Figure 1: Flow diagram for selection of study subjects.
Ethics Statement and Data Access
Access to the KNHANES data was acquired after getting approval from the Korea Center for Disease Control and Prevention. This study is a secondary analysis that used and analyzed the data from 2016 KNHANES data collected; therefore, approval from IRB was exempted and not required.
Data Collection
The data for this study comprises participants in the KNHANES 2016. Sociodemographic variables are age, gender, level of education, household income, marital status, regular exercise performance. Education level was classified as below elementary level, middle school graduate (<9 years of school), High school graduate (10-12 years of school), and college or above (>13 years of education). Monthly household income was divided by the number of family members and classified into quantifies for household income. For marital status, those with a spouse were defined as ‘with the spouse,’ singles after divorced as ‘divorced,’ singles of the widow, and widower as ‘widow/widower.’ Regular resistance exercise was defined as performing.
Assessment of Hand Grip Strength (HGS), BMI, Body Perception Parameter
Handgrip strength was measured three times in each hand with a grip strength dynamometer (TKK5401; Takei Scientific Instruments, Co., Ltd., Tokyo, Japan). Trained technicians instructed subjects to hold measures with the distal interphalangeal finger joints of the hand at 90 degrees to the handle and squeeze the handle as hard as possible. We analyzed data of max HGS for this study. Sarcopenic handgrip strength (HGS) was defined as the mean value of HGS <27kg for men and <16kg for women Cruz-Jentoft, et al. [8]. Bodyweight and height were measured, and BMI was calculated as weight divided by height squared (kg/m2). Based on the Korean Society for the Study of Obesity practice guidelines Korean Society for the Study of Obesity [9], we classified BMI into four groups according to BMI: underweight (BMI<18.4kg/m2), normal weight(18.5≤BMI<23.0kg/m2), overweight (23≤BMI<25kg/m2), moderate obesity (25≤BMI<30kg/m2) and severe obesity(30kg/ m2≥BMI). BMI classification was collapsed into a three-tier variable: in each BMI category, ‘underweight’ was labeled as ‘underweight,’ ‘normal’ and ‘overweight’ were re-labeled as ‘normal,’ and ‘moderate obesity and severe obesity were re-labeled as’ obesity.’ Body perception was asked to each participant as rate his or her body weight as very underweight, underweight, normal, overweight, and very overweight. The responses to body weight were re-categorized into a three-tier variable: In each perception of body weight, ‘very underweight’ and ‘underweight’ were considered as ‘underweight,’ ‘normal’ was considered as ‘normal,’ ‘overweight’ and ‘very overweight’ were considered as ‘overweight.’ By comparing participants’ perceived bodyweight category with their actual bodyweight category, participants were divided into three groups: correct estimate (the group with the agreement between BMI category and self-recognized body weight), underestimate (group recognized as lighter than BMI criteria), and overestimate (group recognized as heavier than BMI criteria).
Statistical Analysis
A Chi-square test or t-test was conducted to compare characteristics between participants with normal HGS and those with sarcopenic HGS. In all participants, multiple logistic regression analyses were conducted to estimate the odds ratio (ORs) and 95% confidence intervals (CIs) between the gap of body perception and grip strength, as well as between BMI categories and selfperceptions of the body using IBM SPSS version 22.0(IBM CO, Armonk, NY, USA). We also conducted a chi-square test to analyze differences in variables from baseline characteristics. The covariate included were age, education, household income, and resistance training.
Results
Baseline Characteristics
The general characteristics of subjects are shown in Table 1. The study population included 572 men (mean age 72.18 years) and 627 women (mean age 72.15 years) from KNHANES VI-1. There was no difference in mean age between men and women. While 58.6% of the men had more than middle school education, only 27.1% among women (F=141.19, p<.001). While 88.2% of men have a spouse, it was only 54.3% among women, and widowhood was more prevalent in women than men (42.0% vs. 7.6% among men, F=186.38, p<.001). As for household income, 41.3% of men and 52.6% of women had the lowest quartile (F=16.26, p<.001). When classified by BMI category, 33.0% and 42.1% of the men and women were classified as overweight/obese, while 3.0% and 2.2% were underweight, respectively (F=10.61, p<.01). Among 1199 subjects, 8.9% of subjects(n=107) had underestimated, that was, seniors’ perceived body weight was lighter than their actual body weight. 61.6% of seniors (n=739) had accurately estimated, that was, perceived their body weight was consistent to their actual body weight; 29.4% of subjects (n=353) had overestimated, that was, they perceived their body weight heavier than their actual body weight. More women (10.5% vs. 7.2%) underestimate their actual body weight compared with objective measures (F=11.01, p<.01).
Table 1: Baseline characteristics of participants (n=1199).
Note: BMI: Body Mass Index.
In our subjects, 12.8% had sarcopenic HGS. Compared with participants with normal HGS, those with sarcopenic HGS were more likely to be older, be women, perceive themselves as underweight, be categorized by underweight based on BMI, be overestimated their weight, perform less regular resistance exercise, have lower household income, and be less educated (Table 2). Table 3 shows the associations between perceived weight misperception and sarcopenic Handgrip strength (HGS) according to adjustment levels of confounding factors. In fully controlled models, the odds of sarcopenic HGS tended to increase with underweight perception but tended to decrease with normal weight perception (ORs: 2.54, 95% C.I: 1.527-4.230). Compared with the Obese group by BMI categorization, the underweight group, BMI under 18.5, increased ORs 4 times of sarcopenic HGS. Compared with correct estimated weight status, underestimation and overestimation of weight status were high odds of sarcopenic HGS (ORs: 3.21, 95% CI: 1.230-8.381 and ORs: 3.954, 95% C.I: 1.479-10.542).
Table 2: Summarizes the comparison of the actual weight status, sociodemographic, health, lifestyle factors between an individual with normal and sarcopenic handgrip strength (HGS).
Table 3: Summarizes the comparison of the actual weight status, sociodemographic, health, lifestyle factors between an individual with normal and sarcopenic handgrip strength (HGS).
Note: Values represent Odd Ratio(ORs) (95% confidence interval) for sarcopenic handgrip strength using logistic regression after controlling for age and gender (model 1), for age, gender, education, household income, marital status (Model 2), for age, gender, education, household income, marital status, regular resistance exercise (Model 3) p for trend using linear regression analysis after adjusting for same confounding factors in each model.
Discussion
This study examined the association between body weight misperception and handgrip strength in older adults, using extensive nationally representative population data. Results showed that underweight perception, objectively measured underweight status, incorrect estimation of weight were associated with a higher risk for sarcopenic HGS after controlling for sociodemographic factors and health behavior. These findings were consistent across both genders and weight statuses. According to the previous research targeting the older population, weight tends to be underestimated or overestimated[10]. Findings from a study of Japanese seniors [11] reported that the increase in the risk for underestimation was more obvious than that for overestimation in women, which is comparable with our results that more elders overestimated their body weight (29.4%) than underestimation (8.9%). Given that women rarely overestimated their weight, the overestimation found in our study may indicate an increasing rate of attention toward healthy habits and lifestyles changes in the older population. Because Korean National Health Insurance Services provide medical exams every two years free of charge to make most of the elder’s attention to their body shape and condition. This study reported the association between weight misperception and low grip strength in older adults. Although mechanisms for the results are unclear, given that grip strength is critical for independent living in later life, this result should be attending. One potential factor could be obesity or sarcopenia. In a previous study, percent body fat among older adults was associated with a higher volume of muscle mass and muscle strength when examined knee extension strength [12]. Therefore, seniors who believe their weight to be lighter or heavier than their actual weight status affect their lifestyles such as exercise and diet habits. Seniors who underestimate their weight may be less motivated to make efforts to lose weight. In contrast, elders who overestimate their weight may be less motivated to make efforts to gain weight. This study (to the best of our knowledge) reported the relationships of weigh-perception with HGS based on a Nationally representative sample of older Korean populations. However, this study has limitations such as uncontrolled factors and potential causality, a possible bias of measurement errors of HGS to generalize the results to other populations. In conclusion, this study supports the hypothesis that weight misperception and the accuracy of the perceived weight are related to HGS. The results indicate that the programs for seniors make them aware of their actual body weight and health education for seniors to motivate them for healthy lifestyles based on their body weight and disease status to keep their independent lives.
Role of Diffusion Weighted Magnetic Resonance Imaging in Diabetic Foot and Ankle Disease
Diabetes mellitus (DM) is one of the most common chronic diseases in the United States (US) and worldwide. The National Diabetes Statistics Report 2020 by the Center of Disease prevention and Control (CDC) estimates approximately 34.2 million people in the US alone to be affected with DM (10.5% of total US population), of which 34.1 million will be more than 18 years of age (13% of all US adults) [1]. An overwhelming 88 million adults 18 years or older have prediabetes (34.5% of the adult US population), adding substantially to the overall burden of the disease [1]. The estimated total economic burden of diagnosed DM in 2017 was $327 billion and 1 in 7 healthcare dollars is spent on treating diabetes and its complications [2]. DM is the leading cause of atraumatic lower extremity amputations, which accounted for 130,000 hospital discharges in 2016 (5.6 per 1,000 adults with diabetes) [1]. Diabetic foot and ankle disease include several pathologies that result from a combination of peripheral neuropathy and peripheral arterial disease (PAD) [3]. The wide spectrum of diabetic foot and ankle disease ranges from superficial soft tissues pathologies like edema, cellulitis, Diabetic foot ulcer (DFU), and inter-fascial abscess to deeper soft tissue infections like necrotizing fasciitis, intermuscular abscess, dry and wet gangrene, infected tenosynovitis and infected bursitis, diabetic myonecrosis and bone infections, including osteomyelitis (DFO) and intraosseous abscess. Underlying Charcot’s neuropathy or neuroarthropathy is commonly associated with such lesions. In addition, charcot neuroarthropathy (CNA) and DFO often coexist, rendering clinical diagnosis challenging. PAD is common in patients with DM. Arterial hypoperfusion can lead to ulceration, delayed wound healing, limb ischemia and gangrene, and may ultimately necessitate amputation. Early and accurate diagnosis of diabetic foot complications can reduce patient morbidity, health care costs, and limb amputations while potentially improving wound healing and quality of life [4]. Imaging, in conjunction with clinical examination, plays a vital role in the diagnosis and follow-up of DFD. The diagnostic evaluation often includes a variety of imaging modalities including radiographs, ultrasound (US), CT, nuclear medicine scintigraphy, and MRI, each with their own advantages and limitations [4]. Plain radiographs are cost-effective for screening fractures, advanced neuroarthropathy, soft tissue swelling and gas, and cortical erosions of DFO. US assists in identifying and draining soft tissue fluid collections/abscesses. CT shows fluid collections, gas in necrotizing fasciitis and cortical erosion / sequestrum. MRI provides accurate information of both soft tissue and bone pathology and, in conjunction with a plain radiograph, is usually the imaging modality of choice for evaluating the extent of musculoskeletal infection. MRI also renders early diagnosis of CNA and helps differentiate CNA and DFO from other conditions, such as Gout [5]. Intravenous gadolinium is often needed to detect soft tissue abscess in the mound of edema and differentiate simple effusions from synovitis as well as to characterize sinus tracts [6]. Diffusion weighted imaging (DWI) is being increasingly used in musculoskeletal imaging in conjunction with traditional MRI sequences for tumor and infection imaging [7-9]. Hydrogen proton diffusion refers to the random Brownian motion of the water molecules, which in the human body live in a complex milieu divided between extracellular and intracellular compartments. Different tissues of the human body have different proportions of intra and extracellular compartments, and hence have characteristic diffusion properties [10]. DWI also exploits the differences in diffusion between the normal and abnormal tissues. Typically, more cellular, protein or pus containing structures exhibit restricted diffusion, and high intensity on DWI with correspondingly low intensity on apparent diffusion coefficient (ADC) images. Different ADC values are seen in various tissues and pathologies, assisting the the MRI diagnosis of different pathologies in the setting of DFD. DWI use is still limited to only a few centers despite added value in conventional MRI [7,8]. This review article highlights the optimal technical considerations for DWI and discusses its role as a problem-solving tool in differentiating the wide spectrum of DFD pathologies. The reader will be able to use these principles and apply DWI for DFD for the benefit of their patient population.
Diffusion Weighted Imaging
The detailed physics behind the acquisition of DWI is beyond the scope of this article. Briefly, a single-shot echo planar imaging (SS-EPI) technique is used to acquire such images [11]. Two diffusion gradients are applied on either side of the 180-degree refocusing pulse to interrogate information about tissue diffusion. Strength of diffusion gradients is characterized as ‘b’ (diffusion moment) parameter and higher b-values correspond to stronger moments. At least two images, one with no diffusion gradient (b=0 s/mm2) and a second with a diffusion gradient (e.g. b=50-1000 s/ mm2) are needed to mathematically compute an ADC value which quantifies the amount of diffusion at each pixel (9). Bright signal areas on high b-value DWI images with corresponding low ADC values indicate restricted diffusion while a bright area on DWI and high ADC indicates T2 shine through effect [12]. ADC is calculated on a pixel-by-pixel basis, and minimum, maximum, and mean values can be measured, usually expressed as square millimeters per second (mm2/sec) using a complex mathematical equation [11]. For musculoskeletal MRI, b values of 50, 400 and 800 s/ mm2 are commonly acquired. For best technical performance, echo times are kept at minimum, echo spacing should be below 0.7ms, fat suppression is best kept as adiabatic inversion recovery to reduce ghosting artifacts, axial plane of imaging provides the most distortion free imaging, and motion of extremity should be minimized with foot padding or patient comfort during scanning. Typical parameters of DWI are (TR= 6500-8000ms, TE= 56-65ms, slice= 4mm, matrix 128×128, fat suppression= adiabatic inversion recovery, SS-EPI sequence). ROI (region of interest) is placed on the ADC images to evaluate mean and minimum ADC within the lesion for a quantitative assessment. In authors practice, mean ADC is used in almost all circumstances. The range of mean ADC values (x10-3 mm2/s) for the spectrum of MSK infections as described by Kumar et al. are illustrated in Table 1 [8].
Table 1: Range of ADC values (x10-3 mm2/s) in the spectrum of musculoskeletal infections.
Role of DWI in Diabetic Foot and Ankle Diseases
Soft Tissue Pathologies
Almost all diabetic foot infections begin with a foot ulcer [13]. Subcutaneous noninfectious edema is commonly seen in the diabetic patient population either due to diabetic vascular insufficiency or lymphedema. It is a noninfectious inflammatory condition of the superficial soft tissues, clinically presenting as soft tissue swelling and pain. Cellulitis is a non-necrotizing superficial soft tissue infection usually caused by a breach in the skin surface/ulcer. Staphylococcus aureus and Streptococcus pyogenes are common pathogens responsible for cellulitis [6]. t also clinically presents with soft tissue selling, pain, redness, warmth, and erythema of the superficial soft tissues with accompanied systemic manifestations of fever and malaise. The diagnosis of these conditions is usually clinical, but imaging is often obtained to rule out deeper extent of the infection, which may necessitate intravenous or prolonged course of antibiotics. Conventional MRI shows overlapping features between cellulitis and noninfectious edema with both showing T2 bright superficial soft tissues and skin thickening. Cellulitis shows enhancement of the soft tissues and skin ulceration in addition [14]. On DWI, both entities show T2 shine through effect, less so in cellulitis (ADC= 1.2-2.0) versus noninfectious superficial edema (ADC = 2.0-3.0) (Figure 1). This differentiation helps clinically, as cellulitis, if not adequately managed, may result in further complications such as necrotizing fasciitis, abscess, and gangrene.
Inter-fascial and intermuscular abscess refers to loculated pocket of fluid collection within the fascial plane or in-between muscles. These are fluid like-T2 hyperintense collections with peripheral rim enhancement on post contrast images. In the setting of the DFD with cellulitis, small pockets of fluid collections may be challenging to identify on conventional MRI from the background diffuse mound of hyperintense soft tissue edema. DWI images are particularly helpful in accurately finding these small pockets of abscesses as they typically show restricted diffusion (ADC= 0.6- 1.2). Figure 2 Diffusion in an abscess is extremely slowed due to the presence of inflammatory cells, cellular debris, bacteria, and proteins. DWI helps to identify the deeper extent of a superficial abscess guiding appropriate drainage and management. A study by Harish et al. showed that DWI, in conjunction with other unenhanced MR imaging sequences of the area of interest, lead to similar confidence levels of readers as the post-contrast images in diagnosing abscess [15]. In another study by Unal et al. DWI showed a sensitivity and specificity for detecting soft tissue abscesses of 92% and 80% respectively [16]. DWI also helps differentiate abscess from adventitial bursitis adjacent to DFU or simply necrotic tissue without pus (both showing T2 shine through effect).
Figure 1: Cellulitis and myositis. Middle aged man with known type II DM presenting with skin ulcer, skin thickening (short arrow), plantar soft tissue swelling (medium arrow) and myositis (long arrow). Axial T1W (A), FS T2 (B), DWI (C), ADC (D), and color map (E). Myositis and cellulitis demonstrate increased signal on DWI (C) and associated enhancement on ADC and color map (D and E) with ADC values 1.6 for myositis and 1.7 x 10⁻³ mm2/s for cellulitis.
Figure 2: 54-year-old man with proximal phalanx osteomyelitis and abscess. Sagittal T1 (A), T2 FS (B), T1 FS post (C), STIR (D), T1 FS post contrast (E), DWI (F), ADC (G) and color map (H). Osteomyelitis (long arrow) is demonstrated by low T1 signal, edema and enhancement after contrast. Associated osseous enhancement on ADC and color map (green compared to blue in normal marrow). Subcutaneous fluid collection (short arrow) demonstrates restricted diffusion (blue) with ADC of 0.5 x 10⁻³ mm2/s indicative of abscess (E-H).
Infectious tenosynovitis is characterized by infection of the closed synovial sheath of the tendon [17]. Infected fluid/pus accumulates within the tendon sheath. DWI images help distinguish it from mechanical or reactive tenosynovitis as infectious tenosynovitis will show restricted diffusion. Adjacent joints should be evaluated to exclude associated septic arthritis. Septic bursitis is also within the same spectrum of closed synovial space infection, most commonly affecting superficial bursae likely secondary to direct inoculation. Again, DWI images help differentiate septic bursitis from reactive bursitis due to restricted diffusion with infection. Identification of these two entities is necessary as early treatment with appropriate antibiotics and surgery or drainage of the infected bursa, if necessary, can be performed in a timely fashion [17]. In authors’ experience, accumulation of pus in a soft tissue abscess, tendon sheath or a bursa, all will have ADC values ranging from 0.6- 1.1 (x10-3 mm2/s). In an abscess with a communicating ulcer or a draining fistula, the restriction on DWI is more often localized to the edges of the abscess as opposed to a closed infected cavity. Necrotizing fasciitis (NF) is a medical emergency characterized by a rapidly progressing, potentially fatal soft tissue infectious process. It is usually polymicrobial in etiology. Soft tissue infection dissecting along the fascial planes without a penetrating injury or iatrogenic cause is pathognomonic [18]. Historically, presence of gas in the fascial planes as observed on plain radiographs or CT is described as a classic imaging finding. However, absence of air along the fascial planes does not rule out necrotizing fasciitis in the setting of high clinical suspicion [19]. It is commonly seen in patients with diabetes and early surgical debridement can be lifesaving in these cases. MRI is often not performed given the urgency of these cases and the time taken to perform a complete MRI. However, MRI has been shown to diagnose NF in earlier stages where subcutaneous emphysema has not yet developed [20]. In a study by Kim et al. patients with necrotizing fasciitis showed thick (≥3 mm) fascial hyperintensity on fat-suppressed T2-weighted images, or extensive involvement of the deep fascia with low signal intensity on fat-suppressed T2-weighted images, a focal or diffuse non-enhancing portion in the deep fascia, and involvement of three or more compartments in one extremity [21]. DWI can help identify small inter-fascial or intramuscular abscesses (pyomyositis) in such setting. Foci of soft tissue air are seen as signal void on all pulse sequences and exhibit blooming artifact on gradient echo sequences like DWI [22,23]. Gangrene refers to necrosis of the soft tissues, almost exclusively seen in DM or PAD patients adjacent to a DFU [24]. It is characterized as devitalized soft tissue with characteristic nonenhancement on post contrast imaging (Figure 3). Gangrene is of two types: dry and wet, with dry, usually without infection, and wet indicating superimposed infection. Wet gangrene can also have soft tissue emphysema. Air is again seen as blooming artifact on DWI. It has been proposed that gas associated with wet gangrene is far more extensive when compared to a penetrating ulcer [25]. Wet gangrene unless associated with an abscess exhibits T2 shine through effect. Also, as noted by Ledermann et al., areas of abscess can be masked within the region of necrotic tissue on routine non-contrast MRI [24]. DWI can easily find abscess within the devitalized soft tissues.
Figure 3: Devitalized tissue and muscle denervation. Sagittal STIR (A), T1 (B), T1 FS post contrast (C), DWI (D) and color map (E). Patchy edema in plantar subcutaneous fat (A and B, arrows) from tissue ischemia with mild enhancement (C, arrow) due to cellulitis. Associated increased signal on DWI (D, arrow) and enhancement (red) on the color map (E, arrow) due to surrounding cellulitis.
Muscle Pathologies
Pyomyositis exhibits T2 hyperintense muscle and peri-epimysial edema. Small intramuscular abscesses may be difficult to recognize without contrast MRI. DWI helps identify localized abscess within the area of myositis. Formation of intramuscular abscess is a hallmark of pyomyositis [23]. DWI also helps in differentiating pyomyositis from diabetic myonecrosis described below, the latter shows only T2 shine through effect [8].
Diabetic myonecrosis is a unique pathologic entity seen in diabetic patients with unknown exact etiology, possibly a result of microangiopathy. Clinical presentation includes acute onset pain, induration, swelling and elevated serum lactate and CPK levels. MRI shows areas of heterogeneous T2 hyper intensity without an intramuscular abscess, as opposed to pyomyositis [26] (Figure 5). DWI assists in recognizing abscess in pyomyositis. Diabetic myonecrosis shows T2 shine through effect with elevated ADC>1.5 (normal muscle ADC= 1.3-1.5). It is prudent to differentiate these two conditions as diabetic myonecrosis is treated conservatively with bed rest, glycemic control and nonsteroidal anti-inflammatory agents whereas pyomyositis may require surgical debridement [27,28].
Figure 4: Charcot arthropathy. Lateral foot radiograph (A), sagittal T1 (B), STIR (C), T1 FS post contrast (D), DWI/ADC/color map (E). Osseous destruction and debris in the hindfoot (A and B) with associated osseous edema (B) and enhancement after contrast (C). Fluid collection (short arrow) does not demonstrate restricted diffusion (ADC 2.5 and red on color map) consistent with sterile collection. Corresponding enhancement on ADC and color map imaging (E).
Figure 5: 46-year-old diabetic man with muscle denervation and ischemia, elevated LDH, CPK and serum lactate levels. Axial T1 (A), FS T2 (B), DWI (C), ADC (D) and color map (E). Muscle edema in the medial gastrocnemius (small arrow) readily apparent on the FS T2 sequence; however, DWI and ADC with color map demonstrate enhancement in the anterior compartment (long arrow) indicative of denervation that is not appreciated on the T1 and FS T2 imaging.
Osseous Abnormalities
Diabetic Foot Osteomyelitis (DFO) is one of the most common complications in diabetics with a foot ulcer. DFO is usually due to non-healing ulcer and is associated with higher risk of limb amputation, longer duration of hospital stay, prolonged need of intravenous antibiotics and delayed wound healing [29]. DFO can affect any bone but most frequently affects the forefoot and midfoot [30]. Transtibial amputation is more frequently performed with DFO involving the hindfoot when compared to the forefoot, which can be salvaged with below ankle amputation [31]. Early diagnosis of DFO, i.e. before the development of exposed bone, extensive ischemia or soft tissue necrosis, is critical for the success of conservative surgery and can obviate the need for local or highlevel amputation [32]. MRI is the imaging modality of choice to diagnose osteomyelitis. The easiest way to diagnose osteomyelitis is to identify the superficial ulcer and its sinus tract extending to the bone with confluent marrow signal abnormality [33]. Reactive marrow edema is identified as T2 hyperintensity without corresponding T1 hypo intensity while DFO shows confluent T1 hypo intensity as well. DWI signal is low in the normal bone marrow (ADC= 0.2- 0.4 x 10⁻³ mm2/s), which becomes hyperintense in the settings of reactive marrow edema and intraosseous or subperiosteal abscess. In authors experience, ADC of reactive marrow edema falls within 1.4-1.9 x 10⁻³ mm2/s while in osteomyelitis, there is relatively less ADC enhancement (0.6-1.3 x 10⁻³ mm2/s) (Figures 2,6,7). Eren et al. showed that DWI supplements conventional MRI without added intravenous contrast in diagnosing DFO (34). They found the ADC values were significantly lower in patients with osteomyelitis (0.75 x 10⁻³ mm2/s) compared to those without osteomyelitis (0.90 x 10⁻³ mm2/s). While ADC values may vary depending upon the scanner strength and signal of the image, the presence of intra-osseous abscess reduces the ADC values to below 0.8 x 10⁻³ mm2/s versus its absence leads to higher ADC values up to 1.3 x 10⁻³ mm2/s in authors’ experience. ADC can also be used to assess treatment response, i.e. partially treated osteomyelitis will have slightly higher ADC ranging from 1.4-1.9 x 10⁻³ mm2/s and these values increase with resolution of abscess and decrease later on with the return of fatty marrow.
Figure 6: 41-year-old diabetic man with osteomyelitis. Coronal T1 (A), FS T2 (B), DWI (C), ADC (D) and color map (E). Subcutaneous edema and fluid collection (short arrow) with subjacent osteomyelitis of the calcaneus (long arrow) demonstrated by cortical erosion, T1 hypointense signal and enhancement on post contrast imaging. Associated enhancement noted on ADC and color map with an ADC of 1.4 x 10⁻³ mm2/s (green).
Figure 7: 34-year-old woman with trauma and superimposed osteomyelitis. Coronal T1 (A), FS T2 (B), T1 FS post contrast (C), DWI (D), color map (E). T1 hypointense signal at the metatarsal bases (A, arrow) with cortical edema (B, arrow) and enhancement on post contrast imaging (C, arrow). Cortical hyperintense outline also noted on DWI (D, arrow) and color map with an ADC of 1.5 x 10⁻³ mm2/s (E, arrow, green), blue represents first and fifth metatarsals as control for normal marrow (E).
Diabetes mellitus is currently the most common cause of neuropathic osteoarthropathy (Figure 4), which most frequently affects the foot and ankle [35]. Diabetic CNA is a devastating and disabling complication of diabetic neuropathy. It is characterized by acute excessive inflammatory response leading to local osteoporosis and devastating fractures and deformity of the foot [36]. A severe deformity, in addition to the above described mechanisms, will result in a secondary ulceration, infection, and amputation [37]. It is secondary to a combination of peripheral neuropathy and PAD resulting in decreased proprioception causing repetitive trauma, ischemia, poor healing, joint instability, cartilage loss, deformity, and increased new bone formation [38]. CNA often begins in the midfoot, and subluxation usually starts at the second tarsometatarsal joint [39]. MRI is very sensitive in detection of early changes of CNA as offloading the extremity can halt or delay the progression of this devastating disease [40]. Early signs on MRI include bone marrow edema and soft tissue edema, joint effusion, and eventually subchondral microfractures [40,41]. Disruption of the Lisfranc ligament, plantar calcaneo-navicular ligament, and plantar fascia is seen in early stages, which can result in midfoot collapse and malalignments [42]. Distinguishing between DFO and CNA is challenging in patients with diabetes. Ahmadi et al concluded that the presence of a sinus tract, replacement of soft-tissue fat, fluid collection(s) and extensive marrow abnormality indicate superimposed infection [41]. Neuroarthropathy commonly affects the tarsometatarsal and metatarsophalangeal joints whereas osteomyelitis occurs distal to the tarsometatarsal joint and in the calcaneus. DFO develops, almost exclusively, by the contiguous spread of infection from skin ulceration at predictable sites, whereas CNA is primarily articular, bilateral, and presents as subchondral cysts [33]. CNA with superimposed infection further complicates the landscape. DWI and ADC can play a vital role in differentiating these entities. A prospective study by Razek et. al. found that the mean ADC of acute diabetic osteoarthropathy was 1.27 ×10⁻³ mm2/s and that for diabetic osteomyelitis was 0.86 ×10⁻³ mm2/s. They established a cut-off ADC value of approximately 1.0 ×10⁻³ mm2/s to differentiate acute diabetic osteoarthropathy and osteomyelitis with approximately 94% accuracy [43].
Peripheral Nerve Pathologies
The four prime mechanisms causing hyperglycemic nerve damage are oxidative stress from the polyol pathway, increased hexosamine pathway flux, elevated levels of intracellular advanced glycated end products (AGE) and activation of protein kinase [44-46]. Excessive oxidative stress and vasoconstriction lead to ischemia of the nerve cells, nerve cell injury and death [47]. Neuropathy in diabetic patients is manifested in motor, autonomic and sensory divisions of the nervous system [48]. Damage to motor nerves leads to atrophy and edema-like T2 signal of the foot muscles leading to foot deformities and eventually CNA. Autonomic disturbances lead to dry skin of the foot, predisposing to fissuring [49]. Sensory neuropathy in extremities lead to loss of sensitivity to pain, temperature and proprioception resulting in repeated foot injuries, ulcer formation and/or secondary infection. Diabetic neuropathy is a well-recognized complication of longstanding diabetes. Up until recently, nerve conduction studies and biopsy were the only available options to diagnose peripheral neuropathy in diabetic patients, demonstrating a loss of myelin in peroneal and sural nerves [50]. MRI can recognize denervation changes in the muscles, seen as high signal on DWI and ADC maps (Figures 5&8). Dedicated peripheral nerve imaging, MR neurography (MRN) present another avenue to recognize this complication [51-54]. Anatomic MRN is typically performed using 3D heavily T2W imaging evaluation of peripheral nerves and regional muscles [55]. More recently, DWI and diffusion tensor imaging (DTI) neurography have been extensively studied and used in the assessment of peripheral nerves [56-58]. While the pathologic nerves exhibit increased T2 signal alteration with or without enlargement in the setting of neuropathy, DTI in addition exhibits elevated ADC and low fractional anisotropy (FA) values. DWI and DTI also depict abnormal muscles with increased conspicuity as compared to conventional MR images. The recommended maximum b value for DWI neurography range from 600 to 800 sec/ mm2 to enable adequate visualization of peripheral nerves with an acceptable signal to noise ratio (SNR) (50). Further research is ongoing with respect to the use of DTI in diabetic neuropathy to further refine its clinical and diagnostic utility. Table 2 illustrates a reference guide for interpretation of DWI and ADC signal intensities in the spectrum of diabetic foot and ankle diseases.
Figure 8: Type II DM with muscle denervation. Axial T1 (A), STIR (B), DWI (C), ADC (D), color map (E). Diffuse muscle fatty replacement demonstrating relative enhancement on DWI (C, arrow), ADC (D, arrow) and color map (E, arrow).
Table 2: Interpretation of diffusion and ADC signal intensities.
Limitations of DWI
It is easier to perform DWI on a 1.5T strength MRI magnet compared to a 3T MRI. Although a 3T MRI has higher SNR, there are usually more susceptibility artifacts due to the increased B0 [11]. SS-EPI sequence is used for DWI, which is also particularly sensitive to susceptibility artifacts induced at tissue boundaries like those occurring at the fat, water, and bone interfaces in the musculoskeletal system [11]. Use of parallel imaging, autoshimming, correction algorithms, and modified radiofrequency pulses (monopolar or bipolar) can mitigate these effects. Use of multishot EPI technique reduces susceptibility artifact, but at the expense of longer acquisition time [59]. Another artifact common to DWI is Eddy currents, seen as contraction or dilation of the image, and overall shift and shear of the image [60]. This occurs due to the rapidly switching on and off, of the radiofrequency gradients. The resulting image distortion can lead to incorrect quantification of ADC values. Newer techniques using rectangular field of view, motion correction and multi-segmented read-out, etc. have improved the image quality with distortion-free acquisition possible in sagittal and coronal planes.
Pitfalls
A common interpretation pitfall of DWI is misidentifying T2 shine through as true restricted diffusion. This can be easily mitigated by simultaneous assessment of the high b value DWI and ADC images. Many malignancies, soft tissue or intraosseous, show restricted diffusion due to increased cellularity and can be misdiagnosed as infection/abscess or vice versa. A thorough understanding of the indication and clinical presentation sometimes may be the only clue to make an accurate diagnosis, as infections can have a very aggressive appearance on imaging. Another common pitfall is the presence of a hematoma. Hematoma in varying stages of evolution may show restricted diffusion and can be confused with underlying infection or tumor (Figure 9). A study by Oka et al, however, did show that the mean ADC value of chronic expanding hematoma (1.55 x10⁻³ mm2/s) was significantly higher than that of malignant soft tissue tumors (0.92 x10⁻³ mm2/s) with no overlap in the minimum ADC values [61]. A knowledge of clinical presentation with recent history of trauma or procedure may help to make an accurate assessment.
Figure 9: 77-year-old with swelling, subcutaneous hematoma as DWI pitfall. Axial T1 (A), STIR (B), DWI (C), ADC (D), color map (E). T1 intermediate to hyperintense fluid collection (long arrow) that demonstrates restricted diffusion.
The guidelines for choosing the ROI are also not well established, but the darker region on ADC map with corresponding brighter area on DWI map is used by most since theoretically these areas correspond to the regions of most cellularity/infection/abscess [9].
Conclusion
Diabetes-related foot complications are common problems associated with high morbidity and mortality. There is a considerable overlap in the clinical and imaging findings of soft tissue and bone infections in patients with diabetes and neuroarthropathy. Treatment also varies greatly for different complications and relies heavily on an accurate diagnosis. The decision of oral versus systemic antibiotics versus surgical intervention (debridement versus amputation) is based on correctly differentiating DFO from other soft tissue infections [62]. MRI plays a central role in determining the diagnosis and extent of these complications. DWI complements and supplements the conventional MRI evaluation, especially where post contrast imaging is not possible. DWI should always be interpreted in conjunction with conventional MRI and in the light of pertinent clinical information to avoid imaging pitfalls. Knowledge of DWI utility for DFD, can help guide appropriate and timely treatment.
Is Obstructive Sleep Apnea A Risk Factor for Severe Acute Respiratory Syndrome Coronavirus 2 Infection?
Introduction
Severe Acute Respiratory Syndrome Coronavirus 2 (SARSCoV- 2) has emerged as public health crises first in the city of Wuhan, Hubei province in China in December 2019, and has subsequently turned out to be a global problem. Coronavirus Disease 2019 (COVID-19) may present in a wide spectrum of clinical forms ranging from mild symptoms such as fever, cough, or fatigue to severe pneumonia, septic shock, organ failure, or death. Understanding risk factors for disease susceptibility and severity is essential to prioritize target populations and patients that are at most risk. Which factors predict the susceptibility to COVID-19 and the severity of the infection have been studied earlier. Diabetes mellitus (DM), hypertension, respiratory and cardiovascular disorders are among the factors with high consistency of association to lifethreatening outcomes [1]. COVID-19 and obstructive sleep apnea (OSA) share many demographic characteristics and comorbidities such as advanced age, male gender, obesity, hypertension, cardiac complications, and DM. Both OSA and COVID 19 are associated with pro-inflammatory mediators. Coronavirus-2 enters the cell with the help of the Angiotensin-Converting Enzyme-2 (ACE-2) receptor. The number of ACE-2 receptors in adipose tissue increases in obesity [2]. Hypoxemia in OSA may affect the coagulation cascade and enhance the tendency to coagulation caused by COVID 19 [3]. Taken together, sharing the mentioned putative risk factors in common, is OSA risk and poor prognostic factor for COVID-19 infection? There are several studies focused on the frequency of OSA in COVID-19 patients and the effect of OSA on the prognosis of COVID-19 [4,5]. However, there are not enough data in the literature regarding the prevalence of COVID-19 in the population with OSA. In our study, we aimed to evaluate the prevalence of severe acute respiratory syndrome coronavirus-2 (SARS-CoV-2) infection in patients diagnosed with OSA and the effect of OSA on the severity of the infection in these patients.
Material and Methods
We conducted a retrospective observational study in the OSA population diagnosed by polysomnography (PSG) in our clinic. The records of consecutive patients who underwent PSG between March 2015 and March 2020 in our clinic were reviewed. OSA was diagnosed using overnight PSG. The standard overnight PSG included electroencephalography, electrooculography, submental and bilateral leg electromyography, and electrocardiography recordings. We measured airflow with a nasal pressure transducer and an oronasal thermistor, respiratory effort via respiratory inductance plethysmography, and arterial oxyhemoglobin saturation via a finger pulse oximeter. Experienced technicians collected and digitalized all signals using computerized PSG systems (Comet Grass: Astro-Med, Inc., West Warwick, Rhode Island, United States, and Viasys Cephalo-Pro, SomnoStar: VIASYS Healthcare, Hochberg, Germany) following established standards [6]. Certified sleep specialists, experienced in sleep medicine, scored sleep stages using the American Academy of Sleep Medicine (AASM) scoring system [7,8]. Grading of the apnea-hypopnea index (AHI) followed AASM’s 1999 criteria as follows: an AHI less than 5 was normal, an AHI higher than 5 but less than 15 was mild, an AHI higher than 15 but less than 30 was moderate and an AHI higher than 30 was severe [9]. The electronic medical records of the Public Health Management System were queried for the results of the SARS-CoV-2 polymerasechain- reaction (PCR) tests for all these subjects with PSG confirmed sleep disorders. Whether the subjects have been tested for SARSCoV- 2 with PCR and the test results were recorded. For patients with positive tests, the demographic data, results, and diagnoses of the sleep study were recorded. Comorbidities were ascertained by ICD-10-CM coding and medical record data. A case of Covid-19 was defined by a positive result on a PCR assay of a specimen collected on a nasopharyngeal swab. The clinical findings, laboratory and radiological data, outpatient/inpatient treatment status, and the course of the COVID-19 of the patients with positive PCR tests were recorded.
The Study Protocol was Approved by the Local Ethics Committee
All statistical analyses were performed using SPSS software (version 17.0). For baseline characteristics, mean (standard deviation) for continuous variables and number and percentages for categorical variables were calculated. Given that this is a descriptive study, no analysis for statistical significance was performed.
Results
Our analysis included 1317 OSA patients diagnosed by PSG. A review of the medical records demonstrated that 51 patients have been tested for SARS-CoV-2 with PCR. The reasons for testing were suspicion of infection, contact tracing, scanning before hospital admission or interventional procedures, or screening for travel. We identified 14 patients with positive PCR results for SARSCoV- 2 (Figure 1). The mean age of the 14 patients was 48.9 ± 12.1 years. The majority of the patients were male (n=13, 93%). The mean BMI was 29.7 ± 2.4 kg/m2. The polysomnographic data is demonstrated in Table 1. Eight (57%) cases had mild OSA, three (21%) had moderate OSA, and three (21%) had severe OSA. Three cases were asymptomatic. Main complaints were chest pain (n=6, 43%), fever (n=5, 36%), fatigue (n=3, 21%), cough (n=3, 21%), shortness of breath (n=3, 21%), loss of taste and smell (n=2, 14%), and diarrhea (n=1, 7 %). Two patients (14%) had DM and two (14%) had hypertension. Two patients (14%) did not need radiological evaluation. Others underwent computed tomography (CT) scanning; normal CT findings was observed in six cases (43%); involvement was unilateral in three cases (21%) and bilateral in three (21%) cases. The mean percentage of oxygen saturation was 97.4±3.0(90-99) on initial evaluation. The laboratory data of COVID-19 patients is demonstrated in Table 2. All the patients underwent outpatient treatment and no hospital or intensive care unit (ICU) admission, progression to respiratory failure or mortality was observed.
Figure 1.
Table 1: The polysomnographic data of OSA patients with COVID-19.
saturation
AHI: apnea–hypopnea index (events per hour); AI: apnea index (events per hour); ODI: oxygen desaturation index (events per hour); spO2: Arterial oxygen three(21%) had moderate OSA, and three(21%) had severe OSA.
Table 2: Genetic mutation in GIST.
spO2, Arterial oxygen saturation
Discussion
We have observed that the prevalence of COVID-19, the need for hospitalization, and progression to respiratory failure, namely severe infection did not seem to increase in OSA patients. In our large OSA population, no hospital admission or death occurred due to COVID-19. Recognition of conditions substantially associated with significant morbidity and mortality is essential to offer prudent preventive measures to vulnerable populations. Theoretically, OSA patients should have increased susceptibility and severity for SARS-CoV-2 infection as they share essentially identical risk factors. Due to overlapping predisposing factors, OSA patients are thought to show a heightened risk of poor outcomes in the case of COVID-19. Our findings are contradictory to this fact. Several studies including a small population of severe COVID-19 patients have shown that 21-28% of patients had OSA (10,11) A recent study on the relationship between OSA and risk of COVID-19 infection has revealed that the risk for COVID-19 infection was about 8-fold greater in OSA patients. The authors stated that the risk of hospitalization and respiratory failure increased, as well [12]. Obesity predisposes to OSA [13]. Links between obesity and COVID-19 have been investigated. In a recent analysis, obesity has been reported as an independent risk factor for invasive mechanical ventilation in COVID-19 patients [14]. Up through January 22, 2021, a total of 28.195.901 tests have been applied and 2.418.472 people had tested positive for the new SARS-CoV-2 coronavirus in Turkey. The total number of deaths is 24789 [15]. These data reveal that about 3% of the Turkish population has been infected with SARS-CoV-2. Concerning these data, the prevalence of COVID-19 in our selected population does not seem to be higher than the general population. One possible explanation is the fact that this specific cohort, as well as their families are aware of the increased risk of morbidity and mortality from Covid-19, due to their comorbid medical conditions, such as obesity, hypertension, diabetes, and thus, they were extra cautious about exposures. One major problem with treatment in OSA is nonadherence to CPAP treatment. CPAP adherence has been shown to improve significantly during the COVID-19 lockdown [16]. Staying at home, travel restrictions, and the fear of having a poor prognosis, and the probability of being hospitalized might have been motivating factors in better CPAP adherence [16]. This may be considered as a protective factor for OSA patients. The current study has several limitations. Coding and recording of data may be imprecise and missing. Still, the administrative data we based our investigation on is very reliable. Our data reflect OSA as it is diagnosed by PSG. However, OSA is widely underdiagnosed, therefore the true prevalence is probably higher. It may be argued that some OSA patients might have PCR negative COVID-19 infection, on the other hand, the same argument may be true for all the population. In the population we reviewed, all OSA patients who had negative PCR results have been on basis of screening. They had no infection symptoms or signs. In contrary to previous reports suggesting an increased risk of COVID-19 in OSA patients, our study represents novel data on the incidence of COVID-19 in population with confirmed OSA. To our knowledge, this is the first study to claim that susceptibility, severity, and mortality are not increased in COVID-19 patients with sleep disorders.
Conclusion
Our results provide some initial data regarding COVID-19 risk in a large OSA population. We demonstrated that OSA cannot be considered as one of the underlying medical conditions predisposing to increased risk or poor outcome in COVID-19. Poor COVID-19 related prognosis, if exists, may be attributed to other risk factors or comorbidities accompanying OSA. We have observed that the prevalence of COVID-19, the need for hospitalization, and progression to respiratory failure, namely severe infection did not seem to increase in OSA patients. In our large OSA population, no hospital admission or death occurred due to COVID-19. Recognition of conditions substantially associated with significant morbidity and mortality is essential to offer prudent preventive measures to vulnerable populations. Theoretically, OSA patients should have increased susceptibility and severity for SARS-CoV-2 infection as they share essentially identical risk factors. Due to overlapping predisposing factors, OSA patients are thought to show a heightened risk of poor outcomes in the case of COVID-19. Our findings are contradictory to this fact. Several studies including a small population of severe COVID-19 patients have shown that 21- 28% of patients had OSA [10,11] A recent study on the relationship between OSA and risk of COVID-19 infection has revealed that the risk for COVID-19 infection was about 8-fold greater in OSA patients. The authors stated that the risk of hospitalization and respiratory failure increased, as well [12]. Obesity predisposes to OSA [13]. Links between obesity and COVID-19 have been investigated. In a recent analysis, obesity has been reported as an independent risk factor for invasive mechanical ventilation in COVID-19 patients [14]. Up through January 22, 2021, a total of 28.195.901 tests have been applied and 2.418.472 people had tested positive for the new SARS-CoV-2 coronavirus in Turkey. The total number of deaths is 24789 [15]. These data reveal that about 3% of the Turkish population has been infected with SARS-CoV-2. Concerning these data, the prevalence of COVID-19 in our selected population does not seem to be higher than the general population. One major problem with treatment in OSA is nonadherence to CPAP treatment. CPAP adherence has been shown to improve significantly during the COVID-19 lockdown [16]. Staying at home, travel restrictions, and the fear of having a poor prognosis, and the probability of being hospitalized might have been motivating factors in better CPAP adherence [16]. This may be considered as a protective factor for OSA patients. The current study has several limitations. The study does not include a control group to determine the prevalence of hospitalization or severe disease in a cohort without OSA. Still, we have the prevalances from the total population to compare the prevalence of the cohort. Coding and recording of data may be imprecise and missing. Still, the administrative data we based our investigation on is very reliable. Our data reflect OSA as it is diagnosed by PSG. However, OSA is widely underdiagnosed, therefore the true prevalence is probably higher. It may be argued that some OSA patients might have PCR negative COVID-19 infection, on the other hand, the same argument may be true for all the population. In the population we reviewed, all OSA patients who had negative PCR results have been on basis of screening. They had no infection symptoms or signs. In contrary to previous reports suggesting an increased risk of COVID-19 in OSA patients, our study represents novel data on the incidence of COVID-19 in population with confirmed OSA. To our knowledge, this is the first study to claim that susceptibility, severity, and mortality are not increased in COVID-19 patients with sleep disorders. In conclusion, our results provide some initial data regarding COVID-19 risk in a large OSA population. We demonstrated that OSA cannot be considered as one of the underlying medical conditions predisposing to increased risk or poor outcome in COVID-19. Poor COVID-19 related prognosis, if exists, may be attributed to other risk factors or comorbidities accompanying OSA.
Use of Eichhornia Crassipes, Lemna sp and Salvinia Minima Plant Scrubbers in the Decontamination of Wastewater of Livestock Origin, in the Province of Imbabura
Introduction
Livestock activities are the basis of economic development at the rural level and constitute food sources for the urban sector. In Ecuador, the production of cattle and pigs has increased notably, so in the reports of the last National Agricultural Census of the year 2000, it is seen that with respect to the Census of 1976 the increase of these species has been 76, 80%, this has increased the economic movement, but has affected the good quality of the water resource, since contamination by livestock activity is frequent. However, if an adequate treatment of these wastes is carried out, the negative impact that is generated can be minimized and contribute positively to rural development with the obtaining of other benefits [5]. Several investigations have been carried out in the province of Imbabura, with optimal results. The use of phyto-scrubbers is encouraging as part of Environmental Management in caring for the water resource. In this way, knowing the potential for treating wastewater of the plant species Eichhornia crassipes and Lemna sp, they were used at La Pradera Farm to include them in a productive decontamination system, continuing with research to treat wastewater. Salvinia minima was also included due to its accelerated growth and because it is found abundantly in coexistence with Eichhornia crassipes; for this reason, it is considered important to be evaluated as a phyto-scrubber.
Methodology
In the research, which was carried out at La Pradera Farm, located in the province of Imbabura, Antonio Ante canton, San José de Chaltura parish, a biodigester, 12 mini ponds, 7.5 kg of Eichhornia crassipes, 1.5 kg of Lemna sp. and 3 kg Salvinia minima. The Completely Random Design was used, with four treatments and three repetitions. When finding a significant difference between treatments, the functional analysis was performed with the 5% Tukey test. The variables that were evaluated in the laboratory and the methods used were: pH (potentiometric), Conductivity (conductimetric), Hardness (volumetric), Total Solids (gravimetric), anions and cations (atomic absorption), BOD (APHA 5210B), COD (5520 D), total coliforms (EPA 40 CFR). Percentage of dry matter, protein and fat. The average flow was 3 L / s. The biodigester was built, located at the outlet of the effluent with wastewater, at the outlet of the biodigester a system of pipes led the water to the ponds 0.50 m wide x 1.00 m long and 0.30 m deep. depth, which contained the three investigated species.
Results Evaluation and Discussion
Table 1 Overall result of the evaluated variables and their reference parameters
Variables pH and Electrical Conductivity (ds / m)
Graph 1 Eichhornia crassipes, Lemna sp and Salvinia minima decrease the pH levels in the wastewater, Eichhornia crassipes lowers the pH levels by 24.05% with respect to the control, this makes the water reach the optimal levels to be used in irrigation with Regarding this parameter, Lemna sp and Salvinia minima also decrease the pH values by 16.53% and 1.15% respectively. These results are consistent with the research carried out by Valderrama (1996) [6], in which he states that E. crassipes stabilizes the pH and contributes to producing values closer to the neutrality of the water. Eichhornia crassipes with 65.11%, followed by Salvinia minima with 20.9%, and finally Lemna sp with 27.9% decrease the concentrations of electrical conductivity. Eichhornia crassipes absorbs a large number of metals present in the water, tending to decrease the conductivity parameters, with this, what is stated by Valderrama (2005) is corroborated.
Graph 1: Average values of pH and electrical conductivity of the evaluated treatments.
Variables Cations (Ca, Mg, Na, K)
Graph 2 Eichhornia crassipes reduces Ca concentrations by 33.3%, this phyto-scrubber is very easy to absorb this type of minerals due to its root and foliar structure, Lemna sp slightly decreases the calcium content of the water by 1.33%, but surprisingly Salvinia Minima contributes a greater amount of calcium to the water since it increased its concentration by 21.33%, probably due to the fact that this ion accumulates in its roots, the type of tangled roots that this species has and they save this mineral from the area collection at Lake San Pablo.
Eichhornia crassipes, decreases the concentration of Mg with respect to the wastewater of origin is 65.5%, Lemna sp and Salvinia minima also lower the levels of concentration of Mg by 22.8% and 18.71% respectively, this is evidenced in the absorption produced by these phytodepurative species. Eichhornia crassipes decreased the Na content in the water by 80.88%, Salvinia minima decreased by 61.1% and finally Lemna sp decreased by 53.1%, this confirms the research carried out by García et, in which it indicates that the aquatic species like E crassipes, they have a high affinity for adsorption and complexation with organic matter, cations and anions, assimilating them through the root. Eichhornia crassipes tends to decrease the amount of K significantly, the reduction percentage of it was 73.9%, Lemna sp and Salvinia minima also decreased this parameter, the percentage decreases were 65.2% and 45.4% respectively, with this it is verified what Valderrama (2005) [6] states in terms of the absorption of nutrients by aquatic macrophyte species is highly efficient in wastewater, being able to exceed 50% of their removal.
Graph 2: Average cation values of the evaluated treatments.
Variables Anions (HCO3, SO4, NO3, B, P, Cl)
Graph 3 Eichhronia crassipes achieved the highest percentage of HCO3 removal with 57.2%, followed by Lemna sp with a decrease of 21.4% and Salvinia minima had a reduction of this ion of 11.9%, this is consistent with Orozco, Saimonds (2006), who point out that floating macrophytes are capable of eliminating various substances and ions dissolved in water by adsorption and absorption. Eichhornia crassipes notably decreases the levels of SO4 in the wastewater, decreasing 98.7% of it, Salvinia minima decreasing by 38.5% and Lemna sp by 25%, the three phytodepurating species lower the levels of SO4 in a significant way. S. minima decreased the highest amount of NO3 with 59.7%, E. crassipes and Lemna sp did not decrease 50% of this anion. García (2012) [7] in his research states that nitrates are not eliminated by ion exchange due to their negative charge, rather they are transported as part of the residual water, being easily assimilated to new plant tissues and eliminated through the denitrification process by microorganisms present in the middle, which happened in the investigation although not significantly. Eichhornia crassipes significantly decreases the amount of B in the water, thus its decrease is 84.6%, Lemna sp and Salvinia minima also show a great decrease in 69.2% and 46.15% respectively, which shows that the phytodepurating species they highly absorb this nutrient. Eichhornia crassipes, Salvinia minima and Lemna sp decreased 100% of the phosphorus present in the water. Rodríguez (2001) [8] in his study of Hydrology and Groundwater uses Eichhornia crassipes to reduce phosphorus levels, resulting in a 40-60% decrease, in this research these values were exceeded with the use of the three phyto-scrubbers. Eichhornia crassipes, Lemna sp and Salvinia minima decreased chlorine concentrations, the removal percentage was 4.2% for E. Crassipes and 3.6% for Lemna and S. minima respectively.
Graph 3: Average values of anions of the evaluated treatments.
Variables RAS, Hardness, Total Dissolved Solids
Graph 4 The Sodium Adsorption Ratio is decisive in the quality of the water, so that the waters that contain less than 1 are excellent for agriculture, from 1 to 2 are good waters, from 2 to 4 are considered regular waters, from 4 At 8 bad waters and more than 15 inappropriate waters, the values obtained through the phyto-scrubbers show the decrease of the RAS and as they fit into good evaluations, Eichhornia crassipes reached 0.91 RAS, making the water excellent, since it decreased 70.6% of This value, Lemna sp Salvinia minima and Lemna sp also lowered the RAS levels by 61.3% and 48.3% respectively. Eichhornia crassipes the best aquatic species to reduce the hardness of the water, with 54.2%, Lemna sp followed with a decrease of 15.3% and in the end the smallest decrease was had by Salvinia minima with 4.7%, E. crassipes is the only species plant that converts the average water hardness of the source water to soft, which makes this water more useful to be used in irrigation. Eichhornia crassipes decreased 80.2% of the amount of STD dissolved in wastewater, Salvinia minima had a reduction of 63.6% and Lemna sp decreased 54.2%, E. crassipes was the most effective species to decrease the amount of STD in water irrigation, this coincides with the research carried out by Valderrama (1996), in which he uses E. crassipes for the treatment of wastewater of agro-industrial origin and determines that this species is capable of eliminating more than 50% of STD of the water. Likewise, the percentages of decrease of E. crassipes coincide with those obtained by Camacho and Ordóñez (2008), who through their investigation of evaluation of recovery of wastewater systems with Eichhornia crassipes, determine that this species was able to decrease 83.69%.
Graph 4: Average values of Total Hardness of the evaluated treatments.
Variables BOD5, COD and Total Coliforms
Graph 5 Eichhornia crassipes decreased by 75% of BOD5, Lemna sp decreased by 52.5% and Salvinima minima decreased this value by 30%, the values obtained in this investigation agree with other investigations carried out, especially Eichhornia crassipes that has been more studied. that Obando (2006) [8] through his research, achieves reductions of 89.3% of BOD5 with Eichhornia crassipes, 76.6% through Salvinia minima and 70.7% with Lemna sp; Rodríguez (2006) [9] with Eichhornia crassipes decreases the concentration of BOD5 in a range of 80-90%. Camacho and Ordóñez (2008), in their research, found that E. crassipes was highly effective in reducing BOD5 values, decreasing 56.84%. With the chemical oxygen demand (COD) Eichhornia crassipes achieves the highest removal of the three species with 78%, followed by Lemna sp with 71.5% and Salvinia minima decreases in 65.3%. Eichhornia crassipes, Lemna sp and Salvinia minima, which decreased Total Coliform Colony Forming Units from 4000 to less than 10.
Graph 5: Average values of residual chlorine, nitrates and phosphates of the evaluated treatments.
Variable Percentage of Dry Matter, Protein and Fat
Graph 6 Eichhornia crassipes presented an accumulation of 9.42% of dry matter, 12.13% of protein and 1.14% of fat, being the species with the best bromatological characteristics in these principles, since Lemna sp weighed 9.36% of dry matter, 3.67% protein and 0.89% fat, finally Salvinia minima had 8.39% dry matter, 0.41% protein and 1% fat.
Graph 6: Values in percentage of dry matter, protein and fat of the phyto-scrubbers.
Conclusions and Future Work
With the use of the phytodepurators Eichhornia crassipes, Lemna sp and Salvinia minima, it was possible to reduce the concentrations of the evaluated parameters Ca, Mg, Na, K, HCO3, Cl, SO4, B, RAS, hardness, STD, BOD5, COD and Total coliforms, being able to reuse the residual water in irrigation. The best phytodepuration species is Eichhornia crassipes since it reduces the values of the essential parameters to determine the quality of irrigation water: pH, electrical conductivity, Ca, Mg, Na, K, HCO3, Cl, SO4, B, RAS, hardness, STD, BOD5, COD and total coliforms evaluated with greater efficiency, compared to the other phytodepurating species Lemna sp and Salvinia minima, it also has a better adaptation in the field and can be used as an additional feed source for the livestock of the farm (previous research), due to its nutritional properties and their acceptability, for this reason the Wastewater Productive Decontamination System of La Pradera Farm was implemented with this species [10-12]. This research is the preamble to many other investigations, since the efficiency of Eichhornia crassipes as a phyto-scrubber has been determined, but there are still many other parameters to be evaluated, and thus prove that phyto-scrubbers are excellent allies in the care and maintenance of the environment [13-60].
The heart (from the Latin cor) is the main muscular organ of the circulatory system. In humans, it is a hollow muscle located in the thoracic cavity with a slight inclination to the left whose function is to pump blood throughout the body through the blood vessels. The heart muscle is myogenic, that is, it excites itself. Rhythmic contractions occur spontaneously, as well as their frequency, which can be affected by the response of our body to different situations that may arise in the course of life, including: 1. Surprise: a fleeting and unexpected emotion. 2. Perception of a danger. 3. A dislike at work. 4. Jealousy. 5. An illness. 6. The infidelity of the partner or spouse. 7. The culmination of a loving or fraternal relationship. 8. The loss of a loved one. 9. An energetic discussion with someone. 10. Social exclusion. Among the most recurrent emotional symptoms of people who have suffered from such ailments, we could mention: 1. Suffering 2. Principles of despair and insanity. 3. Loss of meaning towards life and daily tasks. 4. Moods such as: sadness, melancholy, depression. 5. Negative emotional arousal (irritation, anger, impatience, anxiety) 6. Very strong stress All this can affect the normal functioning of our body causing physical symptoms such as: tachycardia, chest pain, fatigue, asthma, diarrhea, eczema and other skin conditions, lack of sleep, physical exhaustion, lack of appetite, or due to on the contrary, a voracious appetite, muscle spasms, among others, but they also directly, and sometimes seriously, affect the heart. There are studies that address the effects on the heart after receiving bad news and suffering severe emotional stress, one of them is temporary heart failure commonly called broken heart syndrome or Tako-tsubo cardiomyopathy, (this is the name of a vessel, domed and narrow neck traditionally used by Japanese fishermen to catch octopus) which was first described in the 1990s in Japan. It is a stressinduced cardiomyopathy in which there is a sudden temporary weakening of the myocardium. Chest pain is one of the common signs of this disease. From research carried out, it has been possible to determine that many of the cardiovascular problems that occur are mainly caused by depression [1-3].
What Happens in our Body When We are Depressed?
The body of a depressed person sets in motion a series of substances from structures and glands that regulate their functioning. Among them are the hypothalamus in the brain, which issues orders for the pituitary to order the thyroid to produce thyroid hormones, these streamline all functions and, in turn, act on the adrenal glands, where adrenaline is produced, High doses of this hormone have a strong impact on blood pressure, heart rate and the size of the arteries of the heart. Also, the levels of serotonin (a neurotransmitter that helps calm and produces a feeling of wellbeing) fall; If this situation is recurrent, inflammatory responses can occur, a tendency to arrhythmias and a decrease in cardiac flow; which can cause heart attacks and sudden death. Therefore, scientists support the theory that people who cannot adapt and overcome emotional pain, are those who must go through a higher level of physical pain. Many people manage to adapt to these situations, but many others do not reach those levels of resilience (the ability to be reborn after adversity).All this without taking into account also that depressed people tend to adopt unhealthy lifestyles, evidenced in bad eating habits, the tendency to smoke, sedentary lifestyle and even alcoholism, therefore, there is a dangerous increase in risk factors coronary. We are not exempt from encountering situations that push us to our limits, what is truly important is that the rational part enables us better or worse to face these changes. Under new conditions or any change that requires a biological adaptation process, man can respond in an exaggerated way for fear of punishment, not finding a reasonable way out, he ends up acting effusively. Negative emotions adversely affect our health, they can contribute to the development of diseases and interfere with recovery, the way you react to them is extremely important. Avoid disorders and learn from what has been lived. Episodes of sadness should help us learn, take new directions and emerge stronger [4-6]. A sad brain produces less serotonin; If we cannot get out of this state by making new decisions and assuming what happened, in the long term this deficit in serotonin can cause us to suffer diseases such as depression, compulsive obsessions and / or violent outbursts. But we have to be strong and find in those moments of meditation, reflection and look for new resources with which to get ahead. If sadness is of any use to us, it is to learn from what we have experienced, we all know that existence is not a flat easy road to travel, there are stones to overcome and new paths to find, realities from which we must learn. This is how we will be stronger and more capable.
Conclusion
In life no one is exempt from the difficult situations that can arise. We must be prepared to face them, no matter how difficult it may seem. Do not seek solutions that further harm our health such as frequent ingestion of alcoholic beverages, addiction to cigarettes, resorting to diets that alter blood pressure, assuming a sedentary life, staying in unhealthy environments, among others. Learning to overcome and remedy our emotional and physical pain with favorable solutions for our body will allow us to contribute to “heal the hearts” of others.