Biomedical Journal of Scientific & Technical Research (BJSTR) is a multidisciplinary, scholarly Open Access publisher focused on Genetic, Biomedical and Remedial missions in relation with Technical Knowledge as well.
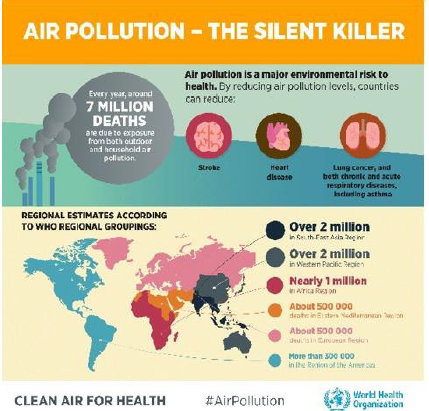
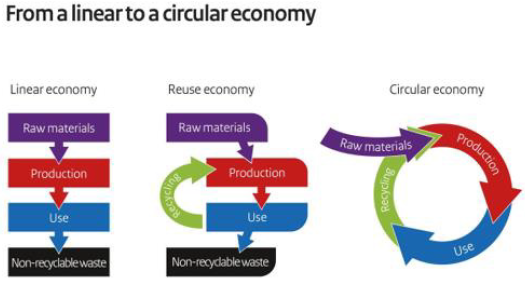
Given the increasing global level of waste and pollution and its detrimental effects on air, water and the human health, The safeness environment became a mast for worldwide consumers together with wellbeing and longevity [1,2]. It is to underline in fact that according to the World Health Organization (WHO),every year occurs 4.2 million deaths as a result to outdoor pollution (Figure1) [3], also if it isn’t to be forgotten the indoor nanoparticulates represented from 10.000 to 240.000 nanoparticles/ml air [4]. Thus, it has been estimated that in 2015,diseases caused by air pollution had a cost of USD 3.8 trillion in 176 Countries .Moreover, the COVID-19 pandemic ,ravaging the World and attacking societies at their core by an high impact on health and the economy never ever imagined until today, has further increased the need to adopt a Green Circular Economy [5,6]. Therefore, It has became a painful evidence the necessity to shift healthcare system away from profiting, giving a much bigger role to wellness and wellbeing, thus changing the actual way of living [7]. However, our future survival will depend on a new alignment between healthcare/wealth and the preservation of both Environment and Biodiversity [3,8]. The materials and energy actually used to make consumer and commercial goods ,in fact, produce a large share of greenhouse gas (GHG) emissions impacting the environment by global warming and climate changing [9,10]. Therefore, the urgent necessity to produce and consume biodegradable goods that, decomposed or deconstructed into different materials, can easily be recycled and used without impacting the environment [10]. In conclusion the Linear Economy, based on the taking, making and producing waste, has to be changed by the Circular Economy of Reducing, Reusing and Recycling (Figure 2). At this purpose many research studies have been dedicated to emulate the productive strategies of nature for making bio-based products from renewable feedstocks, without waste and by a low consume of energy [5,6]. Thus, for example, both cosmetic ingredients and packaging materials could be realized by the use of biopolymers, involving the bacteria machinery to make these products at zero waste, safe and inexpensive [11]. Consequently the new products of the circular economy might be realized by the use of renewable sources and sustainable technologies, possibly obtained from agroforestry or food waste, such as chitin and lignin [12,13], preferably used in their nanosize, such as chitin Nanofibrils (CN ) and Nanolignin (LG).
Figure 1: Air pollution and its risk on health (by courtesy of WHO [3]).
Figure 2: Differences between Linear and Circular Economy.
Chitin And Lignin for Innovative Tissues
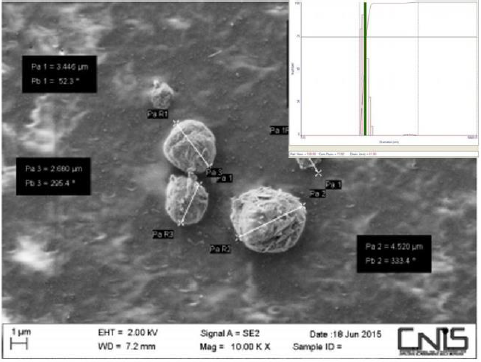
Both the natural polymers chitin and lignin, easily obtainable from food and agro-forestry waste at low cost, may be used as interesting biocompatible carriers to make smart particles and innovative biodegradable non-woven tissues for medical [14- 16] and cosmetic use [17-19], as well as to realize biodegradable films and nanocomposites for food packagings and cosmetic containers [20-22]. But how chitin and lignin can be used? Due to the fact that chitin is an electropositive polymer, while lignin has an electronegative backbone, they have been used to realize block polymeric particles by the gelation method (Figure 3). Successively, embedding the particles into a bio polymeric gel it has been possible to make tissues by the electrospinning technology or films by the casting technology. It is interesting to underline that these particles, more effective when in their nanosize, are able to encapsulate various active ingredients necessary to characterize the activity of the respective tissues and films [5,14-20] Thus, encapsulating nanoparticles made by nanostructured silver bound to fibers of chitin nanofibrils-chitosan ,it has been realized an innovative tissue that has shown an interesting anti-inflammatory and skin repairing activity both in vitro and in vivo [23-25].
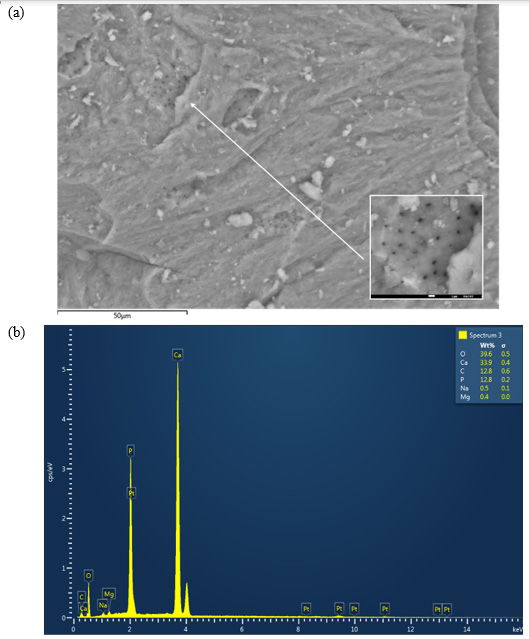
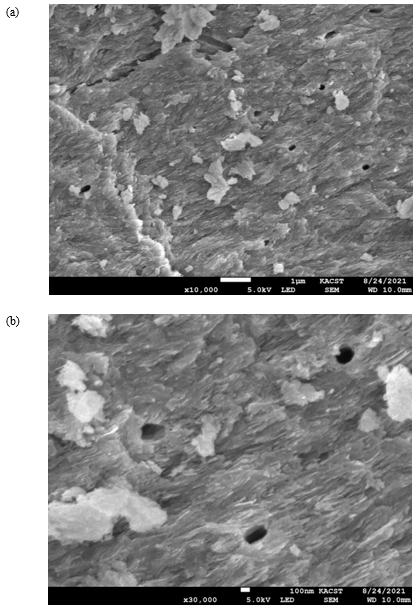
Figure 3: CN-LG particles at the Scanning Electron Microscopy(SEM)
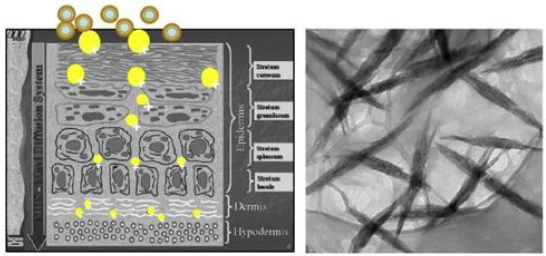
On the other hand, encapsulating other active ingredients such as vitamin A and E and nicotinamide and other compounds into the same tissue, innovative cosmeceuticals have been realized, effective to slow down the formation of fine lines and wrinkles and to repair the damaged hair, always respecting the environment [26-28]. However, it results important to underline that : polymer quality and purity ,method and size adopted to produce particles and complexes, quality and dose of the active ingredients selected and encapsulated, result fundamental to obtain effectiveness and safeness of the designed final product. Just to understand the importance of the polymer size it is to remember, for example, that small chitin (<40 micrograms) has shown an antiinflammatory activity, having on the other hand a pro-inflammatory activity with a size of 40-70 micrograms [29]. Moreover, the tissues and films possibilities to enter in contact with the right cells releasing the active ingredients at level of the different skin layers, depend not only to the polymeric fibers size, the electric charge of their surfaces and the pH of the environment, but first of all to the inter- fibrillar spaces necessary to permit the cell adhesion, proliferation and differentiation (Figure 4) [12,30]. However, the non-woven tissue, results effective to regenerate skin and other tissues when made by natural polymeric fibers reproducing the structure of the natural extra cellular matrix (ECM) [31].
Figure 4: Skin penetrability of Nanoparticles depends from their size, electrical charge and type of polymer but also from the tissue structure that has to be similar to native extra cellular matrix (ECM).
Conclusion
In a world where waste, pollution and carbon dioxide became a serious global threat to human health and the environment provoking many worldwide disasters, it results necessary to produce goods at zero waste by the use of bio-natural polymers and micro-nanoparticles, finally adopting the Circular Economy [13].The reported engineered micro-nano particles and tissues, in fact, could provide numerous advantages as green compounds characterized for their availability, reproducibility, biodegradability, renewability biocompatibility and non-toxicity. However due to their multi-functionality, these innovative biomaterials and carriers could represent active matrices effective to regenerate wounded, burned and aged skin as well as to make biotextiles for producing sportswear, biodegradable medical masks and other hygienic biomaterials or film-packagings to preserve food from bacterial contamination [5-7,12-28]. In any way, It is to underline that chitin, lignin and their complexes may be considered active carriers, being metabolized by the human enzymes to produce glucose, glucosamine, acetyl glucosamine and polyphenol compounds used from the cells as food or energy.
Additionally, it seems possible to stop the ocean’ mcroplastics waste, utilizing these biopolymers to produce the many plastic goods actually made by petrol-derived compounds. So doing it will be possible to avoid many toxic compounds dangerous for the algae, fish, sea mammals and birds as well as for the human health, because of their activity acting as endocrine disruptors for its content of toxic bis phenols [32]. For all these reasons the worldwide consumers, including Z Millennials (aged 18-34), Generation X (aged 35-50 ) and Baby boomers (51-69), request to prohibit the actual deforestation, eliminate air and water pollution and the natural resources depletion for the necessity to produce and consume, for example, recyclable or compostable packagings necessary to stop the climate change, as for our proposal. (Figure 5& 6) [33,34]. In conclusion ,natural climate solutions, that avoid GHG emissions and soil sequestration ,offer a way to limit warming and disasters by the worldwide introduction of the Green Economy.
Possible Use of CRISPR-Cas13 Technology in the Pathogenesis of the SARS-CoV-2 Virus
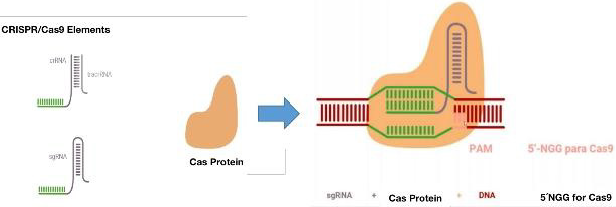
In order to start thinking about this alternative, it is important to know the mechanism of action of viruses in order to identify the attack sites of the technique. It is important to know that the infection begins in the host cell, when the virus binds to a receptor on the cell surface. The SARS-CoV-2 virus is bound by its protein (S) and the receptor for angiotensin converting enzyme 2 (ACE2). This binding directs the north of the virus in the target cell and its specificity [1]. ACE2 contributes to the regulation of blood pressure by converting angiotensin I into angiotensin [2]. The ACE2 receptor is expressed in many tissues such as the lower respiratory tract, heart, kidney, stomach, bladder, esophagus, and intestine [2]. In the lung, it is expressed in the alveoli [3]; and in the oral cavity, in epithelial cells of the tongue [4]. The SARS-CoV-2 protein (S) has two subunits (S1 and S2). The S1 subunit is the one that interacts and binds to the ACE2 receptor through the receptor-binding domain (RBD), while the S2 subunit determines the fusion of the virus membrane with that of the host cell [5]. The virus completes its entry into the cell when the S protein is cut by the protease enzyme (TMPRRS2). This generates the separation of the RBD union of the S1 subunit with the ACE2 receptor and its fusion with the membranes, and in this way the virus is left with the door of entry open to the cell by endocytosis [6]. Once inside the cell, the translation of the viral genome and the transcription of the SARS-CoV-2 proteins begin. When it enters the cytoplasm, the nucleocapsid of the virus is released and the viral genomic RNA is released. This RNA acts as an mRNA so the viral replicase gene can be directly transcribed [1,7]. To generate the necessary proteins of the replicase transcriptase complex (RTC), which is assembled in the endoplasmic reticulum (ER) ([1,5,7-11]. Finally, the complex (RTC) replicates and synthesizes a set of sub genomic mRNA (sgRNA) [8-11] that code for the elaboration of the main structural proteins (S), (M), (E), (N) and accessory proteins [1-5]. So, this is how RNA replication, Protein Assembly and SARSCoV- 2 Egress from the Host Cell are built. In SARS-CoV-2 replication, single-stranded RNA (+ ssRNA) serves as a template to initially synthesize a copy of single-stranded RNA (-ssRNA) [12]. And from this copy of -ssRNA, polyproteins will be produced, which will make up the RTC complex [1,8]. The RTC complex again creates a copy of the original virus genome + ssRNA from the -ssRNA template. This associates with the protein (N) forming the nucleocapsid. The structural proteins (S), (M) and (E); and accessory proteins from the endoplasmic reticulum (ER) and then, in the Golgi complex, are assembled together with the nucleocapsid to produce new viral particles, which are produced towards the plasma membrane for the release of the virus [5]. According to this final mechanism, it is where the grouped and regularly spaced short palindromic repeats (CRISPR) emerge as a therapeutic alternative, together with the endonuclease Cas, form the CRISPR / Cas complex. This system was discovered as an immune defense mechanism present in bacteria and archaea, which incorporate DNA from pathogens, such as bacteriophages, between repeated palindromic sequences and subsequently generate an RNA called “crRNA” when transcribed. Due to its activity as an endonuclease and recognition capacity in specific sequences, the CRISPR / Cas system has been exploited in genetic engineering to activate genes, repress them, induce point mutations and change sequences through homologous recombination. CRISPR has also been used to generate murine models of human diseases and to evaluate cell physiology through the simultaneous activation or repression of various genes [13,14]. This mechanism is made up of two factors, an endonuclease and a complementary recognition sequence. Thus: an RNA from the CRISPR sequence, called “crRNA”, and the Cas endonuclease. The crRNA is in charge of directing Cas towards its complementary sequence, where Cas makes the cut. The CRISPR sequence is composed of a leader or promoter and different spacer sequences of more or less than 40 nucleotides on average and side and side repeated sequences called palindros with an extension of approximately 32 nucleotides Figure 1 [15]. When this mechanism enters into action in the cytoplasm, the cell recognizes a sequence known as a motif adjacent to the PAM protospacer and incorporates the nucleotides adjacent to the PAM. Figure 1. Subsequently, the crRNA is transcribed. The Cas then associates with the mature crRNA and forms the CRISPR / Cas complex. The crRNA will be the one who guides the complex towards its target through the recognition of the complementary sequence. The cuts produced by the explained mechanism are repaired by non-homologous end joining (NHEJ) and homology directed repair (HDR). As NHEJ can cause unwanted effects of unexpected mutations, it is preferred to choose HDR for this method. This CRISPR / Cas complex is a good alternative for targeted genomic editing.
The system has made it possible to insert, eliminate or generate mutations in the sequences, which leads it to target a specific sequence and induce a cut in both DNA strands [13,14]. However, this system would not be very relevant for SarsCov2, since it is an RNA virus, but within the range of possibilities and versatility of the CRISPR system, a subsystem of this complex, known as CRISPR-Cas13, has been identified. CRISPR-Cas13 are widely distributed among Leptotrichia species. Estimating the occurrence, composition, and diversity of CRISPR-Cas13 systems in the genus Leptotrichia is particularly challenging because complete information on the entire genome is limited [16]. Cas13 is a crRNAguided RNA-targeted effector, which has two distinct RNase sites [17]. Not only does it highlight its unique RNA-directed ssRNA lysis activity, but Cas13a becomes a promiscuous RNase that can nonsequentially specifically cleave host cell RNA, leading to host cell or cell death latency [18,19]. Taking this information into account, this work aimed to propose an anti-COVID-19 therapeutic alternative based on the CRISPR-Cas13 system, and generate mutations in the virus, specifically in the sequence of the SARS-Cov2 protein S RBD gene that It has the function of binding to the cellular ACE2 protein and that it is the entry site of the virus for its infectivity.
Methods
First, an exhaustive review of the reported sequences of Sars- Cov2 was made, in the databases: NCBI, Google Scholar, Scopus, GeneBank, NIH. With descriptors COVID-19, CRISPR-Cas13, Gen SARS-CoV-2. The gene sequences and spike protein sequences for SARS-CoV-2 were downloaded to FASTA from GeneBank NCBI Reference Sequence: NC_045512.2. To determine the binding points of the virus to the ACE2 receptor, the sequence reported by Walls A, et al. [20] in Cell was taken as a model. With the MEGA software [21]. The sequences were compared, and mutational analysis was carried out. In addition, mutations were made in silico that allowed the generation of stop codons that would prevent the configuration of the virus RNA and make it unfeasible for its duplication and subsequent infection. Multiple couplings of the RBD site and the ACE2 receptor were made to find binding to it and whether or not it was diminished. This was run in PyMol software [22].
Results and Discussion
SARS-CoV-2 is an RNA virus, so the best technology to attack it inside the cell is when it deposits its genetic material in the cell. The appropriate technique presented is CRISPR-Cas13, which attacks RNA and not DNA [23,24]. Based on this, the following strategy was proposed here using its CRISPR technology: This is the sequence of the Virus genome, downloaded in FASTA from GeneBank: NCBI Reference Sequence: NC_045512.2. the genome corresponding to Surface Glycoprotein S. Below, highlighted in yellow is the genome of the virus and the proteins of the virus [25].
Therapeutic Strategies of Ischemic Stroke Based on Proton-Activated Chloride Channel
Ischemic stroke is a multifactorial disease with high rate of morbidity, mortality and disability rate worldwide [1]. When acute ischemia occurs, it leads to excessive oxidative stress, causing irreversible damage to nervous tissue [2,3]. However, current treatment strategies of ischemic stroke are relatively limited, actually, a large number of neuroprotective agents that have proved ineffective in clinical trials [4]. PAC, also known as ASOR (acid-sensitive outwardly rectifying anion channel) [5] or PAORAC (proton-activated outwardly rectifying anion channel) [6], which was first observed in rat Sertoli cells in 2003[7], has shown encouraging results in providing partial neuroprotection against tissue acidosis caused by ischemic stroke.
Pac Channel and its Therapeutic Potential
Under normal physiological condition, the pH of extracellular fluid, including the blood plasma, is normally tightly regulated between 7.32 and 7.42 by the chemical buffers, the respiratory system, and the renal system [8]. However, in cerebral acidosis caused by ischemic stroke, the pH of the ischemic core may be as low as 6.0 [9]. Ischemic tissue acidosis is a sensitive metabolic indicator for the progression of cerebral ischemic injury. PAC was reported to be activated by extracellular acidity as well as its sensitivity to temperature and pH [5]. The threshold pH for PAC activation is relatively low, around pH 5.5 at room temperature and around pH 6.0 at 37℃ [10]. As a highly conserved channel ubiquitously expressed in mammals, the core protein of PAC (TMEM206) has the highest molecular expression in the cerebral cortex of human [11]. By cooperating with other ion transporters and channels such as V-ATPase, acid-sensing ion channel 1a (ASIC1a), and Na+/ H+ exchanger (NHE), PAC is activated by extracellular acidity and mediates Cl- influx into the cell, cytotoxic edema and cell necrosis ensue [12-14]. The simultaneous increase in intracellular Ca2+ promotes cell death cascade associated with intracellular Ca2+ accumulation [15]. Several studies have reported that inhibition of PAC provides partial neuroprotection against tissue acidosis after ischemic stroke: 1. Neurons undergoing massive necrosis 1h after exposure to acidic solution were not only protected by PAC channel blockers but also by cooling down to 25 ℃ [10], 2. Knocking down the core component of PAC (TMEM206) almost abolished proton activated Cl- current in rat neurons and reduced neuronal cell death caused by acid treatment [16], 3. Application of the chloride channel blocker 4,4′-Diisothiocyano- 2,2′-stilbenedisulfonic acid (DIDS) in vivo attenuated cell injury induced by ischemia-reperfusion in hippocampal CA1 neurons [17], 4. Knockout of mouse PAC abolished proton-activated Cl- current in neurons and attenuated brain damage after ischemic stroke [11]. Based on above lines of evidence, PAC is a promising therapeutic target to protect neurons in cerebral ischemia.
Therapeutic Strategies of Ischemic Stroke Targeting PAC Channels
Metabolic acidosis occurring in ischemic stroke is a sensitive metabolic indicator capable of targeting drugs to the salvageable ischemic penumbra with high specificity. Targeting ischemic brain tissue using pH sensitive marker polymers or nanoparticles has enabled medical imaging to accurately distinguish ischemic tissues from normal ones [18,19]. The development of bio-responsive materials that undergo conformational or solubility changes under acidic environments offers great promise for the development of smart targeted drug delivery nano-systems [20], such as the hydrophobically modified chitosan nanoparticles (Chit NPs) with C6-side chains were released the Ca2+ channel blocker nimodipine (NIMO) drug at the pH of ischemic tissue (=6.0), while at normal pH (=7.4) the drug molecules was remained closed in polymer shell [21]. pH directing effect and bio-responsive nanomaterials have been applied in solid tumor therapy and inspired the application of nanotechnology in the treatment of ischemic stroke [22,23]. Selective delivery of PAC specific blockers to the ischemic penumbra via a pH responsive smart nanosystem holds promise for the treatment of injury sites without adverse nontargeted side effects. However, currently there are only several universal drugs available to target chloride channels, such as DIDS, niflumic acid (NFA), and 5-nitro-2-(3-phenylpropylamino) benzoic acid (NPPB), specific PAC blocker has not yet been reported [11,12]. Therapeutic hypothermia has been regarded as one of the most effective neuroprotective strategies since 1987 [24,25]. Over the past few decades, the neuroprotective effects of hypothermia in cardiac arrest [26] and resuscitation from neonatal hypoxicischemic encephalopathy [27] have been confirmed by multiple clinical trials. Numerous preclinical studies based on vascular recanalization models have shown that hypothermia exerts neuroprotective effects mainly by reducing the cerebral metabolic rate [28], but also involves cell death, inflammation and white matter integrity [29], and the temperature sensitivity of PAC also provides potential mechanisms [16]. Intra-arterial selective cooling infusion (IA-SCI), as a novel therapeutic method of hypothermia, utilizes the characteristics of high blood flow to the brain to directly perfuse hypothermic fluid into the cerebral arteries for rapid and selective cooling [30]. IA-SCI can precisely achieve regional cooling of brain tissue with a much faster cooling compared with traditional superficial cooling and systemic transvenous cooling and can be combined with mechanical thrombectomy to avoid the side effects brought by systemic cooling [31,32], which has been clinically validated in rodent models [33], large animal models [34] and ischemic stroke patients [35]. Precise cooling of the acidotic brain tissue in ischemic stroke by IA-SCI can elevate opening threshold of PAC, thereby shutting the channel, thereby reducing the influx of Cl-, improving cytotoxic edema, and achieving neuroprotection [10,12].
Conclusion
Targeted delivery of PAC blockers by smart nano-systems is highly specific and efficient and enables the gradual release of drugs to extend the time of drug exposure, reducing the risk of adverse side effects or off target toxicity. Compared with the simultaneous closure / blockade of multiple cationic channels associated with cellular edema (such as ASICs and NHEs, etc.), the blockade of a single and unique anion channel (PAC) by hypothermia has higher applicability and feasibility experimentally or clinically. Although there is currently a lack of sufficient experiments to validate the above two therapeutic strategies, smart drug targeting nanosystems and hypothermia therapy that inhibit PAC also pose an promising opportunity for translational trials to protect brain tissue.
The Current State of Target Therapy for Subtypes of Gastrointestinal Stromal Tumors
Introduction
Gastrointestinal stromal tumors (GISTs) are the most common primary mesenchymal tumor of the gastrointestinal tract, although with low incidence. They are connective tissue tumor arising from the interstitial cells of Cajal (ICC) cells. The most common tumor location is the stomach (50%-70%), followed by the small intestine (25%-35%), rectum (5%-10%), and esophagus (<5%) [1]. The signs and symptoms of GISTs, which grow slowly and generally occur in 50 to 70 years old, are gastrointestinal hemorrhage, trouble in swallowing and metastases [2]. About 30% of GISTs can be defined as evil and led to metastasize occurring drug resistance during the treatment because of gene mutuation [3]. Some study show that the patients of GIST have mutations in PDGFR (PDGFRα or PDGFRA) but not in the wild-type GISTs without c-kit or PDGFRA mutations were accounted for 10-15% of the total number of GISTs (Table 1) [4] According to researchs, wild-type GISTs might lack succinate dehydrogenase (SDH) leading by mutations of SDH genes.The occurrence of GISTs are related with KIT/PDGFRA gene mutations, which c-kit mutations were accounted for 80~90% and PDGFRA mutations for 7% [5]. The radical surgery may be the only chance of cure, but the treatments of traditional radiation and chemotherapy are ineffective for advanced GIST (recurrent, inoperable or distant metastasis). In recent years, the targeted therapy of GISTs has obtained significant efficacy with the development of precision medical. Tyrosine kinase inhibitor (TKI) is the first-line treatment drug of GISTs, such as imatinib mesylate (IM). The locus secondary mutations of KIT/PDGFRA genes were key factors for prognosis. At the same time, the application of targeted drugs to achieve the maximum therapeutic effect has become the focus of research. The latest NIH classification system for GISTs declare that Mid- to Late GISTs are applicative for the adjuvant therapy, which preoperative IM is widely available. This article aims to make a summary of different genotype, mutation and molecular mechanism of GISTs, and the progress of targeted drugs.
Table 1: Genetic mutation in GIST.
Genetic Mutation in GISTs
KIT Mutation
C-kit gene is considered at the homologue of HZ4 feline sarcoma Virus KITs oncogene. C-kit proto-oncogene, which consisting of 21 coding exons in III type of protein tyrosine kinase receptor superfamily members, is located in chromosome 4q11-12. It is a kind of Kit protein receptor, which consist of extra-cellular region, trans-membrane region, near-membrane region and 2 tyrosine kinase (TK) region. Its ligand is stem cell growth factor (SCF). The most common mutations are exon11 mutations (70%), exon9 mutations (5%~10%), and exon13 mutations (1%) [6]. Exon14, 17, 18 mutations are relatively rare [7]. The main mutation types are deletion mutation, point mutation, mixed mutation and insert mutation [8]. When c-kit mutated, CD117 protein expresses and forms a dimer autonomously without the participation of the ligand. Therefore, it cannot precisely regulate the differentiation, proliferation, and programmed cell death. Finally, c-kit mutations can cause more cells enter the neoplastic hyperplasia stage from the quiescent stage, which may be one of the key mechanisms causing malignant transformation of GIST. Studies have found that tumors with c-kit exon11 deletion are more likely to appear in the patients who are older than 50 years, with a tumor diameter of 5~10cm and the NIH grade as high risk. Moreover, the secondary and high-risk GISTs are susceptible to secondary mutations that cause recurrence and metastasis because of the deletion of exon11 of c-kit gene [9], which has potential value for predicting poor prognosis of patients.
PDGFRA Mutation
PDGFRA gene stretches approximately 65 kb on human chromosome 4 (4, q11-13) and consists of 23 exons in III type of protein tyrosine kinase receptor superfamily members, including exon3-10 coding region exocellular five immunoglobulin sample, exon11 coding intracellular membrane area, near exon13-15 and exon17-21 coding intracellular kinase 2 cheese ammonia acid (tyrosine kinase, TK) area. Similar to c-kit, PDGFRA gene mutation is also a function-acquired mutation and most of them occur in CD117 negative GISTs [10]. In the absence of ligand binding, the autonomous dimerization leads to cell division and proliferation by promoting DNA synthesis through downstream signaling pathways, thus the growth, proliferation, attachment, metastasis, differentiation, and apoptosis of cells are regulated. The mutations of PDGFRA essentially clustered in three regions and the most common of these is exon18 that accounting for 82.5%, the most common site is D842V [11-13]. The process of GISTs formation by PDGFRA mutation is similar to c-Kit, the tyrosine kinase receptor encoded by PDGFRA located on the cell membrane is abnormally and continuously activated, resulting in the loss of autoinhibition function.
Wild-Type GIST
The morphology of wild type GIST is in line with the GIST, CD117 positive or negative expression, at the same time cannot detect c-kit and PDGFRA gene mutations, but often coupled with abnormalities in the structure or expression of other genes, such as, subunits of succinate dehydrogenase (SDH) complex, Rapidly accelerated fubrosarcoma B (BRAF) gene, neurofibromatosistype1 (NF1) gene mutation, multiple gene fusion and other abnormalities. The most common type in the wild type is the SDH expression deficient or decreased, which can be accompanied by other neoplastic diseases, including paraganglioma, pulmonary chondroma, pheochromocytoma, etc. At first, the disease was recognized as Carney triad and Carney Stratakis syndrome [14]. The high expression of insulin-like growth factor 1 receptor (IGF-1R) receptor RNA or protein in the GISTs due to SDH gene defects is detected,IGF-1R binds to ligand and is activated by autophosphorylation, leading to the activation of mitogen-activated protein kinase (MAPK) and phosphatidlinositol 3-kinase (PI3K) cascades [15]. IGF signaling can inhibit IGF-1R-induced apoptosis in SDHdeficient GIST cells and inhibit the signaling of Akt and MAPK pathways in GIST cells [16]. For BRAF gene mutant GIST, most of the mutation sites are V600E of exon 15, which can affect the function of PI3K [17], BRAF mutations have been found in a small number of patients with imatinib (IM) resistance, suggesting that BRAF mutations may be the cause of secondary resistance [18]. KRAS mutations are also one of the wild-type GIST, some scholars analyzed the gene sequence of 578 cases of GIST and found no KRAS mutation, So KRAS mutations may be extremely rare [19].
Other Biological Markers
Many research experiments show that c-kit mutations represent a poor prognosis in high-risk GISTS, PDGFRA mutations associated with less malignant GIST [20]. However, these alone are not absolute and require more biological indicators related to prognosis and efficacy. In addition, the proliferation index Ki-67 is a very effective marker for predicting the aggressive behavior and malignant potential of GIST and can be employed as an independent predictor of GIST [21]. P16 expression is also related to the malignant of GIST [22]. Moreover, there are evidence from 19 studies showing p53 have the predictive value in the risk of GIST [23].
TKI Therapy in GIST
Complete surgical resection is the only chance for cure for the disease, but there is still a possibility of recurrence and metastasis. For advanced (unresectable or recurrent, metastatic) GISTs, molecular targeted therapy is the preferred treatment [24].
First-Line Imatinib Therapy for Advanced GIST
Imatinib is a derivative of 2-phenylaminopyrimidine, which is a kind of small molecule selectively activated tyrosine enzyme inhibition agent to inhibit the BCR-ABL protein, ABL, KIT and PDGFRs. Though selective inhibition of tyrosine kinase lives sex, blocking the phosphate group on tyrosine residues. In 2002, the FDA approved STI571 for the treatment of unresected or metastatic GIST. Demitri et al conducted a trial, 147 patients with advanced GIST were randomly assigned to receive 400mg and 600mg of imatinib per day. The results showed that imatinib has achieved a good objective response in patients with advanced GIST, and there were no significant differences in the safety of treatment dose [25]. Subsequent phase 2 and phase 3 trials of metastatic GIST also confirmed the efficacy of imatinib in advanced GIST (Table 2). Treatments which provided the sites to inhibit tumor cell proliferation were widely applied advanced and metastatic tumor, and the preoperative and postoperative adjuvant therapy. However, an effective dose of imatinib cannot inhibit other open sites in the tyrosine kinase pathway except for c-kit or PDGFRA gene mutations, allowing cell proliferation signals to bypass cell proliferation inhibition caused by imatinib, c -kit exon11 mutant GIST is generally sensitive to imatinib and not sensitive to exon9 and PDGFRA mutation types [26]. Further research found that the relationship between kinase genotype and treatment outcome, Kit exon11 genotype mutation has better benefit than other genotype mutations [27]. Our previous meta-analysis estimated the imatinib treatment for different genotypes of GIST and found that personalized treatment makes patients with exon 11 mutation more profitable [28]. To optimize the treatment of imatinib, a metaanalysis of 1,640 patients with advanced disease showed that the patient could get a small PFS advantage of 2 times the standard dose (800mg/d) of imatinib, but no significant difference in OS between the dosages, especially in kit exon9 mutation. Compared with exon11 mutation, exon9 mutation and wild mutation have a worse prognosis [29]. Moreover, Asian Consensus Guidelines agreed that a higher dose may also be beneficial in Asian patients with KIT exon 9 mutation [30]. To assess longterm survival with two doses of imatinib, one long-term result of a randomized trial showed the 800mg/d group had a better 10- year PFS rate and an average OS rate than the 400mg/d group [31]. Whether patients with advanced GIST benefit significantly in terms of long-term survival and will they differ due to the differences of mutations? An analysis of Phase 3 SWOG Intergroup Trial S0033 showed that imatinib as a first-line drug in advanced GIST has resulted in long-term survival of 10 years for a significant number of patients, especially those with KIT exon11 mutations or KIT/ PDGFRA mutations lacking (mainly succinic dehydrogenase mutant tumors) [32]. Most people can benefit from imatinib, but this result does not lasting. Many patients will initially be resistant even if they were recommended to extend the duration of medication from one year to three years [20]. GIST resistance of imatinib can be divided into primary and secondary, primary resistance is no response to imatinib treatment, while secondary resistance occurs 6 months after the initial treatment is effective. The secondary gene mutation of KIT/ PDGFRA is considered closely related to secondary resistance. The secondary mutation of kit occurred in exons 13, 17, 14 [33] and occurred in exon 18 of PDGFRA [34]. Further research found that heterogeneity of KIT secondary mutations is the principal mechanism of tumour progression to KIT inhibitors in imatinibresistant GIST patients [35]. The sensitivity of PDGFRA mutant GISTs to targeted drugs is obviously worse than that of C-KIT, while the exon 18 D842V mutation of PDGFRA mutant GISTs is also primary resistance to imatinib, so it is difficult to achieve satisfactory efficacy even if the dose of imatinib is increased [36]. Many resistance mechanisms are still being researched due to the diversity of mutation sites, heterogeneous multitarget inhibitors and precise personal treatment are more worthy of promotion.
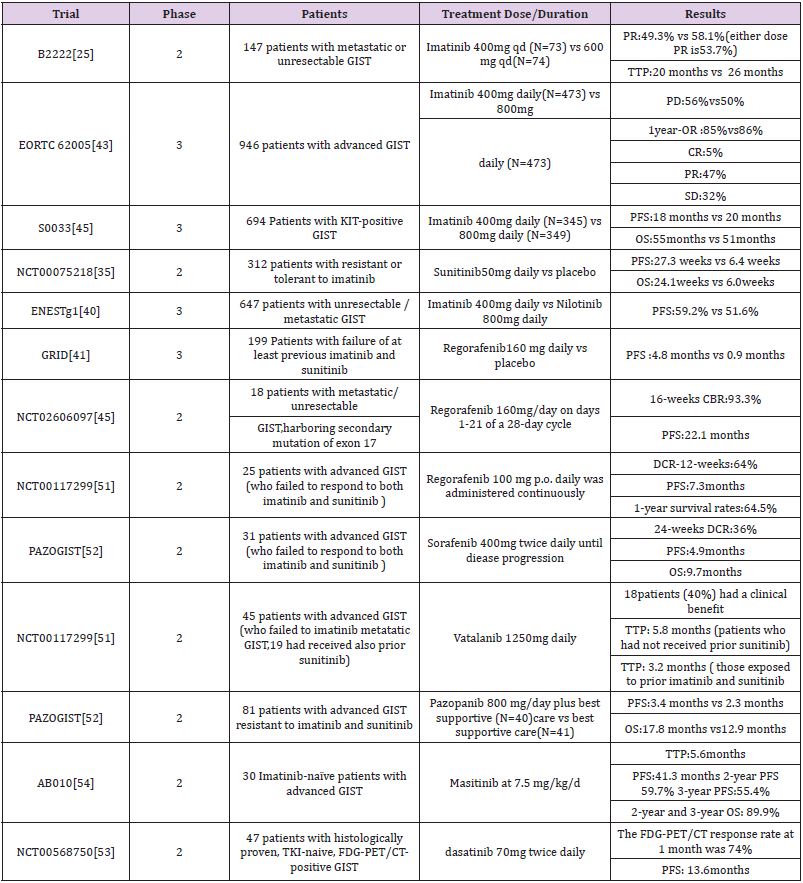
Table 2: Some important trials about TKIs.
Second-line Sunitinib for Advanced GIST
Secondary drug resistance occurred in more than 50% of patients after treatment with imatinib, thus the second-line treatment drugs such as sunitinib, an oral multitarget tyrosinase inhibitor, emerged. The growth, proliferation and metastasis of malignant tumors were affected by blocking the signaling pathway by inhibiting tyrosine kinases such as VEGFR, PDGFR, KIT, and RET. Sunitinib is considered as a second line TKI because of its considerable benefit in patients with advanced imatinib resistance and intolerance. A randomized, blank-control phase 2 clinical trial of random taking sunitinib 50mg / d and placebo in the blank control group. The results of this experiment showed that progressionfree survivals were 27.3 weeks and 6.4 weeks, respectively. Overall survival was 24.1 weeks and 6 weeks, respectively (Table 2) [37]. However, Lile Wu et al. conducted a meta-analysis clinical efficacy of seconed-generation TKI in imatinib-resisitant GISTS showed that sunitinib are effective for improving PFS but not OS in patients with imatinib-resistant GIST [38].
One of our previous pooled analysis showed that sunitinib treatment after imatinib resistance varied according to the genetic subtypes of GIST. Compared with PDGFRA, the mutation of KIT gene showed better clinical rate of cure, especially the mutation of KIT exon 9, 11. Furthermore, the mutation cure rate of KIT exon 9 was better than that of exon 11 [39]. Other second-line TKI drugs such as nilotinib, a tyrosine kinase activity of ABL/BCR, and KIT, PDGFRs, significantly improve PFS [40]. In a phase III study of nilotinib versus imatinib as first-line therapy for unresectable or metastatic GIST, Blay JY et al. divided 324 advanced patients on nilotinib 400 mg twice daily and 320 advanced patients on imatinib 400 mg daily. The results showed that the 2-year progression-free survival rate was better in the imatinib group (59.2%) than in the nilotinib group (51.6%). There was no difference between the two groups for progression-free survival of KIT exon 11 mutation, but imatinib group was better than nilotinib of the exon 9 mutation. Therefore, in the future, first-line drugs need to be determined based on subtype analysis [41].
Third Line Regorafeniband Ripretinib for Advanced GIST
Regorafenib, a multikinase inhibitor was candidated as a third-line treatment option for patients with advanced GIST, which is recommended after failure of both high-dose imatinib and sunitinib. In a randomized phaseIII trial of regorafenib GRID, the results showed that median progression-free survival was 4.8 months for regorafenib and 0.9 months for placebo, with no significant difference in overall survival [42]. Another study of regorafenib showed the efficacy and safety of manageable profile in Japanese were consistent with the overall GRID study population of patients with advanced GIST. As a third line TKI, the effectiveness of regorafenib has been proven in GIRD, however, frequent dose reductions were required of the administration plan. In a study involving 25 patients who failed treatment with imatinib and sunitinib, low-dose continuous treatment with regorafenib showed that the disease control rate for at least 3 months in 64% of patients and had a median progression-free survival of 7.3 months. Maybe this method of administration has become a better choice [43,44]. In addition, regorafenib prolonged progression-free survival of patients with advanced mutations in exon17 [45-48]. Another threeline targeted therapy, ripretinib is a Ⅱ type switchpocket inhibitor that binds to the switchpocket and acts as a structural substitute for an inhibitory switch, preventing the activation loop from entering the switchpocket, thus locking the kinase in an inactive state and inhibiting downstream signaling. Ripretinib has strong inhibitory effects on different secondary drug resistance mutations because it is acting on the final link of the kinase pathway [49-50]. However, clinical data on ripretinib therapy and genotyping have not been reported yet, so there may be differences in the efficacy of ripretinib in GIST with different genetic mutation types.
Other TKIs
Other TKIs identified in clinical trials, such as sorafenib, as a third line / four-line TKI. A Korean clinical trial used two or more TKIs to treat unresectable or distant metastic, 36% of patients had more than six months of disease control after using sorafenib [51]. Moreover, including vatalanib (PTK789), masatinib (AB1010), pazopanib (PAZOGIST), dasatinib (NCT0056875) (Table 2) [52-54].
Conclusion
Despite the many benefits of targeted drugs for advanced GIST, drug resistance presents a new challenge. Through the understanding of the mutation sites of GIST and the collection of information about current treatment regimens, we can see that the efficacy of targeted drugs in different genotypes still needs a large number of standardized clinical open trials. Similarly, to leverage the strength of targeted drugs to make up for the shortcomings, personalized treatment and evaluation are essential. New therapeutic ideas should be applied to more actions, such as the combination of targeted and chemotherapy drugs, new targets to be discovered, updated TKIs and combined immunotherapy. Further studies on drug resistance mechanisms and new molecular markers are the breakthrough points for the treatment of advanced GIST to optimize the treatment of advanced GIST.
High Resolution Melting Curve for the Rapid and Efficient Detection of SARS-Cov-2 Gene Variation in the Greek Population
As of May 6, 2021, approximately 153 million cases of Coronavirus disease 19 (COVID-19) have been reported worldwide [1]. Due to the rapid spread of the causative SARS-CoV-2 corona virus, the development of a quick and accurate detection assay is considered vital aiming to control the possible sources of infection, in order to design effective measures to prevent further transmission. Routine laboratory confirmation of SARS-CoV-2 infection is based on nucleic acid amplification tests (NAAT), such as the real-time reverse transcriptase-PCR (RT-PCR), which is adopted as a simple qualitative assay that combines a relatively high sensitivity [2] with high specificity for the detection of the virus [3,4]. The most commonly used targets for primer/probe development derive from the conserved viral genome, including the ORF1ab, RNA dependent RNA polymerase (RdRp), nucleopcapsid (N), envelope (E) and spike protein (S) genes [5-7]. Although SARS-CoV-2 quasispecies variants can be most accurately identified through whole genome sequencing or alternatively by the means of Sanger or next generation sequencing amplicon-based sequencing of selected parts of the viral genome [1], these methods are regarded both as time consuming and expensive.
Thus, a simple and more rapid screening approach is needed to be developed, for the key SARS-CoV-2 mutations that define variant strains. High Resolution Melting (HRM) is a novel, homogeneous, close-tube, post-PCR method, enabling genomic researchers to analyze genetic variations either as single nucleotide polymorphisms (SNPs), point mutations, or methylation degree in PCR amplicons. This assay prevails the power of a classical melting curve analysis by enabling a detailed study in the thermal denaturation of a double-stranded DNA, providing us finally sufficient information. In this study we tested the possibility that a Real-Time PCR combined with HRM assay will serve as useful and efficient diagnostic technique for the detection of SARS-CoV -2 variables in 4 viral genome locations, namely RdRp, N1, E and S2 genes. The High-Resolution Melting Curve was performed in a post RT-PCR assay, and amplified a fragment of these genes, in order the generic diversity of the SARS-CoV -2 can appropriately be examined. Our hypothesis was that this method can be adopted as a valuable tool for the rapid screening of large numbers of patient samples for the tested variants, providing an early warning for the emergence and spread of these strains of concern.
Materials and Methods
Clinical Samples
A total of 620 clinical specimens collected in the municipal area of West Attica and sampling was accomplished to our premises with all the required precautions. All volunteers were suspicious COVID-19 cases, according to World Health Organization criteria (World Health Organization, 2021c). We only collected nasopharyngeal swabs, which subsequently were placed in 2 ml of transport medium with neutralizing agent. We used Disposable Virus Sampling Tube (Zybio; Inc; China) which adopts efficient virus inactivation technology and special flocked swab. It can be used for the collection and storage of clinical novel coronavirus, influenza, avian influenza (such as H7N9), hand-foot-mouth virus, measles and other virus specimens, as well as for chlamydia, mycoplasma, and ureaplasma. Specimen processing was performed in a class II biological safety cabinet using biosafety level three (BSL3) work practices.
RNA Extraction
Nucleic acids were recovered from clinical specimens using an automatic extractor (MagDEA DNA / RNA 200 virus), The RNA samples were separated in two aliquots.
qRT PCR
The first aliquot was used for the qRT-PCR using the Mutaplex SARS-CoV-2 commercial kit (Immundiagnostik AG). Specific primers were used for highly conserved regions and double-labeled probes to enhance and differentiate RNA SARS-CoV-2 and other beta Coronaviridae such as MERS. Detection of SARS-CoV-2 was visualized at the FAM / GREEN channel. Beta-coronaviruses (SARSCoV- 1 and SARS-CoV-2) are detected at Cy5 / RED channel. Internal Process Control (IPC), which was added during RNA extraction, was detected in the same reaction at HEX/ YELLOW. Detection of RNA Polymerase (human gene) allows RT-PCR detection of inhibitors confirming in addition viral RNA was isolated from specimen.
cDNA Synthesis
The second aliquot was used for the cDNA synthesis following a qRT-PCR with a post High Resolution Melting Curve. cDNA was synthesized using Luna Script® RT SuperMix Kit (New England Biolabs). A 5 μL aliquot of purified RNA was added to 4 μL of the Luna Script® RT SuperMix Kit. The reaction was performed in a total volume of 20 μl.
qRT-PCR and HRM Assay
5 μL cDNA was added to 20 μL of six different reaction mixtures containing 500 nM each primer. The primer sequences used for RNAdependent RNA polymerase gene detection were FW 5’AGA-ATA-GAGCTC- GCA-CCG-TA3’and REV 5’ CTC-CTC-TAG-TGG-CGG-CTA-TT-3’ giving an amplified product of 101bp. The primer sequences used for E gene detection were FW 5’TTCGGAAGAGACAGGTACGTTA-3’ REV 5’AGCAGTACGCACACAATCG-3’ giving an amplified product of 116bp. The primer sequences used for N1 gene detection were FW 5’CAATGCTGCAATCGTGCTAC-3’ and REV 5’GTTGCGACTACGTGATGAGG-3’ giving an amplified product of 117bp. The primer sequences used S2 gene detection were FW 5’GCTGGTGCTGCAGCTTATTA-3’ and REV 5’AGGGTCAAGTGCACAGTCTAA-3’ giving an amplified product of 107bp. 25-μL reaction was setup that contained 5 μL of cDNA, 12.5 μL 12.5μL Melt Doctor master mix, which includes HRM dye (Melt Doctor Applied Biosystem).
PCR Cycling for HRM Curve Acquisition was Run Under the Following Conditions
One cycle at 95°C for 10 min; 40 cycles at 95°C for 15 s, 60°C for 40 s, and 72°C for 30 s; Then the fragment was melted by raising the temperature from 60°C to 95°C, with an increment of 0.11°C/s, in order to obtain information on melting profiles. Melting-curve analysis was performed using the HRM software of Applied Biosystems This software analyzes the HRM curve data to identify changes in the shape of the curve that indicate sequence polymorphisms.
PCR Test for cDNA Quality
As an optional step, a cDNA quality test was performed after cDNA synthesis to verify the appropriate synthesis of the cDNA from each sample. GAPDH genes of Homo sapiens with primer set FORW 5’ CAA-TGA-CCC-CTT-CAT-TGA-CC.3’ and REV 5’ TTG-ATTTTG- GAG-GGA-TCT-CG was used for the human IPC. In this PCR protocol, 5 μL of cDNA was used with the following PCR cycling conditions: 94 °C for 3 min, 35 cycles of 94 °C for 30 s, 60 °C for 40 s, and 72 °C for 1 min, with the final elongation step at 72 °C for 5 min. Each primer was used at a concentration of 500 nM in 2× PCR premix reagent (Promega Hot Start Green Master Mix). The amplicons were subjected to electrophoresis in a 2% agarose gel at 130 V for 20 min and visualized under UV light giving an amplicon with 159bp.
Standard Curve and Limit of Detection (LOD)
The real-time PCR with Melt Doctor standard curve was generated by serial 10-fold dilutions of synthetic positive controls in RdRp, E, N1 and S2 genes with known copy numbers (10.000, 1.000, 100, 10 and 1 copies/μL). These dilutions were tested using 10 replicates and they were used as quantification standards to construct the standard curve by plotting the copy number against the corresponding threshold cycle values (Ct). To verify the specificity of the reaction, the melting curve analysis and electrophoresis on agarose gel were carried out for the products of the real-time PCR reaction. Five microliters of the amplicons were electrophoresed in 2% (w/v) agarose gel stained with ethidium bromide in 1x (TBE) buffer and visualized by ultravioltet (UV) light in order to check All specimens were aliquoted at reception and those not used in the assays were stored at -800C for later confirmation of PCR results. Positive results were considered valid when the PCR results matched in two different aliquots and analyzed with the commercial kit and the real-time PCR with HRM assay.
Biomedical Ethics Issues
The collection of clinical data from volunteers, were correlated with the laboratory research results and were conducted in such a way as to fully guarantee the patients’ anonymity and personal data confidentiality.
Statistical Analysis
Statistical analysis. Standard statistical analyses (average, standard deviation, correlation coefficient) and graphing were performed using Microsoft excel (ver 2102) for Windows.
Results
The linearity and efficiency of the real-time PCR were determined by generating a standard curve in which serial 10-fold dilutions of positive control were tested. The standard curve was generated by plotting the real-time PCR threshold cycle numbers (Ct) of each dilution against the known copy numbers of positive control. The resulting slope showed a linear relationship over 5 orders of magnitude, ranging from 10.000 to 1 copies/μL with a correlation coefficient R2>0.99. The detection rate was 100 % for up to 2,5 copies/μL having 10/10 replicates positive for E and N genes and 5 copies/μL having 10/10 replicates positive for S and RdRp genes. Strong linear correlations (r2 ≥0.99) were obtained between CT values and transcript quantity. Assay reproducibility and repeatability was tested by using replicate 10-fold serial dilutions of the RNA transcripts evaluated for each dilution point in triplicate on three different days. At the lower copy detection limit for SARS-CoV-2 and assay reproducibility exceeded 95%. Over the linear range of the assay, the coefficient of variation of the mean CT values within and between runs was 0.46%–2.54% and 0.64%– 2.39%, respectively.
The methods have thus been shown to be highly capable of detecting the novel SARS-CoV-2 with 100 % specificity. The specificity (100%) of the reactions was confirmed by a melting temperature for positive control dilutions, indicating the formation of a single PCR product with no artefacts, such as nonspecific amplification products or primer dimers (results not shown). Furthermore, amplification products were also checked on agarose gel stained with ethidium bromide in standard TBE buffer and clear and well-defined specific bands with the expected sizes for all replicates of positive control dilutions. All 620 RNA samples tested, were positive for the human gene (GADPH) which was included as internal control to evaluate the quality of clinical specimens (nasopharyngeal swabs) and nucleic acid extraction. From the 620 RNA specimens, 60 were tested positive for SARS-CoV-2 indicating a prevalence of 9,7% by both methods. The Ct Value ranged from 19 to 36 that corresponded to 10.000- 1 copy numbers. The qRT-PCR and the real-time PCR with HRM assay displayed 100% sensitivity.
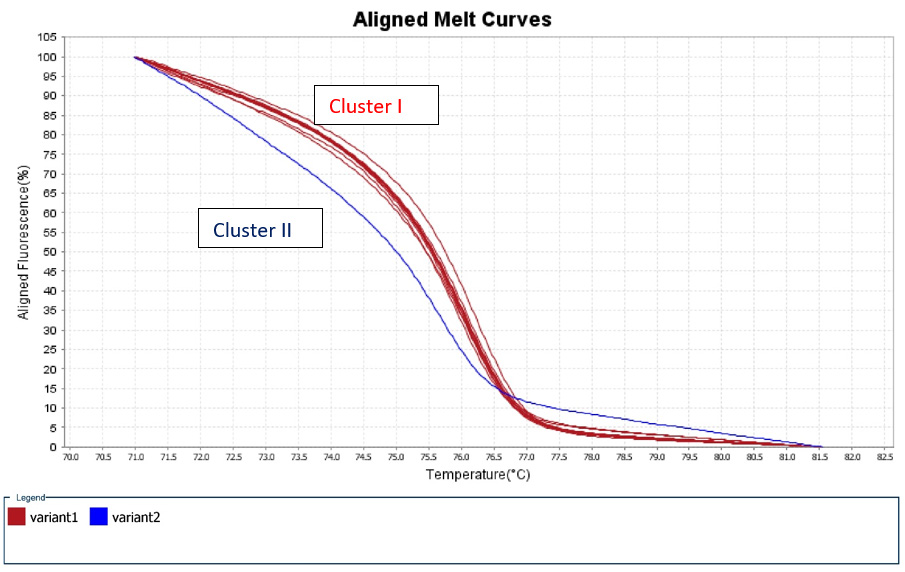
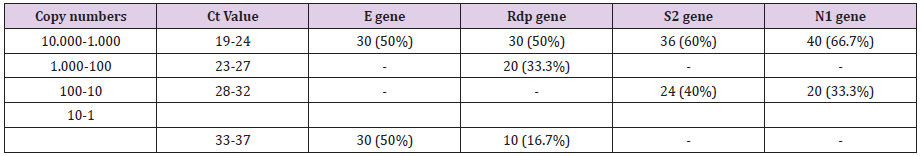
A 50% of the specimens tested comprised 10.000 to 1.000 copy numbers of E and RdRp amplicons. Sixty and 66,7% of the specimens tested, contracted 10.000 to 1000 copy numbers of the S2 and N1 genes, respectively. A range of 1000 to 100 copy numbers was also identified in 33.3% of the specimens for the RdRp gene. A range of 100 to 10 copy numbers was further identified in 40 and 33.3% of the specimens for the S2 and N1 genes, respectively. Finally, a range of 10 to 1 copy numbers was identified in 50 and 16.7% of the specimens of the E and RdRp genes. All the sixty positive for the virus-RNA samples were synthesized to cDNA following a qRTPCR with a post High-Resolution Melting Curve. The HRM diversity assay was used to analyze the regions of the four genes. As shown in Tables 1-4 and Figure 1, all SARS-CoV-2 positive samples produced measurable Tm values. The E gene demonstrated the highest variation with three clusters, with 66.7% belonging to cluster I. N1 gene amplicons identified two clusters with 50% of the specimens in each cluster. The S2 gene did not show any variation, forming only one cluster. Similar results were shown for RdRp gene, where 95% of amplicon belonged to one cluster (Table 5).
Figure 1: High Resolution Melt Curve This is an aligned melt curve. The plot demonstrates the sharp decrease in fluorescence when the double-stranded DNA melts into its single-stranded form. Diversity of positive specimens of gene Rdp.
Table 1: Diversity of positive specimens of gene E.
Table 2: Diversity of positive specimens of gene Rdp.
Table 3: Diversity of positive specimens of gene S2.
Table 4: Diversity of positive specimens of gene N1.
Table 5: Quantification of positive samples.
Discussion
SARS-CoV-2 is a highly transmissible and pathogenic coronavirus that emerged in late 2019 and has caused a pandemic of acute respiratory disease, named Covid-19, which threatens human health and public safety. Little is known about the genetics of this virus but the health communities have to respond to any new viral genetic variants, pursuing immediate countermeasures. However, it is inevitable that in a limited number of individuals a new virus population during transmission will be established. Thus, remains crucial the concerning variants to be early detected by the means of rapid and effective assays and therefore we need ascertained genomic epidemiology projects for large scale monitoring of the SARS-CoV-2 evolution. High Resolution Melting Analysis is a molecular technique based on RT-PCR that has been largely used to rapidly detect other pathogen strains, resistant to treatment. We developed the first homemade RT PCR combined with high resolution melting curve for the detection and screening of Sars-CoV-2 variants.
Although detection of the viral nucleic acid using an RT-PCR assay has become a standard and formative assessment for the diagnosis of COVID-19 [8,9] the main concern in RT PCR are the false negative results usually attributed to the low quality of the specimen and to the inappropriate sample handling. In order to be ensured that our samples had a suitable genetic material for RTPCR and adequate portion for HRM would be then extracted, we used Internal Positive Control primer sets of GADPH genes of Homo Sapiens [10,11]. All of the 620 samples studied were positive for GADPH gene, confirming therefore the quality of the extracted RNA and the converted cDNA portions. The quantification of SARS-CoV-2 RNA in clinical specimens by reporting Ct values and copy numbers of RT-PCR is generally limited [12], but this is due to the current needs of diagnosis. Efficacy of RT-PCR in the diagnosis of SARSCoV- 2 infection is greatly dependent on the pre-analytical phase, including the patient selection and material collection.
Even more the extraction method of RNA and the performance of RT-PCR test kit [12] interfere significantly with the results. Although Ct values are affected by a number of factors, they may be still able to provide important clinical data for decision making by providing an indication of viral load [13]. A positive correlation has been demonstrated between the viral load and either the severity of COVID-19, or the intensity of hypoxemia, the risk of death, or with various other hematological, biochemical, and inflammatory alterations [14,15]. As we were not aware of the complete medical history for the majority of the volunteers, the detected low Ct numbers in the 50% of the examined specimens. This probably corresponds to a high viral load of the sample which was taken 3-6 days following the symptoms onset from individuals residing in an area with high COVID-19 prevalence. Most of our study participants did not suffer from any underlying diseases and they received home-based treatment, while none them was hospitalized for any reason. In specimens that were taken 15 days later, it was shown to have higher or negative Ct values, in comparison to samples taken in the beginning of the infection (data non shown), indicating somehow a recovery status.
Although reverse transcription PCR remains the most sensitive and accurate method for the detection of the new coronavirus, the use and the sufficient supply of commercial kits for this purpose may not considered as a cost-effective solution [16]. Currently RT PCR using different sets of primers and dyers, is applied for the detection of variants [13,11,12]. However, HRM assay seems to be a promising tool, when it is combined with RT-PCR, even without any other previous testing. Even more HRM technique can be noted as a rapid, low-cost, and, high-throughput method for quantifying genetic diversity. Using thermal denaturation of double-stranded DNA, the technique extracts significant details and is capable of finding SNPs. With this method we are able to identify smaller differences in PCR amplicons, down to the single base level and therefore this method is accepted as an ideal procedure for single nucleotide polymorphism genotyping, species identification, sequence matching and mutation scanning, without the need for any further separation and additional processing following a PCR. Several HRM assays have already been successfully conducted in the past and have been applied for the detection and genotyping of viruses such as HIV[17], astroviruses [18], polyomaviruses [19], noroviruses [20] and influenza A viruses [21].
To our knowledge, no study has been conducted as yet, using high-resolution melting analysis (HRM) technique, for the rapid detection of variations within S, N, E and RdRp genes of SARS-CoV-2. In our study the highest variation with three clusters was identified in the gene E which encodes the Envelope protein E proteins, that help in the assembly and release of the virions [22]. The E protein plays important roles in viral morphogenesis, replication, and pathogenesis [23] and is conserved in coronaviruses [24]. Among the structural proteins of the SARS-CoV-2, E protein is considered as a potential drug target. However, according to the GISAID database (as of 25th May 2020), more than 40 amino acid mutations of the E gene were found from 4085 SARS-CoV-2 genomes. The E gene of SARS-CoV-2 seemed to have a high mutation rate and thus it would be difficult to synthesize an effective antiviral molecule aiming to E gene expression which may be carrying a diverse population of different strains.
Nucleocapsid proteins (N) play an important role in the packaging of viral RNA and mediate viral assembly by interacting with the viral genome and M protein, which are helpful in the augmentation of viral RNA transcription and replication [25]. Based on the high sequence similarity of N protein within the coronavirus family, it may be suggested that antibodies against the N protein of SARS-CoV would likely recognize the N protein of SARS-CoV-2. Although our results indicate variations divided in 2 distinct clusters, N gene show highly conserved regions and therefore N proteins are also considered as potential drug targets. Nevertheless, the clinical relevance of N2 negativity is considered to relate with asymptomatic or subclinical disease course as was the case of our volunteers [26]. S gene encodes the spike (S) protein which interacts with angiotensin-convertin enzyme 2 (ACE2). The inhibition of this association is a possible target for the development of novel therapeutic approaches [27]. The S2 subunit mediates the viral cell membrane fusion and the detected gene stability in our study is encouraging the idea that inhibiting the gene expression, would serve as a potent therapeutic intervention with constant effect for the prevention of disease transmissibility and pathogenesis.
The lack of any S2 variability seen in our study is providing confidence that we will not face a potentially compromised vaccine effectiveness in Greece for the near future, since S protein serve as the major viral antigen for the current vaccines. RNA-dependent RNA polymerase (RdRp), is considered a promising but challenging drug target for inhibiting replication and hence, the growth of various RNA-viruses. The widely used antiviral drug Remdesivir has an anti-RdRp activity and various under development other potent prospective drug candidates against the SARS-CoV-2 are targeting RdRp proteins. The absence of any variations in our results in regard of RdRp gene empower the steady effect of this therapeutic approach in mitigating the disastrous global effects of the COVID-19 pandemic. The emergence of SARS-CoV-2 variants which may be proved potential for increased transmission, disease severity, and resistance to vaccine induced immunity is of grave concern. A simple screening assay to monitor the emergence and spread of these variants may be helpful for epidemiological studies. With our study it was demonstrated that our assay using the highthroughput PCR assay platform is a simple, rapid, and sensitive and specific tool for detecting variant-identifying mutations.
Our HRM assay may reinforce the further investigation of the novel coronavirus diversity and the detection of newly emerging virus variants. High-Resolution Melting Assay will also possibly lead to a reduction in the need of sequencing techniques by the exclusion of the samples with the same HRM curves. Therefore, it could be then adopted as an inexpensive molecular tool for public health screening studies in order to pursue SARS-Cov-2 variants. Probably the most important limitation of the method is that it may not reveal all the sequence variations in a cDNA fragment. The limitations regarding the detection method of our home set up RTPCR was regarded similar to the commercial kit used in primary diagnosis of SARS-CoV-2 2 infection in the routine laboratory. Another limitation of the study is the rather small sample study, but the need for the prompt circulation of all relevant information regarding the SARS-CoV-2, convinced us to submit our preliminary results. Our data may then facilitate the design of a universal admission screening course.
Conclusion
A home-made RT-PCR, determining separately the expression of four gene targets, is useful for the current needs of SARS-CοV-2 laboratory diagnosis. Post RT-PCR, High Resolution Melting curves (HRM) could be considered as a rapid screening method for the identification of variants and strains of concern. Improvements of this method and further research are required in order to monitor effectively the virus evolution and the corresponding host immunity.
Determinants of Poverty in Farming Households in Southwest Geo-Political Zones of Nigeria
Introduction
The significance of rural poverty is underscored by the fact that as much as 45% to 80% of national population reside in the rural areas and are dependent in agriculture in most developing countries Ravalion et al. 2007. Poverty can be described as the level of deprivation that encompasses shortfalls or inadequacies in basic human needs, which prevent people from achieving internationally acceptable levels of well-being Etim, et al. [1]. This situation, which has been ascribed in some quarters to production failure owing to a suppression of markets and in some other quarters to institutional and distributional failure Ognonna et al. 2007 is characterized by disease, low life expectancy and physical and mental retardation. Globally, about 1.2 billion people are in extreme poverty, living on less than a Dollar per day IFAD [2]. Majority of these people are in developing countries, 44% in South Asia, 24% each in sub- Saharan Africa and East Asia and 6.5% in Latin America and the Caribbean IFAD [2,3]. Within these regions, poverty is largely a rural phenomenon with an average of between 62 and 72% of the population living on less than a dollar a day Owuor, et al. [4]. In comparison, rural poverty also tends to be deeper than urban poverty in these regions Owuor, et al. [4]. In Nigeria rural poverty levels are relatively high. For example, a national poverty survey carried out in 2003 and 2004 indicates that the urban areas have poverty levels estimated at 43.2% while the rural areas have poverty levels that are as high as 63.8% Federal Republic of Nigeria [5,6]. The mean national poverty incidence stands at 54.7 NBS [6]. However, evidence indicates that this situation has not improved in the last 15 to 17 years in a majority of Sub-Saharan countries of Africa Owuor, et al. [4]. In Southwestern Nigeria, about 70% of the populations live in the rural sector and are dependent on agriculture as in most developing countries of the world for their livelihood Akoroba 2007.
Problem Statement
Poor people live without fundamental freedoms of action and choice that the better off take for granted Elijah [7]. They often lack adequate food and shelter, education and health, deprivations that keep then from leading the kind of life that every one values. They also face extreme vulnerability to ill health, economic dislocation, and natural disasters Owuor, et al. [4] and they are often exposed to ill treatment by institutions of the state and society and are powerless to influence key decisions affecting their lives. These are several dimensions of poverty World Bank [8]. Poverty is an unacceptable deprivation in well-being World Bank [8]. It exists when there is lack of the means to satisfy critical needs. Poverty can be regarded as the status, objective or subjective, of an individual or a population. Poverty will have an objective definition once observable and measurable indicators exist that are used to approach the material or other aspects of the lives of individuals. On the other hand, the subjective definition of poverty is when judgment (including value judgment) of individuals is taken into consideration in order to investigate their welfare Amao [9]. Reducing poverty is an important development policy issue because economic growth is obviously associated with poverty reduction. Nigeria has experienced a high incidence of poverty alleviation Etim NA, et al. [1]. The worrisome aspect of this phenomenon is the spatial differences in the incidence of poverty in Nigeria. The United Nations Human Development Report (1998) declares that Nigerian poverty level is getting worse by the day and more than four in ten Nigerians live in conditions of extreme poverty of less than N320 per capita per month, which could hardly provide for a quarter of the nutritional requirements of healthy living. This is approximately $8.2 per month. The report ranked Nigeria 146 out of a total of 174 countries in its Human Development Index (HDI), which measures achievement in terms of life expectancy, education and real income per capita. Poverty has been identified as a rural phenomenon and its interventions will be effective only if the correct poverty causing factors are identified In recent years, because of the large prevalence of poverty, reducing it has been of great concern to many developing countries for the past few decades Babatunde, et al. [3]. This situation has created the quest for poverty reduction strategies which have been at the center stage of development programmes and policies. The progress towards the global target of halving, between 1990 and 2015, the proportion of people living in extreme poverty, has been very slow. The main problem lies in the fact that despite the high poverty rates in Nigeria little is documented on policy related determinants of rural poverty among farmers especially arable crop farming households, making it very difficult to effectively set and implement sustainable antipoverty programmes. Hence, the objective of this study was to empirically determine factors influencing arming household poverty in Oyo state.
Methodology
Study Area
The study was carried out in selected States of Southwestern Nigeria. Southwestern Nigeria comprises six states which are Lagos, Ogun, Oyo, Osun, Ondo and Ekiti. The Southwest lies between latitude 50N and 90N of the equator and longitudes 2.50 and 60N east of the Greenwich Meridan. It is bounded in the East by Delta State, the Republic of Benin in the West, Kwara and Kogi State in the North and by the Atlantic Ocean in the south. The major occupation in the States is farming in which Maize, Cassava, Rice, Yam, Oil palm, Cocoa, Timber are produced enormously. The vegetation pattern of the states is of rainforest in the south and guinea savannah in the north. Figure 1 shows the position of the study area in the map of Nigeria.
Figure 1: Map of Nigeria Showing the Study areas.
Sampling Techniques and Data Analysis
Multistage sampling procedure was used to select 600 rural farming households across the selected states (Oyo, Ekiti and Ogun) in Nigeria. First stage involved the selection of two (2) Zones from each states making 6 zones. Second stage involved random selection of two (2) blocks from each of the six (6) ADP zones respectively making 12 blocks. Stage three involved random selection of four (4) cells from each of the 12 blocks making 48 cells. While the last stage involved random selection of thirteen (13) rural households from each of the 48 cells making six hundred (600) rural farming households. Primary data were collected using structured interview guide.
Analytical Method
The statistical tools used to realized the objective of this study were tables, percentage, mean poverty ratios and multiple regression analysis. Descriptive statistical tools such as tables, means and percentages were used to analyse the poverty line. However, the analysis used household expenditure as a proxy for income, as income was very difficult to obtain.
Z = 2/3 Y* …………………………. 1
Where, Z = Poverty line measured in Naira. This was defined as the minimum level of consumption required and individuals or households falling below the threshold were considered poor. This was used to establish the poor and non-poor farming households. Y* = Mean of per capita household expenditure, measured in Naira and derived as the average of per capita household expenditure following Babatude, et. al. [3] Linear multiple regression analysis was used to estimate the determinants of rural poverty following Olubanjo, et al. (2007). The implicit functional form was specified as: P = f(X1, X2, X3, X4, X5, X6, X7,E) ……..… 2 Where P = Poverty line X1 = Age of the household head (Years) X2 = Marital Status X3 = Educational level (Years) X4 = Household size (Numbers) X5 = Primary Occupation X6 = Income from Primary Occupation (₦) E = Error term
Result and Discussion
Socio-Economic Characteristics of the Respondent
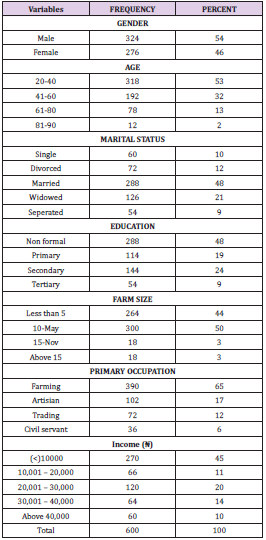
Table 1 shows the socioeconomic characteristics of the respondents in the study area. The results of the descriptive statistics reveal that 54% were male while 46% were female. Thus, this implies that male dominate farming activities than in the study area. The table also shows that 48% of the respondents were married with 27% having no formal education. Majority (44%) of the respondents have less than 5 acres of farm size with 65% choosing farming as their major occupation.
Table 1: Socioeconomic distribution of the respondents.
Note: Source: Field Survey Data, 2014
Estimated Poverty Line
The poverty lines was estimated based on per day expenditure among farming households in the study area. Results showed that the mean annual household food expenditure among the farming households was estimated as ₦11,226.11 while the poverty line was estimated as ₦427.14 per person per day. This implies that any farming household living below ₦427.14 on person per day was categorized as poor household. This implies that could not meet the daily needs of the entire farming household. Considering the mean household size of 6 persons per household, this was lower than the international poverty threshold of $1.25 per person per day for people living in sub-Saharan Africa and Asian countries as viewed by Ravallion, et al. [10]. This result tends to suggest problems of food insecurity among farming households. In other words this amount may not be able to meet the minimum daily calorie in-take of 2250 Kcal required per person per day.
Estimated Determinants of Poverty
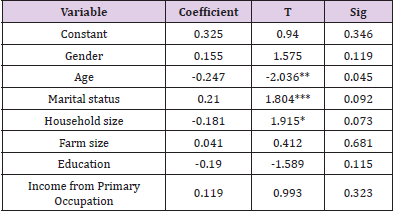
Table 2 shows the determinant of poverty among the respondents’ household in the study area. It reveals age, marital status and household size are statistically significant at 5%, 1% and 10 respectively to their poverty level. This lends credence to some author’s finding such as Elijah, et al. [4,7] that as the age of the household head increases, poverty level decreases. Education also enhances the ability to derive, decode and evaluate useful information as well as improves the quality of labour as viewed by Onyenweaku [11-15].
Table 2: Determinant of poverty among rural household in the study area.
Note: Field survey, 2014. * = Significant at 10 percent ** = Significant at 5 percent *** = Significant at 1percent.
Conclusion
The poverty line of ₦427.14 obtained was a reflection of limited resources among the farming households in the study area. The results tend to suggest problems of food insecurity among poor farming households. If farming households are to improve on food security, then there is the need to provide them with adequate compensation scheme. This can be done through provision of credit facilities. This will encourage them to produce more irrespective of the cost of production and increase in income. Finally, the determinants poverty among farming households were age, marital status and household size. The result of the determinants of poverty serves as criteria for policy interventions.
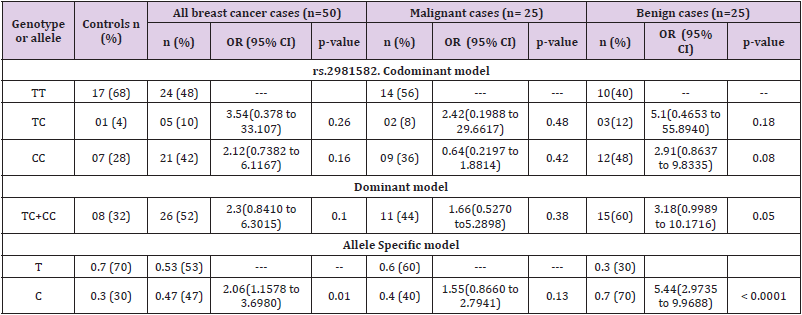
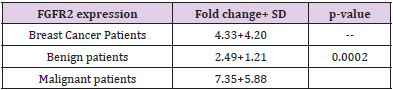
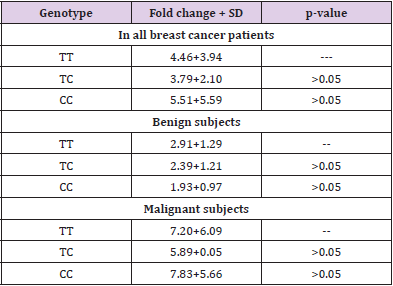
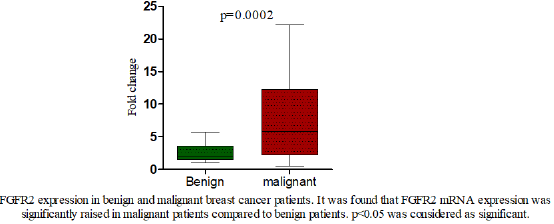
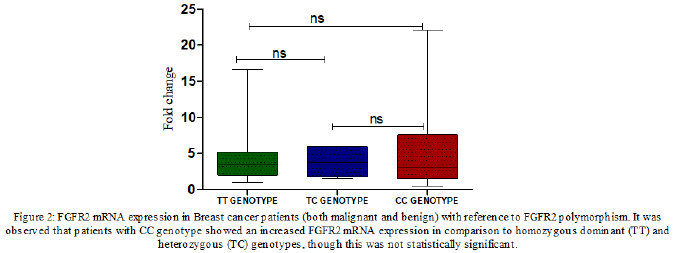
Association of Fibroblast Growth Factor Receptor Gene (FGFR2) Polymorphism (rs2981582) and its Expression with Breast Cancer
Breast Cancer (BC) is one of the most common malignant tumors among women all over the world and has the highest mortality rate amongst the cancers afflicting women [1]. In recent years, its incidence has increased among young women with increasing tendency of chemo-resistance and recurrence [2,3]. Genetic factors such as BRCA1, BRCA2, HER2, CyclinD1, MAP3K1, FGFR2, TOX3, etc play a major role in etiopathogenesis of breast cancer [4]. Lots of researchers have reported the association between FGFR2 polymorphism and BC risk [5-7]. FGFRs mediate signaling of fibroblast growth factors (FGFs) and have numerous important functions [8]. FGFR2 gene is located at chromosome 10q26 and acts through multiple downstream signaling pathways that play vital roles in cell proliferation, survival and differentiation [9]. The role of FGFR pathway as a predictive/prognostic marker has been investigated through various studies. According to these studies, aberrant FGFR2 expression is associated with an increased risk of BC and correlates with poor prognosis [10,11]. According to Gene Wide Association Study (GWAS), five single nucleotide polymorphisms (SNPS) (rs7895676, rs2912781, rs10736303, rs2912778 and rs2981582) in the non-coding region of FGFR2 were found to have a significant association with breast cancer. FGFR2 (rs2981582) in intron 2 has been identified as the most significant breast cancer risk locus by the Breast Cancer Association Consortium genome wide association study [12]. Hunter et.al (2007) also identified four other SNPs, rs11200014, rs2420946, rs1219648 and rs2981579 in intron 2 of FGFR2 that are also associated with breast cancer [13]. Therefore, it becomes very important to understand the FGFR pathway on how it leads to BC and how it can be targeted. Several trials are being done with multiple agents that target FGFR pathway components [14-16]. According to these trials, identification of patients with FGFR pathway amplified tumors who may respond to this treatment may be possible. Large number of studies are available on relevance between FGFR2 single nucleotide gene polymorphisms (rs2981582 and rs2981579) and breast cancer, but the results vary with geographical differences [17]. There is hardly any study exploring the association of rs2981582 FGFR2 polymorphism in patients of breast cancer with Indian ethnicity. Therefore, we developed an interest to elucidate the frequency of this polymorphism and its influence on FGFR2 expression in Indian patients with breast cancer.
Materials and Methods
Study Site and Patient Recruitment
The present study was conducted at the Department of Biochemistry in collaboration with the Department of Surgery and Department of Pathology, Maulana Azad Medical College and Associated Hospitals, New Delhi, India. The Institutional Ethics Committee (IEC) of Maulana Azad Medical College approved the study and written informed consent was provided by all participants for blood sampling and genetic testing. All the research has been conducted in accordance with the Helsinki declaration. Patients were consecutively recruited from July, 2018 to December, 2020 in Lok Nayak Hospital, New Delhi, India. Twenty-five female patients who were histopathologically diagnosed with breast cancer were included in the study. Another 25 patients with benign fibroadenoma were also recruited. The control subjects comprised of twenty-five unrelated healthy women. Patients with history of other malignancies or other systemic diseases were excluded from the study.
Genotyping
Peripheral blood samples from cases and healthy control subjects were collected in EDTA anticoagulant vials and stored at −80°C until used for further process. Whole genomic DNA was isolated from the peripheral blood mononuclear cells (PBMNCs) using HiPurATM Blood Genomic DNA Miniprep Purification Kit (Ref: MB504-50PR, Country of origin: India) according to the manufacturer’s instructions. The quality of DNA was checked by Ethidium Bromide (EtBr) stained 1% agarose gel electrophoresis. The DNA quantity and integrity were determined by A260/280 ratio using NanoDrop spectrophotometer (Washington, DC, USA). Polymerase Chain Reaction Restriction Fragment Length Polymorphism (PCR-RFLP) technique was used to study rs2981582 single nucleotide polymorphism in FGFR2 gene. The detailed information of the FGFR2 SNPs, primer sequences used for amplification, PCR amplicon sizes, restriction edonucleases used and size of products obtained after restriction digestion are given in Table 1. The restriction digestion fragments were resolved and analyzed by 3% to 3.5% agarose gel electrophoresis using EtBr as staining dye.
Table 1: Score of overall students’ barrier perception to exclusive e- learning (n=1137).
RNA Isolation and cDNA Synthesis
Total RNA was extracted from all the subjects using Geneaid Total RNA Mini Kit (Cat. No. RB100, Country of origin: Taiwan) according to the manufacturer’s instructions. Briefly, 300μL of peripheral blood in an eppendorf was mixed with 900μL of RBC lysis buffer, incubated at room temperature for half an hour and centrifuged for 10minutes at 3500 RPM. The supernatant was discarded, and this step was repeated till a whitish cell pallet appeared at the bottom of the eppendorf tube. This cell pallet was mixed with 200μL cell lysis buffer and incubated for 10minutes. The ingredients of the eppendorf tube were then transferred to columns, provided with the kit, and centrifuged at high speed (14000 RPM) for 2minutes. The temperature of the centrifuge machine was set at 4°C. The columns were then washed with 75% alcohol and RNA was eluted down in RNAse free water (100μL). RNA integrity was determined by agarose gel electrophoresis (2%) and concentration was determined by measuring absorbance at 260 nm as discussed above. The RNA was converted to complementary DNA (cDNA) using cDNA synthesis kit (Thermo Fisher Scientific, USA) by following manufacturer’s instructions as provided with minor modifications. I brief, total RNA (100 ng), 2 μL oligo (dT) primer, and 9 μL water were mixed and incubated at 70°C for 5 minutes in a thermal cycler. This reaction mixture was then mixed with 5X RT buffer (4 μL), 5 mM dNTPs (2 μL), 1 μL each of RNAse inhibitor, and reverse transcriptase enzyme in a total volume of 20 μL. This mix was incubated at 42°C for 1 h and then heated to 95°C to stop the reaction. The cDNA was stored at −80°C until used for expression studies.
Quantitative Real Time Polymerase Chain Reaction (qRT-PCR)
Quantitative RT-PCR was used to carry out relative expression of FGFR2 gene on a Rotor-Gene Instrument (QIAGEN; Skelton House, Lloyd, Manchester, UK). β-actin gene was used as reference gene for normalizing. The primers used were as follows: FGFR2 forward primer 5′-TCCACATGGAGATATGGAACAGGA-3′ FGFR2 Reverse primer 5′-GGAGCTATTTATCCCCGAGTG-3′ β-actin Forward primer 5′-CGACAACGGCTCCGGCATGTGC-3′ β-actin Reverse primer 5′-CGTCACCGGAGTCCATCACGATGC-3′ A 20 μL reaction mixture consisting of 10 μL SYBR Green Master Mix, 1 μL cDNA (equivalent to 100 ng RNA), 0.3 μL forward primer (25 pm/μL), 0.3 μL reverse primer (25 pm/μL), and 8.4 μL water. The thermal cycling conditions were standardized to match both FGFR2 and β-actin specific primers. The final standardized temperature profile consisted of a denaturation program of 95°C for 5 min followed by 40 cycles of denaturation at 95ºC for 15 seconds, annealing at 60ºC for 45 seconds, and extension at 72ºC for 50 seconds with a final extension at 72ºC for 10 minutes. The quantification was expressed as 2−ΔΔCT or fold change using Livak method adopted from (https://doi.org/10.1177/1010428317713857 and https:// doi.org/10.1007/s13577-020-00370-6).
Statistical Analysis
Chi-square test was performed for comparison of genotypic frequency distribution between: I) All patients and healthy controls, II) Benign patient’s vs healthy controls and III) Malignant patient’s vs healthy controls and IV) benign vs malignant patients. Odds ratio along with corresponding 95% confidence intervals (CIs) were used for estimation of individual genotypic risk for breast cancer by employing codominant model of inheritance. Continuous data was analysed by student t-test and One-way ANOVA (Analysis of variance). Moreover, all the p-values were corrected, in case of multiple comparisons, by employing Tukey’s post hoc test. These statistical analyses were performed by GraphPad Prism 5.lnk software package and a p value of <0.05 was considered statistically significant.
Results
The clinicopathological and demographic characteristics of patients and healthy controls are represented in Tables 1 & 2. In contrast to healthy controls (mean ±SD=34.28±9.3), the breast cancer patients tended to be younger (mean ± SD=32.52+11.13) taken together was more. Further, when the breast cancer patients were subdivided, benign patients were comparatively found to be younger (mean ±SD=30.76±12.65) followed by healthy subjects (mean ±SD=34.28±9.3) and then by malignant patients (mean ±SD=46.2±15.54). Principally, we did not find any significant differences in basic demographic characteristics among the healthy subjects and breast cancer patients when taken together except that breast cancer patients significantly tend to be multiparous and married. However, significant differences were seen in basic characteristics including age at menarchy, parous status, menopausal status, breast feeding and marital status, but feeding habits, between subtypes. All the basic characteristics of healthy and breast cancer subjects, along with statistical analysis, have been presented in Tables 2 & 3.
Table 2: Basic demographic characteristics of healthy controls and breast cancer patients.
Table 3: Association of breast cancer risk with FGFR2 (rs2981582) polymorphism.
Risk Analysis of FGFR2 Polymorphisms in Concert with Breast Cancer
The genotypic and allele distribution of FGFR2 polymorphisms (rs nos. of FGFR2 pols) are shown in Table 3. The risk analysis based on calculation of odds ratio showed association of FGFR2 polymorphism with overall breast cancer risk. It was observed that FGFR2 polymorphism exhibited a heightened overall breast risk in both codominant and dominant models though it was not significant. In codominant model the heterozygous genotype (TC) depicted the highest risk (OR=3.54; 95% CI= 0.378 to 33.107; p=0.26) followed by recessive homozygous (CC) (OR=2.12; 95% CI= 0.7382 to 6.1167; p=0.16); dominant model; TC+CC; (OR=2.30; 95% CI= 0.8410 to 6.3015; p=0.10). The allele specific model depicted a statistically increased risk of overall breast cancer associated with the minor allele of the polymorphism (C allele; OR=2.06 95% CI=1.1578 to 3.6980; p=0.01).When patients were sub-grouped based on the type of tumor; benign and malignant, TC genotype in dominant model, TC+CC additive genotype in dominant model and C allele in allele specific model showed a non-statistical heightened risk for malignant breast cancer (OR=2.42; 95% CI= 0.1988 to 29.6617; p=0.48: OR=1.66; 95% CI= 0.5270 to 5.2898; p=0.38 and OR=1.55; 95% CI= 0.8660 to 2.794; p=0.13 respectively). Further, the recessive CC genotype was found to be associated with decreased risk of malignant breast cancer in codominant model, though the results were not significant (Table 3). Increased associations were observed between benign breast cancer and heterozygous (TC) and recessive homozygous genotypes (CC) (OR=5.10; 95% CI= 0.4653 to 55.8940; p=0.18 and OR=2.91; 95% CI= 0.8637 to 9.8335; p=0.08 respectively) in codominant model. Also, in dominant model of inheritance, the FGFR2 was found to be nonsignificantly associated with increased risk for benign breast tumor (TC+CC: OR=3.18; 95% CI= 0.9989 to 10.1716; p=0.05). Moreover, a statistically increased risk for benign breast tumor was associated with recessive allele (C) of FGFR2 polymorphism in allele specific model of inheritance (OR=5.44; 95% CI= 2.9735 to 9.9688; p<0.0001).
FGFR2 mRNA Expression and Polymorphism (rs2981582) in Concert with Breast Cancer
We analysed the mRNA expression of FGFR2 gene and compared it among healthy controls and breast cancer patients. It was observed that RGFR2 mRNA expression varied significantly among healthy controls and breast cancer patients. Breast cancer patients exhibited an increased FGFR2 mRNA expression compared to healthy control subjects (mean fold ± SD=4.33+4.20, Table 3). We further compared FGFR2 mRNA expression among benign and malignant breast cancer patients and observed that FGFR2 mRNA expression was significantly raised by 2.95-fold in malignant subjects compared to benign tumor ones (mean fold ±SD=2.49+1.21 vs 7.35+5.88; p=0.0002 respectively, Table 4 and Figure 1). Next, we categorized patients based on genotypic distribution of FGFR2 (rs2981582) polymorphism and analyzed the FGFR2 mRNA expression in breast cancer patients with reference to their genotype. We observed an increased FGFR2 mRNA expression in patients with mutant homozygous (CC) genotype (mean fold± SD=5.51±5.59) compared to patients with wild type (TT) (mean fold +SD=4.46±3.94) and heterozygous (CC) genotypes (mean fold ±SD=3.79±2.10), but this difference did not reach statistical significance (Table 4 & Figure 2). Similarly, FGFR2 mRNA expression in concert with FGFR2 (rs2981582) polymorphism genotype was analysed in patients of benign and malignant tumour separately (Table 5). However, we could not reach any meaningful inference as the FGFR2 mRNA expression did not follow a meaningful pattern. The results of the analysis are depicted in Table 4 below.
Table 4: FGFR2 mRNA expression in healthy controls and breast cancer patients.
Table 5: FGFR2 mRNA expression in concert with FGFR2 (rs2981582) polymorphism.
Figure 1: FGFR2 expression among breast cancer and benign breast disease.
Figure 2: FGFR2 expression with reference to FGFR2 polymorphism.
Discussion
In addition to several known risk factors, studies have shown strong relations with FGFR2 gene in respect to breast cancer. Multiple genetic aberrations in FGFR2 which triggers the activation of up and/ or downstream FGFR2 signaling pathways have been identified in breast cancer [7]. In this study, SNP of FGFR2 rs2981582 of genotype T>C have been chosen for assessing the association with risk of breast cancer. The protocol resulted in fragment lengths of 176 base pairs, with genotype patterns wild type TT [176 base pairs(bp)], heterozygous TC (176+154+22 bp) and homozygous CC (154+22bp).On assessment of specific genotype association with breast cancer, our results show that on comparing malignant with healthy controls, a slightly higher risk is associated with heterozygous genotype TC with OR of 2.4 (95% CI=0.199-29.66) but is not statistically significant (p value=0.481) TT genotype being the wild type (Table 3). Also, while comparing malignant with benign cases, no significant risk in both heterozygous genotype TC (OR=0.47 95% CI=0.067-3.396 P-value=0.46) and homozygous genotype CC (OR=0.53 95%CI = 0.164-1.75 P-value=0.30) (Table 3) was observed. So, rs2981582 SNP did not alter the risk of benign or malignant breast tumour in this population. A study of 203 histopathologically confirmed cases of breast cancer and 200 cancer free controls by Liu et.al showed that the rs2981582 TT genotype is significantly associated with breast cancer in Chinese women (OR=1.831, p-value=0.037) [18] but no evidence of significant association was found in this study of 25 breast cancer cases and 25 benign cases with 25 healthy controls. The small sample size may be attributed to the above finding in our study. Our results have shown that FGFR2 expression was significantly increased in malignant cases (mean fold change =7.35±5.88) as compared to benign cases (mean fold change=2.49±1.219) with p-value of 0.0002 (Fig.1). This finding is correlating with the previous studies on overexpression of FGFR2 in breast cancer [19]. So we infer that altered expression of FGFR2 might have a role in pathogenesis/malignant transformation of breast tumor / cancer. However, on comparison of FGFR2 expression among benign patients with different genotypes (rs2981582 T>C) the differential gene expression associated with different genotypes of the polymorphism (TT/TC/CC) was not found to be statistically significant (Figure 2). On comparing the same among malignant patients, FGFR2 gene expression among different genotypes in malignant cases was also statistically insignificant (Figure 3). So, we hypothesize from this study that rs2981582 SNP does not influence the expression of FGFR2 in this population.
To the best of our knowledge, previous studies have not clearly documented possible relationship between FGFR2 expression with different genotypes of the polymorphism rs2981582. It is worth exploring which SNPs of FGFR2 gene influence its expression or if there is some gene-gene or gene-environment interaction influencing its expression in breast cancer.
Gender and Time Trend of Liver Cirrhosis Mortality and Its Estimated Avoidable Proportion in a Mountainous Province of Viet Nam from 2005 To 2018
Introduction
During 1980-2017, Liver Cirrhosis was the major mortality of liver diseases worldwide [1]. The disease is chronic progressive liver fibrosis due to lifestyles and environmental factors [2]. In the initial stages, patients who suffered from liver cirrhosis are asymptomatic and the disease incidence rates are commonly underestimated [3]. Once clinical symptoms occur, the morbidity and premature death resulting from cirrhosis increase sharply [4]. Liver diseases due to chronic infection with hepatitis viruses [5-8] and high consumption of alcohol [9] have been observed to be common in Viet Nam from the last century to date. Harmful usage of alcohol, chronic infection with hepatitis viral infection, and smoking might be responsible for cirrhosis. Previous results have pointed out the major risk of cirrhosis was “Alcoholism” in many countries [10-13]. Based on these facts and figures, we have hypothesized that liver cirrhosis is a lifestyle-related health event and a possible avoidable disease. Patients suffering from liver cirrhosis need frequent medical care and their quality of life is affected [14]. Patients with liver cirrhosis have significantly increased morbidity and mortality [15]. However, few studies have been performed to address this public health problem in Viet Nam to date. This study aimed to estimate mortality rates, time trends by sex, and to estimate an avoidable proportion of death due to cirrhosis in men in Lang son Province from 2005 to 2018.
Methods
The study was performed in Lang Son province, a mountain highland province in northern Viet Nam. The study population is bordering Guangxi province in China and other provinces in Viet Nam. It was a population-based mortality registration operated by the Lang Son Center for Diseases Control (CDC) that covered all 226 communes of 11 cities/districts of the province, with a population of 790,500 people in 2018 [16]. In Viet Nam, the national mortality registration systems have been started from 1992 that was following the guideline by the Ministry of Health to report the causes of death from all health facilities nationwide. From 1992 to date, Lang Son is one of all 63 cities/provinces of the country to actively conduct mortality registration based on the medical records available at 226 state commune health stations (CHS), 10 district general hospitals, 9 district out-patient clinics, and 3 provincial general and specialized hospitals. The head of the CHS is a person in charge of the monthly report of all death cases that occurred at his/her communes in a mortality registration book, named A6-mortality book that was designed by the Ministry of Health. The variables included name, age, sex, ethnicity, address, occupation, date, and cause of death, place of death occurred (at a health facility, home, other), and attended emergency care at the endpoint (Yes/no), and the name of the reporter. From 2005 to date, the Lang Son CDC has collected data from all 226 CHS using the data collection form in the hard copy of “Mortality Registration” for six variables of name, age, sex, occupation, date, and cause of death for every year. The additional guidelines to determine the causes of deaths, including the immediate cause of death, a contributing cause of death, and the underlying cause of death, and its ICD-10 code, were sent with the designed form of “Mortality Registration”. The average population number by sex has also been collected by this form for every year from 2005 to 2018. A yearly population structure by age groups of (0-9, 10-19, 20-29, 30- 39, 40-49, 50-59, 60-69, 70-79, 80+) by sex was estimated using the results of the National Census conducted in 1999, 2009, and 2019. The collected variables of each death case were inputted in Excel for each district for each year. The ID and ICD-10 code for the cause of death was made for each case. In this way, a database of mortality from 2005 to 2018, missing data for 2009-2010, was made by the Lang Son CDC. The dataset included 49,253 reported death cases due to all causes [16,17]. We accessed to Lang Son database of mortality during 2005- 2018, missing data for 2009-2010, to derive variables of case’s ID, age, sex, date, and cause of death, ICD-10 code. We found ICD-10 code K74 for Liver Cirrhosis and a total number of 2,612 cases for the present study. We also derived the average number of population by years and by communes for further estimate number of person-year for the final analysis. We calculated the mortality rates ratio with a 95% confidence interval (MRR, 95%CI) using regression analysis, adjusted for age groups of 10-year intervals (0-9, 10-19, 20-29, 30-39, 40-49, 50-59, 60-69, 70-79, 80+) and sex. Age-standardized rates (ASR) per 100,000 person-years were calculated using the world population structure as the standard. We calculated the avoidable proportion of deaths in men by the formulation of ((a-b)*100/a (a: ASR in men; b: ASR in women). The Board of Ethics in Bio-Medical Research at University of Medicine and Pharmacy at Ho Chi Minh City #106/UMP-BOARD, on 20 March 2019 and Hanoi Medical University Review Board in Bio-Medical Research # 61/HMURB, on 25 November 2008 have approved the present research protocol.
Results
Overall, a total of 2,612 deaths were registered among residents in Lang Son Province from 2005 to 2018. Table 1 shows the results of deaths were 2,321 in men and 291 in women. Men had a higher age-adjusted mortality rate (ASR-WHO 63.2 per 100,000) due to cirrhosis compared to women (ASR-WHO 7.3 per 100,000), giving man to women ratio: 8.7/1 (63.2/7.3). The estimated men to women ratio were sharply increased from 4.9/1 (49.1/10.1) in 2005 to 18.6/1 (63.1/3.5) in 2018. Compared to women, the estimated avoidable proportion of death from Liver Cirrhosis in men was ((63.2-7.3)*100)/63.2=88.5%. There was 88.5% of total premature deaths occurred under the age of 70, Table 1. The agestandardized death rate increased gradually according to WHOASR from 27.7 per 100,000 to 33.4 per 100,000 person-years for both genders from 2005 to 2018, respectively. The estimated proportion of deaths due to Liver Cirrhosis was 5.3% (2,612 cases of Liver Cirrhosis vs. 49,253 total death cases) in both genders. Overall death due to the disease, men, and women combined, was significantly increased from 2005 to 2018. After adjusting for age and sex, per-year increment was significantly seen, MRR (95%CI): 1.019 (1.009, 1.028), p=0.001 (Table 2).
Table 1: Mortality due to Liver Cirrhosis by sex during 2005-2018 in Lang Son province.
Note: Missing data for the year 2009-2010; &: Crude rate per 100,000 person-years; $: Age-standardized rate per 100,000 person-years using the World Health Organization standard population for 2000-2025; # Proportion of death cases aged under 70 year-olds. @: Age-standardized rate per 100,000 person-years using the SEGI World standard population (in the 1960s). Men to women ratio (ASRWHO) = 8.7 (63.2/7.3). The estimated proportion of death from Liver Cirrhosis in men was {(63.2-7.3)*100}/63.2=88.5%
Table 2: Mortality due to Liver Cirrhosis in both genders by year from 2005 to 2018 in Lang Son province.
Note: Missing data for the year 2009-2010; the estimated proportion of deaths due to Liver Cirrhosis was 5.30% (2,612 cases of Liver Cirrhosis vs. 49,253 total cases), both genders. $$ adjusted for age group (0-9, 10-19, 20-29, 30-39, 40-49, 50-59, 60-69, 70-79, 80+) and sex. Per-year increment MRR (95%CI): 1.019 (1.009, 1.028), p<0.001. & Crude rate per 100,000 person-years; $ Age-standardized rate per 100,000 person-years using the World Health Organization standard population for 2000-2025; # Proportion of death cases aged under 70 year-olds. When combined all cases from 2005-2018, both genders, WHO-ASR: 31.3 per 100,000 person-years.
In men, the estimated proportion of deaths due to Liver Cirrhosis was 7.4% (2,321 cases of Liver Cirrhosis vs. 31,262 total cases). The age-standardized mortality rates per 100,000 were increased from 49.1 in 2005 to 65.1 in 2018. The estimated mortality rates ratios, the year 2018 versus 2005, were significantly increased, MRR (95%CI): 1.367 (1.104, 1.693), p=0.004. During this period, per-year increment was significantly observed, MRR (95%CI): 1.028 (1.018, 1.038), p=0.001 (Table 3). In Women, the estimated proportion of deaths due to Liver Cirrhosis was lower (1.6%, 291 cases of Liver Cirrhosis vs. 17,990 total death cases) than in men (7.4%, 2,321 cases of Liver Cirrhosis vs. 31,262 total death cases). For a time trend, in contrast, death due to the disease was significantly decreased in women from 2005 to 2018. The estimated mortality rates ratios, the year 2018 versus 2005, were significantly decreased, MRR (95%CI): 0.344 (0.177, 0.668), p=0.002. During this period, per-year decrement was significantly seen, MRR (95%CI): 0.948 (0.923, 0.974), p=0.001 (Table 4). By age-specific, the estimated mortality rates per 100,000 in men were much higher than in women for all age groups, especially for the age group (50-59), 193.5 versus 13.2, respectively (Figure 1).
Table 3: Mortality due to Liver Cirrhosis in men by year from 2005 to 2018 in Lang Son province.
Note: Missing data for the year 2009-2010; the estimated proportion of deaths due to Liver Cirrhosis was 7.42% (2,321cases of Liver Cirrhosis vs. 31,262 total cases) in men. ## adjusted for age group (0-9, 10-19, 20-29, 30-39, 40-49, 50-59, 60-69, 70-79, 80+). Per-year increment MRR (95%CI): 1.028 (1.018, 1.038), p<0.001. & Crude rate per 100,000 person-years; $ Age-standardized rate per 100,000 person-years using the World Health Organization standard population for 2000-2025; # Proportion of death cases aged under 70 year-olds. When combined all cases from 2005-2018 in men, WHO-ASR: 63.2 per 100,000 person-years.
Table 4: Mortality due to Liver Cirrhosis in women by year from 2005 to 2018 in Lang Son province.
Note: Missing data for the year 2009-2010; the estimated proportion of deaths due to Liver Cirrhosis was 1.62% (291 cases of Liver Cirrhosis vs. 17,990 total cases) in women. ## adjusted for age group (0-9, 10-19, 20-29, 30-39, 40-49, 50-59, 60-69, 70-79, 80+). Per-year increment MRR (95%CI): 0.948 (0.923, 0.974), p<0.001. & Crude rate per 100,000 person-years; $ Age-standardized rate per 100,000 person-years using the World Health Organization standard population for 2000-2025; # Proportion of death cases aged under 70 year-olds. When combined all cases from 2005-2018 in women, WHO-ASR: 7.3 per 100,000 person-years.
Figure 1: Age-specific mortality rate per 100,000 person-years by sex during 2005-2018 due to Liver Cirrhosis. Note: Missing data for the year 2009-2010;
Discussion
We observed a divergence over time from 2005 to 2018 between men (statistically significant increase) and women (statistically significant decrease) in a community in the mountainous province of Lang Son in northern Viet Nam. When compared to women, the estimated avoidable proportion of death due to the disease was about 88.5% in men. There was serious premature death, as high as 88.5% for both genders (91.3% in men and 66.3% in women). The findings suggested that Liver Cirrhosis is a preventable disease and performing primary prevention in the community to reduce premature death would be highly needed. Harmful usage of alcohol by men living in the Lang Son province might be the major risk factor of developing Liver Cirrhosis. An estimated annual amount of pure alcohol consumption in 2010 was 12.1 liters and 0.2 liters in men and women, respectively [18]. This big gap between men and women can be consistent with the significantly higher risk of death from Liver Cirrhosis in men than in women. Between men and women, there were no significant differences for both Hepatitis B virus, HBsAg positive (Odds ratio and 95% confidence interval, men versus women: 0.76 (0.54–1.01)) and Hepatitis C virus infection (Odds ratio and 95% confidence interval, men versus women: 1.73 0.41–7.28) [5,19]. Therefore, viral Hepatitis infection could not be explained for the big gap between genders in the risk of death from this disease. The present findings support our hypothesis that liver cirrhosis is a lifestyle-related health event and a possible avoidable disease. The results warrant further observational studies to conclude the association between alcoholism and Liver Cirrhosis in the disadvantaged areas in Viet Nam with emphasis on primary prevention of the disease. There was rarely alcohol drinking (0.2%) and tobacco smoking in Vietnamese women aged 15+ (1.7%) in 2010 [18] and it was a similar observation in the 1990s [20]. The estimated prevalence of Hepatitis C virus infection was very low (0.5%) in rural areas [19]. There was also a very low prevalence (4.8%) of overweight among Vietnamese women. Therefore, Vietnamese women will be minimized risk of Liver Cirrhosis caused by alcoholism, smoking, Hepatitis C virus infection, and obesity. From 2005 to 2018, nutrition and diet, living and working environments have been improving which might be explained why there was a significantly decreased trend of mortality from the disease in the study population. In contrast, a significant increasing trend in men might be related to the increasing prevalence of harmful usage of alcohol from 25.5% in 2004 to 35.0% in 2013 [21]. The present study has several strengths, including long time of mortality registration from 2005 to 2018 to examine time trend of the disease; a large number of mortality cases was reported for both men and women; the covered study population was for the entire Lang Son province with good healthcare systems from communes to district and provincial health facilities; mortality registration was actively and yearly done by professional health workers; the average population by each of 226 communes was updated for every year that allows us to estimate the age-standardized mortality rates by genders and for each year [16,17]. In addition, the quality of mortality registration in Viet Nam has been validated [22-24] to be performed well which will be feasible, reliable, and practical to develop annual local and national mortality databases of mortality to identify priority public health problems and to create planning timely actions in general and in controlling Liver Cirrhosis in particular. Based on these favorable research conditions, we can observe a real problem of the disease and add some new pieces of knowledge for further elimination of this preventable health threat in our society. Liver Cirrhosis was a serious public health problem at the disadvantaged highland in Viet Nam of the present study population and that was consistent with findings in the world. There were 1.32 million deaths due to Liver Cirrhosis reported in 2017, with 440,000 deaths in women and 883,000 deaths in men. The burden of disease has been increased from 1990 to 2017. That is, the estimated deaths due to Liver Cirrhosis were responsible for about 2.4% of total deaths in the world in 2017 compared with 1.9% in 1990 [25]. In this study, we found that mortality due to cirrhosis was 5.3% of total deaths during 2005-2018 in the Lang Son province that was over doubled than the world estimation. There has been no systematic nationwide screening for Liver Cirrhosis in Viet Nam, especially in the mountain areas, and no nationwide comprehensive response to the disease. The present study has certain limitations that include i) missing data for the year 2009-2010; ii) there is no available data of histopathological confirmation of Liver Cirrhosis, and iii) there is not the available data of lifestyle and environmental factors related to the disease. Despite these limitations, the present findings warrant further studies to identify risk factors for implementing primary prevention and secondary prevention in the community.
Pore Characterization of Alumina Short Fiber Using Small Angle X-Ray Scattering Technique
Introduction
Alumina or Aluminium Oxide (Al2O3) is ceramic metal oxide and have wide variety of applications [1]. Alumina is also widely used as biomaterials for bone replacement [2]. This is due to the fact that Alumina is relatively high strength and has good tribological properties especially wear resistance. Improvement in terms of material purity has led to great chemical resistivity and excellent tissue compatibility. Thus, it is not surprising the usage of Alumina even is found in dental implants [3]. Alumina could be produced by electrospinning technique. It is a process of producing fibers by employing electrohydrodynamic properties with a relatively simple set-up [4]. The set-up includes a high voltage power supply, pump, syringe and grounded collector. Raw material for the electrospinning process is in the form of sol-gel. Prior to sol-gel injection by using the syringe, an electrical field is generated between the syringe and the collector. As the sol-gel is injected from the syringe, an electrical repulsive force directs the material in the form of fiber onto the collector. The obtained material on the collector finally in the form of thin layer of mats. The material is carefully removed and calcined at high temperatures to remove the unwanted polymer precursor. Then the desired Alumina is obtained. The fiber produced by this technique demonstrate good performance and properties. This is due to the increase of the specific surface area of the nanofiber. The nano-scale could be achieved by various approaches includes reduction of fiber diameter. Electrospinning process allows manipulation of setting parameters to achieve that [5]. Electron microscopy (EM) and small angle scattering (SAXS) are two approaches of data acquisition method for characterizing nanoparticles. Both are considered as direct technique but one is in real space (EM) and the other is in reciprocal space (SAXS). These two methods are usually utilized to produce data such as size distributions, determine pore sizes, high resolution imaging and much more [6]. Fundamentally, electron microscopy (EM) uses high speed electron as a source of illumination to obtain high resolution image while small angle x-ray scattering (SAXS) involves successive irradiation mode of passing the x-ray beam through the sample and data built based on scattered x-rays [7,8].
There are idiosyncratic advantages and disadvantages between these two techniques. With regard to application on different types of samples, small angle x-ray scattering (SAXS) has further advantages due being able to study variety of sample states includes solid, powder, sol-gel as well as thin film [9]. Estimation of particle sizes of electron microscopy (EM) methods is made from measurements of limited number of particles which makes small angle x-ray scattering (SAXS) provide more accurate data on particle sizes due the estimation is made from vast number of particles [10]. In addition, preparing samples for small angle x-ray scattering (SAXS) are often require very little time, comparing to the complicated electron microscopy (EM) sample preparation procedure where often taking longer period. It is the interest of researchers to probe the specific surface area for confirming the success of obtaining nano-scale materials. One of the technique is through the use of Small Angle X-ray Scattering (SAXS) technique.
SAXS is advantageous as compared to fluid for probing the pore space. It covers both close and open pore. In SAXS, a beam of X-rays of fixed wavelength and known intensity is illuminated on the sample, and the intensity of the scattered signal is measured versus the scattering vector. X-ray probe the fluctuations of the electronic density and reflect the chemical heterogeneity and density variations within the sample. From this result, many information on the sample are obtainable such as size, shape and specific surface area.
Materials and Methods
The Alumina nanofibers were prepared from electrospinning process. The raw materials used were reagent grade Aluminium Isopropoxide (AIP) as the source of alumina precursor, Polyvinylpyrrolidone (PVP with Mw 1300000) as polymer precursor, nitric acid (HNO3) and Ethyl Acetoacetate. All chemicals were from Sigma Aldrich. The optimum electrospinning setting parameter were followed based on previous work [11]. Surface morphology was carried out using SEM/EDX FEI Quanta 400. SAXS experiments were performed using Anton Paar Saxpoint instrument, operated at 50kV and 1mA with the point collimation geometry. The radiation used was a Ni filtered CuKα radiation of wavelength 0.154nm. The intensity profiles are recorded using a CMOS 2-D detector (Eiger) and the scattering vector q, covers from 0.035 to 5 nm-1. One-dimensional scans of I(q) were extracted from two- dimensional scattering patterns using the analysis package SAXS analysis, Primus and Easyswax. Angular calibration of the scattered intensities in the small angle regime for the detector is performed using silver bahenate (d = 58.38 Å). Sample to detector distance is 575.5mm and sample exposure to the source is 600 seconds. All experiments are carried out at room temperature, 20ºC. The measured scattering vector is related to the scattering angle through the equation:
θ = Scattering angle or half of diffraction angle (degree) q = scattering vector (nm-1) 𝝀 = 0.154 (nm) Another parameter under consideration is Invariant. It is the integral of second moment of the scattering curve I(q) q2. The equation is given below:
Qp shall be calculated by extrapolating scattering intensity towards zero (Guinier approximation) and infinitely large scattering angle (Porod’s q-4 dependence). Pore is assumed to be spherical in shape. Surface to volume ratio is based on the equation of:
where: Kp = Porod Constant Qp = Invariant θ = Volume fraction of particles Specific surface is obtained by dividing the surface to volume ratio with the apparent density. All equations are based on Heimo Schnablegger [12]. SAXS experiment were subjected to two samples namely Alumina Quantachrome Reference standard and Alumina nanofiber. The result for Alumina Quantachrome Reference standard is compared with the value given by the manufacturer but by using a different technique, BET technique. Then, the second sample, Alumina nanofiber is subjected to SAXS measurement. 2D-SAXS image of Alumina Quantachrome Reference (Figure 1) and Alumina nanofiber (Figure 2) with the same linear scaling in the q-range of 0.035nm-1 < qz < 5nm-1. Exposure time was 300s (avarage of 2 reading). 2D scattering data are reduced to 1D scattering profile by radial integration from 0° – 180°. Further analysis is performed based on 1D scattering profile as shown in (Figure 3). From Invariant (Porod and Guinier) calculation, It was found the value of Kp/Qp are 0.19 for standard Alumina Quantachrome Reference sample and 0.62 for Alumina sintered nanofiber sample. The specific surface area for both sample is calculated and given in (Table 1). The existance of nanopores are clearly visible by the excess SAXS signal in (Figures 1 & 2). Ring pattern for both sample indicates there is no preferred orientation of the nanopore within the plane of the samples.
Figure 1: 2D scattering of Alumina Quantachrome Reference sample.
Figure 2: 2D scattering of Alumina nanofiber sample.
Table 1: Specific surface area.
The intensity of alumina Quantachrome Reference standard is found much more higher than the Alumina sintered nanofiber. This reflect that many scatterer in the alumina Quantachrome Reference sample as intended from the reference material. In terms of pore size, it is found that the alumina nanofiber exhibits smaller pore size as indicated by the higher specific surface area, 399.98 m2/g. Comparing specific surface area values for alumina Quantachrome Reference material between SAXS and BET technique reveals that both values are in good agreement. SAXS gives the value of 95.58 m2/g and BET is reported to give the value of 107.5 m2/g. However, slight differences might be caused by damages to the sample during the crushing of the Quantachrome Reference sample from solid to powder form in order to mount the sample into the holder for SAXS experiment. The surface morphology of Alumina sintered nanofiber is given in (Figure 4). it is clearly seen the fibers are in the range of 100-200nm in diameter. The pore between the fibers are expected to be much more smaller than that. This will give rise to the scattering event in the sample. The applicability of SAXS technique in assessing the pore in the sample is found to be comparable to BET technique. The simple sample preparation makes the technique very attractive and is successfully shown in this work by probing Alumina sintered nanofiber.
Figure 3: 1D scattering of Alumina Quantachrome Reference and Alumina sintered nanofiber sample.
Figure 4: Alumina sintered nanofiber, short fiber with the average diameter of 100- 200 nm.
Bio-Filtration as a Solution for the Detrimental Health Effect of Excess Fluoride in Drinking Water
Introduction
One of the main importance of water filtration is to prevent water-related illnesses and diseases. To this day, various explored methods were used in the remediation of water of different types of contaminants such as flocculation [1,2], coagulation [3], solventextraction [4], co-precipitation [5], precipitation [6], ion-exchange [7], photo catalysis [8], adsorption-desorption [9], reverse-osmosis [10], nano-membrane filtration [11]. The adsorption technique is considered one of the attractive and commercial options to eliminate of the most pollutant substances whether macro- or micro- organic/inorganic ions from water, due to its simplicity of steps and high activity. Moreover, the purification of water by using adsorption technique has been applied to several matter as absorbent such as agricultural residues and industrial residues, and biomaterials wastes, which are modified and applied in biosorption of contaminants from water [7,9-12]. Fluoride is an ionic form of fluorine and can be found in food and numerous sources of drinking water. It can be also purchased as a dietary supplement [12]. Many kinds of toothpastes contain fluoride because these ions serve as an armor against tooth decay [13]. Approximately 80% of the fluoride taken orally is absorbed. Humans retain around 50% of the fluoride they consume, and most of this amount is deposited in teeth and bones (Graphical Abstracts 1 & 2). The remaining 50% is excreted in the urine.
Graphical Abstract 1: Problem statement.
Graphical Abstract 2: Solution.
However, young children can retain an especially high percentage of the consumed fluoride, because their bones and teeth absorb more fluoride than those of adults [14]. The principle and mechanism of pollutants removal by adsorption technology from different types of water based on forms layer of condensate pollutants (called adsorbate) which is migrated from aqueous solution to the surface of solid (called adsorbent) as either in the form of liquid-solid interface [11,15]. Excess fluoride is harmful to human health. Groundwater wells worldwide have been reported to contain water with fluoride concentrations exceeding the acceptable level of 1.5 mg/L. This fact was attributed to local ground stones exhibiting high percentages of fluoride in their composition [14]. Excessive fluoride consumption can lead to several health issues, such as skeletal fluorosis, a disorder marked by bone and joint pain as well as joint tenderness. The overconsumption of fluoride during the formative years of tooth enamel can also lead to dental fluorosis, which leads to tooth discoloration, and/or tooth pitting [15]. Many researchers have attempted to develop water filtration strategies to lower the levels of fluoride or metals that contaminate water [16]. Biomaterials have shown great promise in water filtration because of their environmentally favorable properties, high filtering efficiency, and low cost [17].
Charcoal, which may be manufactured from a variety of biomaterials, is one of the most commonly used bio-filters. Water contaminated with heavy metals can be treated using different processes, which include ion exchange, precipitation, reverse osmosis, catalysis, coagulation, and adsorption [18,19]. Heavy metal adsorption is dependent on the nature of the adsorbents, which can be composed of natural or man-made mate-rials including clay [10], sludge [11], industrial waste, activated carbon, and plants [12]. Bone char is an adsorbent made up of 90% calcium phosphate and 10% carbon. It can be created using one of the two methods: treatment with chemicals and physical treatment leading to carbonization of bones [20,21]. Cow bone char is com-monly used to purify water contaminated with heavy metals, as shown in (Table 1). The aim of the current study was to produce a lowcost, effective, and environmentally friendly biochar adsorbent from cow bone through physical activation (carbonization), and subsequently use it to remove fluoride from the polluted water [22]. Furthermore, it was also proposed to enhance this bio-filter by adding nanocomposites. Nanocomposites have very high surfaceto- volume ratios, which makes them ideal components for the adsorption process [23,24].
Table 1: Bone charcoal use based on the literature review.
Experiments
Cow bones were collected and processed by rinsing them several times with hot water to remove residual muscles and other joint tissues. Then the bones were allowed to dry in the open air. The dried bones were calcined in a furnace for 1 h at 400°C. The resultant charcoal adsorbent was crushed using a gate mortar and stabilized for further testing. It can be stated that the filters were produced with little to no expenses. A stock solution of CaF2 with a 100-ppm concentration of fluoride was prepared to test its adsorption in the cow bone sample. First, 1 g of charcoal was added to the 100 mL solution in a separate beaker, which was then placed in a shaker operated at room temperature and a 251 min-1 frequency for 5 h. Next, on the same day, the solution containing cow bone charcoal was filtered from impurities and charcoal leftovers using filter paper to prepare a sample for ionic chromatography (IC) [25]. IC was utilized for determining the concentrations of calcium and fluoride ions in the prepared CaF2 solution. Ion chromatographs can measure concentrations of important anions such as fluoride, chloride, nitrate, nitrite, and sulfate, as well as major cations such as lithium, sodium, ammonium, potassium, calcium, and magnesium in the parts-per-million (ppm) range. Ion chromatography can also be used to determine the concentrations of organic acid [26].
The surface structure of cow bone charcoal was studied by using a scanning electron microscope (SEM) (Model: JSM-7100F) at 10000 × magnification [27]. In conjunction with SEM, the energy dispersive X-ray (EDX) analysis technique was used to perform the elemental analysis and chemical characterization of the material. EDX utilizes an electron beam that strikes the surface of a conducting sample (placed under SEM) to determine its elemental content [28].
Results and Discussion
The SEM micrographs of the cow bone biochar explained the sample morphology by analyzing the microstructure of the bone powder, as shown in (Figure 1a). The corresponding EDX graph is presented in (Figure 1b). A close look at (Figure 1a) reveals cracks and irregular surfaces, as expected after grinding, where Vickers hardness can be determined (it is planned to be measured in the upcoming study). Furthermore, SEM micrographs showed that the studied samples had several heterogeneous porous layers, which represent a key feature relevant for fluoride adsorption. The pores appeared to be localized symmetrically in certain regions in the grooves on the surface of the bone. The sample composition revealed by EDX results was as follows: O2, 39.6 wt%; Ca, 33.9 wt%; C, 12.8 wt%; P, 12.8 wt%; Na and Mg, 0.9 wt%.
Figure 1: (a) Scanning electron microscope (SEM) micrograph of the cow bone charcoal shows several groups of symmetrically distributed pores. (b) The corresponding energy dispersive X-ray (EDX) graph of the bone constituents.
The surface morphology of the cow bone is particularly distinctive in terms of the hard appearance and the distribution of pores, which are of critical importance in filtering large species from water (Figure 2). Hence, the surface geometry and the source of adsorbent provided different types of active sites onto surface of adsorbent [29-35] (Table 2).
Figure 2: (a) SEM micrograph of cow bone charcoal shows symmetrically distributed pores on the surface (red arrows) with diameters in the range of several hundred nanometers, as shown in (b).
Table 2: The effect of bio-filtration with cow bone charcoal on fluoride removal.
Conclusion
The examined cow bone charcoal filter achieved maximal fluoride adsorption of 93.6%, which can be attributed to its porous nature. The prepared bio-filter has a very high adsorption capacity and is energy-efficient as it works at room temperature and does not require energy consumption. It means that using cow bone charcoal is a cost-effective filtration technique that should be further investigated to optimize the performance of nanocomposites and to set up measures for its widespread manufacturing.