Open access clinical and medical journal |BJSTR

Effect of Diluting Epoxy Resin with Vegetable Oils on Mechanical and Adhesive Properties of Epoxypolymer Biocomposites

Introduction

Epoxy filling has been very relevant for 60 years, and the number of profilate scientific collectives and its publications in the world is regularly growing. But it is not only filling that can adjust the properties of polyepoxides. For example, the resin can be diluted with a solvent or other liquids. This can make the final product cheaper if the diluent is cheap or available. In Ukraine, such a diluent may well be vegetable oils, namely sunflower oils, since they are produced and exported. The price of a liter of new oil is almost 10 times lower than the price of epoxy resin or hardener, and if you take used oil (for example, from food establishments that are obliged to dispose of it) or rancid oil (which is available in any warehouse in a large city) – then we can be paid extra for this according state or municipal utilization programs. So, if you prove that the properties of such diluted plastics will not be significantly worse than undiluted epoxy polymers, it will already be a success. Scientists in the world are constantly working with epoxy-oil systems [1-6]. Epoxy polymers with the addition of vegetable oils make it possible to obtain cheaper polymer materials and to dispose of used vegetable oils. They also make it possible to obtain plasticized and otherwise modified composites, which is why they are of constant scientific interest [1-6].

Methods and Reagents

For the experiment, we take Epoxy520 epoxy resin (Czech production) and PEPA hardener (Czech production). Such a resin is also sold in stores, but it is obviously already diluted, because the resins from store kits (such as “EDP Glue” and “Tiger”) are much less viscous than the one I used in the laboratory. Oil samples were collected in a syringe, from where it was quantitatively dosed into the resin and there it was subjected to intensive manual mixing. We mixed the resin with oil in different proportions to understand the maximum amount of vegetable oil (TM Golden Bouquet) that could be added without losing the properties of the epoxy resin. So, in total, we got 8 types of samples- 0% (unfilled sample), 5%,10%, 20% and 33.5% of rafined (R) or un (non-)refined (NR) sunflower oil. For each sample, 10 g of epoxy resin, 1.5 g of hardener, and 0.57, 1.15, 2.8, 5.75 g of oil were used, for 5, 10, 20, and 33.5%, respectively. That will allow me to monitor the gradual increase in the effect of the diluent (which is oil) on the resin composition.

First, the oil was mixed with epoxy resin in all the necessary proportions, later, after adding a hardener, the resulting mixture was poured into the following forms: cylinders with an area of 5 cm2, which were glued together with an epoxy mixture, cubes with a side of 1 cm, flat hexagons, cylinders with with a surface area of 0.42 cm2 and a height of 1.2 to 1.5 cm, glued, using a mixture, of steel and fiberglass plates with an area of 2 cm2, .The following were used for the experiments: electronic electronic caliper, scales, LuisShopper measuring press, ID-1 tearing machine, UMM press. A microhardness test was conducted by indentation of an ultra-hard needle. Adhesion at separation was measured on the glued with epoxy mixture, using the UMM machine (Figure 1). Carrying out measurements on the UMM machine). Shore microhardness was determined using a type D durometer used for hard plastics. Microscopy was performed on a ULAB optical laboratory microscope.

Figure 1

biomedres-openaccess-journal-bjstr

Visual Appearance and Consistency of Compositions and Composites

The introduction of oil into epoxies should lead to the formation of an emulsion, and at the level of polymerization processes, oil can have a significant effect. To evaluate the effect of oils on the composition, we choose a series of 5, 10, 20 and 33.5 wt% oils (Figure 2) (Table 1). In all cases, only highly concentrated ones with refined-oil are not completely hardened in their entirety. And the same 20P (20 wt% – a very heavy ball of oil in epoxy) and especially 33P (33.5 wt% – samples was hardened in ½ of form volume), where the oil was touched and rose above the hardened polymer. Also, such a quantity of oil no longer produces a homogeneous emulsion with epoxy resin; it disintegrates either immediately or during the curing process. However, the unrefined oil does not allow disintegration at 33 wt% – on the surface of the hardened sample there is no meniscus with the oil, and only single drops and pores with inclusions of the oil. Note that mixtures with machine oil (automotive synthetic oil) produce oil-like ointments that do not harden after mixing with amine hardener.

Figure 2

biomedres-openaccess-journal-bjstr

Table 1: Visual characteristics of compositions (15+-5 оС)..

biomedres-openaccess-journal-bjstr

Microscopy of Composition and Modeling of Possible Interactions

All unhardened mixtures were analyzed under a microscope. Can see that the introduction of unrefined oil causes the appearance of a few more streaks and (singing) droplets of oil. However, in general, the offensive type of oil will give approximately a new influx, changing the homogeneity of the system. The fragments provide visual information based on the dispersion of the oil into resins (either cloudy, dissolved in hardened composites, etc.), it is possible to create song modeling. Figure 3 can notice approximately a change in the structure of polyepoxide after dilution with olive oil. Pure epoxy resin produces a polymer that contains beads and water vapor (which is a product of the hardening reaction). In addition, there are still microcracks, fragments of epoxy resin (according to the literature [2,6-9]) and shrinkage, which can lead to their curing (under optimal curing conditions, there are few of them). The introduction of refined oil let the emerging oils of different sizes turn on, as well as a meniscus with pure (not included in polymer) oil, which will appear on the upper surface of sample (Figure 3). Such structure of the composite must will be weaker than pure epoxypolymer, and it may reduce all basic indicators (strength, durability, homogeneity). The fragments of unrefined oil have integrated entirely into the structure of the composite, so, here can reproduce the other scheme (Figure 3, left). Here there will also be inclusions of oil (both pure and mixed with water and air), but they will be only in the structure of the composite itself, and there will be no “salting” of pure oil on sample surface (Figure 3, right). Also, with such a scheme, you can experience a slight decrease in all basic indicators due to a higher percentage of dilution with oils of both types (especially refined).

Figure 3

biomedres-openaccess-journal-bjstr

Experimental Results

Adhesion

Apriority, adhesion to steel is theoretically likely to decrease after dilution, since the oleic inclusions are likely to weaken interfacial contact. The weakening must be greater the greater the percentage of dilution, so that in large quantities (20-35 wt%) the oil may act as an anti-adhesive. To be sure, we also know that a significant amount of the oil is emulsified into the surrounding fraction during the process of hardening the composition (Figures 1 & 3). However, the experiment revealed another, – stronger (more than predicted) influx of plant species. Dilution with olive oil gives a somewhat weaker effect, but not such a great one, and not for all percentages of dilution. As can be seen from Table 2, at a very high (maximal possible) concentration of 33.5 wt% of unrefined oil, the solution is more likely to be a pure polymer, and some parameters may increase!What is most noteworthy is the fact that there is an even significant increase in adhesion. Olive particles can grow no less than 1.5-2, but even more (as can be seen from the displays of 10НР, 20Р, 33НР and 33Р). It is possible that the oil will quickly integrate into the adhesive, which is more springy

Table 2: Indicators of adhesive strength of epoxy-oil composites.

biomedres-openaccess-journal-bjstr

And if you keep such a sample for several years, its value can increase even more.But the most interesting was the fact of a very significant increase in tearing adhesion (Table 2). Oil samples can increase it not only by 1.5-2 and more (this can be seen from the indicators of samples 10НР, 20Р, 33НР and 33Р). So far, it is difficult to find a scientific explanation for this, and for future, it is important to find him. Perhaps the oil is somehow embedded in the adhesive film, making it, for example, more elastic. Compressive strength. This is one of the main characteristics of polymers. Its change show – how strong is destructive effect of oil inclusions in the epoxy-oil composite. For research, unheated samples and samples after 270 oC were taken. Tests of 3-6 samples from one series were performed, after which the average value was entered into the table. Before the tests, the samples were subjected to normal processing (necessary for complete hardening) It can be seen (Table 3) that with normal heat treatment, the unfilled sample gives a value close to 700 kgf/cm2. All oil samples, indeed, give much lower indicators – (400-450), and (!) the concentration and quality of the oil does not really affect it. This can be explained by the influence of oil inclusions, as it was already described in the scheme of Figure 3.

Table 3: The strength of elastic resistance F to compression (kgf/ cm2) of samples. The index shows the strength of the final complete destruction (after the loss of elasticity and the beginning of plastic deformation). * – estimated

biomedres-openaccess-journal-bjstr

Figure 4

biomedres-openaccess-journal-bjstr

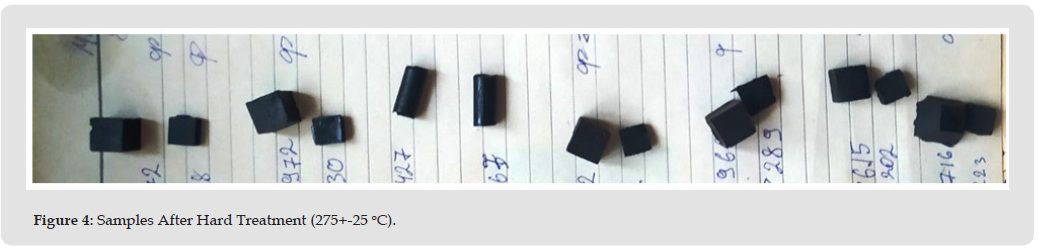
It is important that we do not have a collapse in strength, but only a decrease in ≈1,5 times. After hard heating, all the samples are carbonized (Figure 4). But unfilled sample keeps the compression strength F at the original untreated level (Table 3). Oil samples change F in different ways. For 5P (5 wt% of refined), the indicator increases even to the level of unfilled (without warming it was much lower, … kgf/cm2). Also, the 20P sample (with 20 wt% refined oil) shows a significant increase after special heating, while the 20HP practically does not change the indicator. Such interesting effects can be called “thermostrengthening” of epoxy plastics. Regarding it, there are publications on epoxy-iron , epoxy-carbide and epoxy-gypsum compositions [7-9]. But epoxy-oil composites theoretically do not have solid microparticles, heat-resistant inclusions and other that can give such strengthening. This strange fact can be explained by the fact that weak and fast-burning inclusions disappear at 275 oC, and the polymer network has not yet destroyed, and therefore we have amplification. Obviously, this can only happen at certain optimal dilution concentrations. Indeed, at 33%, and especially at 10% dilution with both oils, heating leads to a decrease in strength.

It is interesting that after standing in a strong HNO3 solution, the influence of oils becomes positive at all taken concentrations. An unfilled sample after such exposure loses its strength more than one and a half times (from 670 to 430 kgf/cm2), as well as 20 HP and some others. However, some oil samples sometimes increased it or slightly lost it. Thus, 5P reduced F from 670 to 610 kgf, and 33HP increased it by 1.5 times(from 420 to 610 kgf). Thus, there are optimal concentrations of oil, at which we have a significant increase in resistance to a strongly acidic oxidizing environment.

Microhardness

Unfilled epoxy compositions without heating give a result of 70- 85 units (Table 4). This, for comparison, is equal to the strength of the plastic used in the manufacture of industrial protective helmets. According to my expectations, the oil should have significantly reduced this indicator due to its density, but to my surprise this did not happen. За the average value of the three measurements made for each composite, it can be observed that the oil, both refined and unrefined, gave results that are within these limits, this means that the oil has no effect on the microhardness of epoxy compositions in such proportions According Table 4, the oil has stronger effect on the microhardness of epoxy compositions, that increases to 10-15%.

Table 4: Microhardness of unheated composites.

biomedres-openaccess-journal-bjstr

Conclusion

1. This work is relevant in wide industrial sectors, due to the reduction in the price of the final solidified biocompatible material. This is confirmed by a number of modern publications in the scientific literature.

2. The compositions “epoxy resin – vegetable oil” can be obtained in a fairly wide range of concentrations, up to 35% by weight of oil. Further filling carries the risk of phase separation in the mixture, and this is more likely for refined than for unrefined. It was also noticed that at medium and high contents (20-33%) unrefined oil gives visually more solid composites (yellow in color), while refined oil forms an oil layer separated from the composition on surface of the samples. Optical microscopy shows that the introduction of oil leads to the appearance of large drops-inclusions of oil in the epoxy-oil emulsion.

3. Also, it was established that all oil-diluted samples (after normal treatment at 70-80°C) show a noticeable (in ≈1.5 times) decrease in compressive strength. This decrease depends little on the concentration and refinement of the tested oil. This can be explained by the softening effect of oil inclusions. However, after severe heat treatment (275 oC) unfilled loses his strength, but some oil samples (with 5-10% refined oil) can significantly increase compressive strength, or do not change it (with 20% unrefined). Even more clearly, this effect of strengthening after aggressive influences is manifested after exposure to a strong solution of nitric acid, where the unfilled sample loses its strength by 1.5 times, and some oil samples do not lose strength much (with 5% and 33% raf. and with 10% unrefined) or significantly increase it (from 33.5% unrefined). These effects may indicate an important stabilizing role of oil inclusions during extreme actions.

4. Based on all the obtained data, the author’s model scheme of the formation of the epoxy-oil mixture is presented, as well as the possible placement of inclusions and inhomogeneities in it. It partially explains the effects of the different action of refined and unrefined oil in the composition with epoxy resin.

5. The obtained results allow us to talk about the high prospects of creating such compositions to reduce the price of epoxy materials, improve their biocompatibility, resistance to aggressive influences, and increase some important strength indicators.

6. According the obtained data, the author’s model scheme of the formation of the epoxy-oil mixture (and possible placement of inclusions and inhomogeneities in it) is presented. It partially explains the effects of the different action of refined and unrefined oil in the composition with epoxy resin.

7. The obtained results allow us to talk about the high prospects of creating such biocompositions – for reduce the price of epoxy materials, improve their biocompatibility, resistance to aggressive influences, and increase some important strength indicators.

Follow us on: Biomedical Journal Impact Factor: https://biomedres.us

https://scholar.google.com/citations?user=OFtUOZYAAAAJ&hl=en
https://www.base-search.net/Search/Results?lookfor=Biomed+Journal+of+Scientific+%26+Technical+Research&l=en&refid=dcsuggesten
https://citefactor.org/journal/2574-1241/biomedical-journal-of-scientific-technical-research
https://ideas.repec.org/s/abf/journl.html
https://econpapers.repec.org/article/abfjournl/
https://www.ncbi.nlm.nih.gov/nlmcatalog/101723284
https://bjstr.org/
https://bjstr.org/about.php
https://biomedres.us/reprints.php
https://biomedres.net/submit-manuscript.php

List of open access medical journal |BJSTR

Structural Fiber Mesh Reinforcement of a Polymeric Heart Valve: Improving Valve Durability and Leaflet Closure Effectiveness

Introduction

Valvular heart disease is an illness caused by damage to human heart valves. A human heart has four valves: the aortic, mitral (bicuspid), tricuspid, and pulmonary valves. These valves facilitate the controlled flow of blood through the heart. Thus, damage to the valves, caused by calcification, endocarditis, rheumatic disease, and congenital heart valve disease, have devastating effects on health. To treat valvular heart disease, patients must undergo valve replacement surgery, where a prosthetic heart valve is used to replace the diseased heart valve. There are two main prosthetic heart valves used today: mechanical and bioprosthetic. Mechanical heart valves are mostly made of stainless steel or titanium with leaflets of pyrolytic carbon with graphite coating [1-5]. While very resilient, mechanical heart valve replacements create high amounts of shear stress upon the blood, causing excessive coagulation, which requires patients to undergo a lifetime of therapeutic anticoagulation to reduce thrombus formation and stroke [6-8]. Meanwhile, bioprosthetic heart valves are made of bovine and porcine pericardium sewn to frames. These alternatives maintain the shape of native heart valves and are largely hem compatible, significantly lowering the risk of thrombosis and the need for anticoagulants in patients. However, bioprosthetic valves deteriorate over time because of the body’s immunological response which causes calcific degeneration upon the valve. Eventually, the patient must undergo another replacement valve within 15 years, making bioprosthetic valves non-viable for younger patients [9].

Moreover, bioprosthetic valves cannot be mass-produced, and animal pericardium is not a readily available resource, making it challenging to produce bioprosthetic valves at its demanded rate. As both mechanical heart valves and bioprosthetic valves have significant drawbacks, alternative valve replacements have gained significant interest. The principal among them are polymeric valve prostheses, which are capable of combining the mechanical durability of mechanical heart valves and the hemocompatibility of bioprosthetic valves [10-12]. Yet, polymeric valves continue to present concerns which make only a select few viable. Particularly, thrombotic complications can be provoked by changes in the hemodynamics along the valve. Indeed, the rigidity in leaflet materials and certain valve designs create high shear stresses upon the blood, leading to hemolysis, platelet activation, and ultimately thrombosis. However, modern polymeric valves have developed a tricuspid design that minimizes shear stress and damage to red blood cells, reducing thrombosis [13-15]. The properties of the polymer itself have a significant effect on thrombus formation as well. Interactions between the blood and the polymer often led to the absorption of proteins upon the surface of the leaflets due to a variety of chemical properties of each polymer. A number of these proteins (Fibrin, clotting factors) in turn stimulate platelet activation and coagulation, which commonly lead to thrombosis [16-19]. Thus, it is important that the polymers chosen have desirable chemical properties to reduce the risk of thrombosis.

Calcification, additionally, may also induce failure in unsuitable polymeric heart valves, as calcium deposits restrict leaflet mobility and lead to regurgitation and valve failure [20-22]. Some rigorous long-term in vivo tests showed that the issues such as inflammation along the valve, polymers accelerating the mineralization process, and the accumulation of blood proteins and phospholipids can accelerate the calcification process and cause even earlier valve failure. Particularly, polyurethane (PU)-based valves and expanded polytetrafluoroethylene (ePTFE) valves demonstrated issues with calcification due to calcium deposits building up in the porous structure or in cracks in the polymer to reduce flexibility [20-22]. Another main factor for polymeric valve failure is the degradation of the polymeric leaflets due to both mechanical and physiological factors. Polymers used for heart valve leaflets must possess sufficient tensile strength, flexibility, and fatigue resistance, enough to survive constant pressures of up to 1 MPa experienced by the leaflets [23,24]. To withstand these pressures, native heart valves are capable of withstanding pressures of approximately 2 MPa, which is further supported by the regenerative ability of native valves [25,26]. However, replacement valves are thought to need a significantly larger tensile strength due to their inability to recover. For example, bioprosthetic valves have tensile strengths of over 10 MPa. As a result, a large number of polymers (polyetheretherketone, etc.) are immediately unsuitable by themselves due to their inferior elasticity and strength, despite their biocompatibility.

Of similar importance, the leaflets of polymeric valves must also have sufficient fatigue and creep resistances to withstand the cumulative effect of countless loading-unloading cycles and resist deformation. Then, polymers like polyethylene are less viable alone due to their weak intermolecular bonds causing deformation over time [25,27,28]. Additionally, the physiological processes of the human body can degrade the polymer due to interactions with water, ions, proteins, and lipids in the body. These different molecules in turn lead to changes in mechanical properties in the leaflets (plasticization among others), leading to eventual failure [25,29]. Particularly, hydrolysis and oxidation create biodegradation in many polymers [30, 31]. To satisfy these various requirements for polymeric heart valve replacements, in this paper, we present a novel approach fiber-reinforced polymeric heart valve replacement, which utilizes additional structure to provide greater support. Polydimethylsiloxane (PDMS) has been observed to reduce calcification in heart valves [32]. PDMS is a polymer with well-proven, high hemocompatibility, biostability, and good elasticity, which is used today in a variety of biomedical applications ranging from aneurysm grafts to coating implantable devices and is the most frequently utilized polymer in implantation devices. Due to these qualities, using PDMS in polymeric heart valves is expected to reduce thrombus formation and calcification on the polymer’s surface, highly desirable attributes for heart valves.

Despite its superior biocompatibility, PDMS is largely regarded as a suboptimal material for polymeric heart valve leaflets due to its unfavorable mechanical qualities for a heart valve. However, PDMS has a tensile strength between 2.2 and 6.7 MPa [33], which presents concerns regarding the valve’s ability to withstand the pressure of blood flow over extended periods of time. Additionally, although PDMS is considered to have relatively decent fatigue resistance, it presented significant structural degradation under long term testing in heart valve leaflets [33]. To overcome this problem, PDMS grafting on the surface of polyurethane leaflets was recently tested, where the increased hydrophobicity of the PDMS was seen mitigating the calcification process significantly. On the other hand, imperfections in the grafting process made the graft degrade over time, leading to the same concerns with physical degradation seen in normal polyurethane valves [34]. To circumvent issues concerning grafting, this study obtains inspiration from the optimal structure of the native heart valve. In native valve leaflets, there are three primary layers: the fibrosa, spongiosa, and ventricularis layer, as shown in Figure 1a. The outermost fibrosa layer is composed of collagen fibers, which provides structural strength to the leaflet under higher stress, taking the load off the weaker spongiosa and ventricularis [35-37]. Beneath it, the spongiosa layer consists of polysaccharide compounds so that it maintains flexibility and provides additional support under lower load.

Figure 1

biomedres-openaccess-journal-bjstr

The innermost ventricularis layer consists of endothelial cells and provides the valve with its hemodynamic properties, preventing clot formation and reducing shear stress. Figure 1b shows a perspective view of the aortic heart valve leaflets mimicking the natural fiber structure. Imitating the optimal design of native valves – fiber embedded flexible matrix – can eliminate the issues with grafting PDMS. This study investigates fiber reinforced PDMS leaflets as an alternative to grafting solutions. First, we describe the fabrication process of the fiber reinforced PDMS leaflets. Then, PDMS leaflets reinforced with various fiber meshes were fabricated, and their mechanical performances were tested in vitro.

Materials and Methods

Leaflet Design

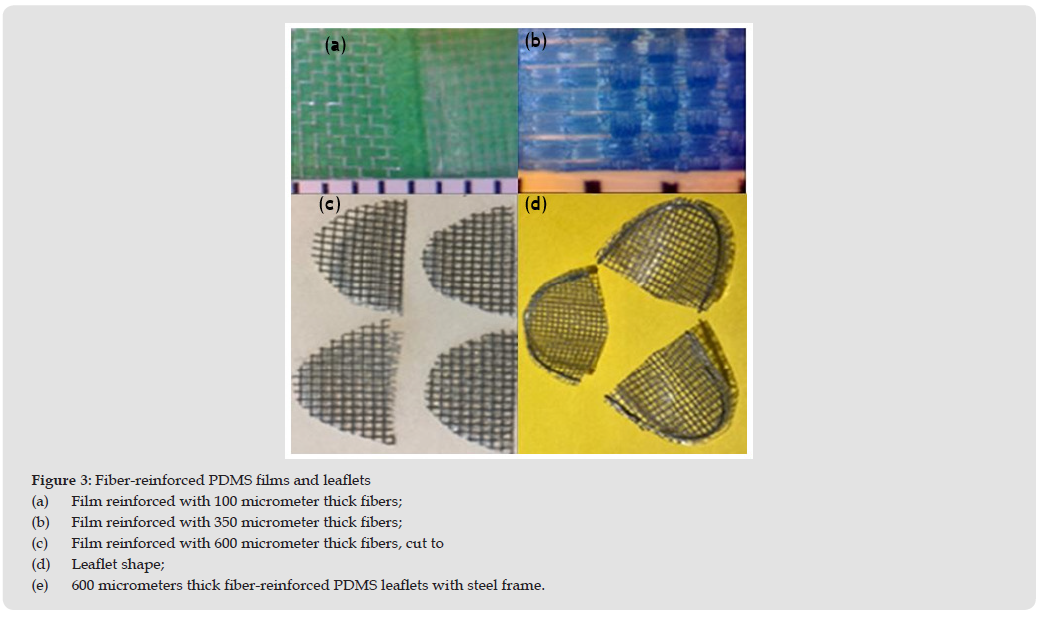
The given polymeric heart valve leaflets consist of three layers: the fiber mesh layer in between the PDMS matrix layers. The fiber mesh layer has an evenly spaced grid of nylon fiber of a specified thickness embedded within the PDMS matrix. The density of the grid is determined by the thickness of the fiber – thinner fibers have denser grids. In this study, fiber meshes of three different thicknesses were manufactured to demonstrate the customizability of the fiber mesh: 100, 350, and 600 micrometers. The heart valve proposed herein is imitating a triscupid valve, and the fiber reinforced polymeric leaflets are designed to have an elliptical semilunar shape. The semicircular edge of the leaflets were sewed onto the top part of the valve to create stability and easy attachment.

Forming the Fiber-Reinforced PDMS

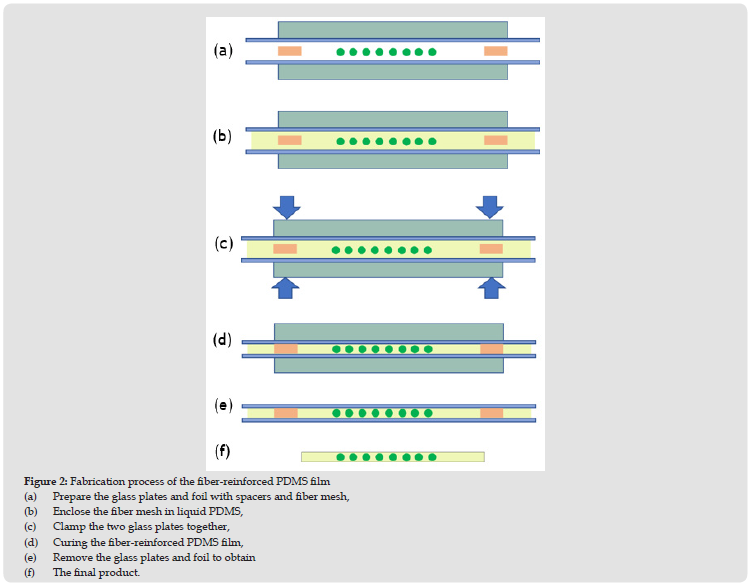
Figure 2 shows the fabrication process of the fiber reinforced polymeric leaflets. Two 4-inch by 4-inch glass plates and four spacers are prepared as mold for the leaflets. Both glass plates are covered with aluminum foil to make the removal process easier and ensure that both pieces of glass have no remaining debris. The thickness of the composite leaflet is controlled with four spacers that are placed between the two glass plates (Figure 2a).

To create the PDMS matrix, the Dow Corning Sylgard 184 silicone elastomer kit including both a silicone elastomer base and a curing agent is utilized. The ratio of the silicone base to curing agent is 10:1, and the elastomer is carefully mixed for 10 minutes. Before curing, the liquid PDMS is placed into an air vacuum to remove air pockets generated during mixing and to create uniform silicone leaflets. The prepared fiber mesh is put in a container, then a sufficient amount of the liquid PDMS is poured in the container to fully wet the fiber mesh. The wet fiber mesh is placed into the air vacuum to remove air pockets between fibers. The liquid PDMS is also poured on both glass plates to form the top and bottom matrix layers.

When the air pockets were removed, the PDMS covered fiber mesh is sandwiched between 2 glass plates as shown in Figure 2b. Then, the glass plates are clipped together (Figure 2c) so that the gap between the glass plates has the thickness of the spacer. The fiber reinforced PDMS in liquid phase is cured into a solid by heating at 135℃ for 30 minutes (Figure 2d). After the PDMS liquid has formed into a soft silicone, the fiber mesh film is left to cool to room temperature before prying away the foil and glass plate to create the elastomer (Figures 2e & 2f). In this final step of removing the glass plates and foils, caution should be taken to retain the elastomer’s form prior to manipulating the shape and structure. These leaflets are shown in Figures 3a & 3b, respectively.

Figure 2

biomedres-openaccess-journal-bjstr

Fabricating a Polymeric Valve

Using a size guide, the fiber reinforced PDMS film is cut into the shape of semicircles (Figure 3c). To make a frame for the leaflet, 8 inches of stainless-steel wire, with a diameter of 1.0 mm, is cut, straightened, and folded in a way in which the wire is parallel with itself, but one half is slightly longer than the other. The cut fiber mesh film is placed between the steel wire so that the folded portion is tightly hooked perpendicular to the arcuate edge of the semicircle. Then the wire is gently manipulated to follow the arcuate edge all the way around, leaving. 1.0 mm of space between the wire and the arcuate edge on both sides of the fiber mesh film (Figure 3d). Then a 2- inch piece of thin stainless-steel wire (0.3 mm diameter) is utilized to stitch the steel wire frame to the silicone leaflet. Similar to the thicker steel wire frame, the 0.3 mm wire is folded to where one half is a centimeter longer than the other. Then, following the guide of the thicker steel wire, the 0.3 mm thin wire is punctured through the fiber mesh film ensuring that the 2 different halves of the wire are on opposite sides of the thick wire frame. Once the 0.3 mm wire has been pulled secured, the two thin wires are twisted using pliers. The twists should be tight and about 2.0 mm long, any excess is then cut. Continue this cycle of stitching with the 0.3 mm wire 4 more times for a total of 5 stitches evenly dispersed throughout the arcuate edge of the silicone leaflet. As a final step, the thicker 1.0 mm wire, acting as the frame of the leaflet, is cut to line up with the end of the flat edge perpendicular to the arcuate edge, and the slightly longer half on the parallel side of the silicone leaflet is bent using pliers to enclose the frame-like structure.

Figure 3

biomedres-openaccess-journal-bjstr

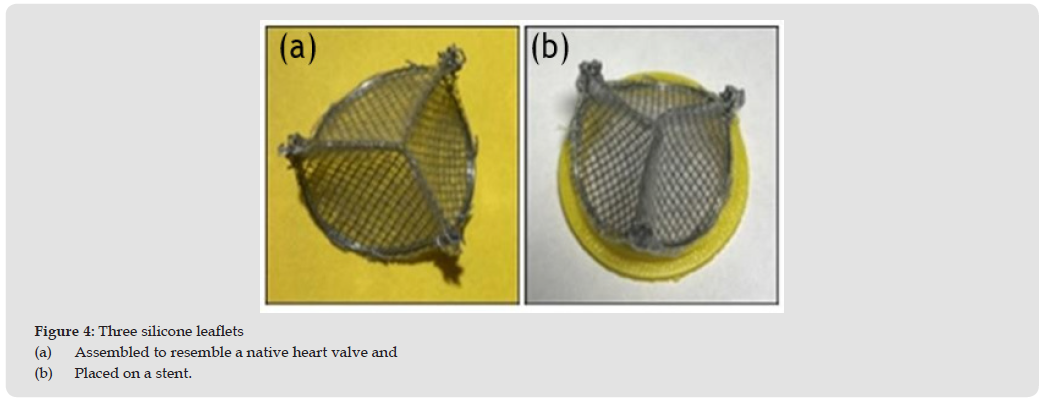
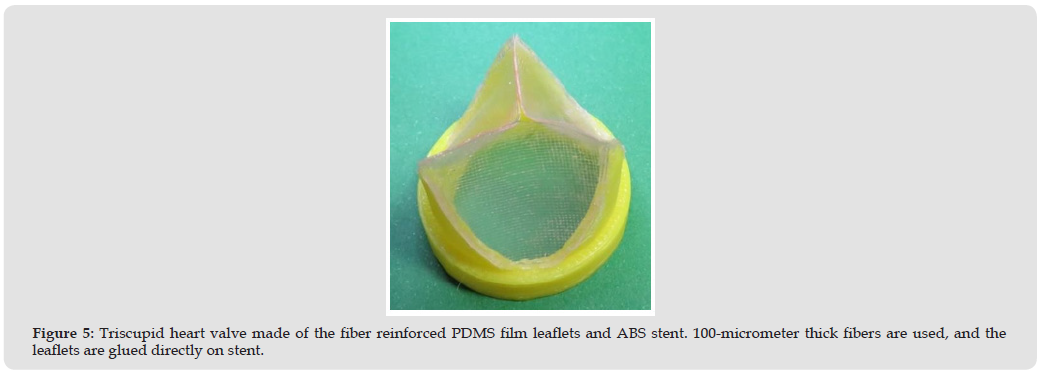
This process is repeated to create a total of three uniform leaflets all with the same wire structure, and finally the three leaflets are arranged in a form resembling a native heart valve, stitched to secure proper commissure points, placed on a short stent, and glued onto the arcuate edge of the leaflets, beginning slightly below each commissure point (Figure 4). Alternatively, the fiber reinforced PDMS leaflets may also forgo the use of stainless wire for stability altogether and, instead, use a slightly taller stent. In this configuration, after the artificial leaflets with PDMS and fiber mesh are created, the leaflets’ arcuate edge is immediately glued to the altered stent to simplify the manufacturing process (Figure 5). The commissure points are formed at the corners of each leaflet as in the other manufacturing process; however, the leaflets will be glued together instead of sewn together with wire. Additionally, the leaflets may also be sewn to the stent instead. The stent is made of acrylonitrile butadiene styrene (ABS) and fabricated using a 3-D printer.

Figure 4

biomedres-openaccess-journal-bjstr

Figure 5

biomedres-openaccess-journal-bjstr

Experimental Set-Up

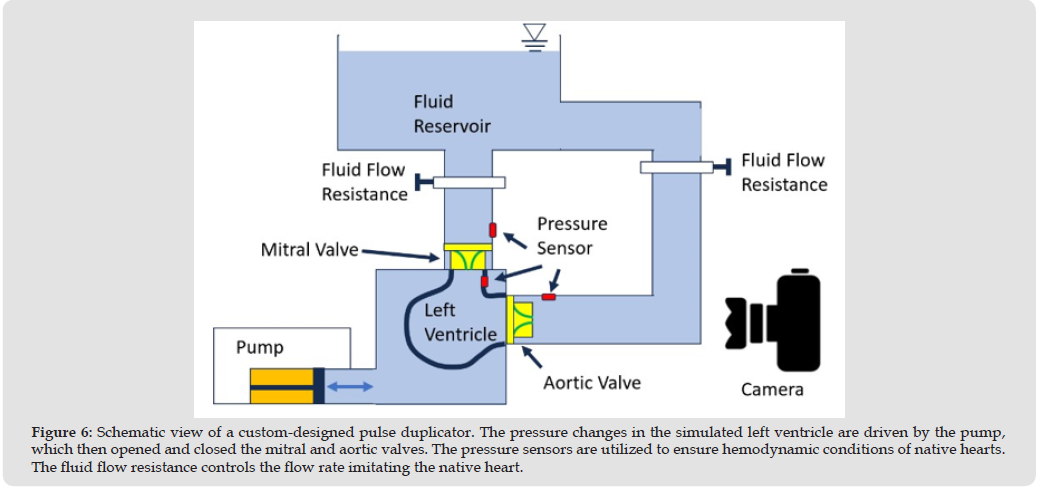
The hemodynamic performance of the fiber-reinforced polymeric heart valve created using the fabrication method was tested in vitro to verify its performance in a pulse duplicator. Figure 6 shows the conceptual view of our custom-designed pulse duplicator. For testing, two heart valves with 100-micrometer thick fiber-reinforced leaflets glued directly onto the stent without a metal wire structure (Figure 5) were placed onto the pulse duplicator simulating a mitral valve and an aortic valve. The pulse duplicator was then set to imitate the hemodynamic conditions of the native heart valve with a forward pressure of 100 mmHg across the valves, created by the pump. The fluid flow resistors maintain an average flow rate of approximately 5 liters per minute.

Figure 6

biomedres-openaccess-journal-bjstr

Results

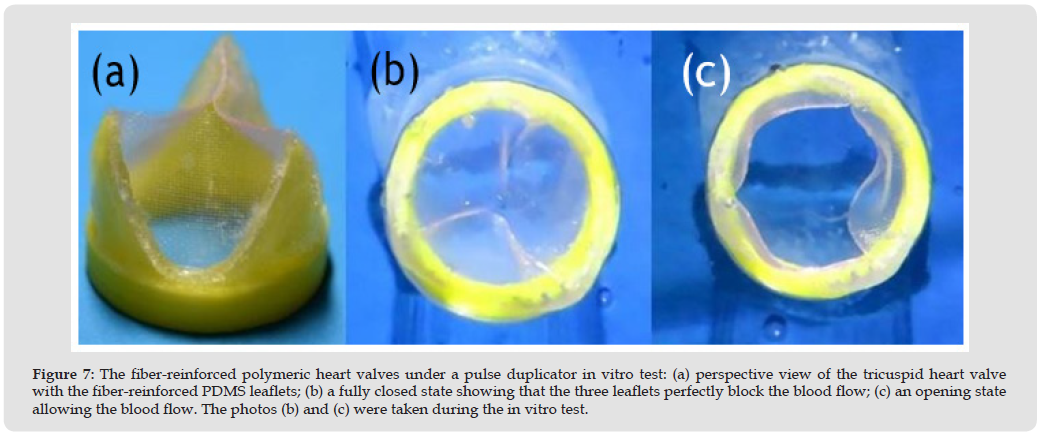
In the in vitro pulse duplicator test simulating blood flow in hearts, the fiber reinforced PDMS valves demonstrated promising hemodynamic behavior. Both valves demonstrated sufficient leaflet functionality: the valves opened and closed properly without any issue and responded quickly to changes in pressure caused by the pump. The valves appeared to be stable and entirely functional over repeated cycles with full opening and closing each cycle, indicating that the insertion of a fiber mesh layer does not significantly hinder the flow rate or cause regurgitation. Furthermore, the possible viability for long-term use is indicated. The valve leaflets did not undergo plastic deformation and maintained their physical properties after the tests, which demonstrate that the suggested fiber reinforced PDMS leaflets are capable of withstanding the mechanical conditions of the heart. Among the leaflets reinforced with three different fiber thicknesses, the leaflet reinforced with 100- micrometer thick nylon-mesh showed the best functionality during the opening and closing cycles as shown in Figure 7. Therefore, the leaflet reinforced with 100-micrometer thick nylon-mesh can be used for heart valve replacements without concerns regarding effective orifice area and regurgitation and with hopes of long-term structural integrity.

Figure 7

biomedres-openaccess-journal-bjstr

Discussion

A sufficiently high strength is one of the essential requirements of successful polymeric heart valve to maintain the functionality of the leaflet under high-pressure conditions. As aforementioned in Figure 1b, in native heart valves, the high strength is accomplished by circumferential collagen fibers in the leaflet. In the polymeric heart valve proposed herein, the fiber mesh placed within the PDMS matrix plays the role of the circumferential fibers of the native heart valve. The strength of nylon is 85 MPa while that of PDMS is 3-5 MPa, and the insufficient strength of PDMS can be complemented by the nylon reinforcement. The composite strength can be adjusted by changing the density of fibers in the cross section. The fibers reinforcement can prevent the surrounding PDMS matrix from excessive strain, and correspondingly, the normally weak PDMS leaflet’s fatigue resistance increases and, structural damage of the PDMS matrix is prevented. Thus, by adding this additional layer of support to the leaflet, the mechanical properties of the PDMS layer are favorably altered to allow for use in heart valve leaflets. On the other hand, a successful heart valve leaflet should have the ability to stretch under relatively low strain conditions within the heart. Within native valves, the low Young’s modulus (0.3–1 MPa) and high ductility (strain of 150%) of the elastin in the ventriculitis layer provides high flexibility, allowing the valve to open and close easily in normal condition [38]. In terms of flexibility and ductility, PDMS is a perfect material mimicking the behavior of natural heart valve leaflets because PDMS has similar Young’s modulus (0.36–0.87 MPa) [33] and ductility (~140%) [39].

Although the Young’s modulus of nylon fiber is very high (0.5-3 GPa), the effect of the fiber mesh on the flexibility can be eliminated by aligning the fiber mesh in diagonal direction to the circumferential direction (the direction of maximum strain) of leaflets. The collagen fibers in natural heart valve leaflets also have diagonal alignment as shown in Figure 1b. Under low-pressure conditions, the flexibility of leaflets is a critical factor for the functionality of heart valves [40]. The fiber reinforced PDMS leaflets are highly customizable due to the fabrication method. The mechanical behavior and the life of the proposed leaflets can be engineered by adjusting the type, grid density, thickness, and direction of the fibers. These possible modifications also ensure the ability to further optimize the current design in future iterations. The thickness of the PDMS matrix is also customizable, allowing for fine- tuning of the valve’s mechanical behavior. Furthermore, the simple customizability of each leaflet allows for a variety of possibilities in optimizing the leaflets’ mechanical integrity and hemodynamic interactions by changing the mechanical properties of each leaflet. To provide additional structural stability to the leaflets, the fabrication process of the proposed valve utilizes a metal support wire along the arcuate edge of the leaflets. This added structure is expected to significantly improve the structural integrity of the leaflet along the edge attached to the stent by glue. More significantly, the stiffer support wire allows for much simpler attachment between the leaflet and valve stent, as the arcuate edge is stiffer and easier to maneuver, reducing the risk of manufacturing errors.

This wire- framed fabrication allows the fiber-reinforced polymeric heart valve to be clampable on a catheter and can be used for Transcatheter Aortic Valve Replacement (TAVR) [41,42]. Although TAVR is one of leading medical procedures in this field, this article is focused on the fabrication of the fiber-reinforced polymeric leaflets assuming regular heart valve replacements. However, it should be noted that the fiber-reinforced polymeric heart valve has potential for being optimized for TAVR through future work. An additional benefit of using PDMS for heart valve leaflets is the hydrophobicity of PDMS. The hydrophobic leaflet surface decreases the shear stress caused by the blood flow through the heart valve and eventually reduces the thrombogenicity of the valve. This then removes the necessity for the prescription of anticoagulants for patients. Moreover, the superior biocompatibility of PDMS, which only causes minimal inflammation for a short period after insertion, significantly reduces the amount of calcification occurring on the leaflets by reducing the body’s immune response to the foreign polymer, and eventually increases the valve’s longevity and structural integrity compared to other biomechanical valves. Also, the increased fatigue resistance, achieved by the fiber-reinforcement, reduces long term structural valve degradation, and increases the life of the valve.

Conclusion

An artificial heart valve made of fiber reinforced PDMS leaflets that has advantages over conventional mechanical and bioprosthetic valves is suggested, and its fabrication process is proposed. The hemodynamic performance of the fabricated composite valves with fiber reinforced PDMS leaflets were successfully validated through short-term in vitro tests under cyclic flow generated by a pulse duplicator. PDMS has excellent hemocompatibility and biocompatibility but is not a favorable polymer for heart valve leaflets because of its weak strength. However, the shortcoming of PDMS can be eliminated by embedding the fiber mesh reinforcement layer that is inspired by the collagen fibers of natural heart valves. The suggested leaflet fabrication process is simple and has potential to be customized through selection of fiber, grid density, and fiber alignment. Thus, customizability of the valve leaflets allows for the optimization of the given design and thus shows great promise. The mechanical durability of the fiber reinforced PDMS valve is expected to be superior due to the reduced stress in PDMS matrix. For further investigations, interactions between the valve and blood, particularly regarding calcification and thrombus formation, are suggested as a follow-up test with a long-term experimental setup. While the PDMS matrix is expected to reduce calcification, it needs to be confirmed whether certain protein interactions along its surface may induce undesirable calcification.

Furthermore, the effects of various modification factors such as fiber type, direction, mesh density, leaflet thickness, and wireframe on the mechanical behavior need to be investigated for the optimization and TAVR application of the fiber reinforced PDMS. In conclusion, the optimistic results of the in vitro pilot tests for the proposed design shows that the proposed fiber-reinforced PDMS valve is promising in the context of finding a biocompatible, durable, and cost- efficient alternative to the current mechanical and bioprosthetic valves and opens many exciting avenues for further research.

Acknowledgements

This work was conducted with the support of the University of Texas Rio Grande Valley.

Follow us on: Biomedical Journal Impact Factor: https://biomedres.us

https://scholar.google.com/citations?user=OFtUOZYAAAAJ&hl=en
https://www.base-search.net/Search/Results?lookfor=Biomed+Journal+of+Scientific+%26+Technical+Research&l=en&refid=dcsuggesten
https://citefactor.org/journal/2574-1241/biomedical-journal-of-scientific-technical-research
https://ideas.repec.org/s/abf/journl.html
https://econpapers.repec.org/article/abfjournl/
https://www.ncbi.nlm.nih.gov/nlmcatalog/101723284
https://bjstr.org/
https://bjstr.org/about.php
https://biomedres.us/reprints.php
https://biomedres.net/submit-manuscript.php

Journals on Medical Informatics |BJSTR

Drug use Evaluation on Magnesium Sulfate use in Obstetrics Wards: the Case of Ras Desta Damtew Memorial Hospital 2023 GC

Introduction

Background

Hypertension is a common medical problem that complicates pregnancy. It may be, manifested as chronic hypertension, chronic hypertension with super imposed preeclampsia, Pregnancy induced hypertension, preeclampsia or eclampsia. Hypertensive disorders in pregnancy can be manifested by increased blood pressure(BP) greater than or equal to 140/90 mmHg during pregnancy. Measured four hours apart and after 20 week of gestational age. The presence of the other clinical symptoms and signs of hypertension in pregnancy depends on the severity of the disease. Pre-eclampsia (PE)is part of pregnancy induced hypertension(PIH) which is defined as a BP > 140/90mmHg in the presence of significant proteinuria of greater than 300 mg per 24 hours urine Specimen or, less accurately, more than 1+ protein (equivalent to Approximately 100mg/dl) on dipstick in at least two randomly collected Urine specimen at least 6 hours apart after the 20th week of gestation or up to 6 weeks postpartum. Preeclampsia with severity features (Sever Preeclampsia) is the presence of Diastolic BP > 110 mmHg and the systolic BP ≥160mmHg measured twice at least six hours apart or a single measurement of >120mmHg, Hyperbilirubinemia, Hemolytic anemia, Thrombocytopenia (Less than 100,000/μL), Elevated Liver Enzymes (HELLP syndrome), Disseminated Intravascular Coagulation (DIC), Headache, visual disturbance and right upper abdominal pain, Oliguria ( less than 400ml in 24hours or 30ml/hour), Cardiac decompensation, pulmonary edema, cyanosis, Exaggerated Deep Tendon Reflexes (DTR).

Eclampsia is the occurrence of convulsions in woman who meets the diagnostic criteria for pre-eclampsia. Any convulsion occurring during pregnancy is eclampsia unless Proven otherwise. Anti-convulsants such as Magnesium Sulphate (MgSO4), as well as antihypertensive medication, are rarely required for patients on conservative management (mild preeclampsia). Delivery is the definitive treatment for mother with sever preeclampsia. The primary objective is to prevent convulsion, intracranial bleeding and other vital organ damage. MgSO4 is one of the main interventions used to decrease the morbidity and mortality from preeclampsia/eclampsia. In 2011, MgSO4 has been strongly suggested by the World Health Organization (WHO) to be the drug of choice for both treatment and prevention of eclampsia. Ethiopian Food and Drug Authority also recommends this; loading dose of 4gm as 20% solution IV over 10-15 minutes followed by 10gm as 50% IM injection divided on two sides of the buttock, followed by maintenance dose of 5gm every 4 hours as 50% concentration over 2minutes, 2gm IV as 50% solution over 2minutes if convulsion recurs. And, reduce the maintenance dose by half if there are signs of renal impairment during labor and for the first 24 hours postpartum. Adverse Drug Effects associated with the use of MgSO4 can be Respiratory Paralysis, pulmonary edema, depressed tendon reflexes, hypotension and hypocalcaemia. Therefore, renal function, BP, respiratory rate(RR), and DTR should be monitored when MgSO4 is administered parenterally. Hypersensitivity, myocardial damage, diabetic coma, hypermagnesemia, hypercalcemia, and administration during 2 hours preceding delivery for mothers with toxemia of pregnancy. In patients with renal impairment it has to be ensured that renal excretory capacity is not exceeded by halving the recommended dose.

Significance of the Study

The findings from this study could fill the gap in the obstetric use of MgSO4 in the management of PE/E. This would identify problems in MgSO4 use and suggest for further studies by researchers and healthcare facilities.

Methodology

Study Area and Study Period

The study was conducted in Obstetrics wards of Ras Desta Damtew Memorial Hospital (RDDMH) from october 1 2022 to september 30,2023 G.C. The hospital was established in 1924 E.C. RDDMH is located in Addis Ababa, Ethiopia. It has Medical, Surgical, Obstetrics and Gynecology, and Pediatrics services. In addition, there are ENT, Dental, Ophthalmology, ART, TB treatment and follow up services.

Study Design

A retrospective cross-sectional study design was used.

Study Population

All patients who received MgSO4 for the management of PE/E. Sampling Technique and Sample Size Determination Purposive sampling technique was used and 240 patient charts were collected, organized and sorted based on their MRN and according to WHO recommended sample size (75-100) for performing hospital DUE,100 charts were selected by systematic random sampling technique. From the 100 charts, 13 were excluded because there was no documentation of MgSO4.

Data Collection Procedures

Before commencing to data collection permission was received from the hospital Drug and Therapeutic Committee (DTC). Data was collected by two DUE trained personnel. The tool was adopted from Ethiopian National Medicine Use Study Guideline, 2021. And customized to our study objective. Data was directly filled on to MS-Excel data base.

Data Processing and Analysis

Data cleaning was performed after which it was imported to IBM SPSS Statistics Version 21.

Limitation of the Study

The limitation of the study was that it did not address the frequency of MgSO4 administration and control of seizure frequency. And it did not address the consumption of MgSO4 vials.

Results

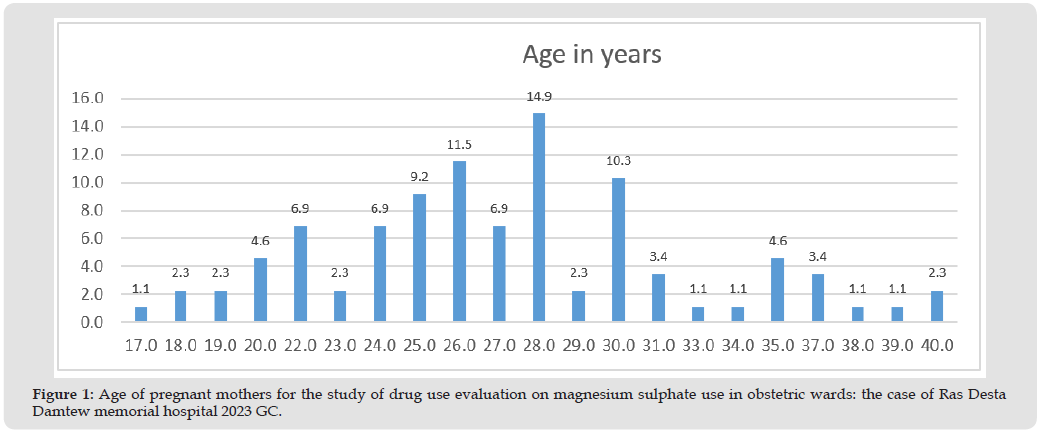
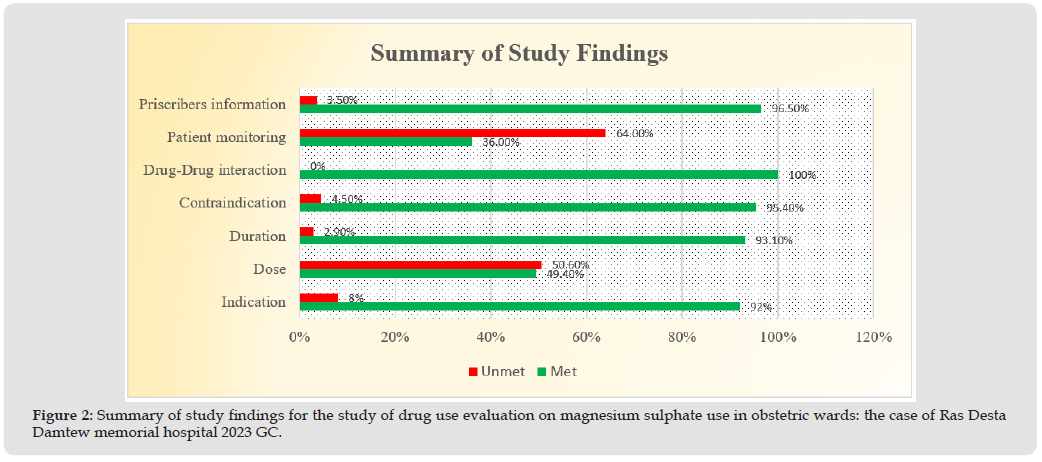
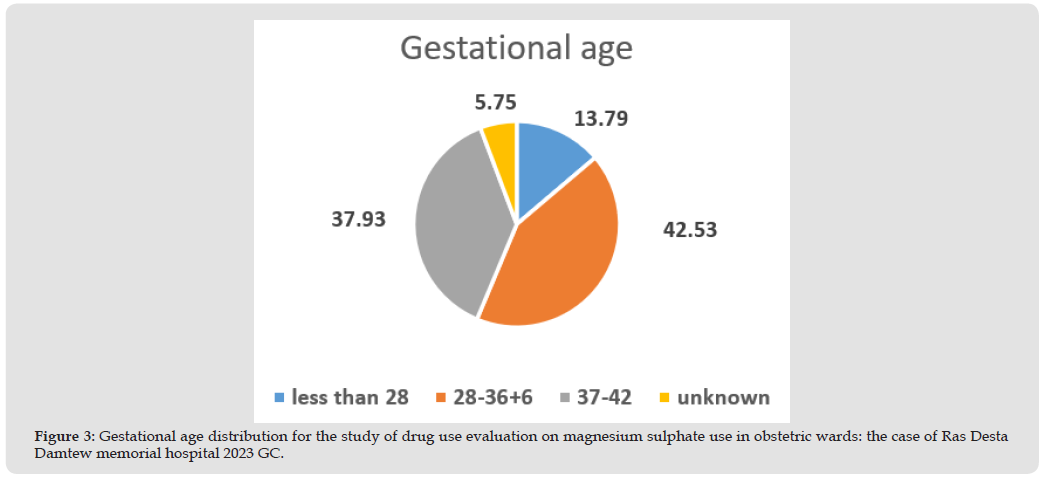
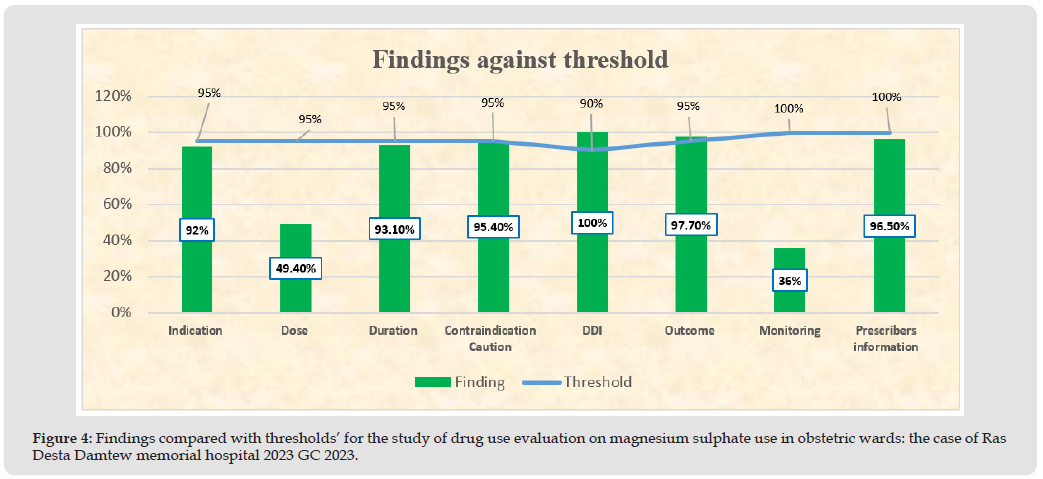
As shown in Figure 1, From 87 patient chart reviewed the minimum age of mothers was 17 and the maximum age was 40 years with median age of 27 years. And 26.5% of the mothers were within the range of 15-24 years of age, the majority of mothers were within the range of 25-34 years of age (61%) and the remaining 12.5% of mothers were within the range of 35-40 years of age. From the total charts reviewed only 16.1% of the charts had a documentation of the mothers’ weight. When the pregnancies are classified based on gestational age; 13.8% were less than 28 weeks, 42.5% were in the range of 28- 37 weeks of gestation, 37.9% were in the range of 37-42 weeks, and there were no pregnancies above 42 weeks of gestation. And 5.7% of the pregnancies were of unknown gestational age by date or estimation. 41.4% of the mothers in this study were primigravida while the rest 58.6% were multigravida. From the total charts reviewed 5.7% of the mothers had previous history of pre-eclampsia/eclampsia and 1.1% had concomitant disease which was Gestational Diabetes. The diagnosis of mothers in the study period were categorized in as mild pre-eclampsia, sever pre-eclampsia and eclampsia which were 9.2%, 83.9% and 6.9% respectively. There was no mother who developed eclampsia after admission. 80(92%) of the mothers had an indication. (5.7%) mothers were assessed to have pulmonary edema and all of them were given Furosemide injection. As shown in figure 2 below, 21 (24.1%) of the mothers were Nifedipine co-administered with MgSO4 from which none of them had developed a drug-drug interaction (Figures 3 & 4).

Figure 1

biomedres-openaccess-journal-bjstr

Figure 2

biomedres-openaccess-journal-bjstr

Figure 3

biomedres-openaccess-journal-bjstr

Figure 4

biomedres-openaccess-journal-bjstr

This was assessed by BP monitoring of the patients obtained from the pre-eclampsia/eclampsia monitoring chart. There were 4(4.6%) patient with renal impairment were being administered MgSO4. There was no record of adverse drug reaction/toxicity developed due to MgSO4. It was found that 49.4% of mothers had a documented dose of MgSO4 as per STG. From the total 87 mothers 81(93.1%) of them were given MgSO4 with the STG recommended duration (24-48hrs). Urine output and DTR were monitored for 82(94.3%) and 37(42.5%) patients respectively. While Respiratory rate was monitored for all mothers. 85(97.7%) of the mothers were improved while 2(2.3%) got worsened and referred to a tertiary hospital.The assessment of Prescriber’s information showed that prescribers full name and qualification were written in 86(98.9) and 85(97.7%) respectively. While signature and date of prescribing were recorded in all of the charts.

Discussion

Being pregnant at age 35 or more is one of the highest risks of developing PE/E. A study done at Omdurman Maternity Hospital at Sudan showed the 25–34 years of age was the largest age group of women with preeclampsia/eclampsia. Our study result also showed that mothers between age 25-34 were the largest group of women with PE/E which is 60.7% (Alsiddig Y, et al. [1]). Body weight is strongly correlated with progressively increased PE risk, ranging from 4.3% from women with body mass index(BMI) below 20 kg/m2 to 13.3% in those with a BMI over 35 kg/m2 (Knight et.al, 2010). In our study the weight of mother was recorded only for 16.1%. This shows that there is a gap in the identification of risk factors for Preeclampsia by healthcare providers during ANC [2]. The study finding revealed that only 5 of the mothers had previous history of PE/E which can be the risk factor for developing recurrent PE/E and on which magnesium sulphate can be administered as a preventive therapy and all of those mothers were given MgSO4. From the findings of the study it can be concluded that most of the mothers were diagnosed with severe PE (83.9), while only some of them were diagnosed with mild PE and E (9.2% and 6.9% respectively). From the total mothers 80 (92%) were found to have appropriate indication for MgSO4. This finding is below our set threshold which was 95%. So 7 mothers took MgSO4 without indication, this includes those who were given MgSO4 for mild PE which is not recommended and also it can be due to patients who were given MgSO4 who did not fulfil the criteria for preventive therapy of PE/E [3].

Only 49.4% of the mothers took appropriate dose of MgSO4 as recommended by the STG which is much deviated from the set threshold 95%. This does not mean that those mothers did not take the recommended dose because this study did not assess that, but on the patient charts physicians did not record the recommended dose correctly on the order sheet. They just order it ‘as per protocol’ which is not correct. Even if the dosing protocol is found in the obstetric wards of the hospital, it is mandatory to write the loading and maintenance of MgSO4. This was a great obstacle which made it difficult for us to know the exact quantity of MgSO4 the patient took. Only 4(4.6%) of the mothers had renal impairment while 83 (95.4%) of them did not have renal impairment. This result is above the set criteria for contraindication of MgSO4 administration which was 95%. MgSO4 contraindication in pregnant mother not an absolute contraindication.

There needs to be dose reduction by half. It was written on the order sheet as ‘reduce the recommended dose by half’ but we did not find the exact dose administered on the medication sheet. The drug-drug interaction between MgSO4 and Nifedipine is moderate (not significant). When Nifedipine is given with MgSO4 has a synergistic physiologic effect which is hypotension which needs close monitoring of BP. The result of the study showed that 21 (24.1%) of the mothers were Nifedipine co-administered with MgSO4 [4]. They were assessed for reduced BP, from which none of them developed a drug-drug interaction. so the result is 100% which is greater than the set threshold which was 90%.

The outcome of treatment showed that 85 (97.7%) of the mothers were discharged improved. While only 2(2.3%) mothers got worsened and refereed to tertiary hospital. This finding is above the set threshold which was 95%. This result shows that MgSO4 is an effective choice of medication for the control of seizures in PE/E. Urine output and DTR were monitored for 82(94.3%) and 37(42.5%) patients respectively. While Respiratory rate was monitored for all mothers. On this study we found that a significant drawback exists in the monitoring of patients taking MgSO4. Mothers monitored for all the three parameters were 36(41.4%) which is below the set 100% threshold. The assessment of Prescriber’s information showed that prescribers full name and qualification were written in 86(98.9%) and 85(97.7%) respectively. While signature and date of prescribing were recorded in all of the charts [5]. Orders with all the four parameters recorded were 96.5% which is below the set 100% threshold.

Conclusion and Recommendation

• The study findings revealed that documentation of mother’s weight was poor; where weight(BMI) increment is a significant risk factor for PE/E. there for we strongly recommend the measurement of pre pregnancy or first ANC weight (BMI) [6].
• Indications for MgSO4 administration was found appropriate for most of the mothers, but there were mothers found taking MgSO4 against STG recommendations. However, it is ultimately the decision of the attending healthcare providers to start MgSO4.
• The dose of MgSO4 was not recorded correctly on order sheets, so we recommend physicians to write the full recommended loading and maintenance dose and also we recommend nurses to record each administered doses of MgSO4 including the route.
• Overall the correct dose of MgSO4 is not recorded obstetric order sheets [7].
• It is recommended that the duration of MgSO4 to be 24-48 hours as per STG. We found some gaps only on some mothers who were given MgSO4 below and above this duration, so it may be due to documentation gap, mothers response to treatment or duration of seizures. We strongly recommend for a complete documentation of MgSO4 duration of administration.
• Since there is a gap in monitoring of patients and recording on PE/E follow up chart. We strongly recommend the maternity ward staff to monitor and record Urine output, DTR and RR [8]. • Prescribers name, qualification, signature and date of prescription must be written on all orders.
• We found that charts in the gynecology/obstetrics ward are disorganized which made it difficult for us to find the exact data we wanted. But now since electronic medical recording is started it may fill this gap [9].

Acknowledgement

We would like to thank our hospital DTC, Research and Training Department for the technical assistance and decisions passed on ethical procedures. We thank the Obstetrics and Gynecology Department, and Medical Record Room for their great cooperation in providing assistance and retrieval of patient charts. Our deepest gratitude also goes to Federal Ministry of Health of Ethiopia and World Health Organization for organizing the orientation and providing of the tools, technical assistance in data analysis and preparation of the final document.

Follow us on: Biomedical Journal Impact Factor: https://biomedres.us

https://scholar.google.com/citations?user=OFtUOZYAAAAJ&hl=en
https://www.base-search.net/Search/Results?lookfor=Biomed+Journal+of+Scientific+%26+Technical+Research&l=en&refid=dcsuggesten
https://citefactor.org/journal/2574-1241/biomedical-journal-of-scientific-technical-research
https://ideas.repec.org/s/abf/journl.html
https://econpapers.repec.org/article/abfjournl/
https://www.ncbi.nlm.nih.gov/nlmcatalog/101723284
https://bjstr.org/
https://bjstr.org/about.php
https://biomedres.us/reprints.php
https://biomedres.net/submit-manuscript.php

Journals on Medical Microbiology |BJSTR

Boerhavia Diffusa Linn: Unravelling the Medicinal Tapestry from Ayurvedic Traditions to Modern Science

Introduction

The Nyctaginaceae family of medicinal plants, Boerhavia diffusa Linn., is well-known in Indian traditional medicine for its therapeutic qualities. It is also acknowledged in other areas of the world and in certain countries of South America. In the context of Indian traditional medicine, it goes by several names such as Punarnava, Shothaghni, Kathillaka, Varshabhu, Raktapushpa and Varshaketu [1]. Within the context of Indian Ayurveda, Boerhavia diffusa is designated as a “rasayana” herb, believed to possess diverse qualities including anti-aging effects, enhancement of life and memory power, and disease prevention. These attributes suggest that the herb fortifies the body’s resilience against external threats, essentially offering hepatoprotection and immunomodulation [2]. In specific areas, the entire plant serves as a vegetable. For instance, in regions like Assam and West Bengal in India, local communities cook the leaves as a culinary delicacy [3]. Different types of the Boerhaavia genus can be located across tropical, subtropical, and temperate regions worldwide, spanning Australia, Asia, the United States, and Africa. Within the Indian subcontinent, B. diffusa is prevalent in warmer regions of the country, reaching altitudes of up to 2000 m in the Himalayan region [4]. Six of the forty species in this genus—B. diffusa, B. erecta, B. rependa, and B. rubicunda— can be identified in the Indian subcontinent. In particular, B. diffusa has been the subject of a great deal of research because of its chemical makeup and medicinal qualities.

The roots of B. diffusa are the source of a distinct group of isoflavonoids known as rotenoids, along with flavonoids, xanthones, purine nucleosides, lignans, and steroids. Numerous studies and trials have confirmed its diverse activities, including immunomodulation, anticancer effects, antidiabetic properties, antioxidants, and anti- inflammatory attributes. During diverse studies conducted on the B. diffusa plant, preliminary examinations have detected the existence of β-sitosterol [5], and alkaloids [6]. The root of this plant has been traditionally used by several tribes to alleviate liver disorders. Specifically in South Garhwal, the tribal community has applied the roots for the treatment of various diseases such as liver enlargment [7]. Moreover, tribes have been using the plant’s roots of ‘Punarnava’ (Boerhavia diffusa) to treat jaundice in the eastern parts of Rajasthan and Gujarat state [8,9]. Besides, B. diffusa roots are recommended in some parts of Madhya Pradesh to treat kidney and liver problems [10]. This review offers a condensed overview of the bioactive components and documented pharmacological effects, presenting an ethnopharmacological evaluation of the said plant.

Geographical Distribution

The Boerhavia genus, consisting of 40 species, is distributed across tropical, subtropical, and temperate zones worldwide. Boerhavia diffusa, or B. diffusa, is a plant that was originally native to Brazil and India but is now found in tropical, subtropical, and temperate countries with elevations of up to 1200 metres above sea level. It is found in many places, such as Mexico, Asia, Africa, the Indian and Pacific oceans, Egypt, and Sudan [11,12]. In India, six out of the 40 species within this genus can be found, namely B. diffusa, Boerhavia chinensis, Boerhavia erecta, Boerhavia repanda, and Boerhavia rubicunda. B. diffusa, specifically, is indigenous to India and flourishes in wastelands and fields after the rainy season. Furthermore, there is a limited cultivation of this plant in West Bengal [13].

Traditional Uses

As noted earlier, B. diffusa holds significant importance as a primary herbal ingredient in a variety of Ayurvedic medicinal formulations. Its incorporation in different preparations is effective in managing conditions like inflammation, jaundice, asthma, nephrological disorders, anaemia, and gynaecological issues. Table 1 categorizes several traditional formulations where B. diffusa plays a central role as a key component [14].

Table 1: Traditional formulations containing B. diffusa act as a major ingredient.

biomedres-openaccess-journal-bjstr

Phytochemistry

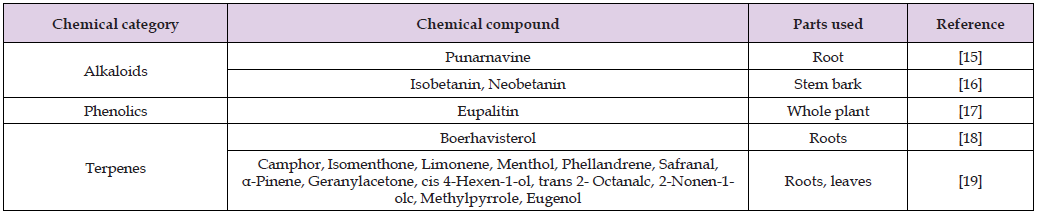
Several studies on Boerhavia diffusa species have revealed a variety of important phytochemicals across different regions, taking into account ethnopharmacological applications and advancements in technologies like mass spectroscopy, liquid chromatography-mass spectroscopy (LC-MS), Electrospray ionisation mass spectrometry (ESI-MS) etc. These investigations have unveiled significant phytochemicals in various parts of Boerhavia species, as detailed in Table 2. The conventional method for isolating compounds typically includes extraction, partitioning in different solvents, and bioactivity- guided fractionation using silica gel chromatography [15-21].

Table 2: List of chemical compounds isolated from Boerhavia diffusa.

biomedres-openaccess-journal-bjstr

Pharmacological Activities in Boerhavia diffusa Linn

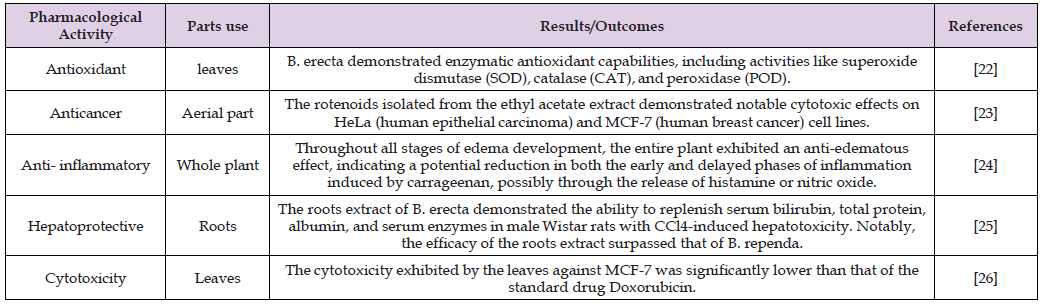
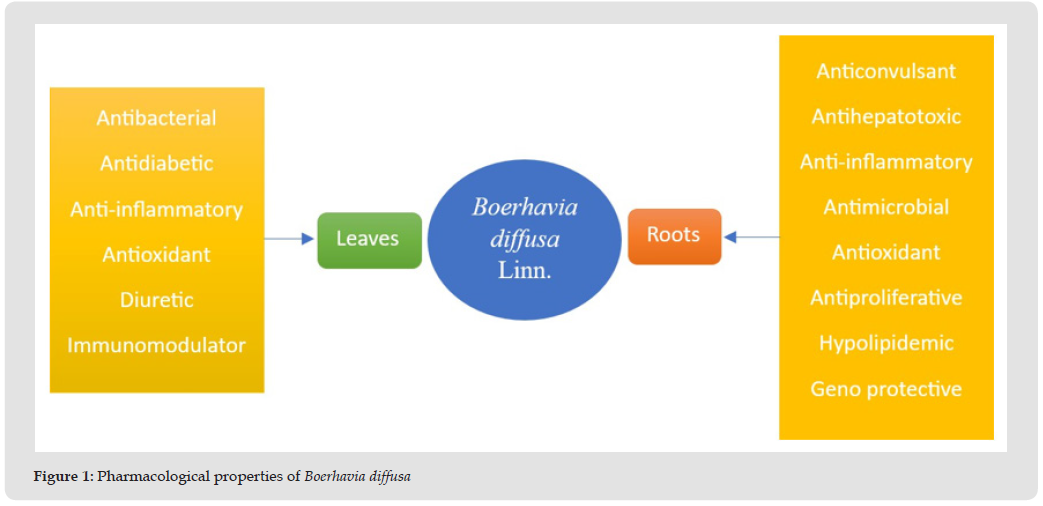
The plant Boerhavia diffusa has become significantly important in the field of phytochemistry due to its diverse pharmacological and biological activities. Various parts of B. diffusa are used in different parts of India to cure a variety of ailments. The whole plant, aerial parts, leaves, or root of B. diffusa are used in Ayurvedic herbal medicine for treating a range of medical conditions. Various pharmacological studies have shown that the plant roots of B. diffusa possess a broad spectrum of properties, including anti-inflammatory, diuretic, anticonvulsant, antifibrinolytic, antibacterial, anthelmintic, antileprotic, antiasthmatic and antistress activities (Figure 1). Table 3 compiles the available information on Boerhavia diffusa species from recent data published in the last 5-6 years [22-26].

Table 3: Various pharmacological activities and parts used of Boerhavia diffusa.

biomedres-openaccess-journal-bjstr

Figure 1

biomedres-openaccess-journal-bjstr

Antioxidant Activity

Due to its high content of tannins, phenols, and flavonoids, B. diffusa has been the subject of numerous studies examining its antioxidant potential [27-29]. The ethanolic extract of B. diffusa demonstrated the ability to scavenge 1,1-diphenyl-2-picrylhydrazyl (DPPH) radicals [28]. A fractionation guided by electron spin resonance of the methanolic extract led to the identification of boeravinone D, boeravinone G, and boeravinone H, all exhibiting significant radical-scavenging activity, with boeravinone G displaying superior antioxidant properties when compared to the other two compounds [30]. This investigation also revealed the involvement of MAP kinase and NF-kB pathways in the antioxidant effects of boeravinone G, suggesting its potential utility in injuries mediated by reactive oxygen species (ROS) [30]. In the realm of African traditional medicine, the preference for the redder stems of B. erecta prompted a study on the antioxidant potential of the redder stem bark, establishing that betacyanin’s possess greater antioxidant activity than the phenolic compounds present in the stem [31]. Similarly, the antioxidant potential of B. procumbens was attributed to its concentration of polyphenols, as demonstrated by various antioxidant assays [32]. Furthermore, B. diffusa was identified as having the capability to protect tissues from hydroxyl radical- induced DNA damage [33].

Antidiabetic Activity

B. diffusa and ethanolic extracts demonstrate notable antihyperglycemic effects in rats with alloxan-induced and streptozotocin- induced hyperglycaemia. Additionally, they show potential for improving diabetes-related conditions, as evidenced by changes in parameters such as body weight, serum cholesterol, and triglyceride levels. In recent research, the impact of streptozotocin treatment on the pancreas of diabetic control rats, along with cell regeneration facilitated by glibenclamide, was examined. Additionally, comparable regenerative effects were demonstrated through the methanolic extracts of B. diffusa [34]. An investigation was carried out on the effects of a daily oral administration of an aqueous solution containing B. diffusa L. leaf extract on the levels of hepatic enzymes and blood glucose in both normal and alloxan-induced diabetic rats over a period of four weeks. When B. diffusa L. was administered to both normal and diabetic rats, the results showed a notable decrease in blood glucose levels and a considerable increase in plasma insulin levels [35]. In rats with streptozotocin-induced noninsulin-dependent diabetic mellitus (NIDDM), the chloroform extracts from B. diffusa leaves demonstrated dose-dependent reductions in blood glucose levels. This effect was comparable to the impact of glibenclamide. These results imply that the extract’s capacity to decrease blood glucose may be linked to the regeneration of pancreatic beta cells or actions extending beyond the pancreas [36].

Anticancer Activity

The B. diffusa root and leaf extract’s in vitro cytotoxic effects show a dose-dependent response. Both the root and the leaf’s crude ethanolic extract caused 30% and 40% of the cells to die, respectively [37]. An investigation was conducted into the effect of a root extract in 95% ethanol on the growth of human peripheral blood mononuclear cells (PBMC) activated by T cell mitogen PHA and PPD antigen. The extract showed that it inhibited the proliferation of PBMCs in a human mixed lymphocyte culture as well as that induced by these stimulators. Moreover, the extract demonstrated inhibitory actions on multiple cell lines, emphasising its efficacy in experimental settings against lymphoma and leukemic cells [38]. The 95% ethanolic extract of B. diffusa root was subjected to bioassay-guided fractionation, resulting in a 30% observed cell death in the HeLa cell line. Subsequent purification through column chromatography led to the isolation of a more potent fraction. [39]. In in vivo experiments, the extract demonstrated inhibitions of 87% and 95% against metastasis both prophylactically and overall. Additionally, the survival rate of the experimental model increased by 157%. When the extract was given as a preventative intervention, serum markers linked to metastasis were reduced by 85% [40]. Furthermore, Punarnava was isolated by the author from the extract, exhibiting its capacity to trigger cytotoxicity mediated by complement and antibodies, in addition to augmenting the function of natural killer cells [41]. Numerous investigations, both in vitro and in vivo, show that a variety of plant extracts sourced from distinct plant sections may include chemicals with anticancer potential. Punarnava, an alkaloid isolated from the roots was identified and reported to possess antimetastatic properties [42].

Anti-Inflammatory Activity

The alcoholic extract of B. diffusa, which is insoluble in water, demonstrates anti- inflammatory effects in rats. Leaf and floral extracts have significant anti-inflammatory properties [43]. BD leaf extracts were tested for toxicity and for their analgesic-anti- inflammatory qualities in both juice and lyophilized decoction form. The lyophilized decoction and juice both showed about 50% reduction in abdominal writhing in mice when compared to dipyrone sodium. When compared to morphine, the juice treatment increased the mice’s latency in the hot plate test. Another noteworthy finding was the reversal of the juice’s effects following pretreatment with naloxone, except in the case of the decoction. As a result, the author suggested that the antinociceptive mechanism of the juice may be related to opioids [44]. found that BD roots contained 𝛽-sitosterol, which significantly induced swelling in mice [45]. It is commonly known that BD has anti-inflammatory qualities and is also called sothaghni, a term that denotes its ability to reduce inflammation. Most of the ayurvedic formulations mentioned in Table 1 serve purposes related to inflammation. Numerous accounts highlight the utilization of leaves, whether in their whole form, incorporated into an oral preparation, or applied topically, particularly in instances of scorpion and snake bites or for wound healing.

Antiviral Activity

Promising protective activities against potato virus X infection in both hypersensitive and systemic hosts have been observed for compounds isolated from B. diffusa L. root, Cuscuta reflexa Roxb. stem, and Euphorbia hirta L. leaves. It was found that these extracts had a systemic inhibitory effect that was actinomycin D-responsive [46]. Notable control results were obtained with the mungbean yellow mosaic illness caused by the mungbean yellow mosaic virus, which was efficiently handled by the aqueous root extract of B. diffusa. Six application sprays of B. diffusa root extract proved to be particularly efficacious, significantly delaying the onset of symptoms, mitigating symptom intensity, and reducing disease occurrence by 80-90%. In addition, enhancements in pod formation and grain output were encouraged by this treatment, along with increases in plant height, root nodulation, and primary and secondary branches [47].

Hepatoprotective Activity

Chloroform and ethyl acetate extracts were made using Bacillus cereus, an endophyte that is present in B. diffusa roots. These extracts’ hepatoprotective effects were studied in rats, with an emphasis on assessing how well they scavenged free radicals. The extract of ethyl acetate demonstrated a significant IC50 value, prompting its selection for subsequent in vivo studies [48]. The administration of endophytic bacteria extracts resulted in a normalization of the heightened levels of the aforementioned biochemicals. The findings consistently indicate that extracts derived from the endophytic bacteria of B. diffusa demonstrate antioxidant and hepatoprotective properties, ultimately leading to the conclusion. Tuberculosis presents a significant health challenge, and the primary treatment involves rifampicin therapy. While rifampicin effectively addresses tuberculosis, it is associated with liver damage. Methanolic extracts from B. diffusa leaves were investigated in the search for a natural cure. Rats were given rifampicin to induce hepatotoxicity, which resulted in a significant rise in aspartate aminotransferase, alkaline phosphatase, and alanine aminotransferase levels. In comparison to the control group, there was a concurrent decrease in serum protein levels. Studies offer proof that extracts from B. diffusa possess the ability to alleviate liver issues, attributed to the presence of flavonoids in the plant, known for their antihepatotoxic properties [49].

Anti-Arthritic Activity

Numerous research use arthritic rats to test the antiarthritic effects of extracts made from B. diffusa roots, including petroleum ether, methanol, chloroform, and water extracts. Arthritis impacted hematological factors by elevating total white blood cell counts, raising erythrocyte sedimentation rates, and diminishing red blood cell count and hemoglobin levels. Rats given extracts from B. diffusa had smaller paws and heavier bodies as a result. The recovery of red blood cells and haemoglobin, as well as the normalisation of the total white blood cell count and erythrocyte sedimentation rate, were among the several haematological indicators that were brought back to baseline [50].

Antibacterial Activity

With regard to the possible presence of phytochemicals, B. diffusa leaves have strong antibacterial qualities against both gram-positive and gram-negative bacteria. All gram- negative bacteria as well as gram-positive bacteria like S. aureus, S. faecalis, and M. luteus are inhibited by the ethanol extract. All gram-positive bacteria are inhibited by the methanol extract, with the exception of M. luteus and gram-negative bacteria. B. diffusa leaf extracts work well against E. Coli, S. aureus, and P. aeruginosa in both aqueous and ethanolic forms at various concentrations, indicating the presence of active compounds with broad antibacterial capabilities. Overall, extracts from B. diffusa demonstrate significant antibacterial effects against a range of bacteria [51,52].

Anticonvulsant Activity

In the context of Nigerian traditional medicine, B. diffusa has a historical connection to the treatment of epilepsy. As a result, studies have been undertaken to investigate its effectiveness in managing convulsions. The crude methanolic extract of B. diffusa, specifically its liriodendron-rich component, demonstrated a dose-dependent protective effect against PTZ- induced convulsions. The observed ability to prevent convulsions was attributed to the calcium channel antagonistic properties of the liriodendron-rich fraction [53].

Adaptogenic/Immunomodulatory Activity

The study assessed the antistress and adaptogenic effects of ethanol extracts from B. diffusa roots in albino mice using swim endurance and cold restraint stress tests. The extracts demonstrated enhanced stress tolerance and immunomodulatory activity, as demonstrated by enhanced carbon clearance, which suggests reticuloendothelial system activation. Furthermore, mice’s reaction to sheep red blood cells (SRBC) was elevated in terms of delayed-type hypersensitivity (DTH), indicating a stimulatory effect on lymphocytes and accessory cell types involved in cell-mediated immunity [54].

Toxicological Studies

Nausea has been linked to the ingestion of higher doses of Punarnava, according to research. The primary emphasis of the pharmaceutical industry is directed toward creating and advancing innovative and indigenous plant-based drugs by exploring leads from traditional medicinal systems. Toxicological studies on B. diffusa have verified the lack of teratogenic and mutagenic effects, with the consumption of larger doses being associated with vomiting [54].

Conclusion

In recent years, the pharmaceutical industry has significantly directed its efforts toward designing and developing novel plant-based drugs through the exploration of leads from traditional medicine systems. The ethno-botanical and traditional applications of natural compounds, particularly those of plant origin, have garnered considerable attention due to their proven efficacy and perceived safety for human consumption. The review above suggests that the utilization of B. diffusa is deeply rooted in tradition and has been prevalent worldwide across various clinical and pathological conditions. While the scientific basis for many of its pharmacological properties has been established, ongoing research is still underway. Consequently, further comprehensive studies are encouraged to explore the potential of this plant.

Acknowledgements

Authors would like to acknowledge the management of Mahatma Gandhi University for providing us an opportunity to access the e-library facilities and valuable literature resources of the Central Library.

Follow us on: Biomedical Journal Impact Factor: https://biomedres.us

https://scholar.google.com/citations?user=OFtUOZYAAAAJ&hl=en
https://www.base-search.net/Search/Results?lookfor=Biomed+Journal+of+Scientific+%26+Technical+Research&l=en&refid=dcsuggesten
https://citefactor.org/journal/2574-1241/biomedical-journal-of-scientific-technical-research
https://ideas.repec.org/s/abf/journl.html
https://econpapers.repec.org/article/abfjournl/
https://www.ncbi.nlm.nih.gov/nlmcatalog/101723284
https://bjstr.org/
https://bjstr.org/about.php
https://biomedres.us/reprints.php
https://biomedres.net/submit-manuscript.php

Journal on medical genetics |BJSTR

Evaluating the Effects of Deficit Irrigation and Mulch Type on Yield and Water Productivity of Tomato in Fogera, Ethiopia

Introduction

The escalating global population and the escalating challenges posed by climate change necessitate an increase in food production to ensure food security worldwide (Page, et al. [1,2]). Smallholder agriculture serves as the primary income source for rural communities in Sub- Saharan African (SSA) countries such as Ethiopia. However, these smallholder agricultural systems heavily rely on rainfed production, making them vulnerable to the adverse effects of rainfall variability and drought, leading to food insecurity and low agricultural productivity (Assefa, et al. [3]). The inadequacy of traditional farming techniques exacerbates the challenges faced by small-scale farmers, resulting in insufficient food production to meet the demands of the growing population (Tadesse, et al. [4-8]). Therefore, enhancing agricultural productivity is crucial to address food security issues and sustain the livelihoods of Ethiopian communities (Tewabe, et al. [9]). To address the growing food demands, it is imperative to transition from rainfed production to irrigation-supported agriculture (Belay, et al. [8]). Irrigation plays a pivotal role in mitigating the impact of rainfall variability and irregularity on agricultural productivity (Mekonen, et al. [10]).

Small-scale irrigation initiatives are crucial for poverty reduction, food security, and enhancing rural livelihoods in Ethiopia (Assefa, et al. [3,11-13]). However, the scarcity of available water resources poses a significant challenge to irrigated agriculture in many regions, including Ethiopia (Belay, et al. [8]). Climate change further exacerbates water scarcity issues, leading to droughts, moisture stress, and inadequate water management practices that strain water resources and hinder crop productivity (Tewabe, et al. [9]). Insufficient water availability for irrigation results in low crop yields, conflicts over water allocation, and challenges in sustaining agricultural productivity (Dirirsa, et al. [14]). Currently irrigated agriculture take place under water scarcity and insufficient water supply for irrigation due to these the crop productivity are low are (Kifle, et al. [15]). Enhancing Water Productivity (WP) and water savings are a major challenge for sustainable crop production in irrigated agricultural (Mubarak, et al. [16]). In the context of Ethiopia, traditional irrigation systems dominate crop production, resulting in low water and crop productivity levels (Hordofa, et al. [17]). Poor irrigation water management practices further compromise the sustainability of crop production, leading to crop failures, water disputes, and reduced household incomes. To address these challenges, innovative water-saving technologies and efficient irrigation strategies are essential for enhancing water productivity and ensuring sustainable crop production (Al-ghobari, et al. [18-21]).

Therefore, deficit irrigation and conservation agriculture practices emerge as critical strategies to optimize water use efficiency and enhance crop productivity in water-limited regions. Deficit Irrigation (DI) represents a water-saving strategy that aims to maximize net returns by reducing irrigation water without compromising crop yields (Capra and Consoli, 2015). By implementing water-saving techniques like DI, water productivity can be improved, leading to enhanced overall yields (Asmamaw, et al. [21-23]). Conservation agriculture practices, such as mulching, have proven effective in boosting water and crop productivity while reducing production costs (Erkossa, et al. [24,25]). Mulching, in particular, plays a crucial role in improving water and crop productivity under deficit irrigation conditions (Rop, et al. [26]). Evaluating various water-saving techniques, including deficit irrigation and mulching, is essential for enhancing water productivity and crop yields in water-limited environments (Khan, et al. [27]). Tomatoes are a vital crop in Ethiopia, contributing significantly to the country’s agricultural sector and economy. In the Fogera region specifically, tomato production plays a crucial role in providing livelihoods for farmers and meeting the local demand for fresh produce. However, tomato cultivation in Fogera faces various challenges, with water scarcity being a major concern. The erratic rainfall patterns and limited access to irrigation water pose significant obstacles to sustainable tomato farming in the region.

In light of these challenges, the adoption of efficient water management practices is essential to enhance tomato yield and water productivity in Fogera. Deficit irrigation, which involves supplying water to crops below their full water requirements, can help optimize water use efficiency and mitigate the impact of water scarcity on tomato production. Similarly, the use of mulching, such as plastic or organic materials, can aid in conserving soil moisture, suppressing weed growth, and regulating soil temperature, thereby improving crop yields in water-limited environments. This study aims to fill the gap in knowledge regarding the optimal water management strategies for tomato production in this region, considering factors such as water scarcity, climate variability, and sustainable agricultural practices. Therefor This research aims to address the research gap in understanding how deficit irrigation and mulching impact tomato yield and water productivity in the specific context of Fogera, Ethiopia. By investigating the effects of these practices on tomato crops, the study seeks to provide valuable insights into sustainable water management strategies for farmers in the region, and to contribute to the development of tailored recommendations and interventions to support tomato farmers in Fogera in achieving higher yields and improved water productivity and promoting sustainable agricultural practices.

Materials and Methods

Study Area Description

The field experiment was conducted at the Fogera National Rice Research and Training Center (FNRRTC) experimental site. It is located at 11º19ʹ N and 37º03ʹ E at an altitude of 1815 m.a.s.l during the 2020/21 irrigation season. Fogera is found in the South Gonder Zone of the Amhara regional state (Figure 1). Which is found at a distance of 657 km from Addis Ababa and 57km from Bahir Dar. It is predominantly classified as woinadega agro-ecology (ILRI, et al. [28]). The climatic data of the experimental site, which is situated in the middle of Fogera Plain, show that the mean annual minimum, maximum and mean temperatures of the area are 14.0ºC, 27.7ºC, and 20.8ºC, respectively. Rainfall in the area is uni-modal, usually occurring from June to October, and its mean annual rainfall is 1216.3mm and ranges from 1103 to 1336mm (Aleminew, et al. [29]). The land in Fogera shows that 44.2% is arable and another 20% is irrigated, 22.9% is used for pasture, 1.8% has shrubland, 3.7% is covered with water, and the remaining 7.4% is considered degraded or other (System, et al. [30]). The dominant soil type in the Fogera is black clay soil (ferric vertisols), while the mid and high-altitude areas are predominantly orthic Luvisols.

Figure 1

biomedres-openaccess-journal-bjstr

Experimental Design and Layout

Two main factors were considered: the first factor was mulch types and the second factor was deficit irrigation level based on crop water requirement (ETc) and each factor had three levels. Three levels of deficit irrigation are; 100%ETc, 75%ETc, and 50%ETc while three mulch types: No Mulch (NM), Rice Straw Mulch (RSM), and White Plastic Mulch (WPM) were evaluated. The non- deficit and non-mulch treatments were used as controls. The application of rice straw mulch at the rate of 6tha−1, while 25micron thickness was used for white plastic mulch. A factorial combination of three levels of deficit irrigation and three mulch types was evaluated in a Randomized Complete Block Design (RCBD) with three replications and treatments were randomly assigned (by chance) to the experimental block. The field experiment has a total of nice treatment combinations and 27 plots. The plot size was 4.2m × 4m=16.8m2 area. To minimize the influence of the lateral flow of water into the plots, the block distance should be sufficient. Then, the distance between blocks and plots was 3m and 2m receptively. In this experiment, the furrow irrigation method was used (Figure 2).

Figure 2

biomedres-openaccess-journal-bjstr

Agronomic Practices of the Experimental

Tomato Roma VF variety seeds were used as seed material. The nursery bed was prepared and the seed was sown on 01 December 2020 for tomato. Watering, weeding, fertilizer, chemical spray, and other agronomic activities were applied in the nursery. The seedling was transplanted to experimental plots on 01 January 2021 tomato. Furrow spacing and plant space were done according to the agronomic recommendation of the area. This was done with the spacing between rows being1m for tomato while the plant spacing being 30cm transplanted was done. Each plot has four single planting rows for tomatoes, each row accommodating about 14 plants for tomato. Each experimental plot was fertilized with one application of NPSB during transplanting only and a split application of urea at transplant and 30 days after transplanting as top dressing with the agronomic recommendation rate NPSB and urea for tomato. Chemical spray was applied to prevent the experiment from disease and pests. Each experimental plot was equally treated with fertilizer rate, chemicals, and weed. For all treatments without treatment variation, one common irrigation was applied at a depth of 25.5 mm for tomatoes based on irrigation scheduling to ensure good seedlings establishment. All treatments were weeded only once before mulch was applied. Fifteen days after transplanting, treatments were started because seedings were start root development and was well performed. All treatments were irrigated on the same day because the only difference was the depth of water based on deficit levels. The harvesting time of tomato five harvesting times were done and tomato yield was weighed from each plot during harvest and converted to t/ha.

Soil Sampling and Analysis

Soil samples were collected before crops were planted. Five soil depths were sampled from the top to the respective root depth (0-20, 20-40, 40-60,60-90, and 90-120cm) using a soil auger at three locations at the representative site of the experiment. Composite samples were made by mixing five sub-samples from the same treatment and depth. About 1 kg of soil was used for determining the soil physical and chemical properties such as soil textural class, Field Capacity (FC) and Permanent Wilting Point (PWP), soil pH, and EC analysis at the Amhara Design and Supervisory Works Enterprise. Whereas the soil bulk density was determined from undisturbed soil samples using a cylinder, drop-hammer core sampler with size 5 cm in diameter and 5 cm in height was driven into the soil with a hammer. The core sampler was driven to 20 cm depth for the upper 0–20 cm soil layer and to 40 cm depth for the next 20 cm layer. The cylinder containing an undisturbed soil core was removed and trimmed. The weight of the soil core was determined after drying it in an oven at 105°C for 24 hours. The bulk density was determined by the mass of the soil per volume (Terzaghi, et al. [31]).

Soil samples were air-dried, sieved by a 2 mm sieve, and analyzed using standard laboratory procedures. The major soil properties included pH (H2O), electrical conductivity, exchangeable Na, K, Ca, Mg, CEC and Exchangeable Na %(ESP) was determined using ammonium acetate. The soil textural class analysis of clay, silt, and sand was determined using hydrometer method. The pH meter was standardized with 4.0 and 9.2 pH buffer solutions and accordingly, the pH of the sampled soil was measured. For soil electrical conductivity determination, an extract was obtained from the saturated soil paste with the help of a vacuum pump. Then with the help of the digital electrical conductivity meter, ECe was measured. The pH and EC of water were also measured for irrigation water quality. Field capacity and permanent wilting points were determined in the laboratory using pressure- plate apparatus by applying 1/3 bars pressure to a saturated soil sample for field capacity and applying 15bars pressure to determine the permanent wilting point. The soil moisture was determined gravimetrically.

Determination of Crop Water Requirement

Monthly ETo was computed using CROPWAT model version 8.0 with the Penman-Monteith method based on the 28-year long-term climate data (Tmax. Tmin, RH, Sh, and U) collected from the West Amhara National Metrology Agency in Bahir Dar for onions and tomatoes during the growing season (Table 1). Crop water use (ETc) was determined by multiplying ETo by the crop coefficient (ETo*Kc) (Allen, et al. 32). The crop coefficient was used for the growth stages of the onion and tomato crop for the experimental years explained in Table 2. Irrigation water to be applied to the tomato was determined based on allowable constant soil moisture depletion fraction (p = 0.4) of the Total Available Soil Water (TAW), where TAW was determined from the permanent wilting point, field capacity, root depth, and bulk density variables. The depth of water applied during each irrigation event was the net irrigation requirement estimated by the Penman-Monteith method using the long-term climate data. Considering conveyance and other losses for a surface furrow irrigation system, an application efficiency of 60% was assumed (Chandrasekaran, et al. [33]). Successive irrigation depth was applied based on the readily allowable water for the root depth on that day. The different amount of water was applied with different irrigation scheduling. Because the amount of water applied of the crop depends on the crop growth stage and the monthly weather conditions. The daily crop evapotranspiration was deducted from the net irrigation depth for the control treatment (100% ETc) until the cumulative subtraction from the net irrigation depth applied approached zero. Further irrigation was applied when the cumulative ETC approach to net irrigation depth was applied to control treatment and applied to stress treatments based on their proportion to non-stressed treatment.

Table 1: Treatment combinations.

biomedres-openaccess-journal-bjstr

Table 2: Agronomic management of tomatoes throughout the growing period.

biomedres-openaccess-journal-bjstr

The effective root depth for mid- season and the late season was taken as a constant 1.1m for tomato. During the experiment there was no rainfall, all the water required by crops has to be supplied by irrigation, due to this, the net irrigation requirement and the readily available water were equal. The gross irrigation was calculated based on application efficiency and readily available water (FRENKEN, et al. [34]). Once the amount of water that needs to be given during one irrigation application was estimated and applied, then the next determine the irrigation interval by dividing the net irrigation depth (mm) to daily crop water requirement (mm/day). The predetermined amount of irrigation water for each plot was measured using a 3-inch standard Parshall flume. The required amount of irrigation water was applied to each experimental plot based on the deficit level of the treatment. The volume of water applied for all treatments was determined from the plot area and depth of irrigation requirement. The time required to irrigate each plot was measured from the ratio of the volume of applied water to the discharge-head relation of the 3-inch Parshall flume. The time required to deliver the desired depth of water into each furrow was calculated using the below equation 2.1 the help stopwatch (Geremew, et al. [35]).

where A = (irrigated area) in m2 d = irrigation depth in cm T = (time) in min. q = (Parshall flume discharge) in l/s.

Agronomic Data Collection

Marketable Yield: The experimental data on the fruit yield of tomato in each experimental plot was harvested and weighing the yield obtained after picking the tomato fruit. Marketable yield (kg/ha) was measured for healthy and non-diseased, non- rotten, tomato fruit recorded from the sampled plant. Marketable bulb yield was expressed as kg per plot. Finally, the yield obtained from the sample area was converted to per hectare using equation 2.2 (Demisie, [36]).

Water productivity was determined based on the ratio of yield of tomato (yield per hectare) to the amount of water used from the establishment to harvest expressed as kg of yield per m3 of water. It was calculated based on the formula using equation 2.3.

Where: WP -Water productivity (kg/m3) Ya-Actual yield (kg/ha) ETa -Seasonal applied amount of water (m3 /ha)

Crop yield response factor (Ky) was determined from the experimental data. The yield response factor (Ky) was one of the important parameters that indicate whether moisture stress due to deficit irrigation was advantageous or not in terms of enhancing water productivity. The yield response factor relates relative yield reduction to the corresponding relative deficit in Evapotranspiration (ETc). It was an indication of the response of yield to water use reduction. The yield response factor was determined based on the ratio of relative yield decrease to relative evapotranspiration deficit expressed in decimals, using the equation 2.4 (Smith, et al. [37])

Where: Ya = actual harvested yield in kg/ha, Ym = maximum harvested yield in kg/ha, ky = yield response factor, ETa = actual evapotranspiration in mm/growing period and ETm = maximum evapotranspiration in mm/growing period.

Statistical Analyses

The collected data were statistically analyzed using a statistical software in the procedure of a general linear for the variance analysis model. Analyses of variance (ANOVA) were used for yield and water productivity of tomatoes. All data collected were managed and compared with Least Square of Differences (LSD) and when the effect of the treatments was found significant, mean comparisons were tested using the Tukey test at 5% probability. Results of growth, yields, and yield component parameters were analyzed using statistix computer package version10.

Results and Discussion

Soil and Water Analysis

The soil texture laboratory analysis results showed that the average proportion of sand, silt, and clay percentages were 18.6, 17.6, and 63.8, respectively. Thus, according to the USDA soil textural classification, the soil textural class of the experimental site was heavy clay soil. The result of soil Bulk Density (BD) in the experimental field has a slight variation with its depth. The BD of the experimental site varied from 1.22 g/cm3 in the upper soil (0-20 cm) to 1.33 g/cm3 in the lower soil layer (90-120 cm). The average bulk density of the experimental site was 1.28 g/cm3 (Table 3). The BD of 1.2 g/cc may be expected for clay soil but it can vary from around 1.0-1.4 g/cc (Hazelton [38]). The soil moisture content on the weight base at FC showed varying variation within depths of 0-20, 20-40,40-60,60-90 and 90-120 cm were 35.1, 35.6, 37.5,37.8 and 38.6 %, respectively (Table 3). Whereas the soil moisture content on weight base at PWP also showed a vary within depths of 0-20, 20-40,40-60,60-90 and 90-120 cm were 21.5, 22.3, 23.6,24.8 and 25.7%, respectively. The average moisture content on weight base at FC (1/3 bar) and PWP (15 bar) were 36.92% and 23.58%, respectively. The Total Available Water (TAW) which was the amount of water that a crop can extract from its root zone was directly related to variations in FC and PWP. Based on the laboratory results of ADSW the experimental TAW also showed a variation within depths of 0-20, 20-40,40-60,60-90 and 90-120 cm were 33.2, 33.0, 36.4,49.9 and 51.9mm, respectively. The volumetric TAW of the experimental site was 170mm/m. The analysis of applied irrigation water showed that a pH value of 7.28 and ECw value of 0.24 dS/m was obtained (Table 4).

Table 3: Long-term (from 1990 to 2017) means climate data.

biomedres-openaccess-journal-bjstr

Table 4: Tomato parameters used for crop water estimation.

biomedres-openaccess-journal-bjstr

Note: Allen, et al., (1998).

Crop Water Requirement Of Tomato

The total irrigation water applied to tomato crops were 438.5 mm for non-stressed treatment (100%ETc) respectively (Table 5). The result was in agreement with (Doorenbos and Kassam (1986)) who reported that the seasonal crop water requirement of tomato ranges from 400-600 respectively using furrow irrigation. All treatments were irrigated on the same day because the only difference was the depth of water on deficit levels.

Table 5: Tomato parameters used for crop water estimation.

biomedres-openaccess-journal-bjstr

The Effects of Deficit Irrigation on Yield and Water Productivity of Tomato

The Effects of Deficit Irrigation on Yield Components of Tomato: Deficit irrigation had no significant effect on the fruit diameter and fruit length of tomatoes (p < 0.05). Fruit diameter and fruit length were not significantly affected by deficit level. Even with a minimal amount of water, we can get reasonable growth and yield components. However, the maximum fruit diameter and fruit length (3.63 and 5.8cm) were recorded from 75%ETc and control (100%ETc) respectively. On the other hand, the minimum fruit diameter and fruit lengths were 3.58 and 5.7cm recorded in the application of 50%ETc respectively, (Table 6). According to (Berihun, et al. [39]), amount of water applied did not have a significant effect on the growth and yield components of tomatoes. This results consistent with the findings of Shahein, et al. [40]) who reported that water stress for the whole growing season does not significantly affect fruit length and diameter compared to fully irrigated treatment. A similar result was also reported by Selamawit (Bekele, et al. [41]) who reported that deficit levels had no significant effect on growth and yield components. No significant difference in fruit diameter was observed under full irrigation and 70%ETc (Randhe et al., [42]).

Table 6: Analysis of chemical properties of soil and water.

biomedres-openaccess-journal-bjstr

The Effects of Deficit Irrigation on Yields and Water Productivity of Tomato: The analysis of variance (ANOVA) results showed that the marketable yield of tomato was significantly (p < 0.05) affected by irrigation levels. the highest and the lowest marketable yield of tomato (37.7t/ha) and (29.5t/ha) were obtained from the 75%ETc and 50%ETc respectively. This shows that the marketable yield of tomato in 75%ETc was 27.8% higher than 50%ETc and 4.1 % higher than 100%ETc, i.e., 75%ETc could save 25% of water without affecting yield (Table 6). This result is consistent with the suggestion of (Biswas, et al. [43]) reported that the yield of tomatoes with the increasing amount of irrigation water. The trend was reversed when irrigation was coupled with mulches there was a decrease in tomato yield with the increase in irrigation regime. This result was in line with (Audu, et al. [44]) who reported that the high tomato yield was obtained at 80%ETc than 100ETc. A similar result was also (Randhe, et al. [42]) stated that, the yield of tomatoes was higher under 70%ETc than full irrigation. For tomatoes production applying 85% and 70% of ETc was recommended with a minimum reduction of yield (Kifle, 2018). This result was also in line with (Ya-dan, et al. [45]) reported that tomato yield increased with the amount of applied irrigation water at 75%ETc and then decreased at 100%ETc. Similarly, the highest WP of tomato 12.7 and 11.2kg/m3 was obtained from 50%ETc and 75%ETc respectively while the lowest WP 8.3kg/m3 was obtained from 100%ETc (Table 7). This shows that the WP of tomato in 50%ETc was 13.4% higher than 75%ETc and 53.0 % higher than 100%ETc. This shows that WP in 100%ETc was lower than 50% and 75%ETc. The 100%ETc had a significantly different on WP from all other deficit treatments. This was because the amount of water applied in the full irrigation treatment was significantly higher than the deficit treatment. WP for tomato was increased in deficit treatment compared to non-stressed treatment. This result was in line with (Guangcheng, et al. [46]) who stated that DI significantly increased the WP compared to the full irrigation regime. A similar result was also reported by (Ragab, et al. [47]) that DI improved WP for tomatoes. This result was also in line with Selamawit Bekele, (2017) reporting that the maximum WP was recorded from 50%ETc and the minimum was recorded at 100%ETc. The highest WP of tomato was found at 50%ETc, while 100%ETc showed the least WP (Asmamaw, et al. [22]). The highest WP of tomatoes were obtained in 50%ETc (Yadan, et al. [45]). The highest WP was observed at 60%ETc while the lowest was observed at 100%ETc (Sang, et al. [48]).

Table 7: Seasonal irrigation water applied to tomato.

biomedres-openaccess-journal-bjstr

The Effects of Mulch Types on Yield and Water Productivity of Tomato

The Effects of Mulch on Yield Components of Tomato: The analysis of variance showed that the fruit diameter of tomato was significantly affected by the main effects of mulch type (p < 0.05), while the fruit length of tomato was not significantly affected by the mulch type. The highest fruit diameter was obtained from rice straw mulch 3.66cm and plastic mulch 3.60cm while the lowest fruit diameter was obtained from no mulched treatment 3.56cm (Table 8). Whereas the fruit length of tomato was not significantly different among treatments. This result agreed with the results of (Karaer, et al. 49]) who stated fruit diameter was found to be higher in mulch applications. This result agreed with the results of (Goel, et al. [50]) reported that the trend of the favorable effect produced by mulches on growth parameters was rice straw mulch higher than no mulch. The application of different mulch types had no significant effect on the growth and yield parameters of tomatoes (Mn, et al. [51]).

Table 8: Note: Where, LSD = Least Significant Difference at 5% level; CV = Coefficient of Variation. Means in columns followed by the same letters are not significantly different at a 5% level of significance. ** =significant at P <0.01.

biomedres-openaccess-journal-bjstr

The Effects of Mulch Types on Yields and Water Productivity of Tomato: The analysis of variance showed that the marketable yield of onion and tomato was significantly affected by mulch type at (p < 0.01). The marketable yield of tomatoes was 36.9, 35.1, and 31.1 t/ha, respectively, in RSM, WPM, and NM treatments. This implies that the marketable yield in RSM was 17.1% higher than NM and 5.1% higher than WPM treatment. The result indicated that mulch application significantly improves the yield of the tomato. This result was in line with the result of (Audu, et al. [44]) reported that the yields of tomatoes obtained from RSM were higher than the yield obtained from WPM. The results were also consistent with the findings reported in (Goel, et al. [50]) that increase in tomato yield with mulches RSM was 25.6% as compared to NM. RSM increased the fruit yield of tomatoes (Pandey, et al. [52]). These results agree with (Robel Admasu, et al. [53]) who reported that the maximum marketable yield was obtained due to plastic mulch than no mulch for tomatoes. The application of straw mulch is found to be economically and agronomically feasible (Berihun, et al. [39]). The application of mulch types significantly influences tomato fruit yield (Tegen, et al. [54]). Crop yield significantly increased with the application of rice straw mulch (Dossou-yovo, et al. [55]). These results suggest that straw mulching has great potential for improving onion yield (Tao, et al., [56]). Similarly, the WP of tomatoes was 11.4, 11.0, and 9.8 kg/m3 in RSM, WPM, and NM treatments, respectively (Table 9). It implies that the WP in RSM treatment was 16.3% higher than NM and 3.6% higher than WPM treatment. The results indicated that mulching applications significantly improve the WP of the tomato. This result was in line with the result of (Goel, et al. [50]) who reported that RSM increased WP by 26.6 % over no mulch. The results were also consistent with the findings reported in tomato Robel Admasu and Zelalem Tamiru, (2019) that the maximum WP was obtained due to PM than NM for tomatoes. The result indicated that mulching was one of the important water management strategies used to improve WP. This result showed that straw mulch increased WP, and decreased evapotranspiration.

Table 9: The effects of deficit irrigation on yield and water productivity of tomato.

biomedres-openaccess-journal-bjstr

Note: Where, LSD = Least Significant Difference at 5% level; CV = Coefficient of Variation. Means in columns followed by the same letters are not significantly different at 5% level of significance. ** =significant at P < 0.01.

The interaction effects of deficit irrigation and mulch types on yield and water productivity of tomato

The Effects of Deficit Irrigation and Mulch on Yield Components of Tomato: The analysis of variance showed that the fruit diameter and fruit length of tomatoes were not significantly affected by the interaction effects of deficit irrigation and mulch types (p < 0.01). There was no significant difference was observed between treatments in fruit diameter and fruit length of tomato at all deficit irrigation and mulch types (Table 10). Even we applied minimum amount of water to get the reasonable fruit size of tomato. This may be due to the canopy covers of tomato use as a mulch. This result agreed that the results of (Kere, et al. [57]) the yield attributes of tomato were not significantly affected by either irrigation amount and mulch type. According to (Berihun, et al. [39]), the interaction effect of the amount of water and mulch was not significant in fruit length and fruit diameter. According to (Aliabadi, et al. [58]) the interaction effect of mulch and amount of water on fruit length and diameter was not significant. A similar result was also reported by (Selamawit Bekele, et al. [41]) who reported that deficit levels have no significant effect on plant and fruit height. No significant difference in fruit diameter was observed under full irrigation and 70%ETc (Randhe, et al. [41]).

Table 10: The effects of deficit irrigation on yield and water productivity of tomato.

biomedres-openaccess-journal-bjstr

Note: Where, LSD = Least Significant Difference at 5% level; CV = Coefficient of Variation. Means in columns followed by the same letters are not significantly different at 5% level of significance.
** =significant at P < 0.01.

Combine Effects of Mulch and Deficit Irrigation on Yields and Water Productivity of Tomato: The ANOVA results showed that the marketable yield of tomato was significantly affected by the interaction effects of deficit irrigation and mulch types at (p < 0.05). the highest marketable yield of tomato (41.7t/ha and 38.6 t/ha) were achieved from 75%ETc and 100%ETc with RSM treatments, respectively. However, no significant yield difference was observed between 75%ETc with WPM, and 100%ETc with RSM treatment combinations. The lowest marketable yield obtained from 50%ETc with NM treatment was 26.6t/ha. The marketable yield of tomato was 41.7, 38.6, and 38.0, t/ha, respectively, in 75% and 100%ETc with RSM, and 75%ETc with WPM treatment combinations. This implies that marketable yield of tomato in 75%ETc with RSM was 8.0% higher than 100%ETc with RSM and 9.7% higher than 75%ETc with WPM treatment combinations (Table 11). This result showed that RSM and WPM increased the yield of tomatoes by 21.2% and 10.5% compared with NM treatment. These results also showed that there was no yield advantage observed using 100ETc with NM. RSM improves the yield of tomatoes compared to WPM and NM treatments. All the deficit treatments with mulch resulted in significantly higher yields than unmulched irrigation level treatments. The yield of tomatoes increased with the increase in water supply without mulch. The effect was reversed when the irrigation level was coupled with either plastic or straw mulch; there was a decrease in tomato yield with the increase in irrigation regime. Irrigation at the same level without mulch produced the lowest yield.

Table 11: The effects of mulch type on marketable yield tomato.

biomedres-openaccess-journal-bjstr

Note: Where, LSD = Least Significant Difference at 5% level; CV = Coefficient of Variation. Means in columns followed by the same letters are not significantly different at 5% level of significance.
** =significant at P < 0.01.

However, 100%ETc irrigation supply produced a lower yield than 75%ETc when mulched with plastic and mulched with straw. This may be due to excessive watering that has been shown to increase flower drops and reduce fruit set. Also, this may cause excessive vegetative growth and a delay in ripening. The water supply during and after the fruit set must be limited to a rate that will prevent the stimulation of new growth at the expense of fruit development (Doorenbos, et al. [59]). This result is in line with the findings of (Audu, et al. [44]) recommended that tomato producers to adopt water application at 80%ETc and use RSM. These results were also consistent with the findings of (Biswas, et al. [43]) reported that with 100%ETc water application, the plastic-mulched treatment produced a lower yield than the straw-mulched treatment. The maximum marketable yield of tomatoes was observed at 80%ETc with mulch (Alebachew, et al. [60]). The maximum fruit yield was recorded from the plants receiving deficit irrigation at 80%ETc with a straw mulching treatment combination (Samui, et al. [61]). The best level of irrigation for tomato crop is 80%ETc and this correspond to mulching practice of rice straw mulch (Zakari et al. 2020). Similarly, the highest WP of tomatoes (13.59 and 13.08 kg/m3) were achieved from 50%ETc with WPM and with RSM respectively (Table 11). There was no significant difference observed between 50%ETc with WPM and with RSM treatment combinations. The lowest WP was obtained from 100%ETc with no mulch. However, there were no significant differences observed between in WP of 100%ETc with NM and 100%ETc with WPM treatment combinations. The WP of tomatoes was 13.59, 13.08, and 12.44, kg/m3, respectively, at 50%ETc with WPM, RSM, and 75%ETc with RSM treatment combinations. This implies that WP in 50%ETc with WPM was 3.2% higher than 50%ETc with RSM and 8.5% higher than 75%ETc with RSM treatment combinations. These results showed that RSM and WPM combined with DI improved tomato WP without yield penalty. At irrigation level of 50%ETc, irrigated to tomato plot mulched with WPM produced better WP than that of NM and NM treatment. The NM treatment remained always behind the mulched treatment. At a high irrigation level of 100%ETc, all mulched and un-mulched treatments performed almost similarly to produce WP. Mulches reduced the rate of water loss through evaporation from the soil surface. So, the soil-water-plant relationship was better in a low irrigation level than in a high irrigation level which might help produce higher WP. These results were consistent with the findings of (Biswas, et al. [43]) reported that the higher WP were obtained from mulch treatments with a 50%ETc. This result is in line with the findings of (Goel, et al. [50]) who explained that mulching increased irrigation water use efficiency by 26.6 % in rice straw mulch over no mulch. The tomato WP under the interactive effect of deficit irrigation and mulch was determined to be highest at 60%ETc with mulch and lowest at 100%ETc (Sang, et al. [48]).

The Effect of Mulch and Deficit Irrigation on Yield Response Factor

The study revealed that a lower yield response factor (ky) of 0.0 was achieved from 75%ETc with RSM for tomato. The result indicated that the ky was associated with deficit level and mulch types. At 100%ETc were no recorded yield response factors. Because the actual amount of water applied at 100%ETc was similar to ETm, the result was one. In this study, the Ky of the tomato crop under no mulch condition was 1.0. The Ky values of the no mulch treatment were higher than the mulched treatment which implies that the proportional decrease in yield under the no mulch condition was much higher than in the mulched condition. Ky, which indicates the level of tolerance of a crop to water stress, approaching unity when yield declines proportionally to ET deficit (the greater Ky the lower the tolerance), was higher in no mulch compared to mulched treatment. This reveals a greater tolerance of this mulched treatment to water shortage. In this respect, Ky may be a valuable tool for water deficit tolerance and, thus, for deficit irrigation adaptability evaluation in tomato and onion production. Results among the treatments showed as the deficit increased, the sensitivity of yield increased [62-67] (Tables 12-14).

Table 12: The interaction effects of mulch and deficit on yield components of tomato.

biomedres-openaccess-journal-bjstr

Note: Where, LSD = Least Significant Difference at 5% level; CV = Coefficient of Variation. Means in columns followed by the same letters are not significantly different at 5% level of significance.
** =significant at P < 0.01.

Table 13: The interaction effects of mulch and deficit on marketable yield tomato (t/ha).

biomedres-openaccess-journal-bjstr

Note: Where, LSD = Least Significant Difference at 5% level; CV = Coefficient of Variation. Means in columns followed by the same letters are not significantly different at 5% level of significance.
** =significant at P < 0.01.

Table 14: Effect of mulch type and deficit irrigation levels on tomato yield response factor.

biomedres-openaccess-journal-bjstr

Note: Where, LSD = Least Significant Difference at 5% level; CV = Coefficient of Variation. Means in columns followed by the same letters are not significantly different at 5% level of significance.
** =significant at P < 0.01.

Conclusion and Recommendations

Conclusion

Water scarcity is the main challenge in current sub-Saharan African countries including Ethiopia. To mitigated those challenge on farm water saving strategies should be implemented to increase yield and water productivity. The marketable yield of tomato in 75%ETc was 27.8% higher than 50%ETc and 4.1% higher than 100%ETc treatment. While the IWUE in 50%ETc treatment was 13.4% higher than 75%ETc and 53.0% higher than 100%ETc treatment. The marketable yield of tomato in RSM was 17.1% higher than NM and 5.1% higher than WPM treatment while the IWUE of tomato in RSM was 16.3% higher than NM and 3.6% higher than in the WPM treatment. In the combination effects of mulch and deficit irrigation, the marketable yield of tomatoes in 75%ETc with RSM was 8.0% higher than 100%ETc with RSM and 9.7% higher than 75%ETc with WPM treatment combinations. Similarly, the water productivity of tomatoes in 50%ETc with WPM was 3.2% higher than 50%ETc with RSM and 8.5% higher than 75%ETc with RSM treatment combinations. Deficit irrigation strategies are recommended for use by farmers and extension workers to achieve optimum tomato yield and maximize WP by applying at 75%ETc through growth phases while saving water 25% of the water requirement. Smallholder farmers should apply RSM practices to increased tomato yields and savings water under conservation agriculture. Tomato growers are highly advised to cover their crop with RSM and apply 25%deficit irrigation instead of full irrigation to achieve higher tomato yields and better WP. Adoption of water-saving strategies by smallholder farmers during the water scarcity time has economic benefits because less production cost was required for diesel, and labor for irrigation water application, and the saved water can potentially increase farm income to be used for bringing new areas under irrigation. Additional research is needed on the effect of mulch types on soil nutrient dynamics, soil temperature, and the occurrence of pests and disease while different irrigation levels of moisture stress to determine conclusively the influence of the same study on yields and water productivity. Such studies may result in a further improvement of the yield of tomato in water shortage areas of the country.

Follow us on: Biomedical Journal Impact Factor: https://biomedres.us

https://scholar.google.com/citations?user=OFtUOZYAAAAJ&hl=en
https://www.base-search.net/Search/Results?lookfor=Biomed+Journal+of+Scientific+%26+Technical+Research&l=en&refid=dcsuggesten
https://citefactor.org/journal/2574-1241/biomedical-journal-of-scientific-technical-research
https://ideas.repec.org/s/abf/journl.html
https://econpapers.repec.org/article/abfjournl/
https://www.ncbi.nlm.nih.gov/nlmcatalog/101723284
https://bjstr.org/
https://bjstr.org/about.php
https://biomedres.us/reprints.php
https://biomedres.net/submit-manuscript.php

Journals on Biomedical Science | BJSTR

Life and Work Satisfaction in Literature from 2020 to 2024

Introduction

The history of life satisfaction is a concept that has evolved over time, reflecting changes in cultural, philosophical, and scientific perceptions about well-being and happiness (Vallejo, et al. [1]). While there is no single narrative of the history of life satisfaction, we can identify some important milestones and perspectives throughout history: In ancient Greece and Rome, thinkers such as Aristotle and Epicurus addressed questions related to happiness and well-being. welfare. Aristotle proposed that happiness (eudaimonia) was achieved through the realization of human virtues, while Epicurus associated happiness with the absence of pain and the satisfaction of moderate desires. During the Middle Ages, the conception of life satisfaction was strongly influenced by Christian religious teachings, which promoted the idea of happiness as a spiritual state based on salvation and the fulfillment of divine will (Carrillo-García, et al. [2]). With the Enlightenment, new ideas about happiness emerged based on the use of reason and the search for the common good. Philosophers such as John Locke and Jeremy Bentham explored concepts of utility and pleasure as fundamental components of human happiness. In the 20th century, the field of psychology began to systematically study life satisfaction and psychological well-being (Rodríguez-Rey, et al. [3]). Figures such as Abraham Maslow and Carl Rogers developed theories about human needs and self-development as essential ingredients of a satisfying life.

Currently, life satisfaction is understood in a multidimensional way, incorporating psychological, social, economic, and cultural aspects. The science of happiness and well-being has become an interdisciplinary field that studies how various factors contribute to people’s subjective and objective well-being. The search for life satisfaction today involves a comprehensive approach that considers factors such as quality of life, social relationships, sense of purpose, physical and mental health, as well as the connection with nature and the environment (Juárez – Adauta, [4]). There is growing interest in understanding what factors promote lasting and meaningful happiness over time, beyond momentary satisfaction or ephemeral pleasure. The history of life satisfaction is a complex and evolving story that reflects the interaction between philosophical, religious, scientific, and cultural concepts over the centuries. The contemporary understanding of life satisfaction remains a topic of ongoing research and debate in the social sciences and the study of human well-being. Life satisfaction theory is an area of study within psychology and social sciences that focuses on understanding the factors that contribute to people’s subjective well-being and sense of satisfaction with life (Duche-Pérez, et al. [5]). This theory explores how experiences, emotions, beliefs, and behaviors influence a person’s overall evaluation of their own life. Here I present some important theories about life satisfaction.

Hedonic Adaptation Theory

This theory suggests that people have a relatively stable level of well-being over time, despite changes in external circumstances (Peña Cárdenas, et al. [6]). It is postulated that individuals tend to adapt to positive or negative changes in their lives, meaning that after a time, the emotional impact of an event (whether good or bad) tends to decrease, and the level of satisfaction returns to normal. a point close to the initial state.

Human Needs Theory

Based on Maslow’s hierarchy of needs, this theory postulates that people experience life satisfaction when their fundamental needs are satisfied in a hierarchical order (Pienkowski, et al. [7]). Basic needs include food, shelter, and safety, followed by needs for social relationships, self-esteem, and self-actualization. When these needs are met, people tend to experience greater satisfaction and well-being.

Self-Determination Theory

This theory proposes that life satisfaction is associated with the degree to which people experience autonomy, competence, and meaningful social relationships in their lives (Martínez, et al. [8]). Life satisfaction is maximized when people can make autonomous decisions that are aligned with their personal values and goals, when they feel competent in the activities they perform, and when they have satisfying social connections.

Attachment and Social Relationships Theory

This theory emphasizes the importance of social and emotional relationships in life satisfaction (Sanchez -García, et al. [9]). According to this perspective, secure and supportive relationships, particularly in childhood and young adulthood, promote greater life satisfaction in adulthood. People with close, positive relationships tend to report higher levels of well-being and global satisfaction.

Flow Theory

This theory refers to the mental state of flow , which occurs when a person is completely immersed in a challenging but achievable activity (Özcan, [10]). During flow, people experience a sense of total concentration, enjoyment, and satisfaction, which contributes significantly to their well-being and life satisfaction. In addition to these specific theories, there are also multidimensional approaches that consider multiple aspects of human life (such as physical health, quality of relationships, purpose and meaning in life, among others) to comprehensively understand life satisfaction (Schnettler, et al. [11]). Together, these theories and approaches offer a holistic view of life satisfaction, showing that it is the result of a complex interaction between internal and external factors that affect people’s perception and evaluation of their own existence. There are several models and approaches to understand life satisfaction from different perspectives (Portero de la Cruz, et al. [12]). These models provide conceptual frameworks for understanding how the various dimensions of human life contribute to overall well-being and satisfaction. The World Health Organization Quality of Life Model (WHOQOL, [13]) addresses life satisfaction from a broad and multidimensional perspective (Bellini, et al. [14]). This model considers four main domains that influence quality of life and satisfaction. The WHOQOL provides a comprehensive framework for assessing and improving life satisfaction from multiple perspectives.

Life Satisfaction Model

Richard E. Diener, one of the pioneers in the study of happiness and life satisfaction, proposed a life satisfaction model that considers multiple components (Vela Quintero, et al. [15]). This model recognizes that life satisfaction is influenced by the subjective evaluation of life as a whole and by the emotions and meanings associated with daily experiences.

Self-Determination Model

The Self-Determination Theory proposed by Deci and Ryan posits that life satisfaction is related to the degree to which people experience autonomy, competence, and satisfactory social relationships (Fernández-Portero, et al. [16]). This model emphasizes the importance of meeting basic psychological needs to promote well-being and personal satisfaction.

Life Satisfaction Levels Model

This model considers that life satisfaction can be influenced by individual, contextual and cultural factors (Vallbona, et al. [17]). There are several levels of satisfaction.

Attachment and Social Relationships Model

This model highlights the importance of social and emotional relationships in life satisfaction (Wright, [18]). Secure and supportive relationships are postulated to contribute significantly to people’s overall well-being and satisfaction.

Agency and Opportunity Capacity Model

This approach, developed by Amartya Sen and Martha Nussbaum, considers that life satisfaction is related to people’s ability to choose and pursue valuable opportunities in life (such as education, health, work significant, etc.) (Mutiu, [19]). These models show the diversity of theoretical and practical perspectives to understand and evaluate life satisfaction, recognizing that it is a complex construct that encompasses multiple interrelated dimensions of the human experience (Loewe, et al. [20]). Life satisfaction is a multidimensional concept that encompasses several important dimensions that influence well-being and the global perception of happiness and personal fulfillment (Huertas-Delgado, et al. [21]). These dimensions represent different aspects of life that contribute significantly to overall satisfaction.

Health and Physical Well-being

Physical health plays a fundamental role in life satisfaction (García, et al. [22]). This dimension includes the subjective evaluation of one’s own health, the ability to perform daily activities without difficulty, the absence of chronic diseases or significant disabilities, and the general perception of physical well-being.

Emotional and Mental Well-being

The emotional and mental dimension refers to the ability to experience positive emotions and effectively manage stress and negative emotions (Addabbo, et al. [23]). It includes aspects such as self-esteem, emotional resilience, the ability to experience joy and satisfaction in everyday life, and emotional balance.

Social Relationships and Social Support

The quality of interpersonal relationships and social support are important determinants of life satisfaction (Pena, et al. [24]). This dimension considers the presence and quality of meaningful relationships with family, friends, partners, and the community, as well as the sense of belonging and the ability to receive and offer emotional support.

Personal Achievement and Development

Life satisfaction is influenced by personal achievement and the sense of personal development (Echenique, et al. [25]). This dimension includes the achievement of personal and professional goals, a sense of personal progress and growth, self-direction, and the ability to pursue activities that are meaningful and rewarding.

Material Quality of Life

Although it is not the only factor, life satisfaction can also be affected by the economic situation and material conditions (Carmona, et al. [26]). This dimension includes factors such as income level, financial security, access to basic resources (housing, food, medical care), and job stability.

Sense of Purpose and Meaning

Feeling that life has a purpose and meaning is essential for life satisfaction (Ríos, et al. [27]). This dimension relates to clarity of personal values and goals, connection to something larger than oneself (such as spiritual or community beliefs), and a sense of meaningful contribution to the world.

Environment and Quality of Life

Life satisfaction is also influenced by the physical and social environment in which a person lives (Kucel, et al. [28]). This dimension considers factors such as the quality of the natural environment (air, water, landscapes), the safety and accessibility of the community, and the quality of available public and cultural services. These dimensions interact with each other and jointly contribute to a person’s overall evaluation of their life satisfaction (Brioso, et al. [29]). It is important to recognize that life satisfaction is a subjective and multifaceted concept, and that different people may value these dimensions differently based on their individual values, experiences, and circumstances. However, life satisfaction has not been reviewed at the organizational level. Therefore, the comparison between life satisfaction and job satisfaction at a global and local level is the objective of this work. Are there significant differences between life satisfaction and job satisfaction at global and local levels with respect to public universities? The premise that guides this work suggests that life satisfaction has its correlation in job satisfaction observable in organizations and institutions. In this way, differences inherent to the context in which the literature has been published are expected.

Method

Selection of Measurement Instruments: Validated and reliable instruments to measure life satisfaction and its dimensions. Standardized questionnaires such as the Satisfaction with Life Index (SWLS), the Subjective Well-being Scale (SWB) or the WHOQOL-BREF Quality of Life Questionnaire. Data collection using appropriate methods, such as online surveys, structured interviews or focus groups. Obtaining informed consent from participants and guaranteeing the confidentiality and anonymity of the data.

Statistical Analysis

Use of techniques to analyze the data collected. Conducting descriptive analyzes to summarize life satisfaction scores and inferential analysis to explore relationships between predictor variables and life satisfaction. Identification of predictive factors that most influence life satisfaction according to the results of the analysis. This may include variables such as physical health, emotional well-being, social relationships, socioeconomic level, and other aspects relevant to your study. Interpretation and discussion of results in the context of existing literature and discuss the practical implications of your results. Ethical considerations at each stage of your research, including informed consent, privacy and confidentiality of participants, and responsible use of the data collected.

Results

A comparative table that contrasts typical findings related to life satisfaction and job satisfaction (Table 1). These two concepts are closely related but represent different aspects of a person’s well-being and quality of life: Autonomy and Participation in Decision Making: Employees who have a certain degree of autonomy and participation in decision making related to their work tend to be more satisfied in their work roles. Fostering a positive and supportive organizational climate, where diversity is valued and open communication is promoted, can significantly improve job satisfaction. The perception of fair compensation and the availability of additional benefits (such as health insurance, bonuses, etc.) are determining factors in job satisfaction in Mexico.

Table 1: Comparison of the findings of life satisfaction and job satisfaction.

biomedres-openaccess-journal-bjstr

Note: Source: Prepared with the literature review

Professional Development

The opportunity for professional growth and development within the organization influences job satisfaction. Employees value opportunities for training, promotion, and skill development. Access to development and professional growth opportunities is valued by Mexican employees. Lack of development prospects can negatively affect job satisfaction. Designing jobs that promote autonomy, task variety, and a sense of purpose is crucial to improving job satisfaction. The ability to achieve a satisfactory balance between job demands and personal responsibilities is positively associated with job satisfaction in many cultures.

Improvement Strategies

The results suggest that organizations should implement effective strategies to improve job satisfaction, such as promoting a supportive culture, offering development opportunities, and ensuring fair and equitable compensation. To improve job satisfaction, organizations must implement effective strategies that address the key factors identified. This may include human resources policies focused on employee well-being, professional development programs, improving the organizational climate, and appropriate recognition for work performed.

Determinants of Job Satisfaction

Findings show that factors such as work environment, work-life balance, career development and recognition are critical to job satisfaction across cultures. Studies have identified several determinants of job satisfaction, including the work environment, the quality of interpersonal relationships, work-life balance, professional development opportunities, and recognition for work performed.

Impact of Organizational Culture

Organizational culture in Mexico, which can include values such as hierarchy and loyalty, influences job satisfaction. Organizations that promote an environment of respect and collaboration tend to have more satisfied employees. Job satisfaction is closely related to the personal and emotional well-being of individuals. Employees spend a significant part of their lives at work, so it is important that this experience is positive and rewarding. Job satisfaction can be influenced by specific cultural aspects of each country or region, such as the importance of hierarchy, interpersonal relationships, and organizational norms. Global studies suggest that the work environment, including the relationship with coworkers and superiors, has a significant impact on job satisfaction.

Productivity and Performance

Satisfied employees tend to be more productive and engaged in their work tasks, which contributes to the overall performance of the organization. There is a positive relationship between job satisfaction and organizational performance. Satisfied employees tend to be more engaged, productive, and less likely to leave the organization, which positively impacts business results. Organizations must invest in training and development programs to enable the professional growth of employees and meet their development needs. The perception of being recognized and rewarded appropriately for work performed is critical to job satisfaction around the world.

Interpersonal Relationships

Relationships with colleagues and superiors play an important role in job satisfaction in Mexico. The sense of community and support at work contributes positively to employee well-being. Job satisfaction is associated with higher employee retention. Workers who feel valued and satisfied are less likely to leave the organization.

Health and Wellbeing: Job dissatisfaction can have negative effects on employees’ physical and mental health, including stress, anxiety, and burnout. Given the economic and social context in Mexico, job stability and job security are key aspects that affect job satisfaction. The perception of job satisfaction may vary depending on the cultural context and social norms of each country or region. It is important to consider these differences when developing strategies to improve job satisfaction in multicultural environments.

Discussion

Job satisfaction is a complex phenomenon that is influenced by a variety of contextual and personal factors (Barba-Sánchez, et al. [30]). Findings both globally and in Mexico highlight the importance of creating healthy work environments, promoting professional development, and ensuring equity and recognition at work to improve employee satisfaction and well-being. The discussion of the findings on job satisfaction is crucial to understand the importance of this concept in the organizational and social context (Aliabadi, et al. [31]). To advance the understanding of job satisfaction, it is important to explore innovative approaches and study cultural differences in the perception of job satisfaction (Bălţătescu, [32]). Furthermore, future research could focus on specific strategies to improve job satisfaction in different organizational and social contexts. Findings on job satisfaction highlight the importance of creating positive and stimulating work environments that promote employee well-being and engagement (Polo-Vargas, et al. [33]). Addressing job satisfaction effectively can benefit both individuals and organizations as a whole (Madrid-Solorza, et al. [34]). Job satisfaction is a crucial factor that influences the emotional well-being, commitment, and productivity of employees in any organization (Çetinkaya, et al. [35]). It is a fundamental aspect to promote a healthy and effective work environment (Vieira, et al. [36]). Although significant progress has been made in the study of job satisfaction, there are still areas that require additional research (Loewe, et al. [37-44]). Continued studies are needed to better understand the factors that influence job satisfaction and to develop effective workplace interventions.

Conclusion

The conclusions on job satisfaction highlight the main ideas and findings obtained from the research and study of this topic. Here are some key takeaways about job satisfaction: Findings on job satisfaction emphasize the importance of promoting work environments that foster employee well-being and satisfaction. Improving job satisfaction not only benefits individuals, but also contributes to the success and sustainability of organizations in a competitive business environment.

Follow us on: Biomedical Journal Impact Factor: https://biomedres.us

https://scholar.google.com/citations?user=OFtUOZYAAAAJ&hl=en
https://www.base-search.net/Search/Results?lookfor=Biomed+Journal+of+Scientific+%26+Technical+Research&l=en&refid=dcsuggesten
https://citefactor.org/journal/2574-1241/biomedical-journal-of-scientific-technical-research
https://ideas.repec.org/s/abf/journl.html
https://econpapers.repec.org/article/abfjournl/
https://www.ncbi.nlm.nih.gov/nlmcatalog/101723284
https://bjstr.org/
https://bjstr.org/about.php
https://biomedres.us/reprints.php
https://biomedres.net/submit-manuscript.php

Journals on medical research |BJSTR

Hormonal Characteristics of Patients with Arterial Hypertension with Various Tumors of the Adrenal Glands

Relevance

Adrenal tumors occur in approximately 4–10% of the general population, and their incidence increases with age [1-4] as a result because of spread use of imaging techniques. They are most often discovered incidentally during imaging performed as part of the diagnosis of unrelated conditions. The peak incidence occurs in the seventh decade of life [4,5]. All patients found to have an adrenal tumor should undergo a detailed clinical, biochemical, and radiological examination to select those who require surgical treatment [1-4]. Many adrenal tumors (about 80%) are adrenal adenomas, hypertrophy, or nodular adrenal hyperplasia. Other lesions include pheochromocytomas (PHEC) (3–6%), adrenocortical carcinomas (ACC) (2–5%), adrenal metastases (1–2%), mesenchymal tumors (myelolipomas, lipomas, hemangiomas, sarcomas), lymphomas, cysts. , ganglioneuromas [6- 14], other rare tumors [15] or collision tumors consisting of at least two different histopathological types [7,16]. Purpose of the study– to study the hormonal characteristics of patients with arterial hypertension with various tumors of the adrenal glands.

Material and Research Methods

The material for the study was the analysis of 89 cases of hypertension of adrenal origin according to retrospective data for 2 years (from 2021 to 2024) in the clinic of the Russian National Research Medical Center of Endocrinology of the Ministry of Health of the Republic of Uzbekistan in various departments: neuroendocrinology, endocrine surgery. The following groups of patients were formed: 1 gr.–patients with corticosteroma (13patients), 2 g.–patients with aldosteroma (8patients), 3gr.–patients with pheochromocytoma (21 patients), 4 gr. – adrenal incidentaloma (17 patients), 5 gr.–patients with adrenal hyperplasia (comparison group-30 patients).

Research Methods Included

1. General clinical (examination of endocrine and ocular status)
2. Instrumental – ECG, CT/MRI of the Sella turcica and adrenal glands
3. Ultrasound of internal and genital organs, etc.)
4. Hormonal blood tests (STH, IGF-1, LH, FSH, PRL, TSH, ACTH, prolactin, testosterone, estradiol, progesterone, cortisol (IKLA method) and others. In addition, the postoperative material was subjected to histological diagnosis at the Republican Specialized Medical Center of the Ministry of Health of Uzbekistan named after Academician Y. Kh. Turakulova (Histology Department, candidate of medical sciences Issaeva S.S.).

Research Results

Thus, out of 89 patients, 22 (24.7%) were patients aged 13 to 29 years. There were 26 patients (29.2%) aged 30 to 44 years. From 45 to 59 years old–33 (37.0%), and over 60–only 8 patients (8.9%). So, among the tumors of the adrenal glands (H) with hypertension, the most common was pheochromocytoma-21 patients (23.6%), in 2nd place were patients with incidentaloma H-17 cases (19.0%), in 3rd place in frequency were patients with corticosteroma-13 (14.6%) and in last place were patients with aldosteroma-8 cases (8.9%). Patients with hyperplasia made up the control group, although their number was dominant-30 patients (33.7%). According to the analysis of retrospective data from hormonal studies (basal levels taken in the morning on an empty stomach), the following data were obtained for the groups. In the Table 1 shows the average hormone values in 1 group of patients. As can be seen from Table 1, in patients with corticosteroma there was a significant increase in the average values of cortisol and prolactin (P<0.05), while the basal levels of ACTH, renin and aldosterone were not significantly changed. Table 2 shows the average value of blood plasma hormones in patients of group 2 (n=8). As can be seen from Table 2, in patients with aldosteroma there was a significant increase in the average values of plasma renin and aldosterone (P<0.05), while the basal levels of ACTH, cortisol, and testosterone were not significantly changed. Table 3 shows the average value of blood plasma hormones in patients of group 3 (n=21).

Table 1: Average value of blood plasma hormones in patients of group 1 (n=13).

biomedres-openaccess-journal-bjstr

Note: P – Significance of differences compared to the control group.

Table 2: Average value of blood plasma hormones in patients of group 2 (n=8).

biomedres-openaccess-journal-bjstr

Note: P – significance of differences compared to the control group.

Table 3: Average value of blood plasma hormones in patients of group 3 (n=21).

biomedres-openaccess-journal-bjstr

Note: P – Significance of differences compared to the control group.

As can be seen from Table 3, in patients with pheochromocytoma, the basal levels of ACTH, cortisol, prolactin, testosterone and cortisol were not significantly changed (P>0.05), since for these patients the most informative determination of catecholamines in daily urine (see below in subchapter 3.2). Table 4 shows the average value of blood plasma hormones in patients of group 4 (n=17). As can be seen from Table 4, in patients with adrenal incidentaloma, the basal levels of ACTH, cortisol, prolactin, testosterone and cortisol were not significantly changed (P>0.05). Table 5 shows the average value of blood plasma hormones in patients of group 5 (n=30). As can be seen from Table 5, in patients with adrenal hyperplasia, the basal levels of ACTH, cortisol, prolactin, testosterone and cortisol were not significantly changed (P>0.05). So, according to the analysis of retrospective hormonal data (basal levels taken in the morning on an empty stomach), the following data were obtained by group. In patients with corticosteroma, there was a significant increase in the average values of cortisol and prolactin (P<0.05), while the basal levels of ACTH, renin and aldosterone were not significantly changed. In the group of patients with aldosteroma, there was a significant increase in the average values of plasma renin and aldosterone (P<0.05), while the basal levels of ACTH, cortisol, and testosterone were not significantly changed. It was typical for patients with pheochromocytoma that the basal levels of ACTH, cortisol, prolactin, testosterone, and cortisol were not significantly changed (P>0.05), since for these patients the most informative determination of catecholamines in 24-hour urine.

Table 4: Average value of blood plasma hormones in patients of group 4 (n=17).

biomedres-openaccess-journal-bjstr

Note: P – Significance of differences compared to the control group.

Table 5: Average value of blood plasma hormones in patients of group 1 (n=30).

biomedres-openaccess-journal-bjstr

Note: P – Significance of differences compared to the control group.

In patients with adrenal incidentaloma, basal levels of ACTH, cortisol, prolactin, testosterone, and cortisol were not significantly changed (P>0.05). In patients with adrenal hyperplasia, basal levels of ACTH, cortisol, prolactin, testosterone, and cortisol were not significantly changed (P>0.05). At the same time, patients in group 3 had a significant increase (P<0.05) in the level of cortisol in daily urine. In patients of group 3 there was a significant increase (P<0.05) in the levels of catecholamines in daily urine (adrenaline, norepinephrine, dopamine). Thus, hormonal blood tests have shown how informative they are in diagnosing adrenal diseases. In the case of hormonally active mass formations of the adrenal glands, assessment of basal hormone levels can be of great diagnostic value in case of corticosteromas, aldosteromas, since these patients have significantly increased values of plasma cortisol and aldosterone, respectively. For patients with adrenal hyperplasia and incidentaloma, these studies turned out to be of little information.

Conclusion

According to the analysis of retrospective data on hormonal parameters of blood plasma (basal levels taken in the morning on an empty stomach) and urine, the most significantly significant differences in their content were found in patients with corticosteroma, aldosteroma and pheochromocytoma (P < 0.05).

Follow us on: Biomedical Journal Impact Factor: https://biomedres.us

https://scholar.google.com/citations?user=OFtUOZYAAAAJ&hl=en
https://www.base-search.net/Search/Results?lookfor=Biomed+Journal+of+Scientific+%26+Technical+Research&l=en&refid=dcsuggesten
https://citefactor.org/journal/2574-1241/biomedical-journal-of-scientific-technical-research
https://ideas.repec.org/s/abf/journl.html
https://econpapers.repec.org/article/abfjournl/
https://www.ncbi.nlm.nih.gov/nlmcatalog/101723284
https://bjstr.org/
https://bjstr.org/about.php
https://biomedres.us/reprints.php
https://biomedres.net/submit-manuscript.php

Journals on Biomedical Science |BJSTR

Sarcopenia in Elderly Patients with Type 2 Diabetes Mellitus as Risk Factor

Editorial

Over the past ten years, the number of elderly patients with type 2 diabetes mellitus (T2DM) has increased dramatically due to the world’s fast aging population. The two primary pathways in the pathophysiology of type 2 diabetes are insulin resistance in target tissues and insulin insufficiency, which is brought on by islet β cell failure [1]. Apart from the triadvirate of muscle, liver, and β cell, other factors that contribute to the development of glucose intolerance in type 2 diabetics include fat cell (accelerated lipolysis), gastrointestinal tract (incretin deficiency/resistance), α-cell (hyperglucagonemia), kidney (increased glucose reabsorption), and brain (insulin resistance) [2]. In addition, a significant prevalence of malnutrition is linked to diabetes in elderly patients [3]. In elderly patients with diabetes, malnutrition may have a detrimental effect on the pathophysiology of the condition as well as the morbidity and death rate [4]. Due to the consequences of glucotoxicity, increased inflammation and oxidative stress, and diabetic neuropathy, elderly people with T2DM are more likely to experience decreased skeletal muscle mass, muscle weakness, and poor physical function [5,6]. As a result, maintaining muscle mass or function is crucial for senior diabetes mellitus patients [7]. Higher prevalence rates of comorbidities, such as malignant tumors, chronic kidney disease, and chronic heart failure, are also present in elderly individuals with diabetes mellitus [8]. These conditions might affect appetite, cause weight loss, and cause a reduction in food consumption.

Sarcopenia, or malnutrition, is a significant geriatric condition linked to diabetes mellitus in the elderly [9]. Muscle weakness or diminished physical function linked to aging-related muscle mass loss, chronic inflammation, elevated oxidative stress, reduced physical activity, and malnutrition are the hallmarks of sarcopenia [10]. On the other hand, malnutrition is a state marked by deficiencies in calories and protein associated with appetite reduction brought on by age, metabolic disorders, or malabsorption [11]. Additionally, recent development of diagnostic criteria for cachexia has drawn attention to the significance of the illness, wherein inflammation resulting from malignant tumors and chronic diseases is identified as an underlying pathological condition [12]. A reduction in everyday activities, fractures of the bones, admission to the hospital, long-term hospitalization, greater healthcare costs, and a rise in death rates are all associated with sarcopenia, malnutrition, and cachexia [13]. Therefore, it is crucial to diagnose and treat these disorders in elderly patients with diabetes mellitus as soon as possible. Patients with T2DM are more sarcopenic than the other hospitalized patients, yet they are malnourished to a similar extent [14,15].

A worse prognosis is determined by comorbidities, inflammation, and sarcopenia [15]. Patients may have a better prognosis if malnutrition and sarcopenia are actively and promptly identified, followed by appropriate treatment [15]. Bioelectrical impedance analysis (BIA) is a method used to detect changes in body composition. The data indicates that BIA may not be the best method for differentiating between older people with and without diabetes mellitus because of its susceptibility to several variables, such as variations in glucometabolic and cardiovascular regulation [16]. Recently, it showed that elderly people diagnosed with T2DM who also have sarcopenia or malnutrition are more likely to require longer hospital stays and to die within a year of being released from the hospital [17]. Another, it is unknown how vitamin D deficienty (VDD) affects both major and tiny nerve fiber damages in older T2DM patients [18]. In fact, there is a direct correlation between VDD and an increased risk of diabetic peripheral neuropathy (DPN). VDD may influence big nerve fibers, which may facilitate the production of DPN [18].

Sarcopenia is becoming more common in elderly with T2DM patients, which is concerning for public health because it significantly lowers quality of life. A sufficient attention should be given also to sarcopenia as risk factors in elderly with T2DM. A multidisciplinary approach including medication, diet, exercise, and the right daily routine is necessary for effective diagnosis and management. Therefore, further study is required to comprehend the underlying mechanisms and enhance diagnostic and treatment approaches in elderly with T2DM.

Disclosure StatementGo to

The authors declare that there are no conflicts of interest.

Follow us on: Biomedical Journal Impact Factor: https://biomedres.us

https://scholar.google.com/citations?user=OFtUOZYAAAAJ&hl=en
https://www.base-search.net/Search/Results?lookfor=Biomed+Journal+of+Scientific+%26+Technical+Research&l=en&refid=dcsuggesten
https://citefactor.org/journal/2574-1241/biomedical-journal-of-scientific-technical-research
https://ideas.repec.org/s/abf/journl.html
https://econpapers.repec.org/article/abfjournl/
https://www.ncbi.nlm.nih.gov/nlmcatalog/101723284
https://bjstr.org/
https://bjstr.org/about.php
https://biomedres.us/reprints.php
https://biomedres.net/submit-manuscript.php

Journals on Biomedical Engineering |BJSTR

Autism Spectrum Disorder (An Update)

Introduction

“Autism” derived from the Greek word “autos, or “self”, refers to someone who lives in a world of his own. Leo Kanner [1], first introduced the term autism as a diagnostic label to define a specific syndrome in young children characterized by early onset of impaired social and emotional relationship. Since then, autism is now recognized as Autism Spectrum Disorder (ASD) which is a neurodevelopmental disorder defined by social communication impairments and restricted, repetitive behaviors [2,3]. Early diagnosis is important because early diagnosis and early intensive behavioral intervention programs have been shown to improve functional outcomes and quality of life [4,5]. Unfortunately, early diagnosis of ASD can be challenging and despite much earlier concerns by caregivers for possible ASD, it is often diagnosed after the age of three [6,7]. The challenges in early diagnosis might be related to complexity and heterogeneity of ASD, leading to different presentations of individuals with ASD. ASD is also associated with significant psychiatric and medical comorbidity including language disorder, intellectual disability, sleep problems, anxiety, depression, obsessive compulsive disorder, attention deficit hyperactivity disorder and epilepsy [8-10]. The exact etiology of ASD is unknown but it is thought to have strong and complex genetic underpinnings with environmental factors modulating the phenotypic expression [11,12].

Epidemiology

Among eight years old in the U.S., the prevalence is 2.3% in 2018 compared to 1.8% in 2008 with male to female ratio of 4:1 [13]. Black children with ASD tend to present at older ages than white children and often present with intellectual disability [14]. Several factors have likely contributed to the increased prevalence rate which includes change in the diagnostic criteria, increased awareness and increased access to services [15-19]. Children who often receive a late diagnosis include: females, ethnic minorities, low socioeconomic status, those from families who do not English, and those without language delay [20]. There is a concern that females are under-diagnosed and diagnosed at later age because of the belief that ASD occurs primarily in males [21]. There is also a possibility that the current diagnostic procedures are less sensitive to the presence of ASD among females or that females are more able to minimize ASD symptoms including social communication impairment (via camouflaging) [22,23]. Camouflaging can, for example, include suppression of repetitive movement, forcibly sustained eye contact or the use of learnt formulaic phrases [24].

Clinical Presentation

The key diagnostic features of ASD include deficit in social communication and restricted, repetitive pattern of behavior, interest, or activities. The presenting symptoms of ASD depend on age, language level, and cognitive functions. Some signs and symptoms of ASD may present between 6 and 12 months of age but reliable diagnosis, in many cases, can be made around 24 months of age [25,26]. Spoken language delay and social deficit are the most prominent features in children with ASD who are younger than three years old. Language delay without compensatory pointing or gesturing might help to differentiate ASD from expressive language delay [27,28]. The inability to coordinate one’s own attention between another person and distant object to share attention (joint attention) by 15 months of age should indicate the need for ASD evaluation [27,28]. Repetitive behavior and restricted range of interest may be less apparent in younger children. Many children with ASD have several coexisting conditions that impact the presentation and the level of impairment. The prevalence of ASD is higher in individuals with special health needs including people with visual impairment, hearing impairment, intellectual disability, and Fragile-X Syndrome [29-31]. Furthermore, psychiatric and medical comorbidity are very common in ASD population, particularly attention deficit hyperactivity disorder, anxiety, depression, aggression, self-injury, sleep difficulties, feeding problem and epilepsy [32-36]. Additionally, almost 30% of people with ASD present with special skills that exceed what seems humanly possible (savant skills) most commonly manifesting in mental arithmetic, art, and memory skills [37,38].

Screening

Many public health systems have attempted to identify very young children with ASD in the general population. However, screening tools have not been sensitive enough to effectively identify most of children with ASD in the general population in whom parents have not been already recognized a delay [39]. When parent have expressed concern, screening instruments become effective for predicting ASD in children as young as 18 months of age [40]. The American Academy of Pediatrics recommends that all children be screened for ASD at 18 and 24 months of age [41]. The modified-checklist for autism in toddlers, revised (M-CHAT-R), a 20 item screening questionnaire, is one of the frequently used ASD screening tools in primary care settings. It is designed to identify children 16 to 30 months who are at risk for ASD [42]. Children who have a positive screening test for ASD should undergo a comprehensive evaluation and referral for developmental services. Children who receive consistent pediatric care, are in frequent contact with grandmothers, and who have older siblings receive earlier diagnoses than those who do not [43,44].

Diagnosis

For definitive diagnosis of ASD, a comprehensive assessment by a multidisciplinary team using standardized diagnostic tools to exclude other conditions, identifying any comorbid conditions and to assess the child’s overall level of function [45-47]. The most widely used diagnostic tools for ASD are the Autism Diagnostic Observation Schedule, second edition (ADOS-2) and the Autism Diagnostic Interview, Revised (ADI-R) [48]. The American Academy of Pediatrics and The American College of Medical Genetics and Genomics recommend genetic testing for individuals diagnosed with ASD [49]. In particular, chromosomal microarray is recommended to scan the genome for copy number variants. Adults seeking first diagnosis of ASD are typically have comorbid psychiatric disorders but are not intellectually disabled [50]. While brief self-reports do not have adequate specificity, versions of ADOS, and Social Responsiveness Scale (SRS) are appropriate for verbally fluent adults [51,52].

Risk Factors

74-93% of ASD risk is heritable [53]. Models for genetic risk in ASD propose that complex inheritance with additive contributions from common variants that individually make small contributions to risk as well as rare variants that have larger effect sizes [54]. Several environmental risk factors have also been identified including advanced maternal or paternal age, prenatal valproic acid exposure, preterm birth, low birth weight, small for gestational age status, and large for gestational age status [55-58].

Behavioral Treatment

Early behavioral intervention for at least 25 hours per week is recommended for young children with ASD [59]. Applied Behavioral Analysis is the cornerstone for early intensive behavioral interventions, which utilize applied behavior analytic principles of learning to teach children the appropriate skills in natural settings, have been shown to improve children’s language, play, and social communications [60,61]. Cognitive behavioral therapy can be very effective in reducing anxiety and depressive symptoms in individuals with ASD [62]. In school-age children without intellectual disabilities, social skills training can be useful in improving social skills and emotional dysfunctions [63]. Providing behavioral, speech, occupational and physical therapy in the school setting together with parent training resulted in improved language skills and decreased disruptive behavior in children with ASD [64].

Pharmacological Treatment

No medication is available to target core symptoms of ASD, but medications can be useful to target specific maladaptive behaviors which did not respond to intensive behavioral therapy. In addition medications can be useful to target comorbid psychiatric conditions [27]. Risperidone and aripiprazole have shown to improve symptoms of irritability and agitation in children and adolescents with ASD and are the only medications approved by the U.S. Food and Drug Administration for the treatment of ASD-Associated Irritability [65,66]. Psychostimulants (methylphenidate) and non-stimulants (atomoxetine and guanfacine) have shown to be effective in the management of ADHD symptoms in individuals with ASD [67]. Melatonin may also be useful for sleep disturbances [68]. The current evidence does not support the use of any supplement for the treatment of core ASD symptoms but N-acetylcysteine and sulforaphane have demonstrated some efficacy for behavioral and emotional symptoms associated with ASD [69].

Prognosis

Current studies show that there has been a significant improvement in outcomes of individuals with ASD in the current studies compared to the old data [70]. However, adults with ASD continue to be less likely to live independently or be employed and more likely to use mental health services compared to individuals without ASD diagnosis [71]. Better outcomes are reported in individuals with ASD with higher cognitive abilities, had earlier referrals, more intensive early behavioral interventions and fewer pharmacological interventions [72,73]. Mortality rates are approximately 2-fold higher for individuals with ASD compared to general populations and suicide rates are much higher in this population compared to the general population [74,75].

Conclusion

Life for many children and adults with ASD have improved compared to when autism was first described by Leo Kanner. More individuals with ASD can talk, read, graduate from school and live independently. ASD affect over 2% of children and adults in the U.S. The evidence continues to support early intensive behavioral interventions delivered by a multidisciplinary team as a first-line therapy, while comorbid mental health conditions such as ADHD, anxiety and aggression may be treated by specific behavioral therapy or medicine.

Follow us on: Biomedical Journal Impact Factor: https://biomedres.us

https://scholar.google.com/citations?user=OFtUOZYAAAAJ&hl=en
https://www.base-search.net/Search/Results?lookfor=Biomed+Journal+of+Scientific+%26+Technical+Research&l=en&refid=dcsuggesten
https://citefactor.org/journal/2574-1241/biomedical-journal-of-scientific-technical-research
https://ideas.repec.org/s/abf/journl.html
https://econpapers.repec.org/article/abfjournl/
https://www.ncbi.nlm.nih.gov/nlmcatalog/101723284
https://bjstr.org/
https://bjstr.org/about.php
https://biomedres.us/reprints.php
https://biomedres.net/submit-manuscript.php

Open access clinical and medical journal |BJSTR

Frequency of Urinary Tract Infection in Females with Preterm Labor

Introduction

Preterm labor is defined as the onset of labor before 37 completed weeks of pregnancy and is a leading cause of neonatal morbidity and mortality worldwide [1]. The substantial increase in shortened gestations noted in the last decades occurred late in the preterm period, between 34 and 36 weeks (late preterm), and in deliveries in weeks 37 and 38 (early term) [2]. Preterm birth is the main cause of morbidity and mortality during the perinatal period. Classical risk factors are held responsible for only 1/3 of preterm births and no current intervention has produced an appreciable reduction of this event [3]. Various maternal demographic, behavioral, and clinical characteristics have been associated with PTB including maternal race/ethnicity, maternal age at either extreme, cigarette smoking, low pre-pregnancy weight, psychosocial stress, previous PTB, and maternal intrauterine infections [4]. Pregnancy is a state associated with physiological, structural and functional urinary tract changes which promote ascending infections from the urethra [5].

The urinary tract is a common site of infection in humans. During pregnancy, urinary tract infection (UTI) is associated with increased risks of maternal and neonatal morbidity and mortality, even when the infection is asymptomatic [6]. Urinary tract infections (UTI) are among the most common bacterial infections in humans. UTI is commonly diagnosed based on clinical findings of bacteriuria (bacteria in midstream urine) counts of > 105colony forming units (cfu)/mL along with patient-reported symptoms. Lower bacterial counts are considered clinically significant when urine is collected by catheterization. Cystitis, or infection of the bladder, is typically accompanied by painful urination (dysuria), urgency, and frequent urination. A more severe infection of one or both kidneys, called pyelonephritis, is often accompanied by fever and flank pain, often in addition to symptoms of cystitis [6].

A study reported urogenital infections in the preterm labor included urinary tract infection in 36.7% of women [7]. Another study reported urogenital infection was seen in 19 women in PTB as 36.54 % [8]. Another study reported that frequency of UTI in females with preterm birth was 6.2% [4]. The rationale of this study is to determine frequency of urinary tract infection in females with preterm labor. The study is planned on local population as no local data is available and existing global data has no consensus i.e. 6.2%.[4] – 36.7% [7].Through this study if we find higher frequency then in future, it can be recommended that unlike the general population, all pregnant women was screened for UTI and asymptomatic bacteriuria should be treated in every case that is diagnosed to minimize the risk of preterm birth especially that is a leading cause of neonatal morbidity and mortality.

Review of Literature

Pregnancy causes numerous changes in the woman’s body that increase the likelihood of urinary tract infections (UTIs). Hormonal and mechanical changes can promote urinary stasis and vesicoureteral reflux. These changes, along with an already short urethra (approximately 3-4 cm in females) and difficulty with hygiene due to a distended pregnant belly, help make UTIs the most common bacterial infections during pregnancy. UTIs during pregnancy are associated with risks to both the fetus and the mother, including pyelonephritis, preterm birth, low birth weight, and increased perinatal mortality. In general, pregnant patients are considered immunocompromised UTI hosts because of the physiologic changes associated with pregnancy. These changes increase the risk of serious infectious complications from symptomatic and asymptomatic urinary infections even in healthy pregnant women. Oral antibiotics are the treatment of choice for asymptomatic bacteriuria and cystitis. The standard course of treatment for pyelonephritis is hospital admission and intravenous antibiotics. Antibiotic prophylaxis is indicated in some cases. Patients treated for symptomatic UTI during pregnancy should be continued on daily prophylactic antibiotics for the duration of their pregnancy. Annual health costs for UTI exceed $1 billion. Although the condition- specific cost of asymptomatic bacteriuria or UTI in pregnancy is unknown, screening for these conditions in pregnant women is cost-effective, compared with treating UTI and pyelonephritis without screening. Goals for future research include targeting low-income groups and women in developing countries for screening and early treatment, as well as determining whether a causal relation exists between maternal UTI and childhood neurologic consequences.

Definitions of Key Terms

Urinary Tract Infection

UTI is defined as the presence of at least 100,000 organisms per milliliter of urine in an asymptomatic patient, or as more than 100 organisms/mL of urine with accompanying pyuria (> 7 white blood cells [WBCs]/mL) in a symptomatic patient. A diagnosis of UTI should be supported by a positive culture for a uropathogen, particularly in patients with vague symptoms [9].

Asymptomatic Bacteriuria

Asymptomatic bacteriuria is commonly defined as the presence of more than 100,000 organisms/mL in 2 consecutive urine samples in the absence of declared symptoms. Untreated asymptomatic bacteriuria is a risk factor for acute cystitis (40%) and pyelonephritis (25-30%) in pregnancy. These cases account for 70% of all cases of symptomatic UTI in unscreened pregnant women.

Acute Cystitis

Acute cystitis involves only the lower urinary tract; it is characterized by inflammation of the bladder as a result of bacterial or nonbacterial causes (eg, radiation or viral infection). Acute cystitis develops in approximately 1% of pregnant patients, of whom 60% have a negative result on initial screening. Signs and symptoms include hematuria, dysuria, suprapubic discomfort, frequency, urgency, and nocturia. These symptoms are often difficult to distinguish from those due to pregnancy itself. Acute cystitis is complicated by upper urinary tract disease (ie, pyelonephritis) in 15 50% of cases.

Acute Pyelonephritis

Pyelonephritis is the most common urinary tract complication in pregnant women, occurring in approximately 2% of all pregnancies. Acute pyelonephritis is characterized by fever, flank pain, and tenderness in addition to significant bacteriuria. Other symptoms may include nausea, vomiting, frequency, urgency, and dysuria. Furthermore, women with additional risk factors (eg, immunosuppression, diabetes, sickle cell anemia, neurogenic bladder, recurrent or persistent UTIs before pregnancy) are at an increased risk for a complicated UTI.

Pathophysiology

Infections result from ascending colonization of the urinary tract, primarily by existing vaginal, perineal, and fecal flora. Various maternal physiologic and anatomic factors predispose to ascending infection. Such factors include urinary retention caused by the weight of the enlarging uterus and urinary stasis due to progesterone-induced ureteral smooth muscle relaxation. Blood-volume expansion is accompanied by increases in the glomerular filtration rate and urinary output. Loss of ureteral tone combined with increased urinary tract volume results in urinary stasis, which can lead to dilatation of the ureters, renal pelvis, and calyces. Urinary stasis and the presence of vesicoureteral reflux predispose some women to upper urinary tract infections (UTIs) and acute pyelonephritis. Calyceal and ureteral dilatation are more common on the right side; in 86% of cases, the dilatation is localized to the right. The degree of calyceal dilatation is also more pronounced on the right than the left (average 15 mm vs 5 mm). This dilatation appears to begin by about 10 weeks’ gestation and worsens throughout pregnancy. This is underscored by the distribution of cases of pyelonephritis during pregnancy: 2% during the first trimester, 52% during the second trimester, and 46% in the third trimester. [10] Although the influence of progesterone causes relative dilatation of the ureters, ureteral tone progressively increases above the pelvic brim during pregnancy. However, whether bladder pressure increases or decreases during pregnancy is controversial. Glycosuria and an increase in levels of urinary amino acids (aminoaciduria) during pregnancy are additional factors that lead to UTI. In many cases, glucose excretion increases during pregnancy over non pregnant values of 100 mg/day. Glycosuria is due to impaired resorption by the collecting tubule and loop of Henle of the 5% of the filtered glucose, which escapes proximal convoluted tubular resorption.

The fractional excretion of alanine, glycine, histidine, serine, and threonine is increased throughout pregnancy. levels of cystine, leucine, lysine, phenylalanine, taurine, and tyrosine are elevated in the first half of pregnancy but return to reference range levels by the second half. The mechanism of selective aminoaciduria is unknown, although its presence has been postulated to affect the adherence of Escherichia coli to the urothelium [11].

Etiology

Infection

E coli is the most common cause of urinary tract infection (UTI), accounting for approximately 80-90% of cases. It originates from fecal flora colonizing the periurethral area, causing an ascending infection. Other pathogens include the following [12]

• Klebsiella pneumoniae (5%)
• Proteus mirabilis (5%)
• Enterobacter species (3%)
• Staphylococcus saprophyticus (2%)
• Group B beta-hemolytic Streptococcus (GBS; 1%)
• Proteus species (2%)

Gram-positive organisms, particularly Enterococcus faecalis and GBS, are clinically important pathogens. Infection with S saprophyticus, an aggressive community-acquired organism, can cause upper urinary tract disease, and this infection is more likely to be persistent or recurrent. Urea-splitting bacteria, including Proteus, Klebsiella, Pseudomonas, and coagulase-negative Staphylococcus, alkalinize the urine and may be associated with struvite stones. Chlamydial infections are associated with sterile pyuria and account for more than 30% of atypical pathogens. GBS colonization has important implications during pregnancy. Intrapartum transmission that leads to neonatal GBS infection can cause pneumonia, meningitis, sepsis, and death. Current guidelines recommend universal vaginal and rectal screening in all pregnant women at 35-37 weeks’ gestation rather than treatment based on risk factors. Incidental documentation of GBS bacteriuria suggests a higher colonization count than is revealed by a screening vaginal or rectal culture. Beta-streptococcal colonization in the urine warrants immediate treatment and antibiotic prophylaxis when the patient presents in labor. Whether beta streptococci are associated with preterm labor is controversial. In a prospective study, McKenzie et al found no relation between beta-streptococcal bacteriuria and preterm labor, but they described the use of urinary antibodies to identify at-risk women [13]. In 2043 consecutive women, those with E coli antibodies at the initial visit and at 28 weeks’ gestation and women with beta-streptococcal antibodies at 28 weeks’ gestation had a significantly higher chance of preterm delivery.

Cesarean Delivery

Cesarean delivery is associated with UTI (increasing the likelihood 2.7-fold), but this association may be confounded by bladder catheterization or prolonged rupture of membranes (PROM). The incidence of symptomatic UTI is 9.3%, and that of asymptomatic bacteriuria is 7.6%.

Orthotopic Continent Urinary Diversion

Many women who, in the past, would have been counseled against pregnancy are now attempting pregnancy. In orthotopic continent diversion (OCD), an ileal-ascending colon conduit is made (OCD, Kock pouch) and reattached to the in-situ urethra (OCD) or a continent abdominal stoma (Kock pouch). Typical candidates are patients born with congenital exstrophy of the bladder in whom primary reconstruction has failed. Recurrent UTI and hydronephrosis are common because of outflow obstruction of the orthotopic stoma secondary to uterine compression or uterine prolapse. Indwelling catheterization of the urethra or continent stoma may be necessary, particularly during the later stages of pregnancy. In rare cases, a percutaneous nephrostomy tube or antegrade passage of a ureteral stent may be indicated.

Epidemiology

United States Statistics

The frequency of urinary tract infection (UTI) in pregnant women (0.3-1.3%) is similar to that in nonpregnant women [14]. Changes in coital patterns (eg, position, frequency, postcoital antibiotics) can offset recurrence in at-risk individuals. Overall, UTIs are 14 times more frequent in women than in men. This difference is attributed to the following factors:

• The urethra is shorter in women
• In women, the lower third of the urethra is continually contaminated with pathogens from the vagina and the rectum
• Women tend not to empty their bladders as completely as men do
• The female urogenital system is exposed to bacteria during intercourse

A difference between pregnant and non-pregnant women is that the prevalence of asymptomatic bacteriuria in pregnant women is 2.5-11%, as opposed to 3-8% in non-pregnant women. In as many as 40% of these cases, bacteriuria may progress to symptomatic upper UTI or pyelonephritis; this rate is significantly higher than that seen in non-pregnant women [15]. Several patient-level factors are associated with an increased frequency of bacteriuria during pregnancy. Compared with non-indigent patients, indigent patients have a 5-fold increased incidence of bacteriuria. The risk is doubled in women with sickle cell trait. Other risk factors for bacteriuria include diabetes mellitus, [1] neurogenic bladder retention, history of vesicoureteral reflux (treated or untreated), previous renal transplantation, [16] and a history of previous UTIs.

International Statistics

Versi et al described a higher prevalence of bacteriuria in pregnant white women (6.3%) than in pregnant Bangladeshi women (2%). Pregnancies that resulted in preterm deliveries were strongly associated with bacteriuria in white women; this association was not observed in Bangladeshi women. The authors hypothesized that the difference could be due to variation in hygiene practices and clothing. A large population-based study of nearly 200,000 pregnant Israeli women demonstrated a 2.5% rate of asymptomatic bacteriuria and a 2.3% rate of symptomatic UTI. [17] In this population, asymptomatic bacteriuria was found to have an association with multiple pregnancy complications, including hypertension, diabetes, intrauterine growth retardation, prolonged hospitalization, and preterm labor. The authors suggested that these findings may be a marker for intensity of prenatal care rather than a specific causal effect of the urinary infection. Additionally, their follow-up study examining women with symptomatic UTI showed a clear association between UTI and low birth weight and preterm delivery, a finding consistent with those of multiple previous investigations [18].

Age- and Race-Related Demographics

The prevalence of UTI during pregnancy increases with maternal age. A retrospective analysis of 24,000 births found the prevalence of UTI during pregnancy to be 28.7% in whites and Asians, 30.1% in blacks, and 41.1% in Hispanics. When socioeconomic status is controlled for, no significant interracial differences seem to exist. A survey-based analysis of self-reported UTI found similar trends. This study also considered Native American women and found the highest prevalence of UTI in this population (24.2%) as compared with Asian (10.3%), white (16.6%), Hispanic (18.3%), and black (20.3%) women [19]. UTI is associated with preterm delivery in persons of all races. The adjusted odds ratio in infants with very low birth weight is 2.8 in blacks and 5.6 in whites, adjusted for parity, body mass index, maternal age, marital status, cigarette smoking, education, and prenatal care. The overall relative risk of bacteriuria in blacks or whites is estimated at 1.5-5, and the relative risk of preterm birth in women with bacteriuria is 1.8-2.3.

Prognosis

In most cases of bacteriuria and urinary tract infection (UTI) in pregnancy, the prognosis is excellent. The majority of long-term sequelae are due to complications associated with septic shock, respiratory failure, and hypotensive hypoxia (ie, extremity gangrene). Maternal UTI has few direct fetal sequelae because fetal bloodstream infection is rare; however, uterine hypoperfusion due to maternal dehydration, maternal anemia, and direct bacterial endotoxin damage to the placental vasculature may cause fetal cerebral hypoperfusion. Untreated upper UTIs are associated with low birth weight, prematurity, premature labor, hypertension, preeclampsia, maternal anemia, and amnionitis [9]. A retrospective population-based study by Mazor- Dray et al showed that UTI during pregnancy is independently associated with intrauterine growth restriction, preeclampsia, preterm delivery, and cesarean delivery [20]. A prospective cohort study of pregnant patients also suggested an association between maternal UTI and childhood asthma.

Preeclampsia

A case-control study demonstrated an increased odds (1.22-fold) of preeclampsia in women with any UTI during pregnancy versus those without UTI [21]. A multicenter retrospective study found that the presence of UTI in pregnancy, particularly in the third trimester, is strongly associated with preeclampsia. Rates of preeclampsia in patients with UTI compared with those without reported UTI were 31.1% vs 7.8%, respectively (P < 0.001). The authors hypothesize that the increased maternal inflammatory burden from UTI enhances the risk of preeclampsia.

History

The presentation varies according to whether the patient has asymptomatic bacteriuria, a lower urinary tract infection (UTI; ie, cystitis) or an upper UTI (ie, pyelonephritis). Burning with urination (dysuria) is the most significant symptom in pregnant women with symptomatic cystitis. Other symptoms include frequency, urgency, suprapubic pain, and hematuria in the absence of systemic symptoms. The usual complaints of increased frequency, nocturia, and suprapubic pressure are not particularly helpful, because most pregnant women experience these as a result of increased pressure from the growing uterus, expanding blood volume, increased glomerular filtration rate, and increased renal blood flow [22]. Pyelonephritis symptoms on presentation vary. They often include fever (>38°C), shaking chills, costovertebral angle tenderness, anorexia, nausea, and vomiting. Right-side flank pain is more common than left-side or bilateral flank pain. Patients may also present with hypothermia (as low as 34°C). Lower UTI symptoms are common but not universal.

Physical Examination

During the physical examination, the findings should be considered in relation to the duration of pregnancy. The differential diagnoses may change from one trimester to the next, and the increasing size of the gravid uterus may mask or mimic disease findings. A thorough physical examination is recommended, with particular attention to the abdomen. Suprapubic or costovertebral tenderness may be present. In asymptomatic bacteriuria, no physical findings are typically present. Symptoms may arise intermittently, only to be overlooked because of lack of persistence or severity. Pelvic examination is recommended in all symptomatic patients (with the exception of third-trimester patients with bleeding) to rule out vaginitis or cervicitis. In patients with cystitis, tenderness can often be elicited with isolation of the bladder on pelvic examination. Patients with pyelonephritis have fever (usually >38°C), flank tenderness upon palpation, and an ill appearance. Flank tenderness occurs on the right side in more than half of patients, bilaterally in one fourth, and on the left side in one fourth. Pain may also be found suprapubically with palpation. Assessment of the fetal heart rate on the basis of gestational age should be included as part of the evaluation. Often, owing to maternal fever, the fetal heart rate is elevated to more than 160 beats/min.

Complications

The primary complication of bacteriuria during pregnancy is cystitis, though the primary morbidity is due to pyelonephritis. Other complications may include the following:

• Perinephric cellulitis and abscess
• Septic shock (rare)
• Renal dysfunction (usually transient, but as many as 25% of pregnant women with pyelonephritis have a decreased glomerular filtration rate)
• Hematologic dysfunction (common but seldom of clinical importance)
• Hypoxic fetal events due to maternal complications of infection that lead to hypoperfusion of the placenta
• Preeclampsia [23]
• Premature delivery leading to increased infant morbidity and mortality

Pulmonary injury may also complicate UTI in pregnancy. Approximately 2% of women with severe pyelonephritis during pregnancy have evidence of pulmonary injury due to systemic inflammatory response syndrome and respiratory insufficiency. Endotoxins that alter alveolar-capillary membrane permeability are produced; subsequently, pulmonary edema and acute respiratory distress syndrome develop.

Diagnostic Considerations

The differential diagnosis of urinary tract infection (UTI) in pregnancy includes the following:

• Cervicitis
• Chlamydial Genitourinary Infections
• Cystitis, Nonbacterial
• Ectopic Pregnancy
• Interstitial Cystitis
• Nephrolithiasis
• Trichomoniasis
• Trigonitis
• Urethritis
• Vaginitis

Other disorders to consider include the following:

• Glomerulonephritis
• Group B streptococcal colonization
• Sexually transmitted infection (eg, gonorrhea, nongonococcal urethritis)
• Threatened or incomplete miscarriage
• Urge incontinence
Vaginal infections can cause or mimic UTIs, which are common in women of reproductive age, affecting 25-35% of women aged 20-40 years. Discriminating between the 2 depends on the results of vaginal and urinary cultures.

Cervicitis

Cervicitis is an inflammation of the uterine cervix, characteristically diagnosed by: [1] a visible, purulent or mucopurulent endocervical exudate in the endocervical canal or on an endocervical swab specimen and/or [2] sustained, easily induced endocervical bleeding when a cotton swab is gently passed through the cervical os. [24].

Non-Infectious Cervicitis

Non-infectious cervicitis can be caused by the following:

• Local trauma – eg, cervical irritation caused by tampons, a cervical cap, the string from an intrauterine contraceptive device, a pessary, or a diaphragm
• Radiation
• Chemical irritation – eg, vaginal douches, latex exposure, or contraceptive creams
• Systemic inflammation – eg, Behçet syndrome
• Malignancy

Infectious Cervicitis

The infectious etiologies of cervicitis, all of which are sexually transmitted infections (STIs), are significantly more common than the noninfectious causes. This article focuses on the infectious etiologies of cervicitis. Infectious cervicitis may be caused by Chlamydia trachomatis, Neisseria gonorrhoeae, or herpes simplex virus (HSV). In most cases of cervicitis, however, lab tests fail to isolate an organism; this is particularly true in women with low risk factors.

Chlamydia (Chlamydial Genitourinary Infections)

Chlamydial infection can cause disease in many organ systems, including the genitourinary tract. Chlamydiae are small gram-negative obligate intracellular microorganisms that preferentially infect squamocolumnar epithelial cells. They include the genera Chlamydia (of which the type species is Chlamydia trachomatis) and Chlamydophila (eg, Chlamydophila pneumoniaeand Chlamydophila psittaci). C trachomatis can be differentiated into 18 serovars (serologically variant strains) on the basis of monoclonal antibody–based typing assays. These serovars are associated with different medical conditions, as follows:

• Serovars A, B, Ba, and C – Trachoma, a serious eye disease endemic in Africa and Asia that is characterized by chronic conjunctivitis and can lead to blindness
• Serovars D-K – Genital tract infections
• Serovars L1-L3 – Lymphogranuloma venereum (LGV), which is associated with genital ulcer disease in tropical countries.

C trachomatis infection affects the cervix, urethra, salpinges, uterus, nasopharynx, and epididymis [25,26]; it is the most commonly reported bacterial sexually transmitted disease (STD) in the United States and a leading cause of infertility in women. C trachomatis infection causes other diseases as well, including conjunctivitis, pneumonia or pneumonitis, afebrile pneumonia syndrome (in infants born vaginally to infected mothers), Fitz-Hugh-Curtis syndrome, and trachoma (the world’s leading cause of acquired blindness). C pneumoniae infection is spread via respiratory droplets and causes pharyngitis, bronchitis, and pneumonia. C psittaci infection is spread by bird droppings and aerosols and causes psittacosis. These infections are not discussed in this article. At present, fewer than 50% of sexually active young females in the United States are screened for the presence of chlamydiae. Nationally, the annual screening rate increased from 25.3% in 2000 to 43.6% in 2006, then decreased slightly to 41.6% in 2007. [5] The US Preventive Services Task Force recommends routine screening for chlamydial infections. The USPSTF recommends screening for chlamydia in sexually active females aged 24 years or younger and in older women who are at increased risk for infection. Routine Chlamydiascreening of sexually active young women is recommended to prevent consequences of untreated chlamydial infection (eg, pelvic inflammatory disease (PID), infertility, ectopic pregnancy, and chronic pelvic pain) [27]. A guideline synthesis is also available from the National Guideline Clearinghouse.

Nonbacterial and Noninfectious Cystitis

Nonbacterial cystitis is a catchall term that encompasses various medical disorders, including infectious and noninfectious cystitis, as well as painful bladder syndrome/interstitial cystitis (PBS/IC). PBS/ IC describes a syndrome of pain and genitourinary symptoms (eg, frequency, urgency, pain, dysuria, nocturia) for which no etiology can be found. There are many controversies regarding nonbacterial cystitis, including possible etiologic agents, methods of diagnosis, and treatment, especially for noninfectious causes.

Infectious nonbacterial cystitis includes the following forms of the disease:

• Viral
• Mycobacterial
• Chlamydial
• Fungal
• Schistosomal

Non-infectious nonbacterial cystitis includes the following forms of the disease:

• Radiation induced
• Chemical
• Autoimmune
• Hypersensitivity

General symptoms of cystitis include urgency, frequency, dysuria, and, occasionally, hematuria, dyspareunia, abdominal cramps, and/or bladder pain and spasms. Establishing or excluding a specific diagnosis often requires repeated cultures and various urologic procedures, including cystoscopy with bladder biopsies, various bladder tests, and immune system function examinations. Some conditions, such as carcinoma in situ, bladder calculi, and urethral foreign bodies, may result in symptoms that mimic those of nonbacterial cystitis.

Ectopic Pregnancy

Overview

Ectopic pregnancy continues to be the leading cause of first-trimester maternal death. Although diagnosis and management have improved, the incidence of this disease has continued to climb since the US Centers for Disease Control and Prevention (CDC) started collecting data in 1970 [28]. This increase is likely due to a continued rise in the prevalence of predisposing risk factors. Ectopic pregnancy has additional significance in that the associated mortality with this condition usually affects an otherwise healthy segment of the population.

Preferred Examination

To diagnose an ectopic pregnancy, beta-HCG tests are required. A negative beta-HCG result effectively excludes the diagnosis of an ectopic or intrauterine pregnancy. In unstable patients, surgical evaluation and/or laparoscopy should be performed with or without culdocentesis. In patients with a stable clinical condition, transabdominal (TA) and endovaginal (EV) ultrasonography are performed [29]. The demonstration of an intrauterine gestational sac effectively excludes the diagnosis of an ectopic pregnancy. A search for a possible ectopic pregnancy as part of a heterotopic pregnancy should be attempted. Medical management is often associated with follow-up imaging [30,31]. Follow-up ultrasonography, along with follow-up beta-HCG levels, can be helpful if the diagnosis is unclear. A normal intrauterine pregnancy should demonstrate a 48-hour beta-HCG doubling time. Magnetic resonance imaging (MRI) has been used as a problem-solving tool in patients in stable condition and with special circumstances [32-35]. Active research continues in an attempt to elucidate an ectopic- specific serum marker. Multiple markers show some diagnostic benefit in attempting to discriminate an ectopic pregnancy from a normal intrauterine gestation; however, their use is still widely in the investigative stage. Some of the many markers investigated include progesterone, cancer antigen-125 (CA-125), pregnancy-associated plasma protein A (PAPP-A), and activin A.

Limitations of Techniques

TA and EV ultrasonography are recommended in all studies. In a patient in stable condition, a full bladder should be present as a proper TA ultrasonography window. In unstable patients in whom an expeditious diagnosis is needed, the time delay for the bladder to fill may be undesirable. TA and/or EV ultrasonography may be performed in these patients with an empty bladder. Both TA and EV examinations should still be performed with the acknowledgment of the limited, yet important, aspects of the TA portion of the examination. TA examination enables better evaluation of the superior uterus and superiorly positioned adnexa. It may aid detection of free peritoneal fluid and/ or hemorrhage beyond the cul-de-sac. Transvaginal examination provides a detailed evaluation of the endometrial cavity and ovaries, but the high-frequency transducer that allows improved near-field resolution compared with TA examinations suffers from limited sound penetration (far-field imaging). MRI examination is time consuming and costly. Computed tomography (CT) scan findings are nonspecific in ectopic pregnancies and pose a hazard of ionizing radiation, which may be harmful to normal pregnancies.

Interstitial Cystitis

Interstitial cystitis is a clinical syndrome characterized by daytime and nighttime urinary frequency, urgency, and pelvic pain. Interstitial cystitis has no clear etiology or pathophysiology, and diagnostic criteria for the syndrome remain undefined. Despite considerable research, universally effective treatments do not exist; therapy usually consists of various supportive, behavioral, and pharmacologic measures. Surgical intervention is rarely indicated [36]. The International Continence Society has coined the term painful bladder syndrome (suprapubic pain with bladder filling associated with increased daytime and nighttime frequency, in the absence of proven urinary infection or other obvious pathology) and reserves the diagnosis of interstitial cystitis for patients with characteristic cystoscopic and histologic features of the condition [37]. An international consensus panel was able to generally agree on the following definition of interstitial cystitis/ bladder pain syndrome (IC/BPS): unpleasant sensation (pain, pressure, discomfort) perceived to be related to the urinary bladder and associated with lower urinary tract symptoms of more than 6 weeks’ duration, in the absence of infection or other identifiable causes. American Urological Association (AUA) guidelines published in 2011 and amended in 2014 use an evidence-based approach to provide a clinical framework for the diagnosis and management of this condition. [3] The Canadian Urological Association issued a guideline on diagnosis and treatment of IC/BPS in 2016.

Despite years of intensive research, there are no specific clinical or urinary markers currently clinically available; no absolutely specific radiographic, laboratory, or serologic findings; and no biopsy patterns that are pathognomonic for interstitial cystitis. The syndrome remains a diagnosis of exclusion. Intensive study has been done to attempt to identify biomarkers for IC/BPS. Some interesting studies have shown that bladder nitric oxide is an accurate marker for Hunner lesions, but these are not present in all patients, and the test requires specific equipment, which has limited widespread clinical use. Differences in levels of cytokines and chemokines, specifically CXCL- 10, have shown some ability to differentiate patients with and without Hunner lesions. Other studies of ulcerative IC/BPS have shown that numerous other cytokines and chemokines are up-regulated as well, heralding a possible urinary test to identify patients. Perhaps the most promising urinary biomarker for IC/BPS is antiproliferative factor (APF). This small 8–amino-acid peptide has been associated with suppression of cell growth, increases in transcellular permeability, and lowering of levels of proteins that form intercellular junctional complexes. APF is synthesized and secreted by bladder epithelial cells from patients with IC/BPS and may play a key role in pathophysiology. In vitro studies have shown that removal of APF from cell culture media restored cell proliferation and membrane integrity. Studies have also suggested a role for APF in the therapeutic effect of hydrodistension in patients with IC/BPS, although further confirmatory studies are necessary [38].

Treatment

The most important element in treating patients with interstitial cystitis is education and emotional support. Periodic exacerbations are managed as they occur because no long-term therapy has been shown to prevent or delay recurrent episodes. Therefore, the purpose of treatment is to palliate and alleviate symptoms. Because no discrete pathognomonic pathologic criteria exist for assessing and monitoring disease severity, indications and goals for treatment are based on the degree of patient symptoms. Assessing patient response to treatment is also complicated because of the subjective nature of symptoms; the waxing and waning nature of symptoms without treatment; and the lack of objective serologic, physical, or histopathologic findings. Conservative measures and oral or intravesical treatments are considered first-line treatment

Nephrolithiasis

Nephrolithiasis specifically refers to calculi in the kidneys, but renal calculi and ureteral calculi (ureterolithiasis) are often discussed in conjunction. The majority of renal calculi contain calcium. The pain generated by renal colic is primarily caused by dilation, stretching, and spasm because of the acute ureteral obstruction.

Signs and Symptoms

The classic presentation for a patient with acute renal colic is the sudden onset of severe pain originating in the flank and radiating inferiorly and anteriorly; at least 50% of patients will also have nausea and vomiting. Patients with urinary calculi may report pain, infection, or hematuria. Patients with small, non-obstructing stones or those with staghorn calculi may be asymptomatic or experience moderate and easily controlled symptoms.

The location and characteristics of pain in nephrolithiasis include the following:

• Stones obstructing ureteropelvic junction: Mild to severe deep flank pain without radiation to the groin; irritative voiding symptoms (eg, frequency, dysuria); suprapubic pain, urinary frequency/ urgency, dysuria, stranguria, bowel symptoms
• Stones within ureter: Abrupt, severe, colicky pain in the flank and ipsilateral lower abdomen; radiation to testicles or vulvar area; intense nausea with or without vomiting
• Upper ureteral stones: Radiate to flank or lumbar areas
• Midureteral calculi: Radiate anteriorly and caudally
• Distal ureteral stones: Radiate into groin or testicle (men) or labia majora (women)
• Stones passed into bladder: Mostly asymptomatic; rarely, positional urinary retention

Diagnosis

The diagnosis of nephrolithiasis is often made on the basis of clinical symptoms alone, although confirmatory tests are usually performed. Examination in patients with nephrolithiasis includes the following findings:

• Dramatic costovertebral angle tenderness; pain can move to upper/lower abdominal quadrant with migration of ureteral stone
• Generally unremarkable abdominal evaluation: Possibly hypoactive bowel sounds; usually absence of peritoneal signs; possibly painful testicles but normal-appearing
• Constant body positional movements (eg, writhing, pacing)
• Tachycardia
• Hypertension
• Microscopic hematuria

Testing

The European Association of Urology (EAU) recommends the following laboratory tests in all patients with an acute stone episode [39]

• Urinary sediment/dipstick test: To demonstrate blood cells, with a test for bacteriuria (nitrite) and urine culture in case of a positive reaction
• Serum creatinine level: To measure renal function
Other laboratory tests that may be helpful include the following: • CBC with differential in febrile patients
• Serum electrolyte assessment in vomiting patients (eg, sodium, potassium, calcium, PTH, phosphorus)
• Serum and urinary pH level: May provide insight regarding patient’s renal function and type of calculus (eg, calcium oxalate, uric acid, cystine), respectively
• Microscopic urinalysis
• 24-Hour urine profile
Imaging Studies
The following imaging studies are used in the evaluation of nephrolithiasis: • Noncontrast abdominopelvic CT scan: The imaging modality of choice for assessment of urinary tract disease, especially acute renal colic
• Renal ultrasonography: To determine presence of a renal stone and the presence of hydronephrosis or ureteral dilation; used alone or in combination with plain abdominal radiography
• Plain abdominal radiograph (flat plate or KUB): To assess total stone burden, as well as size, shape, composition, location of urinary calculi; often used in conjunction with renal ultrasonography or CT scanning
• IVP (urography) (historically, the criterion standard): For clear visualization of entire urinary system, identification of specific problematic stone among many pelvic calcifications, demonstration of affected and contralateral kidney function
• Plain renal tomography: For monitoring a difficult-to-observe stone after therapy, clarifying stones not clearly detected or identified with other studies, finding small renal calculi, and determining number of renal calculi present before instituting a stone-prevention program
• Retrograde pyelography: Most precise imaging method for determining the anatomy of the ureter and renal pelvis; for making definitive diagnosis of any ureteral calculus
• Nuclear renal scanning: To objectively measure differential renal function, especially in a dilated system for which the degree of obstruction is in question; reasonable study in pregnant patients, in whom radiation exposure must be limited [40-42].

Management

Supportive Care and Pharmacotherapy

Medical treatment of nephrolithiasis involves supportive care and administration of agents, such as the following:

Acute Stone Attacks (Renal Colic):

• IV hydration
• NSAIDS (eg, ketorolac, ketorolac intranasal, ibuprofen)
• Nonnarcotic analgesics (eg, APAP)
• PO/IV narcotic analgesics (eg, codeine, morphine sulfate, oxycodone/APAP, hydrocodone/APAP, dilaudid, fentanyl)
• Alpha blockers (eg, tamsulosin, terazosin)
• Antiemetics (eg, metoclopramide, ondansetron)
• Antibiotics (eg, ampicillin, gentamicin, trimethoprim-sulfamethoxazole, ciprofloxacin, levofloxacin, ofloxacin)

Stone Prevention/Chemolysis

• Uricosuric agents (eg, allopurinol)
• Alkalinizing agents (eg, potassium citrate, sodium bicarbonate): For uric acid and cysteine calculi
• Thiazide diuretics- helps treat hypercalcicuria

Surgical Options

Stones that are 7 mm and larger are unlikely to pass spontaneously and require some type of surgical procedure, such as the following:

• Stent placement
• Percutaneous nephrostomy
• Extracorporeal shockwave lithotripsy (ESWL)
• Ureteroscopy
• Percutaneous nephrostolithotomy (PCNL) or mini PNCL
• Open nephrostomy- more historical
• Anatrophic nephrolithotomy- for large complex stag horn calculi that cannot be cleared by an acceptable number of PCNLs.Typically now done via laparoscopic or robotic approach

Trichomoniasis

Trichomoniasis is a sexually transmitted infection (STI) caused by the motile parasitic protozoan Trichomonas vaginalis. It is one of the most common STIs, both in the United States and worldwide. [6,43,44] The high prevalence of T vaginalis infection worldwide and the frequency of coinfection with other STIs make trichomoniasis a compelling public health concern. Notably, research has shown that infection with T vaginalis increases the risk of HIV transmission in both men and women. Trichomoniasis is also associated with adverse pregnancy outcomes, infertility, postoperative infections, and cervical neoplasia [45]. Humans are the only known host of T vaginalis. Transmission occurs predominantly via sexual intercourse. The organism is most commonly isolated from vaginal secretions in women and urethral secretions in men. It has not been isolated from oral sites, and rectal prevalence appears to be low in men who have sex with men [46]. Women with trichomoniasis may be asymptomatic or may experience various symptoms, including a frothy yellow-green vaginal discharge and vulvar irritation. Men with trichomoniasis may experience nongonococcal urethritis but are frequently asymptomatic.

Trichomoniasis is thought to be widely underdiagnosed due to a variety of factors, including a lack of routine testing, the low sensitivity of a commonly used diagnostic technique (wet mount microscopy), [47,48] and nonspecific symptomatology. Self-diagnosis and self-treatment or diagnosis by practitioners without adequate laboratory testing may also contribute to misdiagnosis. Testing is recommended for T vaginalis in all women seeking care for vaginal discharge and screening for T vaginalis in women at high risk of STI. Sex partners of infected women should also be treated. Both patient and partner should abstain from sex until pharmacological treatment has been completed and they have no symptoms. Infected women who are sexually active have a high rate of reinfection; thus, rescreening at 3 months post treatment should be considered. Currently, no data are available on rescreening men. Oral metronidazole (Flagyl) remains the treatment of choice for trichomoniasis. In cases in which the firstline agent is ineffective, other nitroimidazoles or high doses of metronidazole may be used. Topical metronidazole and other antimicrobials are not efficacious and should not be used to treat trichomoniasis.

Trigonitis

Trigonitis refers to the nonkeratinizing squamous metaplastic changes in the bladder trigone. The trigone is the triangular area of the bladder bound by the ureteral orifices and the internal urethral sphincter, which is normally lined by urothelium, a type of transitional epithelial tissue. This entity was first described by Heymann in 1905 as cystitis trigoni and was subsequently described by Cifuentes as a true trigonal membrane. [49] It is also referred to in the literature as pseudomembranous trigonitis or vaginal metaplasia. Squamous metaplasia of the trigone occurs almost exclusively in women of childbearing age. It is almost nonexistent in children. Although the exact cause of trigonitis is unknown, the condition usually occurs in response to an irritative (eg, chronic indwelling catheter) or infectious process. Trigonitis is a benign lesion without malignant potential. It does not require follow-up cystoscopy. However, it should be distinguished from keratinizing squamous metaplasia (leukoplakia), which does require follow-up.

Urethritis

Urethritis is defined as infection-induced inflammation of the urethra. The term is typically reserved to describe urethral inflammation caused by a sexually transmitted disease (STD), and the condition is normally categorized as either gonococcal urethritis (GU) or nongonococcal urethritis (NGU).

Signs and Symptoms

Many patients with urethritis, including approximately 25% of those with NGU, are asymptomatic and present to a clinician following partner screening. Up to 75% of women with Chlamydia trachomatis infection are asymptomatic.

Signs and symptoms in patients with urethritis may include the following:

• Urethral discharge: May be yellow, green, brown, or tinged with blood; production unrelated to sexual activity
• Dysuria (in men): Usually localized to the meatus or distal penis, worst during the first morning void, and made worse by alcohol consumption; typically, not present are urinary frequency and urgency
• Itching: Sensation of urethral itching or irritation between voids
• Orchalgia: Heaviness in the male genitals
• Worsens during menstrual cycle (occasionally).
• Systemic symptoms (eg, fever, chills, sweats, nausea): Typically, absent

Diagnosis

Most patients with urethritis do not appear ill and do not present with signs of sepsis. The primary focus of the examination is on the genitalia. Examination in male patients with urethritis includes the following:

• Inspect the underwear for secretions
• Penis: Examine for skin lesions that may indicate other STDs (eg, condyloma acuminatum, herpes simplex, syphilis); in uncircumcised men, retract the foreskin to assess for lesions and exudate
• Urethra: Examine lumen of the distal urethral meatus for lesions, stricture, or obvious urethral discharge; palpate along urethra for areas of fluctuance, tenderness, or warmth suggestive of abscess or for firmness suggesting foreign body
• Testes: Examine for evidence of mass or inflammation; palpate the spermatic cord, looking for swelling, tenderness, or warmth suggestive of orchitis or epididymitis
• Lymphatics: Check for inguinal adenopathy
• Prostate: Palpate for tenderness or bogginess suggestive of prostatitis
• Rectal: During the digital rectal examination, note any perianal lesions

Examine female patients in the lithotomy position. Include the following evaluation:

• Skin: Assess for lesions that may indicate other STDs • Urethra: Strip the urethra for any discharge • Pelvis: Complete pelvic examination, including the cervix

Testing

Urethritis can be diagnosed based on the presence of one or more of the following:

• A mucopurulent or purulent urethral discharge
• Urethral smear that demonstrates at least 5 leukocytes per oil immersion field on microscopy
• First-voided urine specimen that demonstrates leukocyte esterase on dipstick test or at least 10 WBCs/hpf on microscopy All patients with urethritis should be tested for Neisseria gonorrhoeae and C trachomatis. Laboratory studies may include the following:

• Gram stain
• Endourethral and/or endocervical culture for N gonorrhoeae and C trachomatis
• Urinalysis: Not useful test in urethritis, except to help exclude cystitis or pyelonephritis
• Nucleic acid–based tests: For C trachomatisand N gonorrhoeae (urine specimens) and other Chlamydia species (endourethral samples)
• Nucleic acid amplification tests (eg, PCR for N gonorrhoeae, Chlamydia species)
• KOH preparation: to evaluate for fungal organisms
• Wet mount preparation: To detect the movement/presence of Trichomonas
• STD testing for syphilis serology (VDRL) and HIV serology
• Nasopharyngeal and/or rectal swabs: For gonorrhea screening in men who have sex with men
• Pregnancy testing: In women who have had unprotected intercourse.

Imaging Studies

Imaging studies, specifically retrograde urethrography, are unnecessary in patients with urethritis, except in cases of trauma or possible foreign body insertion.

Procedures

Patients with urethritis may undergo the following procedures:
• Catherization: In cases of urethral trauma; to avoid urinary retention and tamponade urethral bleeding
• Cystoscopy: In cases when catherization is not possible, for placement of a catheter; to remove foreign body or stone in the urethra
• Dilation of urethral strictures with filiforms and followers
• Placement of suprapubic tube: In severe cases of urethral trauma that prevent placement of urethral catheters or in the absence of adequate facilities for emergent cystoscopy; temporizing measure to divert urine and relieve patient discomfort [50-53].

Management

Symptoms of urethritis spontaneously resolve over time, regardless of treatment. Administer antibiotics that cover both GU and NGU. Regardless of symptoms, administer antibiotics to the following individuals:

  • Patients with positive Gram stain or culture results
  • All sexual partners of the above patients
  • Patients with negative Gram stain results and a history consistent with urethritis who are not likely to return for follow-up and/ or are likely to continue transmitting infection
    Antibiotics used in the treatment of urethritis include the following:
  • Azithromycin
  • Ceftriaxone
  • Cefixime
  • Ciprofloxacin
  • Ofloxacin
  • Doxycycline
  • Moxifloxacin

Vaginitis

Vaginitis (inflammation of the vagina) is the most common gynecologic condition encountered in the office. It is a diagnosis based on the presence of symptoms of abnormal discharge, vulvovaginal discomfort, or both. Cervicitis may also cause a discharge and sometimes occurs with vaginitis. Discharge flows from the vagina daily as the body’s way of maintaining a normal healthy environment. Normal discharge is usually clear or milky with no malodor. A change in the amount, color, or smell; irritation; or itching or burning could be due to an imbalance of healthy bacteria in the vagina, leading to vaginitis. The most common causes of vaginitis in symptomatic women are bacterial vaginosis (40-45%), vaginal candidiasis (20-25%), and trichomoniasis (15-20%); yet 7-72% of women with vaginitis may remain undiagnosed. [54-57] The workup for patients with vaginitis depends on the risk factors for infection and the age of the patient. Accurate diagnosis may be elusive, and care must be taken to distinguish vaginitis from other infectious and noninfectious causes of symptoms. All women presenting with abnormal vaginal discharge should have a careful pelvic examination. Condition-specific tests (ie, colposcopy and cervical biopsies) are indicated for suspected cervical cancer. Studies that may be performed in cases of suspected vaginitis include saline wet mount, the so-called whiff test, pH testing, culture, nucleic acid amplification testing, and a number of other second-line tests. Treatment of vaginitis varies by cause and is directed at the relevant pathogen. Inpatient care usually is not indicated, unless serious pelvic infections arise or evidence of systemic infection in an immunocompromised host is present.

Urinary Tract Infections in Pregnancy Treatment & Management

Because of the dangers of maternal and fetal complications, acute care (eg, in the emergency department [ED]) should focus on identifying and treating asymptomatic and symptomatic bacteriuria, along with ensuring that an alternate process is not the cause of the symptoms. Treatment of asymptomatic bacteriuria in pregnant patients is important because of the increased risk of urinary tract infection (UTI) and its associated sequelae. [22] ED care may involve the following:

  • Administration of appropriate antibiotics
  • Administration of fluid if the patient is dehydrated
  • Admission if any indication of complicated UTI exists

Behavioral Methods

Any discussion of treatment should be prefaced with a discussion of behavioral methods that may be used to ensure good hygiene and reduce bacterial contamination of the urethral meatus, thereby preventing inadequate treatment and recurrent infection.

Behavioral methods include the following:

  • Avoid baths
  • Wipe front-to-back after urinating or defecating
  • Wash hands before using the toilet
  • Use washcloths to clean the perineum
  • Use liquid soap to prevent colonization from bar soap
  • Clean the urethral meatus first when bathing.

Antibiotic Therapy

Oral antibiotics are the treatment of choice for asymptomatic bacteriuria and cystitis. Appropriate oral regimens include the following:

  • Cephalexin 500 mg 4 times daily
  • Ampicillin 500 mg 4 times daily
  • Nitrofurantoin 100 mg twice daily
  • Sulfisoxazole 1 g 4 times daily

The resistance of Escherichia coli to ampicillin and amoxicillin is 20-40%; accordingly, these agents are no longer considered optimal for treatment of UTIs caused by this organism. Fosfomycin, a phosphonic acid derivative, is useful in the treatment of uncomplicated UTIs caused by susceptible strains of E coli and Enterococcus species. Fosfomycin is a US Food and Drug Administration (FDA) category B agent in pregnancy (ie, animal studies have not demonstrated a risk to the fetus and there are no adequate and well-controlled studies in pregnant women). Although 1-, 3-, and 7-day antibiotic courses have been evaluated, 10-14 days of treatment is usually recommended to eradicate the offending bacteria. For example, studies with cephalexin, trimethoprim-sulfamethoxazole, and amoxicillin have indicated that a single dose is as effective as a 3- to 7-day course of therapy, but the cure rate is only 70%.

A systematic review that compared single-dose antibiotic treatment with 4- to 7-day treatments concluded that single-dose regimens may be less effective than a short-course regimen, but until more data become available from large trials, pregnant women with asymptomatic bacteriuria should be treated with the standard regimen [58-62]. Treatment success depends on eradication of the bacteria rather than on the duration of therapy. A test-for-cure urine culture should show negative findings 1-2 weeks after therapy. A nonnegative culture result is an indication for a 10- to 14-day course of a different antibiotic, followed by suppressive therapy (eg, nitrofurantoin 50 mg at bedtime) until 6 weeks postpartum. Mathai et al suggest the need for disseminated guidelines for practitioners in developing countries such as India. [24] Their study documented inappropriate use of antibiotics in terms of safety, cost, susceptibility, and threat for developing resistance.

Treatment of Pyelonephritis

The standard course of treatment for pyelonephritis consists of hospital admission and intravenous (IV) administration of cephalosporins or gentamicin. IV fluids must be administered with caution. Patients with pyelonephritis can become dehydrated because of nausea and vomiting and need IV hydration. However, they are at high risk for the development of pulmonary edema and acute respiratory distress syndrome (ARDS). Fever should be managed with antipyretics (preferably, acetaminophen) and nausea and vomiting with antiemetics. Most antiemetics can be used for adverse effects caused by antibiotics, but doxylamine, Emetrol (Wellspring, Sarasota, FL; pregnancy class A), dimenhydrinate, and metoclopramide (pregnancy class B) are preferred. Preterm labor and delivery are additional risks associated with pyelonephritis. These risks must be evaluated and treated early in the course of admission. In a randomized, controlled trial of outpatient treatment of pyelonephritis in pregnancy, Millar et al concluded that outpatient therapy is as safe and effective as inpatient care in the treatment of pyelonephritis before 24 weeks’ gestation. However, the prevailing view is still that aggressive inpatient hydration and parenteral antibiotics are necessary. Pyelonephritis places the patient at risk for spontaneous abortion in early pregnancy and for preterm labor after 24 weeks’ gestation.

In their study, Millar et al treated outpatients with 2 doses of intramuscular (IM) ceftriaxone and 10 days of oral cephalexin [63]. Initial outpatient therapy and traditional inpatient therapy failed to cure equal numbers of patients. Benefits include the obvious cost savings and the psychosocial benefits for the patient. Risks include septic shock and respiratory insufficiency at home during outpatient therapy. Strict guidelines for an observation period before ED discharge, patient education, and home nursing have been discussed. In addition, approximately two thirds of the outpatient treatment group did not complete the study because the subjects developed 1 or more complications. If outpatient therapy is considered, only selected patients in their second trimester should be considered. More study is necessary before a change in the physician’s practice pattern is considered.

Antibiotic Selection

Antibiotic selection should be based on urine culture sensitivities, if known. Often, therapy must be initiated on an empirical basis, before culture results are available. This requires clinical knowledge of the most common organisms and their practice-specific or hospital-specific sensitivities to medications. Institution-specific drug resistances should also be considered before a treatment antibiotic is chosen. For instance, with E coli infection alone, resistance to ampicillin can be as high as 28-39%. Resistance to trimethoprim-sulfamethoxazole has been described as 31%, and resistance to first-generation cephalosporins may be as high as 9-19%. Maternal physiologic changes that influence pharmacokinetics include increased glomerular filtration rate (GFR) and renal plasma flow, increased volume of distribution, decreased gastric motility and emptying, and decreased albumin levels. Serum levels of antibiotics are lower in pregnancy because of the gross increase in blood volume and the increased GFR.

Some antibiotics should not be used during pregnancy, because of their effects on the fetus. These include the following:

  • Tetracyclines (adverse effects on fetal teeth and bones and congenital defects)
  • Trimethoprim in the first trimester (facial defects and cardiac abnormalities)
  • Chloramphenicol (gray syndrome)
  • Sulfonamides in the third trimester (hemolytic anemia in mothers with glucose-6-phosphate dehydrogenase [G6PD] deficiency, jaundice, and kernicterus) Fluoroquinolones are to be used with caution in pregnancy.

Both ciprofloxacin and levofloxacin have been assigned pregnancy category C by the FDA (fetal risk is not confirmed by human studies but has been shown in some animal studies). Although not a first-line option for treatment of UTI in pregnancy, in certain clinical situations the benefits of using a fluoroquinolone may outweigh the risks to the developing fetus. Risks to the mother from fluoroquinolones must also be considered. In May 2016 the FDA advised that the risks of fluoroquinolones generally outweigh the benefits for patients with uncomplicated infections, including UTIs, and recommended reserving fluoroquinolones for patients who do not have alternative treatment options. Disabling and potentially permanent serious adverse effects associated with fluoroquinolones have involved tendons, muscles, joints, nerves, and the central nervous system [64-67]. Nitrofurantoin is safe and effective; however, poor tissue penetration has limited its use in pyelonephritis. In the past, nitrofurantoin was completely avoided in the third trimester because of hemolytic effects on the newborn.

Currently, restriction of this agent is limited to the last several weeks of pregnancy. Use during this period can cause hemolytic anemia in the fetus or neonate as a consequence of their immature erythrocyte enzyme systems (glutathione instability). Nitrofurantoin is also safe and effective for once-daily prophylactic therapy during pregnancy. Macrolides are not first-line agents for UTI in pregnancy. However, they are well tolerated by mother and fetus. A meta-analysis concluded that although antibiotic treatment is effective in patients with UTIs, the data are insufficient to recommend any specific regimen for treatment of symptomatic UTIs during pregnancy [68-71]. All of the antibiotics studied were effective in terms of both increasing cure rates of UTI in pregnancy and decreasing the incidence of associated adverse outcomes.

Current regimens are summarized below.

First-line therapy

  • Nitrofurantoin monohydrate/macrocrystals 100 mg orally twice daily for 5-7 days or
  • Amoxicillin 500 mg orally twice daily (alternative: 250 mg orally three times daily) for 5-7 days or
  • Amoxicillin-clavulanate 500/125 mg orally twice daily for 3-7 days (alternative: 250/125 mg orally three times daily for 5-7 days) or
  • Cephalexin 500 mg orally twice daily for 3-7 days
    Second-line therapy
  • Fosfomycin 3 g orally as single dose with 3-4 oz. of water

Surgical Treatment

Surgical care is rarely indicated, unless one of the pathologic causes listed in the differential diagnoses is suspected. In patients with urethral or bladder diverticulum, bladder stones, urethral syndrome, lower urinary tract trauma, interstitial cystitis, or bladder cancer, cystoscopy may aid in establishing the diagnosis. A retrograde stent or a percutaneous nephrostomy tube should be placed to relieve ureteral colic or decompress an obstructed infected collecting system. More invasive procedures, such as ureteroscopic stone extraction, [29] are rarely indicated. Extracorporeal shock wave lithotripsy (ESWL) is contraindicated in pregnancy. In the rare patient for whom invasive surgical therapy is indicated, the operation should be planned for the second trimester. Surgical intervention during the first trimester is associated with miscarriage; surgery in the third trimester is associated with preterm labor. Urgent surgical intervention in the third trimester should coincide with delivery of the fetus.

Preterm Labor

Preterm labor is defined as the presence of uterine contractions of sufficient frequency and intensity to effect progressive effacement and dilation of the cervix prior to term gestation. Occurring at 20- 37 weeks’ gestation, preterm labor precedes almost half of preterm births and is the leading cause of neonatal mortality in the United States.

Risk of Preterm Labor

The exact mechanisms of preterm labor are largely unknown but are believed to include the following:

  • Decidual hemorrhage such as abruption and mechanical factors such as uterine overdistention from multiple gestation or polyhydramnios
  • Cervical incompetence (eg, trauma, cone biopsy)
  • Uterine distortion (eg, müllerian duct abnormalities, fibroid uterus)
  • Cervical inflammation as a result of, for example, bacterial vaginosis (BV) or trichomonas
  • Maternal inflammation/fever (eg, urinary tract infection)
  • Hormonal changes (eg, mediated by maternal or fetal stress)
  • Uteroplacental insufficiency (eg, hypertension, insulin-dependent diabetes, drug abuse, smoking, alcohol consumption) [72-76].

Risk Assessment During Pregnancy

Physical Assessment

The integrity of the cervix and the extent of any prior injury to the cervix may be assessed by speculum and digital examination. The presence of asymptomatic bacteriuria, sexually transmitted disease (STD), and symptomatic BV may be investigated

History

A history of prior preterm deliveries places the patient in the high-risk category. Of the predictors of preterm birth, past obstetric history may be one of the strongest predictors of recurrent preterm birth.

Cervical Length

A short cervical length in the early or late second trimester has been associated with a markedly increased risk of preterm labor and delivery. In a study, a cervical length of 25 mm or less at 28 weeks had a 49% sensitivity for prediction of preterm delivery at less than 35 weeks [77-79].

Laboratory Tests

In patients with a history of midtrimester loss, laboratory tests for risk assessment include the following:

  • Rapid plasma reagin test
  • Gonorrheal and chlamydial screening
  • Vaginal pH/wet smear/whiff test
  • Anticardiolipin antibody (eg, anticardiolipin immunoglobulin [Ig] G and IgM, anti-beta2 microglobulin)
  • Lupus anticoagulant antibody
  • Activated partial thromboplastin time
  • One-hour glucose challenge test
    In addition, one should consider TORCH (toxoplasmosis, other infections, rubella, cytomegalovirus infection, herpes simplex), immunoglobulin G, and immunoglobulin M screening whenever the historical or clinical suspicion is present.

Diagnosis

Contractions of sufficient frequency and intensity to effect progressive effacement and dilation of the cervix at 24-37 weeks’ gestation are indicative of active preterm labor. If the diagnosis of preterm labor is suspected, but not confirmed, it may be prudent to first obtain a vaginal fetal fibronectin (FFN) sample before pelvic cervical examination. If the diagnosis remains in doubt after the exam, the FFN specimen can be sent to the lab for analysis [80-82].

Management

Progesterone

Studies support the use of progesterone supplementation to reduce preterm birth in patients at high risk for recurrent preterm delivery.

Tocolytic Agents

Criteria that indicate consideration of tocolytic therapy include more than 6 contractions per hour resulting in a demonstrated cervical change or presumed prior cervical change (transvaginal cervical length < 25 mm, >50% cervical effacement, or cervical dilation ≥20mm). If contractions are present without cervical change, management options include continued observation or therapeutic sleep for the patient (eg, morphine sulphate 10-15 mg subcutaneous).

The most common tocolytic agents used to treat preterm labor include the following:

  • Magnesium sulfate (MgSO4): Widely used as the primary tocolytic agent because it has similar efficacy to terbutaline (one of the previous agents of choice), with far better tolerance
  • Indomethacin: An appropriate first-line tocolytic for early preterm labor (< 30 wk) or preterm labor associated with polyhydramnios
  • Nifedipine: Despite its unlabeled status, several randomized studies have found nifedipine to be associated with a more frequent successful prolongation of pregnancy than other tocolytics [83-87].

Overview

Preterm labor is defined as the presence of uterine contractions of sufficient frequency and intensity to effect progressive effacement and dilation of the cervix prior to term gestation (between 20 and 37 wk). Preterm labor precedes almost half of preterm births and preterm birth occurs in approximately 12% of pregnancies and is the leading cause of neonatal mortality in the United States. In addition, preterm birth accounts for 70% of neonatal morbidity, mortality, and health care dollars spent on the neonate, largely due to the 2% of American women delivering very premature infants (< 32 wk). [88- 90] Despite the current use of material, effort, and money in perinatal medical technology, neonatal mortality rates for newborns born in the United States (5 per 1,000 babies) may rank as low as 32nd among the 33 industrialized nations, superior only to Latvia. [91,92] Successful reduction of perinatal morbidity and mortality associated with prematurity may require the implementation of effective risk identification and behavioral modification programs for the prevention of preterm labor; these in turn require both an improved understanding of the psychosocial risk factors, etiology, and mechanisms of preterm labor and programs for accurate identification of pregnant women at risk for premature labor and delivery. In fact, recent evidence suggests that early identification of at-risk gravidas with timely referral for subspecialized obstetrical care may help identify women at risk for preterm labor and delivery and decrease the extreme prematurity (< 32 wk) rate, thereby reducing the morbidity, mortality, and expense associated with prematurity.

Goals of Management

The focus of this article is the prevention, diagnosis, and treatment of preterm labor with intact membranes. The management of preterm labor associated with ruptured membranes is reviewed in Premature Rupture of Membranes; however, the overall goals of both management schemes are similar. Goals of obstetric patient management of preterm labor should include

(1) Early identification of risk factors associated with preterm birth,
(2) Timely diagnosis of preterm labor,
(3) Identifying the etiology of preterm labor,
(4) Evaluating fetal well-being,
(5) Providing prophylactic pharmacologic therapy to prolong gestation and reduce the incidence of respiratory distress syndrome (RDS) and intra-amniotic infection (IAI),
(6) Initiating tocolytic therapy when indicated, and
(7) Establishing a plan of maternal and fetal surveillance with patient/provider education to improve neonatal outcome.

Risk of Preterm Labor

The exact mechanism(s) of preterm labor is largely unknown but is believed to include decidual hemorrhage, (eg, abruption, mechanical factors such as uterine overdistension from multiple gestation or polyhydramnios), cervical incompetence (eg, trauma, cone biopsy), uterine distortion (eg, müllerian duct abnormalities, fibroid uterus), cervical inflammation (eg, resulting from bacterial vaginosis [BV], trichomonas), maternal inflammation/fever (eg, urinary tract infection), hormonal changes (eg, mediated by maternal or fetal stress), and uteroplacental insufficiency (eg, hypertension, insulin-dependent diabetes, drug abuse, smoking, alcohol consumption) [93-96]. A genome wide association study that included 43,568 European women identified six genes (BF1, EEFSEC, AGTR2, WNT4, ADCY5, and RAP2C) that were associated with gestational duration, of which, three genes were associated with preterm birth (EBF1, EEFSEC, and AGTR2). Although prediction of preterm delivery remains inexact, a variety of maternal and obstetric characteristics are known to increase the risk, presumably via one of these mechanisms. Finally, the fetus plays a role in the initiation of labor. In a simplistic sense, the fetus recognizes a hostile intrauterine environment and precipitates labor by premature activation of a fetal-placental parturition pathway. Risk factors for preterm birth include demographic characteristics, behavioral factors, and aspects of obstetric history such as previous preterm birth. Demographic factors for preterm labor include nonwhite race, extremes of maternal age (< 17 y or >35 y), low socioeconomic status, and low pre-pregnancy weight.

Preterm labor and birth can be associated with stressful life situations (eg, domestic violence; close family death; insecurity over food, home, or partner; work and home environment) either indirectly by associated risk behaviors or directly by mechanisms not completely understood. Many risk factors may manifest in the same gravida. Methods used for predicting preterm birth include home uterine activity monitoring (HUAM), assessments of salivary estriol, fetal fibronectin (FFN), the presence of BV, and cervical length assessment.

  • While hospital tocodynamometry has been effective for monitoring uterine contractions to evaluate preterm labor, HUAM has not been proven valuable in detecting or preventing preterm birth and is not currently recommended for use.
  • The proposed use of salivary estriol measurements in detecting preterm labor was based on the belief that the adrenal gland production of dehydroepiandrosterone increases before the onset of labor, which results in an increase of maternal estriol. Unfortunately, maternal estriol levels show diurnal variation, peaking at night, and are suppressed by betamethasone administration, thereby decreasing the predictive value of salivary estriol in the detection of preterm delivery risk.
  • FFN is a basement membrane protein that helps bind placental membranes to the decidua. While a negative FFN is helpful in predicting women who are not destined to deliver preterm, a positive FFN has limited value in predicting women who will deliver preterm. Nevertheless, FFN has a predictive value in identifying patients who will or will not deliver within the subsequent 1-2 weeks.
  • While the presence of BV has been associated with the risk of preterm delivery, prospective treatment trials eradicating asymptomatic BV failed to reduce the risk of preterm delivery.
  • Longer term prediction of the risk of preterm delivery is achieved by cervical length measurements. A short cervical length in the early or late second trimester has been associated with a markedly increased risk of preterm labor and delivery. The prediction of preterm delivery may potentially be improved by combining FFN testing with measurements of cervical length.

Pre-Conceptual Evaluation

While the risk for preterm birth in nulliparous patients is hard to determine, past obstetric experience and personal behavior may provide significant insight into future pregnancy outcome in multiparous women. Identifying at-risk patients pre-conceptually may allow additional treatment options. Women who seek birth control have a 30% chance of becoming pregnant in the next 2 years, suggesting that these women represent one potential opportunity for intervention. The presence of the following risk factors should be addressed prior to pregnancy.

Cervical Trauma

The most common etiologies for cervical injury are elective abortion, surgeries to treat cervical dysplasia, and injury occurring at delivery. A single uncomplicated elective abortion at less than 10 weeks’ gestation does not increase the risk of mid trimester loss or preterm birth unless the cervix has been forcibly dilated to more than 10 mm at the time of the abortion. However, patients with a history of multiple first-trimester elective terminations or one or more second-trimester elective abortions may be at increased risk for preterm delivery. Cervical dilatation with laminaria or cervical ripening agents, such as misoprostol, appears to be less traumatizing to the cervix than mechanical dilation. Cervical dysplasia should be treated appropriately whenever diagnosed. However the incidence of preterm birth and cervical incompetence may be increased 200-300% after preconceptual surgical treatment (eg, cold knife cone, cryoconization, laser cone, LEEP) of cervical intraepithelial neoplasia (CIN). The risk of subsequent preterm delivery may be proportional to the amount of cervical tissue removed during surgery. Surprisingly, the ease of performing LEEP for relatively minor abnormalities may have paradoxically led to more cervical injury than was observed with the relatively more invasive cone biopsy. Obstetric trauma may be underestimated as a risk for mid trimester loss or preterm birth. While women may relate a history of cervical laceration, often they are unaware of the injury and the obstetric records of the previous delivery may be misleading as to the extent of the cervical injury. Therefore, visual inspection of the cervix is important to assess the degree of injury and risk. Defects that involve more than 50% of the cervical length may indicate a higher risk for mid trimester loss [97]. The accuracy of transvaginal ultrasonic measurements to determine risk of cervical incompetence, specifically in the presence of a history of cervical trauma, has yet to be determined.

Genital Tract Infection

The young gynecology patient diagnosed with gonorrhea, chlamydia, or trichomoniasis has an approximate 25% risk of reinfection during the subsequent 12 months, but a clear association between these organisms and preterm delivery has not been established. BV is a vaginal syndrome associated with an alteration of the normal vaginal flora rather than an infection specific to any one organism and a lack of vaginal inflammation is evident when compared with vaginitis. The diagnosis of BV should be suspected with a positive Gram stain result or the presence of 3 of 4 traditional diagnostic signs (homogenous gray-white discharge, >20% clue cells on saline wet smear, positive whiff test, and a vaginal pH >4.50) Patients should be treated per the US Centers for Disease Control and Prevention guidelines, with test-of-cure sampling and subsequent treatment if necessary.

Preterm Labor/Birth History

A history of prior preterm deliveries places the patient in the high-risk category. Of the predictors of preterm birth, past obstetric history may be one of the strongest predictors of recurrent preterm birth. Given a baseline risk of 10-12%, the risk of recurrent preterm birth after 1, 2, and 3 consecutive preterm births may be increased to approximately 15%, 30%, and 45%, respectively. Pre-conceptual counseling should help encourage patients to make informed decisions concerning future pregnancy in light of prematurity risk in the presence of previous preterm delivery. Often the best time to counsel the patient is at her 4- to 6-week postpartum check after a preterm delivery. Lykke et al found that spontaneous preterm delivery, preeclampsia, or fetal growth deviation in a first singleton pregnancy predisposes women to those complications in their second pregnancy, especially if the complications were severe. In a registry-based cohort study of 536,419 Danish women, delivery between 32 and 36 weeks of gestation increased the risk of preterm delivery in the second pregnancy from 2.7% to 14.7% (odds ratio [OR] 6.12; 95% confidence interval [CI], 5.84-6.42) and increased the risk of preeclampsia from 1.1% to 1.8% (OR 1.60; 95% CI, 1.41-1.81). A first delivery before 28 weeks increased the risk of a second preterm delivery to 26.0% (OR 13.1; 95% CI, 10.8-15.9) and increased the risk of preeclampsia to 3.2% (OR 2.96; 95% CI, 1.80-4.88). The optimal method of preventing preterm birth in multiple gestations has yet to be proven. Cervical cerclage, prophylactic bed rest, and empiric use of tocolytics have not been successful.

Most recently, a randomized controlled trial by Lim et al suggests that the use of 17α-hydroxyprogesterone caproate does not prevent neonatal morbidity or preterm birth in multiple pregnancies. Preeclampsia in a first pregnancy with delivery between 32 and 36 weeks increased the risk of preeclampsia in a second pregnancy from 14.1% to 25.3% (OR 2.08; 95% CI, 1.87-2.31) and increased the risk for a small for gestational age infant from 3.1% to 9.6% (OR 2.82; 95% CI, 2.38-3.35). Fetal growth 2 to 3 standard deviations below the mean in a first pregnancy increased the risk of preeclampsia from 1.1% to 1.8% (OR 1.62; 95% CI, 1.34-1.96) in the second pregnancy.

Mid-trimester Loss

Mid-trimester loss has many etiologies, including infection (eg, syphilis), anti-phospholipid syndrome, diabetes, substance abuse, genetic disorders, congenital müllerian abnormalities, cervical trauma, and cervical incompetence. Unfortunately, many mid-trimester losses remain unexplained. A complete workup may be of value in selected patients following a mid-trimester loss [98-100].

Objective

To determine the frequency of urinary tract infection in females with preterm labor.

Operational Definitions

Preterm Labor

It was labeled if females present as four uterine contractions in 20 min or eight in 60 min plus progressive change in the cervix; cervical dilatation greater than 1 cm; and cervical effacement 80% or greater at gestation <37 completed weeks.

UTI

UTI is commonly diagnosed based on clinical findings of bacteriuria (bacteria in midstream urine) counts of >105colony forming units (cfu)/mL.

Materials and Methods

Study Setting

This study was conducted at Emergency Department of Gynecology, Lady Atchison Hospital, Lahore.

Duration of Study

May 25, 2018 to November 25, 2018.

Study Design

It was a Cross-Sectional Study.

Sampling Technique

Non-Probability Consecutive Sampling.

Sample Size

A total of 357 females were estimated using an expected percentage of UTI in preterm labor as 36.7%.(7) We used 95% confidence level and 5% margin of error.

Sample Selection

Inclusion Criteria

  • Pregnant females aged 18-40 years
  • Gestational age above 22 weeks and < 37 weeks (was estimated on USG)
  • Any parity
  • Patients presenting with pre-term labor (as per operational definition).

xclusion Criteria

  • Cases with history of Rh- isoimmunization (on clinical record)
  • Multiple gestations (on USG)
  • Structural uterine abnormalities (on clinical examination)
  • Pregnancies complicated with medical disorders like hypertension (BP > 80 / 140)
  • Chronic renal disorders (on history).

Data Collection Procedure

A total of 357 cases fulfilling inclusion criteria was taken from Emergency Department of Gynecology, Lady Atchison Hospital, Lahore. After taking informed consent form all subjects or attendants they was taken in this study. Their basic demographic information (like age), contact details, gestational age, parity was taken. From each female, urine sample was taken in sterilized container and was sent to hospital Laboratory for complete urinalysis and culture/sensitivity. UTI was diagnosed as per operational definition. All females was managed according to standard protocol to lengthen their gestational age.

Data Analysis Plan

SPSS v22.0 was used to enter and analyze data using descriptive statistics like Mean±S.D and frequency and percentage. Mean±S.D was used for quantitative data like age, gestational age and parity. Frequency and percentage was used for categorical data like UTI. Data was stratified for age, gestational age and parity to address effect modifiers. Post-stratification, Chi-Square test was used and p-value ≤0.05 was considered as significant.

Results

This study was carried out to determine frequency of urinary tract infection in females with preterm labor. The total patients of our study was 357, information was collected and analyzed the results of analysis are as follows. The mean age of patients was 28.45 ± 4.44 years in our study. Total patients of our study was 357 with minimum age in years was 18 and the maximum age in year was 40. The mean gestational age of patients was 28.80 ± 4.32 weeks in our study. Total patients of our study was 357 with minimum gestational age was 22 weeks and the maximum gestational was 36 weeks. The mean value of parity in our patients was 3.36 ± 1.76. The minimum value of parity was 1 in our study and the maximum value of parity was 6 in our study. The results of urinary tract infection of our study patients are as, the frequency distribution showed that out of 357 patients 115 (32,2%) have urinary tract infection and 242 (67.8%) have not urinary tract infection. After stratification of age the frequency distribution results showed that 228 (63.9%) was from 18-30 years age group and 129 (36.1%) was from 31-40 years age group. More was belongs to 18-30 years age group.

Similarly after stratification of gestational age the results of frequency distribution showed that out of 357 patients 170 (47.6%) was from 22-30 weeks gestational age group and 187 (52.4%) was from 31-37 weeks gestational age group. More was from 31-37 weeks gestational age group. In parity the results of frequency distribution showed that out of 357 patients 205 (57.4%) was from less than 3 group and 152 (42.6%) was from more than three groups. More patients was from less than 3 group. When urinary tract infection compare with the age 57 having urinary tract infection was from 18-30 years age group and 58 having urinary tract infection was from 31-40 years age group. The p value of chi square showed a significant results between age and urinary tract infection as the value is less than level of significance. In gestational age the 58 patients having urinary tract infection was from 22-30 weeks gestational age group and 57 having urinary tract infection was from 31-37 weeks gestational age group. The p value of chi square showed non-significant results as the p value is greater than the level of significance. The parity results was as 57 patients having urinary tract infection was from less than 3 group and 58 was from the more than 3 groups. The p value of the chi square showed significant results between urinary tract infection and parity as the value is less than the level of significance (Tables 1-7).

Table 1: Frequency distribution of urinary tract infection.

biomedres-openaccess-journal-bjstr

Table 2: Frequency distribution of age.

biomedres-openaccess-journal-bjstr

Table 3: Frequency distribution of gestational age.

biomedres-openaccess-journal-bjstr

Table 4: Frequency distribution of Parity

biomedres-openaccess-journal-bjstr

Table 5: Stratification of UTI with respect to age.

biomedres-openaccess-journal-bjstr

Table 6: Stratification of UTI with respect to gestational age.

biomedres-openaccess-journal-bjstr

Table 7: Stratification of UTI with respect to parity.

biomedres-openaccess-journal-bjstr


Discussion

As the main objective of our study was to determine frequency of urinary tract infection in females with preterm labor. Urinary tract infection is the common of all bacterial infections, affecting human beings throughout their life span especially in women. Around 20% women in the age range 20-65 years suffer from at least one episode per year, while 50% develop urinary tract infections within their lifetime.( 69) Not surprisingly infections of the urinary tract are the most common bacterial infections encountered during pregnancy. Plausible explanation of increasing risk of UTI and peaking during weeks 22 to 24, was due to uretheral dilatation, decreased tone, decreased urine concentration and increased stasis, plus hormonal changes, all these factors contribute to the increased risk with increased pregnancy duration.( 79) The mean age of patients was 28.45 ± 4.44 years in our study. The mean gestational age of patients was 28.80 ± 4.32 weeks in our study. The mean value of parity in our patients was 3.36 ± 1.76. In urinary tract infection of our study patients out of 357 patients 115 (32.2%) have urinary tract infection and 242 (67.8%) have not urinary tract infection. Results are matched with a study.(90) The prevalence of UTI increases with age by 1% to 1.5% per decade and that the frequency of UTI is directly proportional to gravidity. The numbers of patients were not sufficiently large to determine which effect that of age or that of gravidity was greater. In other population-based study, on non-pregnant women, however, age was found to have a greater effect than gravidity on the prevalence of bacteriuria (36).

Urinary tract infections (UTIs) are common in pregnant women and pose a great therapeutic challenge, since the risk of serious complications in both the mother and her child is high. Pregnancy is a state associated with physiological, structural and functional urinary tract changes which promote ascending infections from the urethra. Unlike the general population, all pregnant women should be screened for bacteriuria with urine culture, and asymptomatic bacteriuria must be treated in every case that is diagnosed, as it is an important risk factor for pyelonephritis in this population. The antibiotic chosen should have a good maternal and fetal safety profile The age frequency distribution results showed that 228 (63.9%) was from 18-30 years age group and 129 (36.1%) was from 31-40 years age group. More was belongs to 18-30 years age group. Similar results also find in a study.(89) The gestational age showed that out of 357 patients 170 (47.6%) was from 22-30 weeks gestational age group and 187 (52.4%) was from 31-37 weeks gestational age group. More was from 31-37 weeks gestational age group. The parity showed that out of 357 patients 205 (57.4%) was from less than 3 group and 152 (42.6%) was from more than three groups. More patients was from less than 3 group. The urinary tract is a common site of infection in humans. During pregnancy, urinary tract infection (UTI) is associated with increased risks of maternal and neonatal morbidity and mortality, even when the infection is asymptomatic. By mapping available rates of UTI in pregnancy across different populations, we emphasize this as a problem of global significance.

Many countries with high rates of preterm birth and neonatal mortality also have rates of UTI in pregnancy that exceed rates seen in more developed countries. A global analysis of the etiologies of UTI revealed familiar culprits as well as emerging threats. Screening and treatment of UTI have improved birth outcomes in several more developed countries and would likely improve maternal and neonatal health worldwide. However, challenges of implementation in resource-poor settings must be overcome. Our study furthermore strengthens the association between urinary tract infections with adverse fetal outcomes. Health education about personal hygiene, urine cultures early in pregnancy and during the third trimesters especially for low socioeconomic pregnant women must be considered in routine clinical practice.

Conclusion

UTI in pregnancy (whether symptomatic or asymptomatic) is a risk factor for adverse outcomes that endanger the health of both mother and fetus. Multiple sources of evidence strongly support screening and treatment of UTI as a valuable approach for improving birth outcomes. Resource availability appears to be the primary hurdle for eventual reductions in adverse pregnancy outcomes associated with UTI. Where the resources are available, we encourage maternal and child health organizations and local governments to consider, or reconsider ASB screening and treatment as part of a package of infection prevention strategies (including sexually transmitted infections) to reduce pregnancy complications. It is our hope that the information compiled here will increase awareness of the global significance of UTI in maternal and neonatal health and embolden governments, nongovernmental organizations, and researchers to do their part to make urine screening and UTI treatment a reality for all pregnant women.

Follow us on: Biomedical Journal Impact Factor: https://biomedres.us

https://scholar.google.com/citations?user=OFtUOZYAAAAJ&hl=en
https://www.base-search.net/Search/Results?lookfor=Biomed+Journal+of+Scientific+%26+Technical+Research&l=en&refid=dcsuggesten
https://citefactor.org/journal/2574-1241/biomedical-journal-of-scientific-technical-research
https://ideas.repec.org/s/abf/journl.html
https://econpapers.repec.org/article/abfjournl/
https://www.ncbi.nlm.nih.gov/nlmcatalog/101723284
https://bjstr.org/
https://bjstr.org/about.php
https://biomedres.us/reprints.php
https://biomedres.net/submit-manuscript.php