Journals on Orthopedics

Trigger of All Fingers in an 80 Years Old Male: A Case Report

Introduction

Trigger finger is a common condition with a reported prevalence of 2% to 20% [1,2]. Generally, trigger finger affects women more than men and the age distribution is bimodal with one group below six years of age and the other in their fifth and sixth decade of lif. It is a disorder which is associated with entrapment of the flexor digitorum superficialis or flexor digitorum profundus tendon along its course through fibro-osseous tunnels of the wrist, palm and digits of the hand [1]. Onset is usually gradual, associated with repetitive tasks, unaccustomed activity or compression of the pulley against hard objects. Snapping, clicking, locking, stiffness, and difficulty extending a flexed digit, often with discomfort or pain, are the most prominent symptoms [3,4]. Several studies suggest that individuals with type 1 diabetes, rheumatoid arthritis, carpal tunnel syndrome, arthritic changes in the wrist, hypothyroidism, mucopolysaccharidoses, amyloidosis, and congestive heart failure may be predisposed to flexor tendon entrapment [1].

The research on patients with trigger finger indicates various methods of treating patients including splinting, nonsteroidal antiinflammatory agents, percutaneous injection of corticosteroids, and surgical releas [1,2,5]. Very small, uncontrolled case series have shown in their results that only about half of patients are satisfied with their symptoms after a period of splint immobilization [6-8]. Triggering may resolve after one or two corticosteroid injections, but the results vary substantially between studies (35 % and 87 % for one and 72 % to 92 % for two injections) [9-13]. Various literatures suggest that patients should be informed about 50% success rates when offering a corticosteroid injection for trigger finger and that the chances of patients landing to surgical release still remains [14-16]. Percutaneous release has a success rate of 94% according to a recent systematic review of 2114 procedures but is accompanied by relatively high rates of complications like injury to nerves, injury to A2 pulley and bowstringing [17]. Open surgical release has a high success rate with few adverse events and is supposed to be the final treatment for trigger fingers [18,19]. We here present a case of trigger finger which has unique presentation but is successfully treated with open release.

Case Report

Figure 1: Release of A1 pulley of right thumb.

Figure 2: Release of A1 pulley of right thumb.

An 80 years old male patient presented to our OPD with triggering of both thumbs and middle finger of left hand. The patient had no co morbidities like diabetes, hypertension, or hypothyroidism and hence was advised percutaneous steroid injections along with analgesics and relative splinting. 2 weeks after the injection he was relieved of his symptoms in left thumb and middle finger but right thumb was still affected. The patient was advised 2nd dose of subcutaneous steroid injection along the flexor tendon sheath and A1 pulley of right thumb but his symptoms still persisted. As the patient was still reluctant to undergo surgical release he was offered splinting and relative rest to the thumb. After 2 months of initial presentation he again present to our OPD with triggering and pain at A1 pulleys of all fingers in right hand and remaining 3 fingers in the left hand. He was finally operated with release of A1 pulley of all fingers in right hand and steroid injections in left hand. After 3 months of surgery the patient was doing well with good finger grip and no pain or restriction of movements. The operative pictures and surgical approach has been shown in (Figures 1 & 2).

Discussion

The present case is unique in itself with only one case reported till date as triggering of 10 fingers [20]. Although the presentation was gradual and the treatment was staged with physiotherapy, steroid injection and finally with surgical open release but eventually all the fingers were involved in a period of 3 months and they needed some form of intervention. Two out of three fingers which were initially treated by steroid injections were cured with no symptoms after 3 months of presentation. This result is similar to the published data about the efficacy of steroid injections in treatment of trigger fingers [9-11]. Patients who have recurrence or treatment failure with steroid injections are usually seen to opt for surgery in the first place, if other fingers are involved. Similar is the situation in our case where the patient opted for surgical release when remaining fingers were involved.

Trezies et al. investigated the occupational histories of 178 patients with idiopathic trigger fingers and they demonstrated no significant difference between the occupational distribution of patients with trigger digits and that of the general population [21]. They concluded that occupation may have a role to play in triggering of digits but many patients develop trigger for reasons other than occupation. Weilby concluded that anatomic and intrinsic factors, contribute to a predisposition for the development of tendon entrapment of the hand [22]. Our patient was a male who did not have any predisposing factors such as thyroid disease, diabetes, renal disease, connective tissue disorders, gout or rheumatoid arthritis. The unusual presentation of this patient at the age of 80 years with no positive family history and with no occupational predisposition for trigger finger makes this case unique in itself.

Conclusion

Trigger finger is a condition characterized by fibrocartilagenous metaplasia and hypertrophy of the surrounding structures of the flexor tendon resulting in a painful and debilitating restriction of motion. Flexor tendinopathy could be multi-factorial including anatomical variations of the pulley system and biomechanical etiologies. This could be exposure to shear forces and unaccustomed activity. Conventional treatment aims at decreasing inflammation through corticosteroid injection or surgically removing imposing tissue. Steroids although serve as a non surgical means to relieve the patient of symptoms, but have a limited role in multiple trigger digits presenting at one setting.

For More Articles: Biomedical Journal Impact Factor : https://biomedres.us

Journals on Obstetrics & Gynaecology

Pseudo-Meigs Syndrome with Ovarian and Abdominal Tuberculosis: A Case Report

Abstract

Tuberculosis (TB) is the second leading cause of death from infectious diseases worldwide. In non immuno compromised women, extra pulmonary TB accounts for 20% of new cases identified .Isolated ovarian TB is an uncommon disease given that genitourinary TB usually presents with endometrial and fallopian tube involvement. We report a case of cystic ovarian mass, with ascites, pleural effusion; tuberculosis of ovary and omentum; third degree utero vaginal prolapse in a post menopausal woman. Ascites and pleural effusion resolved spontaneously in a week of surgery. Patient received ATT and recovered well. Diagnostic difficulties in this case are discussed.

Keywords: Extra Pulmonary Tuberculosis; Ovarian Cyst: Ovarian Tuberculosis; Pseudo Meig’S Syndrome

Introduction

Tuberculosis (TB) is the second leading cause of death from infectious diseases worldwide [1]. Genitourinary TB is the second most common site for extra pulmonary TB [2]. Extra pulmonary TB is common in immuno compromised patients. 20.2% of the new cases of TB are extra pulmonary. Nine percent of extra pulmonary tuberculosis is accounted by genital tuberculosis [2]. Isolated ovarian TB is an uncommon disease given that genitourinary TB usually presents with endometrial and fallopian tube involvement [3]. Pseudo Meigs syndrome is co existence of pelvic tumour, hydrothorax and ascites. Pseudo Meigs syndrome is clinically important because it resembles metastatic pelvic cancer. Pelvic and peritoneal tuberculosis may resemble advanced ovarian cancer.

Case Report

Mrs.xxxx aged 50years P1L1, post menopausal lady presented at Obstetrics & Gynaecology department of Vinayaka Mission`s Medical College & Hospital for mass descending per vagina since 1 year and abdominal distension since 1 year. She is from a low socio economic status, rural, agricultural background. Her last childbirth is 34 years ago. Attained menopause 10 years ago. She is not a known case of hypertension or diabetes mellitus. H/o contact with Pulmonary TB present (neighbour-defaulter and died 6 years ago). Dull looking, thin built woman, cachexic, with BMI 16kg/m2. Spine is normal. No lymphadenopathy. On systemic examination-dull note and diminished breath sounds on right lower chest. On abdominal examination-no ventral hernia, no doughy feel of abdomen. Mass of 18×20 cm arising from pelvis, extending from right iliac fossa to left iliac fossa. Mass is mobile, cystic, mildly tender and lower border of the mass couldn’t be felt Minimal ascites.

On Gynaecological examination, third degree UV prolapses with cystocele and rectocele with Keratinization. On bimanual examination uterus atrophic, douglas pouch is full; mass is felt high up, continuous with abdominal mass. Colpocentesis yielded straw coloured fluid. On Ultrasonography–Uterus shows postmenopausal atrophic changes, of size measuring 4.0×2.7×2.1 cm, Myometrium normal and endometrium thin. A large well defined thin walled anechoic midline abdominopelvic cystic lesion seen with multiple septae and internal echoes, with few hyper echoic areas. The mass measured 19x17x10 cm; no calcification. Both ovaries are not imaged. Minimal ascites Serology: HIV-negative Tumor markers found to be

a). Alpha Feto Protein : 0.67 IU/ml

b). Beta HCG : 5.17 mIU /ml

c). CA 125: 213.4 units/ml

d). CA 15-3: 25.7 units/ml

e). CA 19-9 :< 0.6 units/ml

f). CEA: 1.3ng/ml

Chest X Ray-Lungs clear; moderate pleural fluid on right side CT Abdomen revealed well defined abdominopelvic hypodense cystic mass present with few areas of peripheral solid elements, minimal calcification. Mild ascites. Cytology of Ascitic Fluid-negative for malignant cells. Pleural analysis showed no malignant cells. With the team of Gynaecologists and Oncosurgeon- laparomy done. Liver, spleen normal. No adhesions. Moderate ascites. Uterus and tubes are atrophic, no nodularity. Left ovary atrophic. Right ovary is the seat of palpable mass; mass is free from adhesions, cystic, septate with few solid areas. Small areas of papillary projections noted over ovarian mass. No obvious peritoneal nodules. No lymphadenopathy. Small area of rolled up omentum. Bowel wall not involved. Right Ovarian Cystectomy, Salphigectomy, Total Abdominal Hysterectomy with Left Salphingo-Oophorectomy done. Omental and peritoneal biopsy done. Post operatively, 2 units of Albumin infusion and packed cell transfusion done. Histopathological findings- Atrophic endometrium; Myometrium unremarkable; Chronic cervicitis; Serous cystadenoma; Epitheloid granulomas seen in the right ovary; peritoneal biopsy nil significant; Omental tissue showed Tuberculous Granulomas. Post operative period uneventful. Anti tuberculous treatment started during hospital stay. Rifampicin, Isoniazid, Ethambutol and Pyrazinamide daily dose for two months followed by Rifampicin and isoniazid. Ascites and pleural effusion disappeared in a week. At six months post operative, general condition improved; definitive surgery for prolapse is scheduled.

Discussion

This patient presented with prolapse uterus, cystic ovarian mass with ascites and pleural effusion suggestive of Pseudo-Meigs syndrome and histological evidence of Omental tuberculosis. All other pelvic organs were spared. No definite diagnosis can be made. Genital TB accounts for 5-15 % of infertility. In women with tubal factor of infertility,30-50 % can have tuberculosis. In genital tuberculosis, fallopian tube is involved in 80-90 %; endometrium in 60-80 % ; ovary involved in 20-30 % and cervix in 5% of cases. Tuberculosis of pelvic organs mimics advanced ovarian cancer due to the presence of ascites, complex adnexal masses, peritoneal deposits and raised CA-125 level, especially in peri-and postmenopausal women. Other common features among women with these two conditions are abdominal pain and distension, weight loss and reduced appetite. Pseudo Meigs syndrome is a condition characterised by non malignant ascites and pleural effusion along with pelvic tumours other than solid benign ovarian tumours. Occasionally leiomyomas, stomach and colonic tumours are also seen [4]. It may occur in patients with systemic lupus erythematosis and can have elevated CA125 level [5].

A thorough family history may narrow the differential diagnosis from an infectious etiology, such as TB in patients with multiple family members who had TB, to malignancy in a family history of ovarian cancer [6,7].

In premenopausal women, elevations in CA-125 have been noted in endometriosis, TB, and other non neoplastic diseases.This makes CA-125 relatively nonspecific and non diagnostic in premenopausal women. CA-125 is elevated in 80% of postmenopausal ovarian carcinomas. Initial diagnosis of tubo ovarian abscess or ovarian malignancy can be mistaken given the similarities in clinical, radiologic, and serum markers such as an elevated cancer antigen-125, (CA-125) [8]. Sometimes women with pelvic-peritoneal tuberculosis may be subjected to a laparotomy for suspected ovarian cancer which is likely to increase their morbidity [9-13].

Conclusion

As the treatment of pelvic-peritoneal tuberculosis is completely different from that of ovarian cancer, it is important to reach a correct diagnosis. An effort should be made to obtain a cytological or histopathological diagnosis of either condition by ultrasound guided needle biopsy or laparoscopically obtained biopsy rather that proceeding with laparotomy for suspected ovarian cancer.

For More Articles: Biomedical Journal Impact Factor : https://biomedres.us

Journals on Orthopaedics

Low Back Pain: Not a Segmental Pathology

Abstract

Objective: To evaluate the pathologies of musculoskeletal system in patients complaining of low back pain. Methodology: One hundred patients, who reported to us for treatment of Low back pain (LBP), were included in the study. All patients had radiological assessment of complete spinal cord as well as other segments of musculoskeletal system.

Results: There were 58 males and 42 females. The age of the patients ranged from 13 to 84 years. The mean age ± SD was 52.5 ± 15.9 years. Nearly half of the patients (45%) showed pathologies in neck region, 31% in Temporo-mandibular joint, 22% in knees and 17% in shoulder joints. No pathology was noted among ribs or feet.

Conclusions: The results of the present study calls for wider dissemination of these findings and making health care providers of the importance of examining all area of musculoskeletal system when treating patients with low back pain.

Introduction

The system of muscles, tendons, ligaments, bones, joints and associated tissues that move the body and maintains its form is called Musculoskeletal System [1]. The diseases of this system, referred to as musculoskeletal diseases (MSDs), are extremely common and have important consequences for the individuals and society2. MSDs are one of the major causes of disease burden around the world and have been a significant reason for development of WHO’s Bone and Joint Decade3. MSDs affect individuals by limiting their activities and restricting their participation in the work force, thus increasing the need for social support. Three MSDs, rheumatoid Arthritis, Osteoarthritis and Backache are important causes of Disability -adjusted – life years (DALYs) [2].

In World Health Organization Global Burden of Disease (WHOGBD) Study 2010, low back pain (LBP) was the leading cause of years lived with disability in the world, neck pain being the fourth cause, and other musculoskeletal disorders the fifth4. According to World Health Organization, the prevalence of MSDs is increasing in both developing and developed world [3-5]. In 2010 study, prevalence of low back pain based on 165 studies from 54 countries was 11.9 ± 2 %, which increased to 12.2% (95% CI = 12.3-13.1 %) in WHO’s latest Global Burden of Diseases Study [5] of 2013.

Musculoskeletal conditions are a diverse group with regard to pathophysiology but are linked anatomically and by their association with pain and impaired physical function. They encompass a spectrum of conditions, from those of acute onset and short duration to lifelong disorders; including osteoarthritis, rheumatoid arthritis, osteoporosis, and low back pain. The prevalence of many of these conditions increases markedly with age, and many are affected by lifestyle factors, such as obesity and lack of physical activity [3]. New episodes are twice as common in people with a history of low back pain. Lifetime prevalence is58- 84% and the point prevalence (proportion of population studied that are suffering back pain at a particular point of time) is 4-33%9 [6]. Low back pain affects men a little more than women and is most frequent in the working population with the highest incidence seen in those aged 25-64year [6]. The prevalence differs with the type of population studied. Three studies of Pakistan [7-9] show a prevalence of 6.5% to 44.1%.

The exact source of acute low back pain is often difficult to identify. In fact, there are numerous possible pain producers including muscles, soft connective tissue, ligaments, joint capsules and cartilage, and blood vessels. These tissues may be pulled, strained, stretched or sprained. Additionally, annular tears (small tears that occur in the outer layer of the inter vertebral disc) can initiate severe pain. Even if the actual tissue damage is minor, and likely to repair quickly, the pain experienced may be quite severe. No matter which tissue is initially irritated, a cascade of events occurs which contributes to the pain experience. Numerous chemical substances are released in response to tissue irritation. These substances “stimulate” the surrounding pain sensitive nerve fibers, resulting in the sensation of pain. Some of these chemicals trigger the process of inflammation, or swelling, which also contributes to pain. The chemicals associated with this inflammatory process feedback more signals which perpetuate the process of swelling. The inflammation attributable to this cycle of events may persist for days to weeks [10].

Many studies have found patients with low back pain having significant changes in other joints [11-13]. However; this fact has never been brought to light in Pakistani literature. Since our centre primarily caters to the patients suffering from musculoskeletal disorders, it was thought worthwhile to undertake a similar study.

Materials and Methods

Figure 1: Joints involved.

One hundred consecutive patients complaining of low back pain were included in the study. There were 42 females and 58 male patients. On arrival at our centre, each patient was interviewed in detail by a Medical Officer / Psychologist. The presenting complaints were recorded and height, weight, Blood Pressure, Pulse and BMI are noted. Thereafter, the patient had complete physical examination by an Orthopedic Surgeon. For cervical spine, transverse processes are palpated on both sides from C2 to C6 for each vertebra and spinous process is palpated for C7 vertebra. For thoracic and lumbar spine, spinous processes are palpated for each vertebra. For sacral spine posterior surface is palpated. SI joint is palpated on posterior joint line, ankle joint is palpated on deltoid ligament and lateral collateral ligament, knee joint is palpated on site of attachment of medial collateral ligament, hip joint is palpated on greater trochanter, sternoclavicular and shoulder joints are palpated on anterior joint lines, elbow joint is palpated on lateral and medial side of olecranon, wrist joint is palpated on joint line dorsally and on radial and ulnar styloid processes and small joints of hands and feet are palpated on respective joint lines. Radiological and where needed laboratory investigations were undertaken for all joints shown in Figure 1. At our centre, all records are computerized. Radiological imaging is reported by local Radiologists as well as Radiologists at KKT Centre Canada.

Results

The age of the patients ranged from 13 to 84 years (Table 1). The mean age of100 patients was 52.2 ± 15.9 years being 51.9 ± 17.8 years among males and 52.5 ± 11.7 years among females showing no significant difference (P= 0.86). The pathologies seen in joints other than spine are shown in Figure-1. The maximum number of patients (45%) showed pathologies in neck region, 31% in Temporo-mandibular joint, 22% in knees and 17% in shoulder joints. No pathology was noted among ribs or feet.

Table 1: Joints involved.

Discussion

Many investigators have studied the involvement of various joints in patients of low back pain. Shum et al11 of United Christian Hospital, Hong Kong studied 60 patients to examine differences in the kinematics and joint coordination of the lumbar spine and hips between healthy subjects and patients with sub-acute low back pain (LBP).They concluded that back pain was related to changes in the kinematics and coordination of the lumbar spine and hips during sit-to-stand and stand-to-sit. Assessment of back pain patients should include kinematic analysis of the hips as well as the spine.

In another study, the same group12 studied 20 asymptomatic subjects, 20 LBP and 20 patients with LBP and a positive straight leg raising test were requested to perform the sit-to-stand and stand-to-sit activities. Electromagnetic sensors were attached to the body to measure their kinematics. Back Pain patients exhibited compensatory movements and altered load sharing strategies during sit-to-stand and stand-to-sit activities. They conclude that the therapy should take account of these changes so that normal kinematic and kinetic characteristics of the spine and hip can be restored.

Rahbaret et al. [13] of Tabriz University of Medical Sciences in Iran conducted a case control study on 170 patients in order to evaluate the association between knee pain and lumbar disorders. They concluded that low back pain may be responsible in the development and/or progression of knee pain. Conversely, chronic and debilitating LBP can be due to the effects of knee pain and lower extremity impairments.

Renkawitz et al. [14] from University of Regensburg, Germany conducted an experimental study on 82 individual in order to examine the relationship between Low Back Pain (LBP), neuromuscular imbalance, clinical symptoms, and trunk extension strength on two independent occasions. A direct relationship between LBP and neuromuscular imbalance was documented in individuals with LBP, whereas no significant imbalance was found in subject without LBP. However, our findings are in contrast to the prevailing practices in Pakistan. Most health care providers treat low back pain as a segmental pathology. The moment a patient with low back pain comes to a Health Care Provider; a General Practitioner or an Orthopedic Surgeon, the total attention of health care provider gets focused on to lumber/sacral spine. Radiological investigations of spine are started ignoring a thorough examination of other musculoskeletal areas. The results of the present study are in conformity with the findings of international studies mentioned above. Up to 45% of patients with low back pain were having pathologies of other musculoskeletal areas also.

Conclusion

The results of the present study calls for wider dissemination of these findings and making health care providers aware of the importance of examining all areas of musculoskeletal system when treating patients with low back pain.

For More Articles: Biomedical Journal Impact Factor : https://biomedres.us

Journals on Orthopaedics

Controversies in the Acute Management of High Spinal Cord Injuries, an Update and Opinion

Abstract

The incidence of spinal cord injuries is the lowest of all major trauma, with devastating impact on the individual affected. The immediate treatment, though it remains mainly supportive, in many situations will determine the outcome and the cost of health care. Standards of care are unfortunately still lacking, this is mainly due to the existing controversies and lack of effective treatment of the injured cord. The author discusses here some of the controversial points based on literature review and personal observation.

Abbreviations : MP: Methyl Prednisolone; NASCIS: National Acute spinal Cord Injuries Study; SDI: Spinal Decompression in Acute

Introduction

Timing of surgery

It is well known that secondary insult to the spinal cord may occur because of mechanical as well as physiological instability, an injured cord will exhibit a cascade of pathological processes involving immune mechanisms and mediators which will lead to swelling of the cord rendering it susceptible to iatrogenic injury including hypoxia and hypotension, this is found to be maximal at 24 hours. The argument for early surgery should mean that it is carried out within 4 hours of injury i.e. before cord swelling become apparent; complex, or lengthy surgery at the stage of spinal cord oedema could be harmful. Reports exist that outcome of surgery done at 24 to 72 hours is not associated with better neurological improvement or shorter length of stay in hospital, at the same time reported a high percentage of complications ranging between 24 to 41% [1-20].

It has to be noted that in cervical and upper thoracic cord injuries,” surgical stabilisation is not synonymous with early mobilisation “, that was mainly due to the multisystem physiological dysfunction and instability associated with SCI, which may take few weeks to settle. Optimum time for surgical intervention remains a question and it is the opinion of the author that surgery is best done within 4 hours of injury or be deferred later provided that alignment of the spine is corrected and maintained by traction in case of cervical spine injury and bed rest (postural reduction) in thoracic injuries, this is in addition to the standard supportive measures aimed at maintaining adequate cord perfusion and oxygenation [20-30].

High Dose Methyl Prednisolone

Since the publication of the National Acute spinal Cord Injuries Study (NASCIS) II, high dose methyl Prednisolone administration in the first 8 hours became a standard treatment for the acutely injured spinal cord. Evidence is now accumulating that there is no appreciable functional improvement after such treatment despite a modest improvement in motor scale, in addition it has been shown that the study itself contain statistical artefacts. Although steroids continue to be given to patients with spinal cord injury in many institutions, evidence of deleterious effects continues to accumulate. This controversy led to surgeons having to administer the drug for fear of litigation rather than due to a belief in improved clinical outcomes. After critical evaluation of the data available it is concluded that there is no sufficient evidence to support the use of MP in acute SCI [30-45].

Spinal Decompression in Acute SCI

It has been shown that many incomplete SCI patients, neurologically & functionally improve after conservative treatment and / or surgical stabilisation only without decompression of a traumatic spinal stenosis. Also literature show that closed or open reduction of dislocated facets in case of cervical spine offers a satisfactory decompression especially in the first few hours after injury, with good clinical outcome (in some series up to 85%) in terms of neurological improvement. After critical analysis of the available literature, there is clearly no correlation between the percentage canal encroachment and the extent of neurological deficit, also neurological recovery does not correlate with canal decompression in acute trauma of the spinal cord. Neurological decompression and stabilisation, however is indicated in cases of neurological deterioration due to epidural collection or inability to maintain spinal alignment [45-55].

Conclusion

Management of acute SCI is still sub-optimum in many areas due to the relative rarity of such devastating injury; more high quality research is required to arrive at consistent standards of care or protocols of management. It is the opinion of the author that the need arises for the creation of spinal injuries centres covering a wide population area, with an integrated multi-disciplinary input and a comprehensive care routine of management from the early hours of injury; this will undoubtedly solve the competency issue of the treating team.

For More Articles: Biomedical Journal Impact Factor : https://biomedres.us

Journals on Public Health

Interlinkages of Literacy and Household Poverty in India: Inter-District and Socio-Demographic Disparities

Abstract

Poverty and illiteracy are the greatest challenges in the process of development. Though India has witnessed tremendous improvement both in reducing poverty and increasing literacy rate, the inter-district variations and differentials within different population subgroups are still large. Using the Census of India, 2011 data this paper attempts to understand the inter-district variations in poverty and literacy status and also differentials of literacy rate among different social sub-groups. The census of India collects the information on seven household assets. These are used to construct the wealth index as a proxy for consumption poverty using Principal Component Analysis from inter-district variations. The preliminary results show that the inter-district and intra-district variations are large in assets possession.

India has 17.8% of the households those do not possess any of the specified household assets with lowest in Chennai district of Tamil Nadu with less than one percent and highest in Dindori district of Madhya Pradesh with 64.9%. With respect to the effective literacy status, India has 73% of literate population among 7 years and above. After classifying the effective literacy status by poverty, it is found that the effective literacy rate among the districts from lowest wealth tertile was 66.1% compared to 80.7% among the districts from higher wealth tertile. The study found a positive and high correlation of 0.611 between wealth score and effective literacy rate at the district level. However, there are certain districts which had low effective literacy rate despite high wealth score. The study also observed that the females especially among ST population are still far lag behind to achieve satisfactory effective literacy level in India. Thus, immediate interventions should be addressed among the most disadvantaged districts and especially the females among ST population.

Keywords: Inter-district disparity; Wealth index; Effective literacy rate; Census of India

Introduction

Eradicating Poverty and hunger in its all forms, and education for all are two critical components in both international and national development agenda and government schemes. However, these two are the major concerns in developing countries. In Indian context, majority of the population are living in poverty and majority of them are deprived from some primary education. In last two decades, India has shown improvement both in reducing poverty and increasing literacy rate. Poverty has reduced by half from 45.3% in 1993-94 to 21.9% in 2011-12 (planning commission, 2013), while literacy rate increased from 52.2% in 1991 to 73% in 2011 (census). Despite the improvement in poverty and literacy still there are most of the people die due to hunger and more than one-fourth of the total population are not able to read and write.

Also regional disparities as well as social disparities in poverty and education increasing over period of time Rukhsana and Alam [1]; Shivakumar and Vijay [2]; Shafiqullah [3]. Studies found that the BIMARU states are lagging behind both in poverty and education than other states of India Shivakumar and Vijay [2]. Poverty in any means leads people deprive and vulnerable. There is a general agreement that improvement in educational status reduces the level of poverty. On the other side poverty becomes an obstacle to access basic education. The poor people are often not able to access their basic needs and rights. It is evidenced that the poor people tend to have lower level of education. Education is generally considered as an important instrument for social, economic and cultural development. It can reduce most deprivation and vulnerability. Acquiring basic education is the most important ingredient in building a nation Haq and Haq [4].

Poverty and literacy have greater impact on life. Literacy is considered as an important tool to get rid from the poverty trap. This has also many social, economic and demographic implications on life. Literacy leads to awareness and illiteracy leads to ignorance. The awareness leads to access the needs and rights. Thus it is considered as most important weapon for the development of the individual as well as the society. Though the literacy status has great importance in development for any society, more than one-fourth of the Indian’s can’t even read and write. Access to higher education in India is even very low where only 6-7 percent of the Indian youthin the age group 17-23 has access to higher education Das [5]. This literacy situation varies greatly across the geographical boundaries as well as across the population subgroups. Literatures on poverty and literacy status found a negative relationship between poverty and education. Studies argued that increasing budgetary allocation alone without reducing the poverty level would not be sufficient to improve the education level Ahmad and Batul [6].

The school drop-out is significantly associated with the state poverty level in India Basumatary [7]. Census of India periodically collects the information on literacy status in its complete enumeration process in every ten years gap. It will be very useful to examine the literacy status at the district level as it is one of the most important indicators for the development. For the development of any society it needs more educated people for the social and economic growth. This paper aims to measure the inter-district variations in asset possession and literacy status in India. Further it aims at examining the social disparities in literacy status in India. This research hypothesized that the literacy rate is low among the low asset possession districts.

Data and Methods

Data

Present study is based on the secondary data. This paper used the available district level data on possession of household assets and literacy status from the Census of India, 2011. Census of India does not collect direct economic measures (income/consumption) rather collects information on household possession on seven variables; Radio/Transitor, Television, Computer/Laptop with or without internet, Telephone/Mobile/Both telephone and mobile, Bicycle, Scooter/Motorcycle/Moped, and Car/Jeep/Van. These asset variables are used as proxy for direct economic measures. Literacy status among those seven years and above is available in Census. According to the census of India, the persons those are seven years and above can able to read and write are considered as literates. In this paper the literacy rates are calculated for all population, SC and ST population by males and females. The analysis is done for all 640 districts in India; 609 districts have SC population and 585 districts have ST population.

Methods

Descriptive statistics are used to analyze the inter-district variations in poverty and literacy status in India. Percentages are first calculated from the absolute numbers. Ranks are assigned to the districts according to the poverty and literacy rate. The principal component analysis (PCA) is used to construct wealth index using the household asset possession. The census of India collects information on asset possession at the household level. Actual income of the household is not collected by the Census of India. Thus in this study, wealth index is constructed using the economic proxy variables. The factors are extracted on the basis of inter-district variations in the household asset variables.

The first component captures the maximum variability about 54.7% and that has been considered for constructing the wealth index. Through PCA, all districts have assigned a score i.e. wealth score and this is measured as poverty at district level. The districts are ranked according to the wealth score; 1st rank is given to the district with highest wealth score. The districts are also classified into three equal groups (tertile) according to the wealth score. The alpha index of 0.72 indicating the wealth index is reliable.

Relative literacy achievement index is also calculated among the districts. This is calculated using the following formula:

Relative literacy achievement index = (Actual literacy rate – Minimum literacy rate)/(Maximum-Minimum)

The value of relative literacy achievement index varies from 0 to 1. The district with lowest literacy rate will get the value of 0 and the district with highest literacy rate will get the value of 1. All the districts are grouped into tertile according to the relative literacy achievement values.

Results

Spatial pattern of poverty

Inter-District Variations In Possession Of Household Assets: Before discussing inter-district variation in wealth index a portrayal of inter-district scenario in asset possession would be helpful to overview the poverty level in the country. Figure 1 provides the percentage of households with specified household assets. The figure shows that majority of the Indian households have telephone/mobile (63.2%) followed by television (47.2%), and bicycle (44.8%). Little more than one-fifth households (21%) and about one-fifth households have possessed scooter/ motorcycle/moped and radio/transit respectively. Possession of computer/laptop with or without internet and car/jeep/van was 9.5% and 4.7% respectively. Besides, one important information regarding the asset possession was collected by the census is that the households possess none of the specified assets.

Figure 1: % of households with possession of household assets in India, 2011.

The households without any of the specified assets are considered as sever poor households. India have 17.8% of the households those do not possess any of these household assets. Among the states it varies from as low as 4.4% in Punjab to as high as 35.8% in Meghalaya. Similarly, among the union territories percentage of households with none of the specified assets varies from 1.9% in Lakshadweep to 24.9 in Dadra and Nagar Haveli. At thedistrict level, a large inter-district variation found in the possession of household assets. Among the districts Dindori district of Madhya Pradesh has the highest percentage of households (64.9%) with none of the specified assets and Chennai district of Tamil Nadu has the lowest percentage of households (less than one percentage) with none of the specified household assets. The inter-district variations within the state is also found very high (for example in Madhya Pradesh it varies from 8.1% in Indore district to 64.9% in Dindori district)

Inter-district variations in wealth index: Using the principal component analysis (PCA) a wealth index is constructed from inter-district variations in seven household asset possession (Radio/Transitor, Television, Computer/Laptop with or without internet, Telephone/Mobile/Both telephone and mobile, Bicycle, Scooter/Motorcycle/Moped, and Car/Jeep/Van). Table 1 describes the mean, standard deviation and factor scores. At the district level, possession of television has the maximum variation with the standard deviation (SD) of 24.0 followed by bicycle with SD of 22.1, phone/mobile with SD of 18.7, scoter/motor cycle/moped with SD of 12.2 and radio/transistor with SD of11.4. Least inter-district variation was found in computer/laptop and car/jeep/van with the standard deviation of 5.7 and 4.7. The factor scores have positive values except bicycle. A positive factor score indicates higher economic status and a negative value indicates lower economic status. Car/jeep/van, computer/laptop, and phone/mobile have higher factor scores compared to other variables. Figure 2 shows the distribution of factor scores for component 1 among the districts in India. The figure shows that the factor scores are negatively skewed indicating less number of districts have very high factor scores.

Figure 2: Distribution of wealth scores for component 1.

Table 1: Mean standard deviation and factor score of asset variables in India, 2011.

Inter-district variation in wealth score and the rank are presented in (Appendix A1). East district of NCT Delhi has the highest (1st) rank in possession of household assets and Bijapur district of Chhattisgarh has the lowest (640th) rank. Mostly the districts from Chhattisgarh, Odisha, Madhya Pradesh, Jharkhand, Bihar, Assam and West Bengal possess low wealth score. Large intra-district variations are also observed in possession of wealth score in India. Figure 3 displays a cartographic presentation where all the 640 districts of India are grouped into three categories according to the factors scores. The map shows that the districts under central region, eastern and north eastern had low factor scores indicating low household possession.

Figure 3: Classification of Indian districts according to the wealth score, 2011.

(Appendix A1) 10.26717/BJSTR.MS.ID.000467Appendix1.pdf

The districts from Madhya Pradesh, Chhattisgarh, Odisha, Jharkhand, Bihar, Uttar Pradesh and districts from north-eastern states comes under the low wealth index category. The districts from Kerala, Tamil Nadu, Maharashtra, Gujarat, Punjab, Haryana, Himachal Pradesh and Jammu and Kashmir fall under the high wealth index category. The districts those belonged to low wealth index category constitute 28.5% of the total population or 345 million people where medium wealth index districts constitute 35.4% or 428 million people and high wealth index districts constitute 36.1% of the total Indian population or 437 million people.

Effective literacy status in India: (Appendix A2) presents the effective literacy status for all population, SC and ST population subgroups by sex. The effective literacy rate of India was witnessed a tremendous growth from 64.8% in 2001 to 73% in 2011. However, the effective literacy rate among SC and ST population remained low at 66.1% and 59% respectively. In India the male literacy rate was 80.9% and the female literacy rate was 64.6%. The gap between male and female literacy rate is 16.3 percentage points which seems females are lag behind in literacy rate. These gaps are higher among SC population (18.7 percentage points) and highest among ST groups (19.2 percentage points). More than half of the females among ST are illiterates. Among the SC population the literacy rate is 56.5%.

Inter-district disparities in effective literacy rate: (Appendix A2) shows that Serchhip district of Mizoram holds the 1st rank among the districts in literacy rate with 98% of literacy rate while Alirajpur district of Madhya Pradesh holds the 640th rank with36% of literacy rate. There are 15 districts in India where more than half of the population are illiterate. Intra-district variations within the states are also found in India. (Figures 4-6) presents the interdistrict variations in effective literacy rates. All the districts are grouped into three categories according to the effective literacy rate; less than 65%, 65% – 80%, and more than 80%. Figure 4 shows the inter-district variation in total effective literacy rate. There are 158 districts where the literacy rate is less than 65%, 325 districts have the literacy rate between 65% to 80% and 158 districts have literacy rate of more than 80%. Kerala is the only state which has all districts with more than 90%. The total literacy rate of Kerala is 94%.

Figure 4: Classification of Indian districts according to the effective literacy rate in India, 2011.

Figure 5: Classification of Indian districts according to the effective male literacy rate in India, 2011.

Figure 6: Classification of Indian districts according to the effective female literacy rate in India, 2011.

The districts with low literacy rate are basically southern districts of Odisha and Chhattisgarh, western and northern districts of Andhra Pradesh, few districts from Madhya Pradesh, southern districts of Rajasthan, northern districts of Uttar Pradesh, eastern districts of Bihar and Jharkhand, and few districts from Arunachal Pradesh. Figure 5 shows that there are 34 districts in India where the male effective literacy is less than 65%, while 362 districts have more than 80% and 244 districts have 65% – 80% of male literacy rate. However, the distribution of female effective literacy status is just contrast to the distribution of male literacy rate. Figure 6 shows that in India majority of the districts (355 districts) have the female effective literacy rate of less than 65% and another 216 districts have the literacy rate of 65% – 80%. There are only 69 districts have the literacy rate of more than 80%.

Social disparities in literacy rate (SC and ST): The SC and ST population is witnessed of low literacy rate both among male and female literacy than the total population. Figures 7-9 shows the literacy maps for SC population. Figure 7 shows that among the SC population there are 235 districts in India have the literacy rate of less than 65%, 269 districts have 65% – 80%, and 105 districts have more than 80% literacy rate out of 609 districts. Alirajpur district of Madhya Pradesh has lowest literacy rate among SC population with 35.6% and Serchhip district of Mizoram, Shupiyan and Pulwamadistricts of Kashmir have 100% literacy among SC population. Figure 8 shows that there are 73 districts have less than 65% male literacy and 268 districts have male literacy rate of 65%-80% and another 268 districts have more than 80% male literacy rate.

Figure 7: Classification of Indian districts according to the literacy rate among SC population in India, 2011.

Figure 8: Classification of Indian districts according to the literacy rate among SC male population in India, 2011.

Figure 9 shows that majority of the districts (401 districts) have less than 65% female literacy among SC population. Figure 10, 11 and 12 presents the literacy maps for ST population. Figure 10 shows that among the ST population 340 districts out of 585 districts have less than 65% of literacy rate, 182 districts have 65% – 80%, and 63 districts have more than 80% of literacy rate. Kaushambi district of Uttar Pradesh has lowest literacy rate amongST population with 9.8% and Aizawl district of Mizoram has highest literacy rate with 98%. Figure 11 shows that there are 195 districts which have less than 65% of male literacy among ST population and there are 156 districts have more than 80% literacy rate. However, it is worst among the ST female population. The Figure 12 shows that majority of the districts (451 districts) have less than 65% of female literacy rate among ST population. There are only 34 districts which have more than 80% of female literacy rate among the ST population.

Figure 9: Classification of Indian districts according to the literacy rate among SC female population in India, 2011.

Figure 10: Classification of Indian districts according to the literacy rate among ST population in India, 2011..

Figure 11: Classification of Indian districts according to the male literacy rate among ST population in India, 2011.

Figure 12: Classification of Indian districts according to the female literacy rate among ST population in India, 2011.

Poverty and literacy status: The literacy rate in India is largely varied by wealth index. Table 2 presents the weighted average of literacy rate by wealth index in India. It is observed that the literacy rate was much lower among the districts those belong to lowest wealth tertile and higher among the districts those belong to upper wealth tertile. For example, the literacy rate was 66.6% among the districts belong to low wealth index, 71.1% among medium districts and 81.4% among the districts belong to high wealth index. The gap between high and low wealth index districts was 16.8 percentage points and the ratio was 1.22 and high to medium was 1.15. It clearly shows that the literacy rate largely varies by the wealth score. The male literacy rates are found higher in all group of districts compared to the female literacy rate.

Table 2: Literacy rate (%) by wealth index and sex in India, 2011.

However, the male-female gap in effective literacy rate are found higher in medium and low wealth index districts with more than 18 percentage points and it was low in high weight index districts with less than 12 percentage points. The literacy rate also observed very high in the highest wealth tertile groups among both SC and ST population in India. But the gap between highest and lowest tertile among both SC and St is comparatively low than the overall population. Among the SC population the literacy rate is 61.4% in lowest tertile districts compared to 64% in middle tertile and 72.3% in highest tertile districts. Similarly, among the ST population the literacy rate is 55.9% in lowest tertile districts compared to 59.1% in middle tertile and 67.1% in highest tertile districts.

Association of poverty and literacy rate

The districts are ranked according to the wealth score as well as according to the literacy rate (Appendix 2). Figure 13 shows the scatter plot and spearman correlation coefficient of wealth score and literacy rate at the district level. The correlation coefficient between wealth score and literacy rate is 0.611 at the district level showing a positive and high relationship between these two variables. The scatter plot also suggests that the districts with low wealth score tend to have low literacy rate and vice versa. The trend line clearly shows that as the wealth score increases the literacy rate also increases. From the (Appendix 2) it is also clear that the districts those have high wealth score also have high literacy rate. However, there are few districts have low wealth score but have high level of literacy rate. For example, Serchhip district have the highest literacy rate despite holding 186th rank in wealth score. Similarly, there are also few districts which possess high wealth score but have low level of literacy rate. Figure 14 shows the classification of districts on the basis of wealth index and relative literacy achievement index in India. It shows that there are 133 districts have high scores both in wealth and literacy and 130 districts have low scores both in wealth and literacy. However, there are 16 states basically the districts from Rajasthan, Punjab, Jammu and Kashmir, Andhra Pradesh, and Tamil Nadu which have high wealth score but have low literacy achievement score. Similarly, there are 24 districts which have low wealth score but have high literacy achievement score.

(Appendix A2) 10.26717/BJSTR.MS.ID.000467Appendix2.pdf

Figure 13: Scatter plot of wealth score and literacy rate at district level in India.

The literacy rates are regressed at the district level to examine the influence of poverty on literacy status in India. The dependent variable that is the literacy rate is continuous variable. The wealth score at the district level that are derived from a set of asset variables using PCA is the prime independent variable. Other covariates such as mean household size, urbanization, sex ratio, percentage of ST population are also included in the model thoughts to influence the literacy status. Table 3 provides the regression results of literacy rates in India. The result suggests that poverty and mean household size are two most important factors of the literacy rate in India. The coefficient of wealth index score is 2.878 (p=0.00; 95% CI: 2.394 – 3.362) showing a very significant factor. The wealth score is positively associated with the literacy status. Increase in asset possession leads to increase in literacy rates in India. Other than poverty, mean household size is also found a significant factor with the coefficient of -3.601 (p=0.000; 95% CI=-4.521 – -2.682).

Figure 14: Classification of Indian districts according to the literacy rate among ST population in India, 2011.

Table 3: Regression analysis of literacy rate in India.

R-squared =0.482

N =640

Conclusion

This study is attempting to highlight the insight view of poverty and literacy status at micro level in India. Micro level planning is very important for the inclusive growth. Poverty and illiteracy are two major obstacles on the way of inclusive growth in developing countries like India. These two indicators are the central focus in many national and international agenda like Millennium Development Goals and other agenda. Eradication ofextreme hunger and poverty, and eradication of illiteracy are two important goals among the eight millennium development goals set by the United Nations. Using the recent available census of India 2011 data at district level on household assets and literacy status, this paper found that there are certain districts in India still do not possess any of the specified assets. The poverty level persists in some certain clusters in India.

On the other hand, though India has witnessed satisfactory growth in literacy rate during last decade still there are more than one fourth Indian population cannot able to read and write. The census 2011 data shows that 73% of the total Indian population are literates. This figure varies largely by the population sub-groups and across the states and districts. Across all sub-group population and districts, the literacy rate was found lower among the females. Other studies also found that the girls have lower literacy than the boys in the Indian districts where more women are in the labor force Sundaram and Vanneman [8]. There are many districts where more than half of the female population can’t read and write. The poor states in India are witnessed of low literacy rate. Kerala is the only state which achieved more than 90% literacy rate in all districts and also among male and female literacy [9]. Immediate interventions should be addressed to eradicate the poverty as well as the literacy rate among the most backward districts and most disadvantage population sub-groups. Poverty level should be reduced to achieve the universal literacy rate. The districts from Odisha, Chhattisgarh, Madhya Pradesh, Rajasthan, Jharkhand, Bihar, Uttar Pradesh and Andhra Pradesh need special focus to improve the literacy status. These states are also found very poor states in India. The female literacy rate should be the prime focus in the agenda.

For More Articles: Biomedical Journal Impact Factor : https://biomedres.us

Journals on Cardiology

Autosomal Recessive Hypercholesterolemia: A Rare Cause of Familial Hypercholesterolemia

Abstract

Autosomal recessive hypercholesterolemia (ARH) is a very rare genetic cause of hypercholesterolemia. ARH has been linked to mutations in the low-density lipoprotein receptor adaptor protein 1(LDLRAP1) with consequent disruption of the LDL receptor mediated endocytosis, leading to severe hypercholesterolemia. The clinical phenotype of ARH is milder than that of receptor negative homozygous familial hypercholesterolemia (HoFH) and resembles that of receptor-defective HoFH. However, There is a large phenotypic variability in ARH and some ARH patients have LDL-cholesterol levels not significantly different from those of patients with HoFH. The prevalence of coronary artery disease, although increased, tends be lower in ARH compared to HoFHand patients with ARH, as compared to those with HoFH, tend to respond better to lipid-lowering drugs. This review aims to summarize the mechanism, as well as the genetic and clinical characteristics of ARH.

Keywords : Autosomal Recessive Hypercholesterolemia; Familial Hypercholesterolemia; LDL-Cholesterol; LDL Receptor

Keywords : ARH: Autosomal Recessive Hypercholesterolemia; LDLRAP1: Low-Density Lipoprotein Receptor Adaptor Protein 1; HoFH: Homozygous Familial Hypercholesterolemia; LDL-C: Low-Density Lipoprotein Cholesterol; CVD: Cardiovascular Disease; ApoB: Apolipoprotein B; PCSK9: Proprotein Convertase Subtilisin/Kexin Type 9; FH: Familial Hypercholesterolemia; CAD: Coronary Artery Disease; VLDL: Very Low Density Lipoprotein

Introduction

There are several genetic causes of hypercholesterolemia, which may lead to extremely high levels of total and low-density lipoprotein cholesterol (LDL-C) and subsequently to a significantly increased risk of cardiovascular disease (CVD). Mutations in the LDL receptor (LDLR) gene, the apolipoprotein B (ApoB) gene and the proprotein convertase subtilisin/kexin type 9 (PCSK9) gene cause autosomal dominant hypercholesterolemia, which affects approximately in 1:250 to 1:500 individuals.On the other hand, autosomal recessive hypercholesterolemia (ARH) occurs much less frequently, estimated to occur in 1:1,000,000 live births, and has been linked to mutations in the gene that encodes the LDLR adaptor protein 1(LDLRAP1) [1].

This gene is found in the chromosomal region 1p36-p35 with a weight of 25 kilobases and it is formed by 9 exons which encode a 308-amino acid protein. In the autosomal recessive hypercholesterolemia, the endocytosis of the LDL receptor with its LDL ligand in the plasma membrane of the hepatocyte doesn’t occur and the receptor-ligand complexes accumulate in the plasma membrane. As it was mentioned above, ARH is extremelyrare with no more than 10,000 cases alive up to date, which are mostly found in the Lebanese, Mexican, Japanese, Indian, Turkish, Syrian and Italian populations [2]. Only 36 families with 14 different mutations have been reported in the literature until recently [3]. However, in some regions the prevalence of ARH appears to be higher and in the island of Sardinia the frequency of a heterozygous carrier mutation status for the LDLRAP1 gene is estimated to be approximately 1:143 individuals [3].

Genetics and Mechanism

The LDL receptor is the primary metabolic pathway for removal of cholesterol from the circulation. The ligand binding arm of the LDL-receptor binds to the ApoB protein present on the surface of LDL-cholesterol. This complex undergoes endocytosis in clathrincoated pits. PCSK9 is a circulating protein that is highly expressed in liver, small intestine, and kidney, and interacts with the extracellular domain of the LDL-receptor, targeting the receptor for degradation in the lysosome. More specifically, PCSK9 migrates to clathrincoated pits along with an LDL particle bound to an LDL receptor. The LDL-receptor-PCSK9 complex is internalized by vesicles that become endosomes with the aid of the LDLRAP1 (ARH protein) and delivers cholesterol to the cell.PCSK9 then accompanies the LDL receptor to the lysosome for catabolism [4].

Autosomal recessive hypercholesterolemia (ARH) is caused by recessive loss of function mutations in the LDLRAP1 gene, encoding LDLRAP1. Thus, internalization of the LDL-receptor via clathrincoated pits is aborted [5] and, as it was mentioned above, the complexes of the LDL receptor with its LDL ligand accumulate in the plasma membrane. Another endocytic clathrin adaptor protein, Disabled-2 (Dab2), may also act as an LDLR-selective adaptor. The activity and ability of Dab2 to mediate LDLR endocytosis have been demonstrated in cultured cells and this may be another site of mutation which can contribute to ARH [6].

Clinical Phenotype of Patients with ARH

Although the serum cholesterol levels of patients with ARHhave been described as intermediate between familial hypercholesterolemia (FH) heterozygotes and FH homozygotes [7], there is clearly a large phenotypicvariability in ARH. Some patients have 3-fold higher serum cholesterol levels than others, and their levels are not significantly different from those of classic FH homozygotes [7]. In some patients with ARH, large tuberous, tendinous or planar xanthomas are present, which are occasionally accompanied by corneal arcus and xanthelasmas [3,7].

In a study, which compared the clinical phenotype of 42 homozygous FH (HoFH) patients and 42 ARH patients, it was found that the clinical phenotype of ARH is milder than that of receptornegative HoFH and resembles that of receptor-defective HoFH. More specifically, the plasma LDL-C level was lower in ARHthan in receptor-negative HoFH (14.25±2.29 mmol/L vs. 21.38±3.56 mmol/L, respectively) but similar to that found in receptordefective HoFH (15.52±2.39 mmol/L). The risk of coronary artery disease (CAD) was 9-fold lower in ARH patients. No ARH patient’s ≤ 20 years of age were found to have CAD as opposed to 43% of HoFH. Furthermore, the prevalence of CAD was or tended to be lower in ARH in the 21-40 (45% versus 86%) and 41-60 (78% versus 100%) age groups. Of note, heterozygous ARH carriers showed higher level of LDL-C (+17%) than non-carrier family members [8].

Lipid-lowering therapy in patients with ARH

In general, ARH patients, as compared to those with HoFH, tend to respond better to the lipid-lowering drugs. This may be due to the fact that the LDLR-dependent uptake of very low-density lipoprotein (VLDL) is maintained in the absence of LDLRAP1, which could likely contribute to the attenuation of the clinical phenotype of ARH [9]. Most of the times, a significant reduction of LDL-C levels occurs in patients with ARH after treatment with high-intensity statins alone or, more frequently, in combination with ezetimibe or bile acid sequestrants. Partial ileal bypass and apheresis at weekly or biweekly intervalshave been also used with success in patients with ARH who do not reach target LDL-Cconcentrations on maximally tolerated dose of lipid-lowering drugs [7,10]. Since there is disruption of LDLR-mediated endocytosis, patients with ARH do not in general respond to PCSK9-inhibition therapy. However, a case of ARH responsive to a PCSK9 inhibitor (evolocumab) has been recently reported in the literature, which also suggests that the molecular implications of homozygous mutations in LDLRAP1 are distinct from homozygous receptor-negative LDL-C receptor states [11].

For More Articles: Biomedical Journal Impact Factor : https://biomedres.us

Journals on Orthopaedics

Does Draining the Post Operative Hematoma Have an Impact in Tka Patients

Abstract

Objective: To determine the effectiveness of no drain placement compared to use of closed suction drain post TKA, in terms of wound related complications and blood loss.

Methods: This prospective observational study was conducted at Liaquat National Hospital, Karachi, from April 2016 to March 2017. Clinical data including co-morbidities, pre operative haemoglobin and indication for TKA were collected in the Performa. All patients randomized into even and odd number sub divided into Group A (without post operative drain) and Group B (with closed suction drains). Tourniquet were applied in all cases, after completion of TKA tourniquet were released and bleeding points controlled. Group B patients were received closed suction drains followed by wound closure, whereas Group A patients undergo direct closure without drain placement. Pre operative haemoglobin were collected and repeated on 1st and 5th postoperative day. At 5th postoperative day dressing were changed and wound assessed for any wound related complications and total number of blood transfusions required also noted. Data were collected manually and analysed using SPSS version 19.

Result: Out of 120 enrolled patients, 28(23.33%) were male and 92 (76.66%) females, overall mean age (62.92±8.73). In group A 41 (68.33%) patients experienced wound edema in comparison to group B which had 7(11.66%) patients with wound edema. Mean haemoglobin drop pre and post operatively on 5th day were 2.000±0.972 mg/dl in group A compared to group B 2.713±1.042 mg/dl. Haemoglobin drop among two groups were significant, Mean total number of blood transfusion required in group A were 1.53 ±0.833 pints in compared to group B which were 2.48 ±0.676 pints and found statistically significant.

Conclusion: Without use of drain have drastically decrease the rate of transfusion and perhaps the transfusions related complications which includes cross match and hypersensitivity reactions and also the transfer of blood born diseases which can be lethal to life. But contrary there were some wound related complications which can be addressed by homeostasis and meticulous wound closure.

Keywords : Knee Arthroplasty, Drainage, Hemoglobin, Complications

Introduction

Total knee arthroplasty (TKA) is a major orthopaedic procedure carried out in mostly elderly population. It is a very frequently performed surgery but it’s not without the risk of bleeding and infection. Sehat et al. [1] observed that mean blood loss in TKA can range up to 1474 ml. The use of post operative drainage in TKA patients has been the topic of debate for many years and still there is no clear guidelines established in the literature. Reilly et al. [2] found that placement of drainage tube in TKA results in more blood loss than without drainage tube whereas Fan Y et al. [3] has discouraged the placement of drain as it may lead to an increased risk of retrograde infection. Moreover post operative drain usage in TKA is associated with an astounding increase in cost of over $400 per knee in a recent study [4]. Al-Zahid [5] in his study on over a hundred TKAs found no significant difference in terms of wound complications, blood loss and functional outcome. A Polish study also favored not to use drains post operatively as authors noticed lesser number of dressing change during hospitalization and also lower need of opioid analgesia [6].

No studies have been conducted in Pakistan for TKA patients regarding drainage in the post operative period. We wish to evaluate our population in a randomized controlled trial on this aspect and hopefully to establish a local guideline for efficient, cost effective and safe management of TKA patients. The aim of our study to evaluate the difference between two groups of drain verses no drain placement in total knee replacement patients with respect to wound related complications, level of hemoglobin dropped post operatively and units of blood transfused post operatively. Our aim was also to establish a local guideline for efficient, cost effective and safe management in total knee arthroplasty patients.

Materials and Methods

This was a prospective observational study conducted at the Department of Orthopaedic Surgery, Liaquat National Hospital and Medical College, Karachi. April 2016 to March 2017. Patients were registered using a predesigned Performa. Approval from institutional ethical review committee was taken prior to commencement of the study. Formal informed written consent was obtained from patients registering in the study. Using a nonprobability, consecutive sampling technique 120 patients were registered for the study.

a. Inclusion Criteria

i. Either gender

ii. Patient in age limit 50-85 years

iii. Bilateral knee osteoarthritis or rheumatoid arthritis requiring bilateral TKA

b. Exclusion Criteria

i. Patients on anticoagulant therapy or with clotting disorders

ii. Patients with renal or hepatic function impairment

iii. Revision or complex primary knees requiring extensive tissue dissection

After meeting the inclusion and exclusion criteria, patients were included in the study. Specific clinical data including the co-morbidities, pre operative hemoglobin of the patient and indication for TKA were collected in the Performa that is provided in the study tool section. Patients were sub divided into Group A (N=60) (without post operative drain) and Group B (N=60) (with closed suction drains). All patients undergo bilateral TKA by single surgeon. Tourniquet applied in all cases and leg elevated before inflation of tourniquet. In all the patients, simultaneously bilateral posterior-stabilized TKA was carried while using midline incision with medial par patellar approach. All the patients included in the study received standard tibial and femoral implant. Patellar resurfacing was done in all patients.

After completion of implantation of prosthesis tourniquet was released and bleeding points were controlled prior to closure. After control of bleeding group B patients received size 14 drainage tubes connected to a closed suction bottle followed by wound closure, whereas group A patients were undergo direct closure without drain placement. Hemoglobin levels were repeated at 1st and 5th postoperative day and noted in the Performa. At 5th postoperative day dressing were changed and wound complications such as blister formation, wound edema, superficial marginal skin necrosis, superficial wound dehiscence and local superficial infection were checked. Also total number of blood transfusions required were monitored and recorded in the Performa. Comparison of mean hemoglobin values at 1st and 5th postoperative day, number of units of blood transfused were calculated using Independent t test taking P<0.05 as significant. Associations of different wound related complications with group A and group B were demonstrated by using Chi square test taking P<0.05 as significant (Figure 1).

Figure 1 : Representing frequency of wound related complications between two groups.

Results

Out of 120 enrolled patients, 28(23.33%) were male and 92(76.66%) females, in which group A 11(18.33%) were male and 49(81.66%) patients were female and in group B 17(28.33%) male and 43 (71.66%) female patients. Mean age in group A is 63.38±8.72 years and in group B mean age is 62.45±8.79, overall mean age 62.92±8.73. In group A (No Drain) 41(68.33%) patient’s developed wound edema while in group B only 7(11.66%) patients experienced wound edema. Superficial marginal skin necrosis was seen in 6(10%) patients of group A and in group B 4(6.66%) patients experienced. 14(23.33%) patients in group A developed Blister and in group B 11(18.33%) patients experienced blister formation (Figures 2 & 3).

Figure 2 : Showing Mean of Pre and Post OP Haemoglobin.

Figure 3 : Showing Mean of required number of transfusion between two groups.

None of the patients in group A developed wound dehiscence comparison to group B in which 4(6.66%) patients suffered from wound dehiscence.6(10%) patients in group B represents local wound infection postoperatively comparison to group A in which 3(5%) had wound infections. Pre operative mean hemoglobin levels of group A were 11.952±0.9454 mg/dl and their mean hemoglobin drop post operatively were on 5th day 2.000±0.972 mg/dl in compared to group B mean pre op hemoglobin levels were 12.017±0.929 mg/dl and their post operative mean hemoglobin drop were on 5th day 2.713±1.042mg/dl. Hemoglobin dropped among two groups was significant. Mean total units of blood transfused in group A were 1.53±0.833 in compared to group B 2.48±0.676 (Tables 1 & 2).

Table 1 : Distribution of patients with respect to age, gender and wound related Complication between two groups.

Figures are in mean ± SD. Independent t-test was used for comparative analysis statistically significant p-value < 0.05

Table 2 : Shows mean of pre op haemoglobin, haemoglobin differences and required no transfusion among two groups.

Figures are in mean ± SD. Independent t-test was used for comparative analysis statistically significant p-value < 0.05

Discussion

Uses of drainage in total knee arthroplasty patient are to prevent hematoma accumulation, to decrease the risk of infection, and to minimize complications and adverse events. Controversy still surrounds the use of drains after total knee arthroplasty. In United Kingdom a survey was conducted for all members of the British Orthopedic Association, which showed that 94% of surgeons accounting for 80% of all total knee arthroplasty, was using closed suction drainage, due to fear of increase risk of infections and hematoma formation [7]. Fan Y et al. [3] has discouraged the placement of drain as it may lead to an increased risk of retrograde infection. Holt favored the use of drains in terms of less need of dressings during the early post operative period and decreased incidence of ecchymosis and wound complications [8].

In comparison to above mentioned studies, in our study we noticed no statistical difference observed for wound related complications like skin necrosis, blister formation, wound dehiscence and wound infection in total knee arthroplasty among these groups, except we noticed 41 patients developed edema, in non drainage group, and it was significant comparison to drain placement group. In this study our 6 patients developed superficial wound infection in drainage group and 3 patients in no drain placement group but statistically no significant difference found among two groups. A retrospective study conducted by Demirkale et al. [9] revealed that decreased rate of wound infection and minimal needs for blood transfusion observed in non-drainage group of total knee arthroplasty. Another study in which Passad studied the risk factors associated with greater blood loss and need for blood transfusion [10]. They stated that a significant correlation between tourniquet time and operation duration. Pavone et al. [11,12] explained the need for blood transfusion in patients undergoing one-stage bilateral knee replacement.

Higher blood loss will be expected in patients with use of suction drain [13]. Mengal et al. [14] concluded that no difference in post-operative Hb levels but higher rates of blood transfusion were required in the no drain group. Kumar et al. [15], Sundaram and Parkinson [16] both failed to show a statistically significant difference between the two groups using post-operative Hb levels and autologous transfusion rates as outcomes. Demirkale and other above mention author’s studies had positive association with our study as we noticed decreased needs for blood transfusion and hemoglobin difference in no drain placement group was statistically significant, which also reduces the risk of transfusion related complication .We confirm these results since we noticed significant hemoglobin drop post operatively in drain placement group with increased number of transfusion comparison to without drain placement group. The possible explanation of this is that the presence of a drain reduces the tamponade effect. The strength of our study based on the minimization of confounding variables. The patients in this single surgeon series were recruited over a short time and post-operative care was identical in all cases.

Conclusion

Without use of drain have drastically decrease the rate of transfusion and perhaps the transfusions related complications which includes cross match and hypersensitivity reactions and also the transfer of blood born diseases which can be lethal to life. But contrary there were some wound related complications which can be addressed by homeostasis and meticulous wound closure. It was a single centre prospective study value.

For More Articles: Biomedical Journal Impact Factor : https://biomedres.us

Journals on Obstetrics and Gynaecology

Rising Trend in Caesarean Section Rate: A Community Health Hazard

Abstract

Excessive and unnecessary use of caesarean sections is growing as a major problem for women’s health for which both developed as well as developing countries are the victims. There is no evidence to show any benefit either to mother or to infant when the procedure is not medically indicated. For a community the ideal rate of caesarean section beyond which there appears to be a null benefit to either mother or fetus is considered to be between 10%-15%. But recent studies from various countries show a much higher rate of caesarean section. This rate is even higher in private sectors. ‘On demand caesarean section’ or ‘caesarean section on maternal request’ is growing as a new indication for various social or personal reasons. This alarming rate should be stopped as soon as possible. Proper counselling should be given to labouring women. Antenatal education regarding merits and demerits of caesarean section at community level can be an useful tool.

Keywords: Caesarean Section; Antenatal Education; Vaginal Delivery

Abbreviations: AHS: Annual Health Survey; RDS: Respiratory Distress Syndrome; ICMR: Indian Council of Medical Research

Introduction

Though caesarean section can be life saving for mother and baby in certain situations, its excessive and unnecessary use is becoming a matter of concern. Although once it was limited to western countries, now days the rising trend of caesarean sections is more of a global problem. For nearly 30 years, the international healthcare community has considered the ideal rate for caesarean sections to be between 10% and 15% [1]. There is no evidence to show any benefit either to mother or to infant when the procedure is not medically indicated [2]. On the other hand there is high chance of associated short and long term risk which can extend many years beyond the index delivery and affect the health of the woman, her child, and future pregnancies. These risks are higher in women with limited access to comprehensive obstetric care [3-5]. The procedure is not that simple and needs to be performed only when clinically justified.

Discussion

Burden of the Problem

The rate of caesarean section varies from country to country even region to region. A systematic review by Soto-Vega E et al. [6] in 2015 demonstrated an overwhelming prevalence of caesarean section, with a mean of 42.5% worldwide. While 65.84% is worldwide mean of caesarean section in private sector, it is 33.99 % for public sectors. Datas from countries like Iran, Brazil and México show section rates reaching upto 91.9%, 85.8%, and 85.6%, respectively [7,8], also the same countries have the highest rate of caesarean section in public sector being 78.5%, 71.0% and 47.8 % respectively [9]. Countries like Egypt, Turkey, Dominican Republic, Georgia and China have all had over 30 percent increase in their caesarean section rates over the last 24 years. For example, in Egypt, according to the latest data, more than half of all women give birth by caesarean section without much difference between urban and rural areas [10].

Data’s from India also show a disturbing increase in caesarean section rates over the last 20 years. A collaborative study done by the Indian Council of Medical Research (ICMR) in the 1980s showed a Caesarean section rate of 13.8 percent in teaching hospitals [11]. The escalating rates of Caesarean sections in teaching hospitals in India had been compared between 1993-94 and 1998-99, with data from 30 medical colleges/teaching hospitals [12]. The overall rate showed an increase from 21.8 per cent in 1993-94 to 25.4 per cent in 1998-99. What was alarming was that 42.4 per cent were primigravidas and 31 per cent had come from rural areas. In a study over a two-year period in an urban area of India, the totalCaesarean section rates even in the public and charitable sectors were 20 and 38 per cent respectively. In the private sectors, the rate was an unbelievable 47% [13]. More recently in 2010-2011, the Annual Health Survey (AHS) data in India from 284 districts in nine States, including Jharkhand, found that the median caesarean section rate in the private sector was 28%, compared with 5% in the public sector [14].

Cause of this Increase Trend

Although such high levels of caesarean rates cannot be justified, some possible reasons those have been reprted for this are fear of pain; concerns about genital modifications after vaginal delivery; misconception that CS is safer for the baby; the convenience for health professionals and also for the mother and family; fear of medical litigation and lower tolerance to any complications or outcomes other than the perfect baby [15-20]. Some cultural factors also have been found. For example, in China, choosing the date of the baby’s delivery on the basis of luck and fate for the future of the baby by some people is one of the explanations for scheduling a CS [21]. High-risk patients do not show a large variation in Caesarean rates, regardless of where they deliver. The largest variation occurs in the low-risk patient category, specifically the nulliparous patient with term singleton foetuses with vertex presentation without other complications. Studies from India as well as from other countries have confirmed that in this group of women perinatal morbidity and mortality rates are not improved by the performance of a Caesarean section [22-24].

The introduction of the concept of ‘on demand caesarean section’ as a new indication has raised many eyebrows. Mackenzie et al [25] observed that maternal request was one of the main indications for CS (23%) in 1996.There is too many unknown facts about the true risks and benefits of the procedure. Inadequately informed women choose caesarean section to avoid painful natural childbirth. Most of them like to maintain the vaginal tone of teenagers. But, this is more likely a benefit to the sexual partner than the woman herself. In India, the family sometimes demands that the baby be born on a auspicious date and time, obviously by caesarean section, as dictated by horoscope/astrological calculations. This happens to be a popular indication of caesarean section in China as already described. There are many more reasons for on demand caesarean section which are beyond the scope of this review to be discussed. Moreover, FIGO [26] states that performing caesarean section for nonmedical reasons is ethically not justified.

Associated Risks

Various studies have confirmed that there is higher incidence of PPH, postpartum infection, chronic abdominal pain, rehospitalisation after elective caesarean section performed in nulliparous low risk women compared to that after vaginal delivery [27-29]. Babies are also vulnerable to unnecessary risks from rising CS rates. The first danger to the baby is the 1% to 9% chance that the surgeon’s knife will accidentally lacerate the fetus (6% in nonvertex presentation) [30]. A much more serious risk is respiratory distress syndrome (RDS) in preterm infants and for other forms of respiratory distress in mature infants [31]. Even with repeated ultrasound scans, there may be errors in judging when to do an elective CS. As CS rates rise, so do premature births.

Recurrent caesarean section, scar rupture, hysterectomy, caesarean scar pregnancy and maternal and fetal deaths are some of the future important risks. Previous caesarean section increases the risk of multiple placental abnormalities like placental abruption, placenta previa, and adherent placentation in subsequent pregnancies [32]. While first birth caesarean section had a 30% increased risk for placental abruption [33], Women who had four or more deliveries with a single caesarean section had a 1.7 fold increased risk of placenta previa. Among women with placenta previa, the incidence of placenta accrete is almost 10% [34]. Zaki et al. [35] reported a 60% rate of placenta accrete with three or more caesarean deliveries. The leading indication for caesarean hysterectomy in USA is plaenta accrete [36]. As the incidence of CS continues to rise worldwide, the problem of placenta previa and placenta accrete and consequently caesarean hysterectomy is likely to become more common. Obstetricians should be ready to face these future consequences of today’s decision of performing caesarean section [37].

Conclusion

The proliferating increased rates of caesarean section have not only affected the developed countries but also expanded to developing countries like India. A lot of risks both immediate and remote have been associated with caesarean section but is largely unknown to the population experiencing the process. Health education especially antenatal education regarding safety of vaginal delivery and the cons of caesarean section would be a valuable tool to be offered at population level. As proposed by WHO in 2015 the use of the Robson Classification system as a global standard for assessing, monitoring and comparing caesarean section rates [38,39] will allow analyses of caesarean section rates according to important maternal and fatal variables (e.g. parity, previous caesarean section delivery, onset of labour, gestational age, number of foetuses and presentation).

For More Articles: Biomedical Journal Impact Factor : https://biomedres.us

Journals on Chemistry

Process Validation of Pharmaceutical Dosages Form: A Review

Abstract

Quality is always an imperative prerequisite when consider any product. Therefore, drugs must be manufactured to the highest quality levels. Validation is a part of the quality assurance program and is fundamental to an efficient production operation for building quality into the products. Validation of the individual steps of the processes is called the process validation. Process validation involves the collection and evaluation of data, from the process design stage throughout production, that establish scientific evidence that a process is capable of consistently delivering a quality drug substance. The goal of the validation is to ensure that quality is built into the system at every step, and not just tested for at the end. It involves the collection and evaluation of data, from the process design stage throughout production, that establish scientific evidence that a process is capable of consistently delivering a quality drug substance. Process validation is an integral part of Quality Assurance as per cGMP. Validation and quality assurance will go hand in hand, ensuring the thorough quality for the products. Hence, an emphasis made on to review that gives a detailed, overview of validation. According to GMP, validation studies are required to be done as per predefined protocols. Different dosage forms have different validation protocols. The purpose of this work is to present an introduction and general overview on process validation of pharmaceutical manufacturing process with special reference to the requirements stipulated by the US Food and Drug Administration (FDA) of Solids (tablets and capsules), liquids and semisolids.

Keywords: Quality; Validation; Dosages form; CGMP

Introduction

The main goal of any pharmaceutical plant is to produce products of required quality consistently, at the lowest cost possible. Validation has been an important process in pharmaceutical industries for a long time but it has gained greater emphasis in recent years due to industry’s greater interest on assurance of quality and productivity improvement. For an efficient production operation, there is a greater need of an efficient validation team [1]. The concept of validation was first proposed by two Food and Drug Administration (FDA) officials, Ted Byers and Bud Loftus, in the mid 1970’s in order to improve the quality of pharmaceuticals. The prime focus of validation is on ensuring if the quality is built into the system at every step, and not just tested for at the end [2]. Validation is documented act of proving that any procedure, process, equipment, material, activity or system actually leads to the expected results [3].

Process Validation

Process validation provides the flexibility and constraints in the production process controls in the achievement of desirable qualities in the drug product while preventing undesirable attributes [4]. USFDA defined process validation as “establishing documented evidence which provides high degree of assurance that a specific process will consistently produce a product meeting its pre determined specifications and quality characteristics.” [5,6] (Figure 1).

Figure 1: Flow chart describing validation process.

Types Of Process Validation [7]

a) Prospective Process Validation: In prospective process validation, the experimental plan known as validation protocol (following completion of the qualification trials) is prepared before the process is used for commercial use. In order to produce support data for validation there is requirement of some degree of prospective experimentation.

b) Concurrent Process Validation: The concurrent process validation establishes documented evidence that the process is in a state of control during the actual execution of the process. The in-process testing and/or monitoring of critical operations during the manufacture of each production batch is done for concurrent process validation.

c) Retrospective Process Validation: When validation is based on the historic data taken from the records of the completed production batches and used as a documented evidence for stating that the process has been in a state of control comes under retrospective process validation.

d) Revalidation: Revalidation ensures that changes in the process and/or in the processing environment, whether intentional or unintentional, do not negatively affect process characteristics and product quality attributes.

Revalidation can be sub-divided into two categories:

i. Revalidation after any change having a bearing on product quality.

ii. Periodic revalidation carried out at scheduled intervals (Figure 2).

Figure 2: Stages of Process Validation.

Importance of Process Validation [8]

a) Quality of product is assured

b) Optimization of the process

c) The cost of Quality of products is reduced

d) The market recalls of products is minimized

e) The process is under control and detailed study is possible

Documents Used In Validation

i. Validation master plan

ii. Validation protocol

iii. Validation report

iv. SOPs

i. Validation Master Plan [9]: A validation master plan is a summary of entire philosophy, intentions and approaches to be used for establishing performance adequacy of the company. The management must agree upon the validation master plan. The validation master plan provides an outlook of the overall validation operation, its organizational structure, its content and planning.

ii. Validation Protocol [10]: Validation protocol is a plan of actions stating how process validation will be done, it specifies who will conduct the various tasks and defines the testing parameters, sampling plans, testing methods and specifications. It also specifies product characteristics and equipments to be used. It must state the minimum number of batches that can be used for validation studies, it must specify the acceptance criteria and who will sign \ approve \ disapprove the conclusions obtained from such a study.

The validation protocol should be numbered, signed and dated, and should contain as a minimum the following information:

a. Title

b. Objective & Scope

c. Responsibility

d. Protocol Approval

e. Validation Team

f. Product Composition

g. Process Flow Chart

h. Manufacturing Process

i. Review of Equipments / Utilities

j. Review of Raw Materials and Packing Materials Review of Analytical and Batch Manufacturing Records

k. Review of Batch Quantities for Validation (Raw Materials)

l. Review of Batch Quantities for Validation (Packing Materials)

m. HSE Requirements

n. Review of Process Parameters Validation Procedure

o. Sampling Location

p. Documentation

q. Acceptance Criteria

r. Summary

s. Conclusion

iii. Validation Report [11]

Standard format of validation report

A. Executive summary

B. Discussion

C. Conclusions & recommendation

D. List of attachment

The above topics should be represented in the series in which they appear in the protocol and if the protocol is deviated it should be explained with justification. The report must be signed & dated by designated representatives of each unit.

iv. SOP (Standard Operating Procedure) [12]

The general format of the SOPs involves:

A. Title

B. Code

C. Objective

D. Scope

E. Definitions

F. Description

G. Safety

H. Documentation

I. Effective date, review date, version number.

J. Footer: Prepared By, Reviewed By, Approved By, Authorized By.

K. References

Industrial Process Evaluation and Selection for Dosages form

Process validation of Tablets [13-17]

A tablet is a most known solid pharmaceutical dosages form and comprises of a mixture of active substances and suitable excipients. Binders, glidants, lubricants etc are some the popularly used excipients in the tablets. The excipients are used for different purposes in the tabletting; like disintegrants used to enhance the breakdown, glidants used to increase the flow of the powder, flavouring agents to impart different flavours in the tablets. The knowledge of stepwise manufacturing process of any dosages form is a must for validating any process. It helps in determining the critical areas which need special consideration in terms of causing problems during the process.

Mixing Or Blending

Mixing is one of the most critical step and used at various stages during manufacturing of tablets. Materials with like physical properties can easily form a uniform mix or blend and not segregate as soon as materials with large differences.

Parameters to consider:

a) Mixing Or Blending Technique: The techniques like Diffusion (tumble), convection (planetary or high intensity), or pneumatic (fluid bed) are used to mix or blend materials. The choice of technique depends on whether the drug and excipients are mixed for a direct compression formulation or for adding the lubricant (e.g., magnesium stearate) to the granulation.

b) Mixing or Blending Speed: Mixing the drug and excipient requires more intense mixing than adding the lubricant to the final blend.

c) Mixing or blending time: The mixing or blending time of the product will be dependent on the mixing or blending technique and speed.

d) Drug uniformity: The test for content uniformity is usually performed to estimate the uniformity of drug throughout the mix or blend.

e) Excipient uniformity: Besides drug uniformity, excipients uniformity is also necessary in the granulation or blend. Two key excipients are:

f) Lubricant: Uneven distribution of the lubricant can result in picking and sticky problems during compression. It can also lead to tablet performance problems (low dissolution due to excessive lubricant in some tablets).

g) Color: The colorant(s) need(s) to be evenly distributed in the mixture so that the tablets have a uniform appearance (e.g., color, hue, and intensity).

h) Equipment capacity/load: The bulk density of materials or granules will affect the capacity of the equipment. Undercharging or overcharging a blender can result in poor drug or tablet lubricant distribution.

Wet Granulation

Wet granulation parameters to be considered during development and validation are:

a) Binder Addition: Adding the binder dry avoids the need to determine the optimal binder concentration and a separate manufacture for the binder solution.

b) Binder Concentration: The optimal binder concentration will need to be determined for the formulation. If the binder is to be sprayed, the binder solution needs to be dilute enough so that it can be pumped through the spray nozzle. It should also be sufficiently concentrated to form granules without over wetting the materials.

c) Amount of Binder Solution/Granulating Solvent: Too much binder or solvent solution will over wet the materials and prolong the drying time. The amount of binder solution is related to the binder concentration.

d) Binder Solution/Granulating Solvent Addition Rate: The rate or rate range at which the binder solution or granulating solvent can be added to the materials should be defined properly.

e) Mixing Time: Granulations that are not mixed long enough can form incomplete or weak granules. These granules may have poor flow and compression properties. On the other hand, over mixing the granulation can lead to harder granules and a lower dissolution rate.

Wet Milling

Sometimes wet milling of granules is needed before subjecting it for drying to efficiently dry them.

Factors to consider are:

a) Equipment Size And Capacity: The mill should be large enough to de lump the entire batch within a reasonable time period to minimize manufacturing time and prevent the material from drying during this operation.

b) Screen Size: The screen needs to be small enough to de lump the material, but not too small to cause excessive heating of the mill, resulting in drying of the granulation.

c) Mill Speed: The speed should be sufficient to efficiently de lump the material without straining the equipment.

d) Feed Rate: The feed rate of the wet granulation is interrelated to screen size and mill size and speed.

Drying

The type of drying technique (e.g., tray, fluid bed, and microwave) required for the formulation needs to be determined and justified. The type of technique may be dependent on such factors as drug or formulation properties and equipment availability. Changing dryer techniques could affect such tablet properties as hardness, disintegration, dissolution, and stability.

The optimal moisture content of the dried granulation needs to be determined.

i. High moisture content can result in

a) Tablet picking or sticking to tablet punch surfaces and

b) Poor chemical stability as a result of hydrolysis.

ii. An over dried granulation could result in poor hardness and friability.

Parameters to consider are:

A. Inlet/Outlet Temperature: The inlet temperature is the temperature of the incoming air to the dryer, while the outlet temperature is the temperature leaving the unit. The inlet temperature is critical to the drying efficiency of the granulation and should be set high enough to maximize drying without affecting the chemical/physical stability of the granulation. The outlet temperature is an indicator of the granulation temperature and will increase toward the inlet temperature as the moisture content of the granulation decreases (evaporisation rate).

B. Airflow: There should be sufficient airflow to ensure removal of moisture laden air from the wet granulation. Insufficient air flow could prolong drying and affect the chemical stability of the drug.

C. Moisture Uniformity: The moisture content could vary within the granulation

D. Equipment Capability/Capacity: The load that can be efficiently dried within the unit needs to be known.

Dry Milling

The milling operation will reduce the particle size of the dried granulation. The resultant particle size distribution will affect such material properties as flow, compressibility, disintegration, and dissolution. An optimal particle size/size distribution for the formulation will need to be determined. Factors to consider in dry milling are same as that of wet milling.

Lubrication

Lubricants are added in order to remove the problem of sticking and picking in the tablets.

a) Selection of Lubricant: Grade of the lubricant used and compatibility with other ingredients should be studied thoroughly and then the appropriate one must be chosen.

b) Amount of Lubricant Added: How much lubricant is required? Too much lubricant will form hydrophobic layer on the tablet resulting in dissolution problems.

c) Mixing Time: The optimum mixing time must be decided on proper trial of batches because if not mixed long enough form problems like chipping, capping, etc.

Tablet Compression

Compression is a critical step in the production of a tablet dosage form. As for the compressibility properties of the formulation, it should be examined on an instrumented tablet press. Factors to consider during compression are as follows:

A. Tooling: The shape, size, and concavity of the tooling should be examined based on the formulation properties and commercial specifications.

B. Compression speed: The formulation should be compressed at a wide range of compression speeds to determine the operating range of the compressor.

C. Compression/ejection force: The compression profile for the tablet formulation will need to be determined to establish the optimal compression force to obtain the desired tablet hardness.

The following in-process tests should be examined during the compression stage:

I. Appearance

II. Hardness

III. Tablet weight

IV. Friability

V. Disintegration

VI. Weight uniformity

VII. Tablet Coating

Tablet coating can occur by different techniques (e.g., sugar, film, or compression).

Film coating has been the most common technique over recent years and will be the focus of this section.

Key areas to consider for tablet coating include the following:

a) Tablet Properties: Tablet properties such as hardness, shape, and intagliation (if required) are important to obtain a good film-coated tablet. The tablet needs to be hard enough to withstand the coating process

b) Equipment Type: The type of coater will need to be selected. Conventional or perforated pan and fluid bed coaters are potential options.

c) Coater Load:Having too large a pan load could cause attrition of the tablets because of the overall tablet weight in the coater. In the case of a fluid bed coater, there may not be sufficient airflow to fluidize the tablets.

d) Pan Speed: This will be interrelated to other coating parameters, such as inlet temperature, spray rate, and flow rate.

ve) Spray Guns: The number and types of guns should be determined in order to efficiently coat the tablets.

f) Application/Spray Rate: The optimal application/spray rate should be determined. Spraying too fast will cause the tablets to become over wet, resulting in clumping of tablets and possible dissolution of the tablet surface. Spraying too slowly will cause the coating materials to dry prior to adhesion to the tablets. This will result in a rough tablet surface and poor coating efficiency.

vg) Tablet Flow: The flow or movement of the tablets in the coater should be examined to ensure proper flow. The addition of baffles may be required to provide adequate movement of tablets for tablet coating.

h) Inlet/Outlet Temperature and Airflow: These parameters are interrelated and should be set to ensure that the atomized coating solution reaches the tablet surface and then is quickly dried.

i) Coating Solution: The concentration and viscosity of the coating solution will need to be determined. The solution will need to be sufficiently diluted in order to spray the material on the tablets.

j) Coating Weight: A minimum and maximum coating weight should be established for the tablet.

k) Residual Solvent Level: If solvents are used for tablet coating, the residual solvent level will need to be determined (Table 1).

Table 1: Summary table including steps, control variable and critical parameters to be checked in manufacturing of tablets.

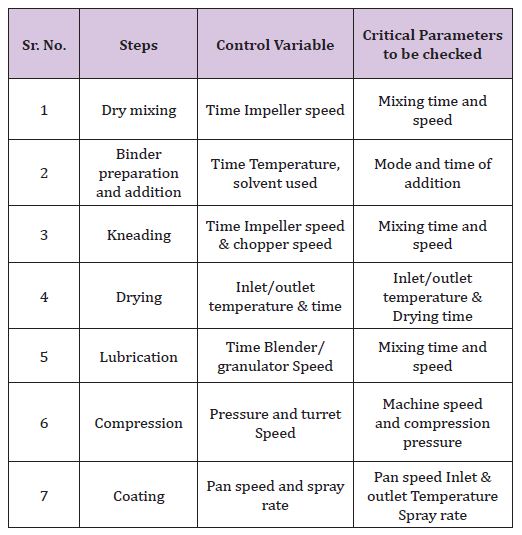
Process validation of capsules [18]

Capsules are the solid dosage form in which the drug or the mixture of drug are enclosed in Hard Gelatine Capsule Shells, in soft , soluble shells of gelatine, or in hard or soft shells of any other suitable material, of various shape and capacities. They usually contain a single dose of active ingredients and are intended for oral administration.

They are basically of two types:

a) Hard Gelatin Capsules: It is a solid dosage form in which medications are encapsulated in a two part empty hard gelatin capsule shell. The upper and small part is called ‘CAP’ and the remaining large part is called ‘BODY’. There are 8 different sizes of capsule shell(000,00,0,1,2,3,4,5) with different fill volume. Normally 0 and 2 sized shells are widely used. The shell of hard gelatin capsules basically consists of gelatin, plasticizers and water. Modern day shells may, in addition, consist of preservatives, colours, pacifying agents, flavours, sugars, acids, enteric materials etc.

b) Soft Gelatin Capsules: A soft gel (or a soft gelatin capsule) is a solid capsule (outer shell) surrounding a liquid or semi-solid centre (inner fill). An active ingredient can be incorporated into the outer shell, the inner fill, or both. They process of manufacturing of hard gelatine capsules is same as that of tablets, the only difference is that instead of compressing the granules they are filled in the capsule shell. So the validation process is also the same.

In encapsulation process following additional parameters need to be validated:

A. Capsule Shell Contents

a)Establish the compatibility of the capsule shell and the capsule contents.

b) Determine the hygroscopic nature of the capsule formulation

For example: A hygroscopic formulation (API /excipients) can pull water from the capsule shell, which could affect the API stability.

B. Encapsulation Speed: The formulation should be encapsulated at a wide range of speeds to determine the operating range of the encapsulation.

C. Encapsulation: Encapsulation is a critical step in the production of capsules, similar to the compression for tablet dosage forms, The materials to be encapsulated will need to have good flow properties and a consistent density.

Process Validation Of Liquids [19,20]

They are liquid preparation in which the drugs are dissolved, suspended or disperse in a suitable vehicle and generally several doses are contained in the bottle.

Types Of Oral Liquids

a) Syrups

b) Solutions

c) Suspension

d) Eye drops

e) Nasal drops etc

Validation Includes Mainly Following Tests

a) Particle size and size distribution

b) Particle shape or morphology

c) Microbial count

d) Rheology of solvent or vehicle

e) PH of the solvent or vehicle

Monitoring outputs Some outputs to be monitored are as under:

a) Appearance

b) pH

c) Viscosity

d) Specific gravity

e) Microbial count

f) Content uniformity

g) Dissolution testing

A. Appearance of the final product indicates the signs of instability and degradation. For e.g. settling of solid particles in case of suspension and turbidity in case of emulsion.

B. Time for mixing or agitation and temperature of process can affect the appearance greatly.

C. PH of aqueous oral formulations should be taken at a given temperature and only after equilibrium has been reached in order to minimize the PH drift.

D. Viscosity affects the settling rate of suspended particles in suspension and coalescence of globules of internal phase in emulsions and also in case of oral solutions it affects the overall appearance of the final product so it must be measured and validated properly.

E. Specific gravity: A decrease in specific gravity of the product like suspensions indicates the presence of air within the structure of the formulation.

F. Microbial count for the final product is essential to validate because by performing microbial count we can select the preservative for the final product storage. There are specifications for each liquid oral product for the bio burden content.

G. Content uniformity affects the dose uniformity in case of multi dose formulations and also affects the homogeneity of the drug within solvent system (Table 2)

Table 2: summary table for validation of liquid dosages form

Process validation of semisolid dosages form (ointment/ cream) [21,22]

They are mainly meant for external application e.g. cream, jelly, pastes etc. The consistency of semisolids lies between the solid and liquid and thus the preparation is a challenge for manufacturers.

Critical Parameters to be Validated

Process Temperature: It is critical to process at right temperature for successful manufacturing. Too much heating during processing can result in chemical degradation and insufficient heat can lead to batch failures, and excess cooling can result in the precipitation of solubilized ingredients.

Heating and Cooling Rates: The successful consistency of ointments, for example, depends on proper rates of heating and cooling.

a) Heating too slowly can result in poor yields from evaporative loss.

b) Heating too rapidly may burn areas of the batch in contact with the heating surface, which raises the potential for burnt material in the batch.

c) Rapid cooling can result in precipitation/crystallization or increased viscosity.

Mixing Methods and Speeds

It is essential to determine the required amount of shear and the optimal mixing methods and speeds. Emulsification typically requires high shear or homogenization to obtain the optimal droplet size and dispersion, while the mixing of a gel may require low shear in order to preserve certain physical characteristics, such as viscosity. Proper mixing speeds must be obtained for each phase at every batch scale. Optimal hydration depends on the amount of shear imparted to initially disperse the polymer into the medium. If the process involves only very low shear mixing, a polymer may never be completely dispersed and hydrated, which may result in an out-of specification viscosity. Equipment, such as a recirculation loop, may also be used to correct uniformity without changing mixing speed or time.

Mixing Times

Optimizing mixing time requires identifying the minimum time required for ingredients to dissolve and the maximum mixing time before product failure (e.g., when viscosity begins to drop). For polymeric gels, particularly acrylic acid-based types, over-mixing, especially high shear, can break down the polymer’s structure. In an emulsion, over-mixing may cause the product to separate prematurely, resulting in a drastic decline in viscosity.

Flow Rates

Optimizing flow rate involves determining the amount of shear or throughput needed. For example, a water-in oil emulsion may require a slower addition speed than a traditional, oil-in-water emulsion, and the flow rate must be modified appropriately. Care must be taken for any product using a pump. Overhearing can occur if the formulation is pumped too quickly. If pumping is too slow, the formulation will experience extra time in an in-line homogenizer, thus also exposing the formulation to additional shear.

Addition of Polymers and Gums

Addition of polymers (Carbomers) and gums (Xanthan) must be performed in a very controlled manner if adding directly to batch. Likewise there are other alternate methods of incorporation are : Eductors such as Tri – Blenders and Quadro Ytron dispersers and preparation of slurry of polymers or gum in a medium of low or no solubility.

Unit Operation For Semisolid System

There are five unit operations in manufacturing of semisolid dosages form.

I. Mixing of liquid (Table 3)

Table 3: Process variables, properties affected by variables and monitoring output of mixing of liquids.

II. Mixing of solid (Table 4)

Table 4: Process variables, properties affected by variables and monitoring output of mixing and blending of solids.

III. Mixing of semisolid (Table 5)

Table 5: Process variables, properties affected by variables and monitoring output of semisolid.

IV. Dispersing (Table 6)

Table 6: Process variables, properties affected by variables and monitoring output of dispersing.

V. Milling and size reduction of solid and semisolid(Table 7)

Table 7: Process variables, properties affected by variables and monitoring output of milling and size reduction of solid and semisolid.

Conclusion

Validation is a proven assurance of the process efficiency and sturdiness and it is the full fledged quality control tool for the pharmaceutical industries. It eliminates the chances of batch failures as the products are manufactured as per pre optimisation of each manufacturing steps. The conventional process of testing at last stage created much problems in maintain uniformity of each batch but with the introduction of concept of validation, it has been easy to maintain the batch uniformity of the product along with imparting quality in them. This paper summarises the process validation stages of solids, liquids and semisolids which are the most common pharmaceutical dosages form in use.

For More Articles: Biomedical Journal Impact Factor : https://biomedres.us

Journals of Gynecology

Laparoscopic Sacrocolpopexy – A Retrospective Study

Abstract

Post-hysterectomy vaginal vault prolapsed is a common complication following different types of hysterectomy which can lead to significant urinary, anorectal and sexual impairment in the patients. Pre existing pelvic floor defect is the most important predicting factor in the future development of vaginal vault prolapse. Preventive measures can be taken intraoperatively to reduce the incidence of later development of vault prolapse but the possibility cannot be eliminated completely. Both vaginal and abdominal approaches have been advocated for the correction of vault prolapse. With the abdominal approach, the results are better and recurrence is less. However, recovery time is more and the procedure requires a lot of bowel manipulation. Laparoscopic sacrocolpopexy can circumvent the disadvantages of open abdominal approach while retaining its advantages of great patient satisfaction and less recurrence. Being a minimally invasive procedure, lap sacrocolpopexy allows for less blood loss and speedy recovery. Here, we present a retrospective analysis of 25 cases of laparoscopic sacrocolpopexy over 2 years.

Keywords: Laparoscopy; Vault Prolapsed; Sacrocolpopexy; Polypropelene Mesh

Introduction

The incidence of vault prolapsed in post hysterectomies patients is estimated to be 0.2-44% [1,2] and is especially common in parous patients with vaginal deliveries and in patients who have previously undergone hysterectomy for uterine prolapsed [3,4]. The risk increases even more in patients who have undergone previous hysterectomy in view of prolapse uterus [5]. Numerous surgical procedures are described for the management of vault prolapse. Vaginal repair is associated with less postoperative pain and early recuperation as compared to abdominal approach. However, abdominal sacrocolpopexy has better anatomical outcome [6]. Laparoscopic sacrocolpopexy seems to be a promising approach which can provide the result of abdominal sacrocolpopexy with decreased morbidity. The success rate of laparoscopic sacrocolpopexy has been reported by a number of authors to be 90–98% [7]. However, the limitation of lap sacrocolpopexy is that it requires extensive dissection and advanced suturing skills.

Materials and Methods

Go to

25 women with vault prolapse who underwent laparoscopic sacrocolpopexy over a period of 2 years at our institute (September 2013 to October 2015) were included in this study. Parameters recorded include age, parity, BMI, previous pelvic surgery ; its indication and route, concomitant surgical procedure, duration of surgery, estimated blood loss, duration of hospital stay and postoperative minor and major complications. All patients were assessed clinically and prolapsed was graded on the Baden- Walker scale at all sites preoperatively as well as postoperatively during follow up at 1 week, 3months, 6 months and 1 year. Preoperatively and at each postop follow up, patient was also asked to fill a standard Pelvic floor distress inventory questionnaire for subjective assessment of the prolapse.

Technique

All patients were evaluated thoroughly preoperatively. Good bowel preparation was ensured by keeping the patient on 2 days of liquid diet and giving exelyte enema on the previous night of surgery. Prophylactic dose of antibiotics was given just prior to surgery. After creating pneumoperitoneum, a 10 mm camera port was placed supraumbilically and three 5 mm ports were placed, one each in iliac fosse and third one between symphysis and umbilicus. On entry, approach to the vault was assessed. In case of vault adhesions, adhesiolysis was done and vault exposed. The vaginal assistant placed CCL extractor to lift up the vault to aid in dissection. Incision was given on the vault so as to open up the uterovesical fold of peritoneum and bladder was carefully dissecteddown so as to expose the vagina sufficient enough for anterior fixation of the mesh. Similarly, rectovaginal space was entered posterior and rectum was dissected down. The peritoneum over sacral promontory was incised after identification of L5-S1, left common iliac vein and right ureter.

Dissection was carried out retroperitoneal till anterior sacral ligament was exposed. Care was taken not to injure median sacral vessels. Right ureter was traced from the pelvic brim along the lateral pelvic wall to its entry into broad ligament. A tunnel was created retroperitoneally along the rectosigmoid staying medial to the ureter, opening the rectovaginal space. A Y shaped polypropylene mesh was anchored to the vaginal vault using prolene 2-0. Approximately 3-5 sutures each were placed on the vault to fix the anterior and posterior limb of the Y shaped mesh. The vertical limb of the mesh was taken retroperitoneal and fixed to the anterior sacral ligament at the level of sacral promontory (after pushing and positioning the vault at the level of ischial spine). The exposed peritoneum over the vault and sacral promontory was closed with continuous sutures of vicryl 2-0.

Results

25 women with a median age of 60 years were studied (range 45-73 years) (Table 1). All patients were multipara and had normal vaginal deliveries, one patient had forceps delivery. The major presenting complaint was mass descending per vaginum. All patients had previously undergone hysterectomy except one who presented to us with huge procidentia and hysterectomy was done at the time of sacrocolpopexy (Table 2). 17 patients had previously undergone vaginal or lap assisted vaginal hysterectomy for uterovaginal prolapse while 6 patients had history of abdominal hysterectomy, one patient had history of total laparoscopic hysterectomy (Table 3). Preoperatively, all women had a vault descent greater than or equal to stage 2, as graded on Baden-Walker system. 15 patients had concomitant procedures performed at the time of laparoscopic sacrocolpopexy. Bilateral salpingo oophorectomy was done concomitantly in 15 patients while 7 patients required concomitant anterior or posterior compartment repair (Table 4). Initially we used to do cystocele repair vaginally, but later with better and evolved technique we are doing laparoscopic paravaginal repair for anterior compartment repair.

Table 1 : Patient Charcteristics: Median.

Table 2 : Level of Defect.

Table 3 : Type of Previous Hysterectomy.

Table 4 : Concomitant Procedures.

The mean duration of sacrocolpopexy procedure was 45 mins excluding the time required to do any concomitant procedure. Intraoperatively, there were no major complication, in one case we were faced with bleeding from median sacral vessels which was taken care of by placing a suture ligature (Table 5). Postoperatively, all patients had uneventful recovery. All patients were followed up at 1 week, 3 month, 6 month and 12 month. One patient presented with fever and chills 10 days after surgery and USG showed a 3.6×2.9×2.5 cm collection around the mesh in the pelvis posterior to bladder. Patient was treated with 5 days of injectable antibiotics and subsequent scan after 7 days showed no collection in pelvis (Table 6).

Table 5: Intraoperative Complication.

Table 6: Postoperative Complication.

At 3 month follow up , one patient complained of vaginal discharge which responded to topical estrogen and oral antibiotics. One patient had complaint of urge incontinence preoperatively which persisted postoperatively , while another one patient developed de novo urge incontinence at 3 month follow up which settled down afterwards with bladder training exercises (Table 7). There was no other major or minor complication during follow up of rest of the patients.

Table 7: Follow Up Visits.

Discussion

Vaginal vault prolapse can significantly affect quality of life by causing symptoms of pressure and discomfort, and by its effect onurinary, bowel and sexual function. The risk of future vault prolapse is six-fold higher if the initial indication for hysterectomy was for prolapse compared with other indications, such as menorrhagia or pelvic pain [1,8]. Current treatment options include pelvic floor muscle training, use of pessaries and surgery. Surgical treatment should be offered to women with symptomatic vault prolapse after appropriate counselling. A variety of procedures exist for surgical treatment of vault prolapse and the type of operation performed should be tailored to the individual case, such as concomitant prolapse in other compartment(s), previous abdominal surgery, previous prolapse surgery, the total vaginal length, and associated comorbidities. Sacrocolpopexy using mesh for vaginal vault prolapse repair is performed with the patient under general anesthesia, using an open or laparoscopic abdominal approach. Mesh is attached to the apex of the vagina and may also be attached to the anterior and/or posterior vaginal wall.

Several different types of synthetic and biological mesh are available, which vary in structure and in their physical properties such as absorbability. Transabdominal sacrocolpopexy is a definitive treatment option for vaginal vault prolapse with durable success rates [2,9]. However, it is associated with increased morbidity compared with vaginal repair [10-12]. Laparoscopic sacrocolpopexy can be equally effective as abdominal sacrocolpopexy in selected women with vault prolapse and can be combined to include mesh extension or be combined with other vaginal procedures to correct other compartment prolapse. A number of observational studies have shown good anatomical cure rates (more than 90%) in women undergoing LSC at 1–2 years’ follow-up [13-15]. Beer et al. [16] showed that objective and subjective cure rates are not necessarily the same; subjective cure rate being determined by functional outcome rather than anatomical result [16]. We also tried to evaluate both subjective rates (patient’s satisfaction) and objective rates in our study. We had excellent vault support in all 25 cases on follow up. We did not come across any major intraoperative complication, in one case where median sacral vessel started bleeding, a suture ligature was placed and bleed was controlled. At 3 month follow up none of our patients had any significant complaint except for one who complained of vaginal discharge.

All patients were fully satisfied with the procedure and there was no complaint of any symptom of prolapse. In our study, there was no case of suture erosion though we used non absorbable prolene 2-0 sutures. Also, there was no mesh erosion during follow up; however, one patient had a small collection around the mesh at 10th postoperative day which got settled with 5 days parenteral antibiotics. Noushin et al in their study concluded that there is no need of concomitant prophylactic surgery for SUI at the time of LSCP in women who do not have objectively demonstrable SUI before surgery [17]. Hence, in our study there was no prophylactic SUI surgery and follow up cases did not show any postoperative overt SUI.

Need of peritonising the mesh was obviated in our technique as we, instead of opening the peritoneum along the entire length of recto sigmoid, made a tunnel through which the vertical limb of Y shaped mesh was passed. This particular step also saved time as peritoneal closure was not needed at the end of the procedure. In our study, we evaluated both anatomical cure and functional outcome, which was 100%. However, the only limitation of our study is the less number of patients and a relatively short follow up.

Conclusion

The laparoscopic sacrocolpopexy is a minimally invasive technique for vaginal vault prolapse repair, combining the advantages of open sacrocolpopexy with the decreased morbidity of laparoscopy. We found low complication rates, early recuperation and high rate of objective and functional outcome with a minimum of 1 year follow-up.

For More Articles: Biomedical Journal Impact Factor : https://biomedres.us