Open Access Journals on Microbiology

Pregnancy Induced Hypertension in Kabo Local Government Area of Kano State, Nigeria

Introduction

Despite the high technological inclination in the 21st century, especially in the area of health, the rates of maternal mortalities and morbidities are still very high in women worldwide. The occurrence of maternal hypertensive disorders is found to have about 20.7 million women in 2013 and about 10% of pregnancies globally are complicated resulting from pregnancy induced hypertension Sharma, et al. [1]. In the United States, hypertensive disease of pregnancy affects about 8% to 13% of pregnancies Mohan, et al. [2]. Annually, an estimated 2.9 million babies die during the neonatal period and 2.6 million babies are stillborn around the world due to PIH. According to WHO (2018), the rate of stillbirth is 21.9 per 1000 births in women with a pregnancy induced hypertension (PIH) and normotensive women 8.4 per 1000 live births in china Xiong T, et al. [3]. Pregnancy Induced Hypertensions (PIHs) are responsible for 70,000 maternal deaths universally, killing one woman every 11 minutes Magee, et al. [4]. It is the second leading cause of maternal mortality in Bangladesh, according to the Bangladesh Maternal Mortality Survey (2017), about 24 percent of the country’s maternal deaths are caused by pre-eclampsia/eclampsia (PE/E) NIPORT, et al. [5], which affects women during pregnancy, childbirth, as well as postpartum. Factors, such as lack of health care provider capacities to detect, prevent, and manage PE/E, late referrals of HIP clients, late attendance and lack of antenatal care (ANC) and awareness about PE/E among communities have been associated as reasons for most of these preventable deaths Warren, et al. [6].
Deruelle, et al. [7] reported that about 25 percent of women with PIH, especially those with a dangerous condition, experience a decline of end-organ functions during puerperium (the 6 to 8 weeks after delivery, during which pregnancy changes return to baseline). PE early in pregnancy (less 34 weeks of gestation), presenting in a severe form, or persistence of proteinuria more than three to six months after delivery suggests possible chronic hypertension or renal disease. Women with pre-eclampsia are also at increased risk for venous thromboembolism in the postnatal period (after delivery), and those women should receive thromboembolic prophylaxis after delivery until they are fully recovered, usually within four to six weeks RCOG [8]. Similarly, women with preterm pre-eclampsia and gestational hypertension have been found to develop persistent cardiovascular impairment one year after delivery Melchiorre, et al. [9], including other chronic diseases such as chronic hypertension, stroke, renal disease, diabetes mellitus, and ischemic heart disease. Infants born to women with PIH also require special attention in the immediate postnatal period due to a combination of short and long term risks. Standard international guidelines recommend lifelong care and monitoring, or a minimum of care and monitoring for six months to one year after delivery. Studies propose that complications associated with PIH continue in the immediate postnatal period and longer NICE [10].
One of the goals of the United Nations Sustainable Development Goal (SDG) is to reduce the global maternal mortality ratio to less than 70 per 100,000 live births by 2030 United Nations [11]. The SDGs aim to uphold the momentum of the Millennium Development Goals (MDGs), which in its relentless effort catalyzed a global reduction in maternal deaths from approximately 390,000 in 1990 to 275,000 in 2015 Graham, et al. [12] United Nations, 2018). The strains of maternal mortality remain unduly borne by women in less-developed countries, particularly in sub-Saharan Africa (66%, 201,000 deaths) and southern Asia (22%, 66,000 deaths). One of the leading causes of maternal death (and disability) worldwide is pregnancy induced hypertension Payne, et al. [13]. The statistical figures of this problem in less developed countries have varied from 4.0% to 12.3% (Sebastia et al., 2015; Berhe et al., 2018). Pregnancy induced hypertension is also one of the major leading causes of pregnancy associated with morbidity and it is the most recurrent cited cause of maternal death Ethiopian Journal of Health Science [14]. Despite the fact that hypertensive conditions in pregnancy is leading causes of maternal morbidity and mortality during pregnancy, little is known about its magnitude among pregnant women in Kano and, specifically in Kabo Local Government Area. This study therefore aims to fill this gap by considering pregnancyinduced hypertension, the signs, associated risk factors and prevention and management among pregnant woman attending antenatal service in Kabo.

Basic Tools of Scientific Inquiry

The study was guided by the following research questions: 1. What are the signs of pregnancy induced hypertension among women in Kabo Local Government Area of Kano State?
2. What are the risk factors associated with pregnancy induced hypertension among women in Kabo Local Government Area of Kano State?
3. What are the preventions measures of pregnancy induced hypertension in Kabo Local Government Area of Kano State?

Literature Review

Pregnancy Induced Hypertension (PIH) known as toxemia or preeclampsia is a form of high Blood Pressure (BP) in pregnancy. PIH is one developing after 20 weeks of gestation without other signs of preeclampsia. It is a known cause of premature delivery, intrauterine growth restriction (IUGR), placental abruption and fetal death, as well as maternal mortality and morbidity (Gombe et al., 2011). It is characterized by either blood pressure levels of 140/90 mm Hg or higher after 20 weeks of gestation, or a blood pressure rise greater than 30/15mmHg from early or prepregnancy baseline or a rise of mean arterial pressure of more than 105 mmHg. This due to the development of arterial high pressure in a pregnant mother after 20 weeks of gestation, which may or may not have protein in urine and has a blood pressure of or more than 140/90 mmHg (National Guidelines for Quality Obstetrics, 2004). Of all the pregnancy related complications in the world, pre-eclampsia and eclampsia present 10% major causes of maternal and prenatal morbidity and mortality, with pre-eclampsia affecting 5-7 % of all pregnancies, Srinivas, et al. [15]. Hypertensive disorders during pregnancy is among the leading cause of maternal and fetal mortality in obstetric practice that can prevent the baby from getting enough blood and oxygen harming their liver, kidney, brain, and heart, causing end organ damage, Palacios, et al. [16].
Pregnancy induced hypertension is a major cause of maternal morbidity and mortality in the United States. There is an approximately one maternal death due to preeclampsia-eclampsia per 100,000 live births, with a case-fatality rate of 6.4 deaths per 10,000 cases Livington, et al. [17]. The outcome of hypertension in pregnancy is affected by multiple factors. These include gestational age at onset, severity of disease, and the presence of comorbidities like diabetes mellitus, renal disease, thrombophilia, or pre-existing hypertension Heard, et al. [18]. Similarly, a study conducted in Latin America and Caribbean, Pakistan, New York, and Sri Lanka identified null parity, multiple pregnancies, history of chronic hypertension, gestational diabetes, fetal malformation and obesity as the risk factors for developing pregnancy induced hypertension Dolea [19]. Furthermore, life-threatening maternal age (less than 20 or over 40 years), history of PIH in previous pregnancies, preexisting diseases like renal disease, diabetes mellitus, cardiac disease, unrecognized chronic hypertension, positive family history of PIH, which shows genetic susceptibility, psychological stress, alcohol use, rheumatic arthritis, very underweight and overweight, and low level of socioeconomic status are the risk factors for PIH Abeysena, et al. [20].
One important aspect of diagnosing and managing hypertension in pregnancy is presiding out secondary causes. These causes can add to both the maternal, fetal morbidity and mortality. Records from the Nationwide Inpatient Sample (NIS) of hospitalizations for delivery between 1995 and 2008 showed that out the patients with chronic hypertension (1.15% of the sampled population), 11.2% had secondary causes. Secondary hypertension had higher odds of adverse maternal and fetal outcomes when compared to essential hypertension (odds ratio (OR), 11.92 vs 10.18 for preeclampsia, 51.07 vs 13.14 for acute renal failure, 4.36 vs 2.89 for spontaneous delivery < 37 weeks) Bateman, et al. [21]. Examples of secondary forms of hypertension are chronic kidney disease (most common cause), hyperaldosteronism, Reno vascular disease, obstructive sleep apnea, Cushing’s syndrome, pheochromocytoma, thyroid disease, rheumatologic diseases (e.g. scleroderma or mixed connective tissue disease), and coarctation of the aorta; lack of understanding on how to diagnose and treat these conditions during pregnancy may lead to a higher morbidity and mortality Malha [22].

Pregnancy Induced Hypertension in Nigeria

In Nigeria, an incidence of 20.8% of pregnancy induced hypertension had been reported in a study of pregnant women attending antenatal clinics in a Teaching Hospital in South-South Ebeigbe, et al. [23]. Similarly, prevalence rates of hypertensive conditions of pregnancy range from 17% to 34.1% Singh, et al. [24]. In 2009, the occurrence of PIH ranges between 2% to 16.7% Abubakar, et al. [25]. In 2011, Enugu town had 3.3% per 77 cases of PIH out of 2337 cases Ugwu, et al. [26]. In 2014, according to Singh, et al. [27], the prevalence of hypertensive disorders was estimated to be higher than 17% in Nigeria. Akeju, et al. [28] suggested that women have health seeking behaviors, which range from buying over the counter drugs to relieve headache, consulting families on what to do with odema, epigastric pain and blurred vision, consulting a spiritual or traditional healer on convulsing and coming to hospital. All these health-seeking behaviors may delay coming to hospital, worsening the PIH complications. Between the periods of 1990 and 2015, 10.7 million maternal deaths were stated globally, in spite of the fact that maternal mortality ratio had fallen by 44% over these periods. WHO [29]. Out of this total number, developing countries accounts for about 99% of the global deaths in 2015, with Sub-Saharan Africa accounting for bumpily 66%.
Study by WHO [29] showed that Nigeria and India are estimated to account for over one third of all maternal deaths globally in 2015, contributing 19% and 15% respectively. Furthermore, the study also revealed that in the West African sub-region, Nigeria with a maternal mortality ratio (MMR) of 814 ranks second, after Sierra Leone 1360 MMR. With this MMR, Nigeria could not meet the MDG5A target in 2015, which aims to reduce maternal mortality ratio by 75% of its 1990 level by 2015.Among the causes of maternal mortality, hypertension ranks second (14%) after hemorrhage Say, et al. [30]. In Nigeria, hypertensive disorders of pregnancy could be a contributory factor to the rising prevalence of hypertension, which has been predicted to escalate up to 39.1 million by 2030, if the current inclination in figures continues Adeloye, et al. [31].

Empirical Review

Studies conducted by Butalia, et al. [32] and Regitz Zagrosek, et al. [33] revealed that there remain terminology and definition disagreements across international guidelines for hypertension. Hypertension itself has been defined over the years by diastolic or systolic readings alone, as well as by changes in pressures throughout pregnancy Chappell, et al. [34]. Similarly, limits for what is considered severe hypertension have been different. Semantics have clinical implications, and systematic reviews often have to compare studies or populations, which are assumed to be the same, rather than standardized Abalos, et al. [35]. Therefore, the International Society of the Study of Hypertension in Pregnancy (ISSHP) identified this as one of the factors for the range of controversies surrounding the treatment of hypertension during pregnancy and appointed a committee to address them beginning in 1998 Brown, et al. [36]. Moreover, studying several international guidelines, definitions are more standardized; however, there are still disagreements in sphygmomanometer intervals that define hypertension, precise definitions of proteinuria, the terms used to characterize blood pressure in the non-severe range, and even terminology used to classify the hypertensive disorders themselves Redman [37,32,33]. All of these reflect that the understanding of hypertensive disorders of pregnancy remains unsolidified and further research is necessary before a universal unanimity is reached on how to treat these disorders.
Hypertensive Disorder of Pregnancy (HDP) is defined as high blood pressure during pregnancy, is one of the direct causes of maternal and child mortality AOM [38]. It is measured by blood pressure level greater than 140/90 mm Hg after 20 weeks of gestation. Austere forms of HDP are reflected through blood pressure intensities of 160/100 mm Hg and more NHLBI [39]. Furthermore, studies by Magee, et al. [40] revealed that HDP are responsible for 70,000 maternal deaths globally, killing one woman every 11 minutes. HDP is the second leading cause of maternal mortality in Bangladesh, according to the Bangladesh Maternal Mortality Survey 2017, with approximately 24 percent of the country’s maternal deaths caused by pre-eclampsia/eclampsia (PE/E) NIPORT [5], which affects women during pregnancy, childbirth, as well as postpartum. Factors, such as lack of health care provider capacities to detect, prevent, and manage PE/E, late referrals of HDP clients, late attendance and lack of antenatal care (ANC) and awareness about preeclampsia or eclampsia among communities have been associated as reasons for most of these preventable deaths Warren et al. [6].

Theoretical Framework

This study is anchored on two theories, which include: the Theory of Reasoned Action (TRA) and the Theory of Planned Behavior (TBP). Theory of Reasoned Action was formulated by Martin Fishbein and IcekAjzen towards the end of the 1960s. On the other hand, IcerkAjzen proposed the Theory of Planned Behaviour in 1985; which was an extension from the TRA. The Theory of Reasoned Action and Theory of Behaviour Planned combine two sets of belief variables, which are ‘behavioural attitudes’ and ‘the subjective norms’. The behavioural attitudes are defined as the multiplicative sum of the individual’s relevant likelihood and evaluation related to behavioural beliefs. On the other hand, subjective norms are referent beliefs about what behaviors others expect and the degree to which the individual wants to comply with others’ expectations. The summary of the two theories suggest that a person’s health behavior is determined by their intention to perform a behavior (behavioural intention) is predicated by a person’s attitude toward the behavior, and the subjective norms regarding the behavior. The Theory of Reasoned Action has been criticized because it is said to ignore the social nature of human action Kippax [41]. These behavioural and normative beliefs are derived from individuals’ perceptions of the social world they inhabit, and are hence likely to reflect the ways in which economic or other external factors shape behavioural choices or decisions.
In addition, there is a compelling logical case to the effect that the model is inherently biased towards individualistic, rationalistic, interpretations of human behavior. Its focus on subjective perception does not essentially permit it to take meaningful account of social realities. Individuals’ beliefs about such issues are unlikely going to reflect the accurate potential and observable social facts. As such, the Theory of Planned Behaviour updated the Theory of Reasoned Action to include a component of perceived behavioural control, which brings about one’s perceived ability to enact the target behavior. Actually, perceived behavioural control was added to the model to extend its applicability beyond purely volitional behaviours. Previous to this addition, the model was relatively unsuccessful at predicting behaviours that were not mainly under volitional control. Therefore, the Theory of Planned Behaviour proposed that the primary determinants of behaviour are an individual’s Behavioural intention and perceived behavioural control. A constructive use of the TRA and TBP in research and public health intervention programmers might well contribute valuably to understanding issues related to health inequalities and the roles that other environmental factors have in determining health behaviours and outcomes. In spite of the criticism, the general theoretical framework of the TRA and TPB have been widely used in the retrospective analysis of health behaviours and to a lesser extent in predictive investigations and the design of health interventions Hardema, et al. [42]. This is why there is a connection between the study and the theory, since the tenets of the theories are located within the pore of the study.

Methodology

The study was conducted in Kabo Local Government Area of Kano State, Nigeria. It has an area of 341km2 and a population of 153,828 NPC [43]. The study comprises of women within the reproductive ages of 14-45, pregnant and married in Kabo Local Government Area of Kano State. Women were purposively selected for the study not just because of their ability to conceive but they are the ones that do encounter pregnancy induce hypertension. Two nurses were selected from the Cottage Hospital in the local government based on their long working experiences and competencies in the facility. This makes a total sample of twenty one (22) respondents. The study used Interpretative Phenomenological Analysis (IPA). Purposive sampling method was used in selecting the respondents for in-depth interview. Kabo Cottage Hospital was purposively selected, which is bigger compare to other two in the local government with an average of 52Anti-natal Care Attendance (ANC) and 36 live births in the facility monthly. The 22 respondents were interviewed by structural interview method, using tape recorder, note book and biro as data gathering instruments. The respondents were tag with codes like respondent 1, 2, 3, 4 and 5, etc. Based on the in-depth interview method, the data was presented using interpretative analysis.

Findings and Discussion

In attempt to mention the signs of pregnancy induced hypertension, respondent 1 states that: “signs of pregnancy induced hypertension are many, however, she stated the following as part of the signs as follows: chest pain and headache”. Corroborating, respondent 2 put forward the followings as some of the signs: “blurred vision and dizziness,” while respondents 3, 4, 5 and 6 agreed that pedal oedema and epitaxies are also among the signs. Similarly, a study by Haque [44] stated that high blood pressure, headache, blurred vision, swelling in extremities, nausea or vomiting, fatigue and sudden weight gain are among the signs of pregnancy induced hypertension. Furthermore, Magee, et al. [45] noted that the patient with severe PIH should be evaluated for signs of preeclampsia, as generalized edema, including that of the face and hands, rapid weight gain, blurred vision or scotomata (ie, areas of diminished vision in the visual field), throbbing or pounding headaches, epigastric or pain associated with upper quadrant, oliguria (urinary output < 500 mL/d),nausea with or without vomiting, hyperactive reflexes, chest pain, tightness and shortness of breath. Blood pressure should be measured and recorded at every prenatal visit, using the correct-sized cuff, with the patient in a seated position. Leeman [46] said gestational hypertension is a clinical diagnosis confirmed and established by at least two accurate blood pressure tests in the same arm in women without proteinuria, with readings of ≥ 140 mm Hg systolic and ≥ 90 mm Hg diastolic.
It should then be determined whether the patient’s hypertension is mild or severe (i.e. blood pressure > 160/110 mm Hg). When asked about the risk factors associated with pregnancy induced hypertension, respondent 1 states that: “parts of the risk factors associated with pregnancy induced hypertension are indefinitely large numerically, nonetheless, she listed the followings as part of the risk factors: “multiple gestations, elderly prim gravida and high parity.” Moreover, respondent 2 stated “polyhydramnios and essential hypertension,” while respondent 3 stated “kidney disease.” All the respondents agreed that high salt intake (in diet), obesity and stress also contribute to the risk factors associated with pregnancy induced hypertension. Bansode [47] also found that some of the factors associated with pregnancy induced hypertension include first pregnancy, new partner/paternity, age <18 years or >35years, black race, obesity (Body Mass Index, BMI ≥ 30), inter-pregnancy interval <2 years or > 10 years and use of selective serotonin reuptake inhibitors (SSRIs) beyond the first trimester; while placental or fetal risk factors include multiple gestation, hydropsfetalis, gestational trophoblastic disease and triploidy. Similarly, Umegbolu [48] reported that the overall incidence of PIH among pregnant women in Enugu State, Southeast Nigeria (2006-2015) was found to be 5.9%.
The study identified annual variations in the incidence of PIH (rising and falling trends between 2006 and 2015) among the pregnant women. The incidence of PIH was highest among those women above 35 years (13.5%), compared to those whose age is less than 20 years (9.1%) and those between 20-35 years (5.1%). The occurrence was also higher in the nulliparous (prim gravidae) (7.7%) compared to the multiparous ones (5.5%). Furthermore, Anujeet, et al. [49] stated that hypertension, collagen vascular disease, obesity, black race, insulin resistance, diabetes mellitus, gestational diabetes, increased serum testosterone concentrations and thrombophilia, clotting disorders, and hemolysis, elevated liver enzymes, low platelet count (HELLP) syndrome are also responsible risk factors for PIH. Similarly, age and parity are two of the identified maternal risk factors for the development of pregnancy induced hypertension. Extreme ages (age below 20 years and above 35 years) are known to be associated with higher incidence of pregnancy induced hypertension. Like the overall incidence of pregnancy induced hypertension, incidence among various age groups and parity varies from place to place. In Karachi, Rehman, et al. [50] found an incidence of 9% among older women and 27% among prim gravidae. However, Sajith, et al. [51] reported an incidence of pregnancy induced hypertension of 41.3% among 18-22 years old patients in their study.
Furthermore, Ahmed, et al. [52] states that educational attainment of women is also a factor that contributes to developing pregnancy induced hypertension. This is because illiterate mothers are more likely to suffer from hypertension during pregnancy than their counter parts. There is every tendency that educated mothers are likely to be aware of pregnancy related complications and its consequences, marry educated husband that facilitate couples discussion on maternal health care utilization, likely to be autonomous in decision making and hence meeting her reproductive needs. Generally, education increases health seeking behaviours of women. The study of Swati, et al. (2014) stated being unmarried as a risk factor and prognosticator of PIH, which is an exceptional result from this study. The study further explains that although marital status is hardly reported as a risk factor in the literature, a possible explanation in a resource poor country like Nigeria could be due to worry about the financial burden of single parenting in environment, which lacks any form of child welfare support. Moreover the stigma of having a child outside marriage is a potential source of concern and anxiety. In addition, Zusterzeel, et al. [53] had emphasized immunological intercourse as the prevention of this maternal-fetal conflict called pregnancy induced hypertension. There is an association of pregnancy-induced hypertension with duration of sexual co-habitation before the first conception. Male ejaculation is said to protect a woman if she has been repeatedly been exposed to it.
Regarding the prevention and management of pregnancy induced hypertension, respondent 10 states that “regular antenatal care and regular check-up/ BP checking are sine qua non.” Corroborating, all the respondents agreed that low salt intake, avoiding alcohol, regular intake of water drug therapy for severe hypertension, treatment of underlying medical conditions like kidney problem and avoidance of strenuous exercises or stress are parts of the prevention and management. The findings of the studies are similar with Singh [54] that PIH can be prevented and managed by low salt intake, drinking at least eight glasses of water a day, regular BP check-up, increase the amount of protein-rich foods and decrease the amount of fried and junk foods, regular exercise and enough rest, elevate your feet several times during the day, avoid drinking alcohol and beverages containing caffeine, prescription of drug therapy and additional supplements by a medical doctor. In drug management of pregnancy induced hypertension, ACOG [55] states that labetalol and extended-release nifedipine are first line drugs as they are safe and effective. Similarly, Morgan, et al. [56] emphasized, although beta-blockers other than labetalol are less well investigated, if labetalol cannot be used metoprolol, propranolol, pindolol and acebutolol may be considered. Extendedrelease nifedipine is the most widely used calcium channel blocker.
Amlodipine has been used, but the data are limited. Inhibitors of the Renin Aangiotensin Aaldosterone System (RAAS) are totally contraindicated. This includes angiotensin converting enzyme (ACE) inhibitors, angiotensin receptor blockers (ARBs) and direct renin inhibitors. The package insert of these agents comes with a black box warning stating that usage during the second and third trimesters can cause injury and death to the developing fetus; therefore, discontinuation is indicated as soon as pregnancy is detected. RAAS inhibitors use in the second and third trimesters is associated with renal agenesis, pulmonary hypoplasia and intrauterine growth retardation, IUGR. The proof of fetal injury during first trimester exposure is unclear. Post-delivery lactating mothers may use enalapril, captopril or quinapril because they have low concentration in breast milk; labetalol may be continued only in lactating mothers Colaceci [57]. In addition, Donovan [58] says the choice of antihypertensive drugs to be used depends on whether breastfeeding is tried or attempted. When the woman desires to breastfeed, deliberation must be given to potential transfer of the drug into breast milk. This is due to the established evidence that most drugs safely used in pregnancy are excreted in low amounts into breast milk and are compatible with breastfeeding. (Table 1) shows antihypertensive drugs of those to use and those to avoid during lactation.

biomedres-openaccess-journal-bjstr

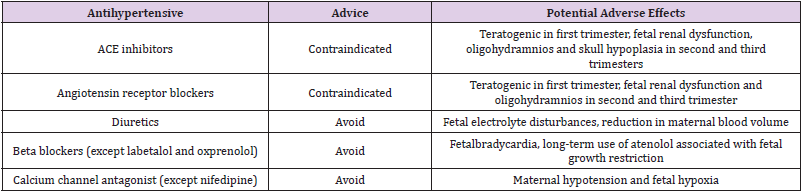
Table 1: Relatively Safe Antihypertensive Drugs in Pregnancy.

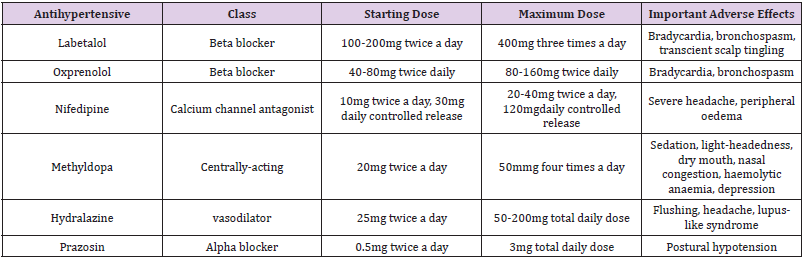
In an instance when there is no desire to breastfeed and adequate contraception is used, the choice of antihypertensive drug is the same as for any other non-pregnant woman or patient. While (Table 2) shows the antihypertensive drugs used in pre-eclampsia, which are the same as those used to treat chronic and PIH Lowe et al. [59-61].

biomedres-openaccess-journal-bjstr
Table 2: Antihypertensive Drugs during Breastfeeding. Source: Donovan [58]

Conclusion

The strains of maternal mortality remain unduly borne by women in less-developed countries, particularly in sub-Saharan Africa. Between the periods of 1990 and 2015, 10.7 million maternal deaths were stated globally, in spite of the fact that maternal mortality ratio had fallen by 44% over these periods. Out of these total numbers, developing countries account for about 99% of the global deaths in 2015, with Sub-Saharan Africa accounting for bumpily 66% with 201,000 deaths. PIHs are responsible for 70,000 maternal deaths universally, killing one woman every 11 minutes. Nigeria, in 2014, recorded the prevalence of pregnancy induced hypertension and was estimated to be about 20.8% among pregnant women attending antenatal clinics in Teaching Hospitals in South-South. Based on these problems, the findings of this study attest that the signs of pregnancy induced hypertension in Kabo Local Government include chest pain, headache, blurred vision, dizziness, pedal oedema and epitaxies. Finally, the risk factors are multiple gestations, elderly prim gravida, high parity, polyhydramnios, essential hypertension, kidney disease, high salt intake (in diet), obesity and stress.

Recommendations

The study recommends the following, based on the finding of the study:
1. The study recommends that pregnant women in Kabo Local Government should visit the hospital regularly; especially to check their blood pressure.
2. The women in Kabo Local Government should be educated about the signs of pregnancy induced hypertension. This will help them to know how to seek for medical services early.
3. Finally, women in Kabo Local Government should be educated on factors that will assist them to stay healthy and avoid pregnancy induced hypertension.

For More Articles: Biomedical Journal Impact Factor: https://biomedres.us

Pharmacology Journals

MORUS RUBRA L: “Phytochemical Screening, Anti- Bacterial, Antioxidant and Anti-Hyperglycemic Activity Determination

Introduction

Morus rubra Linn (MR), generally known as red mulberry belong to the Moraceae, mulberry family. It is originated from the eastern part of the United States of America and is now universally cultivated and naturalized in the areas of China, Korea and Japan. Edible fruits that are reddishly maturing to dark purple or black in colour. The fruits are soft, juicy and aggregate with a sweet taste and a hint of sourness, which is more evident in the less mature fruits. In addition, red mulberry sap was used by several tribes to treat ringworm while the stem bark is used as purgative and vermifuge. The fruits have also been utilized to treat diabetes, hypertension, anaemia and arthritis in traditional medicine, particularly in Chinese medicine [1] (Figures 1-4). It is also demonstrated that Morus rubra (MR) fruit leads to control over hyperglycaemia and may be a good antimicrobial agent against gram negative bacterial infections. The first documented use of mulberry fruits was described in the mid-1500s by De Soto expedition, who discovered consuming these dried fruits [2]. Diabetes is a heterogeneous disease affecting almost 6% of the world population. It is characterized by hyperglycemia and insulin resistance or a combination of both of these factors.

biomedres-openaccess-journal-bjstr

Figure 1: Morus rubra tree.

biomedres-openaccess-journal-bjstr

Figure 2: Morus rubra fruit.

biomedres-openaccess-journal-bjstr

Figure 3: Fruits of Morus rubra.

biomedres-openaccess-journal-bjstr

Figure 4: Leaves and flowers of Morus rubra.

biomedres-openaccess-journal-bjstr

Table 1: Taxonomical Classification of Morus rubra L. (Miljkovic et al., 2014).

The treatment of diabetes with allopathic drugs causes moderate to severe adverse events. Hence, the alternative systems of medicine from plant and marine sources are being explored to treat diseases [3] (Tables 1-4). Fully ripened mulberry fruit has a delicious, mouth-watering taste with a pleasant aroma and flavor. It is valued for both direct consumption and the creation of value-added products. Mulberry fruits are known for their nutritional value, which makes them beneficial to human health. Principal sugars present in mulberry are fructose and glucose, which increase with ripening [4,5]. Whereas the primary fatty acid that found in the mulberry fruit are oleic acid, palmitic acid and linolenic acid [6,7]. Citric acid, tartaric acid, malic acid, succinic acid and fumaric acid are among the organic acids found in mulberry fruits; nonetheless, malic acid is the most abundant organic acid present. Mulberry is also high in a number of essential minerals including calcium, phosphorus, potassium, magnesium and sodium.

biomedres-openaccess-journal-bjstr

Table 2: Vernacular Names of Morus rubra L. (Lim, 2012).

biomedres-openaccess-journal-bjstr

Table 3: Organoleptic Characteristics of Red Mulberry (MR).

biomedres-openaccess-journal-bjstr

Table 4: Red Mulberry (MR) with Pharmacological Actions. (Elbaz, et al. [10,12-14]) (Thabti et al., 2020) (Wei et al., 2018).

Materials and Methods

The raw material was collected and purchased from a loca Indian market. sun dried at a temperature of 30˚C under the shade for several days to eliminate the excessive moisture content. The dried sample was preserved in a dry container with low humidity conditions to prevent the absorption of the moisture by the dried sample. The dried sample was ground into powder grinding machine. The extraction process started by placing the dried sample and solvent together in a vessel or extraction instrument. The extractions of MR were carried out with ethanolic Soxhlet extraction and maceration.

Chemicals / Equipment

Nutrient Agar (HiMedia Laboratories Pvt.Ltd. India), Nutrient Broth (HiMedia Laboratories Pvt.Ltd. India), Tryptic Soy Agar (HiMedia Laboratories Pvt.Ltd. India), Tryptic Soy Broth (HiMedia Laboratories Pvt.Ltd. India), Ciprofloxacin, Penicillin,70% Alcohol, Plant Extract and Dimethyl Sulfoxide (DMSO) (Fisher Scintific UK). Ethanol 95% (John Kollin Corporation, USA), Methanol (J.T. Baker. Center Valley, PA), α,αdiphenyl-β-picrylhydrazyl (DPPH) (Sisco Research Laboratories Pvt. Ltd, India.), Butyl Hydroxyl Toluene (BHT), Sodium Carbonate (Bendosen Laboratory Chemicals), Folin- Ciocalteu’s Phenol Reagent (EMD M.C. Germany), Gallic Acid (R&M Chemicals, UK), Shimadzu UV- Visible Spectrophotometer.

Bacterial Strains

The cultures were used for the antibacterial assay. These cultures were obtained from microbial culture bank of Faculty of Pharmacy (FOP), Aimst University.
a) Escherichia coli (E. coli) ATCC 8739.
b) Staphylococcus aureus (S. aureus) ATCC 29737.
c) Bacillus subtilis (B. subtilis) ATCC 6633.
d) Salmonella typhi (S. typhi) ATCC 19430.

Maceration Extraction

510gm of mulberry ground fruits were weighed and soaked in 1 L of 95% ethanol. The conical flask was kept at dark, in the cupboard for 9 days and swirling was done on daily basis throughout the maceration process. After 9 days, the maceration process was completed and the mixture was filtered by using muslin cloth. The volume of maceration extract collected from this process was 850 ml. The maceration extract was evaporated using rotary evaporator (Rotary evaporated R-210 BUCHI, Corporation) at 75°C and the speed of the rotator was set to 100 rpm. The final volume of maceration semi solid product collected from this process was 300 ml.

Soxhlet Extraction

450 gm of fruits ground powder were weighed and 1L ml of 95 % ethanol was poured into the soxhlet flask. The heating mantle was kept at 80 ºC. The duration for this Soxhlet extraction process to be completed was about 17hours. Decolorization of purple colour of the fruits was observed. The total volume of Soxhlet extract collected from this process was 350 ml. The extract was evaporated using rotary evaporator at 75°C and the speed of the rotator was set to 100 rpm. The extract was evaporated using rotary evaporator (Rotary evaporated R-210 BUCHI, Corporation) at 75°C and the speed of the rotator was set to 100 rpm. The final volume of product collected from this process was 250 ml. Figures 5 & 6 shows the evaporated extracts for maceration and hot extraction respectively.

biomedres-openaccess-journal-bjstr

Figure 5: Final maceration product semi-solid form.

Phytochemical Analysis

Phytochemical tests were carried out to identify the presence of carbohydrates, monosaccharides, polysaccharide, reducing sugar, pentose sugar, hexose sugar, galactose, protein, amino acid, free fatty acid, saturated fatty acid, neutral lipid, volatile oil, steroid, terpenoid, glycoside (anthraquinones glycoside, cardiac glycoside, cyanogenic glycoside, coumarin glycoside, saponin glycoside), alkaloid, flavonoid, phenol and tannin. The total phenolic content of MR using 50 and 200μg/ml solution was determined by Folin– Ciocalteu reagent method using gallic acid as standard [8].

Antioxidant Assay

Antioxidant activity of ethanolic extract of MR is studied using DPPH method. The DPPH is a stable free-radical which has a colour of purple, as the antioxidants react with the DPPH, the DPPH will be converted into non-radical DPPH-H form. Besides that, the colour of the DPPH will be decolorized from purple to light yellow colour. The degree of decolorization indicates the potency of the plant extracts in scavenging the free radicals. 0.1M of methanolic DPPH was freshly prepared by dissolving 3.94mg of DPPH crystalline powder in 100ml of methanol and kept in a clean beaker. Extracts (0.2 ml) at different concentrations (50–1000 μg/ml) was mixed with 0.8 ml of tris hydrochloric acid (HCl) buffer (100 mM; pH 7.4). One millilitre DPPH (500 mM in 1.0 ml ethanol or methanol) solution was added to the mixture. The mixture was shaken vigorously and incubated for 30 min at room temperature. The absorbance of the resulting solution was measured spectrophotometrically at 518 nm (Model UV 1800, Shimadzu, Japan). BHT is used a standard. All the determinations were carried out in triplicate. The following formula was used for the antioxidant activity determination [9]. DPPH Radical Scavenging Activity (%) = 𝐴𝑐𝑜𝑛𝑡𝑟𝑜𝑙−𝐴𝑠𝑎𝑚𝑝𝑙𝑒𝐴𝑐𝑜𝑛𝑡𝑟𝑜𝑙 𝑥 100.

Antibacterial Assay

The 10 mg/ml stock solution of ethanolic extract of MR is prepared using 0.5% DMSO (prepared using distilled water). The antimicrobial activity of ethanolic extract of MR against four pathogenic microorganisms (namely Escherichia coli [ATCC 8739], Staphylococcus aureus [ATCC 29737], Bacillus subtilis [ATCC 6633], Salmonella typhi [ATCC 19430]) was carried out. Using stock, the primary culture was prepared and used for preparation of sub-cultures of microorganism. The antibacterial activity was tested by agar well diffusion method. E. coli, S. aureus, B subtilis and S. typhi were spread onto the surface of nutrient agar with sterile swab (0.1 ml containg106 cell/ml). Six mm diameter wells were punched into the agar and filled with 0.1ml of the ethanolic extract or standards (penicillin and ciprofloxacin). Then incubated at 37ᵒC for 24 hours. After 24 hours, zone of inhibition were measured. All experiments were carried out in triplicates.

Minimum Inhibitory Concentration (MIC) is determined by using the broth dilution method. Serial dilution was made between 1000 mg/ml and 62.5 mg/ml. Mueller- Hinton (MH) broth was prepared and 1ml was added into test tubes alongside 100μl of selected ATCC strains. Then, 1ml of extracts with the concentrations mentioned above were introduced into the test tubes contained the broth and ATCC strain and mixed for even distribution. These test tubes were then incubated for 36 hrs at 37°C. As a positive control, 1 ml of selected antibiotics was added to the test tube while the negative control only contained selected ATCC strains [10]. The results obtained after incubation were compared to both the positive and negative control. The concentration of the extract that gave clear results (absence of turbidity) was considered as the MIC of the extract. The Minimum Bactericidal Concentration (MBC) was determined as the lowest concentration of extract that killed at least 99% of the initial bacterial number [11].

Antidiabetic Activity

Healthy, adult, Sprague-Dawley (SD) rats (180 ± 20 g) were used for the studies. The animals were obtained from Central animal house, AIMST University, Malaysia. Approval from the AIMST University Human and Animals Ethics Committee was obtained. The animals were housed in large, spacious polyacrylic cages at ambient room temperature with 12 h light/12 h dark cycle. A minimum of 5 days of acclimatization period was allowed before the animals are used in the experiment. The animals were fed with water and normal rodent pellet diet ad libitum. Diabetes mellitus will be induced in overnight-fasted rats by administration of single intraperitoneal (I.P.) injection of freshly prepared streptozotocin (STZ) with a dose of 60 mg/kg/mL [12]. To prevent the STZ-induced hypoglycaemia, rats administered with 10% dextrose solution after 24 h of STZ administration for next 24 h. Induction of diabetes was verified after 72 h by measuring blood glucose level with strips using glucometer and the animals allowed 14 days for the stabilization of blood glucose level [13]. On day 14, animals having a blood glucose level higher than 220 mg/dL were considered diabetic and included in the experiments. Diabetic animals were randomly divided into five groups (Group II–VI) as follows:
Group I: Normal control
Group II: Diabetic control
Group III: Diabetic animals treated with glibenclamide (20 mg/ kg/P.O.)
Group IV: Diabetic animals treated with ethanolic extract of MR (100 mg/kg/P.O.) Group V: Diabetic animals treated with ethanolic extract of MR (200 mg/kg/P.O.)
Group I (normal control) and group II (diabetic control) rats were given 0.5% w/v carboxymethylcellulose (CMC) while the rats in group III treated with 20mg/kg body weight (BW) of glibenclamide and rats in group IV-V were administered with ethanolic extract of MR of 100mg and 200mg per kg. The standard and test drugs were suspended in 0.5% w/v CMC and administered once daily through oral gavage for 28 consecutive days. Throughout the study, variations in experiment animals’ body weight will be monitored at regular intervals. At the end of the study, the blood samples withdrawn from all the experimental rats through retroorbital plexus puncture. The serum was separated from the blood sample and used for biochemical analysis.

Statistical Analysis

The value in the antidiabetic activity was expressed as mean ± Standard Error of the Mean (SEM). The data was analysed using one-way analysis of variance (ANOVA), followed by Tukey’s posthoc test. P < 0.05 will be considered as statistically significant.

Results

Phytochemical analysis showed the presence of carbohydrates, monosaccharides, reducing sugar, hexose sugar, galactose, protein, amino acid, neutral lipid, terpenoid, glycoside, anthraquinones glycoside, coumarin glycoside, alkaloid, flavonoid, phenol and tannin. The phytochemical screening is shown in Tables 5 & 6. The total phenolic content found was 6.420 mg GAE/g and 6.097 mg GAE/g for the concentrations of 50 and 200µg/ml respectively. Antioxidant activity of ethanolic extract of MR is studied using DPPH method and BHT was used as standard. In DPPH radical scavenging method, BHT and MR extract showed 50% inhibition (IC50) at 84.04µg/ml and 182.82µg/ml, respectively. The antibacterial activity of ethanolic extract of MR was tested by using the E. coli, S. aureus, S. typhi, and B. subtilis. The extract concentrations used in the agar well diffusion method were 0.1, 0.2, 0.4, 0.6, 0.8 and 1.0 mg/ml, other than that, 5mg/ml of penicillin and ciprofloxacin was playing the role as a standard in this study. In the present study, there was no zone of inhibition observed in all concentrations of ethanolic MR extract. The microorganism used were all in active condition, this can be proven as the ciprofloxacin as well as penicillin showed a clear zone of inhibition.

In antimicrobial screening, ethanolic extract of MR exhibited antibacterial activity against E. coli with equivalent MIC and MBC identified at the concentration of 500 mg/ml, 250 mg/ml and 125 mg/ml and did not inhibit S. aureus. Anti-hyperglycaemic activity of ethanolic extract of MR was studied using STZ-induced diabetic rats. The diabetic animals were showed decreases in body weight but the results were not significant. The diabetic rats showed significant increases in the levels of glucose throughout the study when compared with that of control animals. Whereas the diabetic animals treated with glibenclamide or ethanolic extract of MR (100/ 200 mg/kg) showed significant decreases in the glucose levels when compare with that of diabetic control animals.

Antimicrobial Screening

The antimicrobial activity of Morus Rubra (MR) ethanolic Soxhlet fruit extract was analyzed against the gram negative bacteria Escherichia coli and gram positive bacteria Staphylococcus aureus at 4 different concentrations: 500 mg/ml, 250 mg/ml, 125 mg/ml and 62.5 mg/ml. It was expressed by identifying the MIC and MBC of fruit extract through the broth tube dilution method. The obtained result from the MIC test showed that turbidity was observed in all the assay tubes that tested against the S. aureus. Therefore, three tubes with the least turbidity were selected and subjected for MBC.

Preparation of Tryptic Soy Agar Plate

Tryptic soy broth or trypticase soy broth (frequently abbreviated as TSB) is used as a culture broth to grow aerobic bacteria. It is a complex, general purpose medium that is routinely used to grow certain pathogenic bacteria, which tend to have high nutritional requirements (i.e., they are fastidious). Its agar counterpart is Tryptic Soy Agar (TSA). One of the components of Tryptic soy broth is Phytoene which is an enzymatic digest of soybean meal). TSB is frequently used in commercial diagnostics in conjunction with the additive sodium thioglycolate which promotes growth of anaerobes. Tryptic Soy Agar was only applied for the Bacillus subtilis out of the 4 chosen bacterial strains. 20g of tryptic soy agar powder was weighed and transferred into 500ml of distilled water. The conical flask was subjected to sterilization with the use of autoclave for 2 hours at the temperature of 121˚C. In the biosafety cabinet, the freshly prepared sterilized tryptic soy agar was poured into the sterilized Petri plates. The inoculation loop was used to eliminate the bubble formed on the surface of the tryptic soy agar before solidification occurs. Approximately, 25ml of the tryptic soy agar was poured into the sterilized Petri plates, these plates were allowed to cool down and solidified in the biosafety cabinet. These plates were incubated in an upside-down position at the temperature of 37˚C and were taken out during the agar well diffusion test.

Agar Well Diffusion

Before the initiation of the agar well diffusion test, the biosafety cabinet was sterilized with 70% alcohol and the UV light was switched on for 10 minutes. Apart from that, the plant extract dilutions, antibiotic dilutions with the concentration of 5mg/ml (Penicillin and Ciprofloxacin), bacteria strains, bacteriological loop, sterilized cork borer, sterilized micropipette tips and micropipette (p100), Bunsen burner and nutrient agar plate were prepared in prior of the test. After switched off the UV light and placement of all materials in the biosafety cabinet, gloves were worn and 70% alcohol was applied properly to sanitize the gloves to prevent contamination occurs. NA/TSA (nutrient agar/tryptic soy agar), date, name, bacterial strain, ATCC code and antibiotics were labelled accordingly at the bottom side of the plates. 0.1 ml of broth that contained bacterial strain was pipetted into the Petri plates with the use of a micropipette. The sterilized glass spreader was used to spread the bacterial strains evenly on the plate. After every spreading, the glass spreader should be sanitized with 70% alcohol and showed to the flame.

Then the sterilized cork borer was used to make wells on the agar plate. There were 4 wells punched in one Petri plate, each well was separated from each other in equal distance. The plates were prepared in a triplicate manner for the comparison purpose, as well as the positive and negative plates. The cork borer was sterilized every time after use. The agar which was fitted inside the cork borer after punching the wells was discarded. The different concentrations of plant extract as well as different antibiotics were added into the wells by using a micropipette. The wells were filled until 60% of the height of the wells. The micropipette tips were discarded after each concentration of plant extract and antibiotics was performed. This can prevent an alteration of the concentration of plant extract and antibiotics. The Petri plates were then incubated in an incubator at the temperature of 37˚C for 24 hours. The zone of inhibition of the plates was observed and recorded.

Minimum Inhibitory Concentration (MIC)

5 loops of the bacterial strains were cultured in each sterile nutrient broth and then incubated at 37 ͦ C for 24 hours, centrifuged at 5000 rpm for 10 minutes.

Preparation of Standard McFarland Bacterial Culture: The nutrient broth as well as tryptic soy broths were prepared freshly. These broths were sterilized for 2 hours at the temperature of 121˚C and were allowed to cool down. In the biosafety cabinet, 5 loop full of Bacillus subtilis bacteria colonies were inoculated into the tryptic soy broth. This step was repeated for the other three bacteria which were inoculated in the nutrient broth. These broths were incubated for 24 hours at the temperature of 37˚C in an incubator. Then, these broths that contained bacteria strains were centrifuged at 5000rpm for 10 minutes. The supernatant was discarded and the cell pellet formed was collected and re-suspended in the sterile nutrient broth and tryptic soy broth. By using the UV spectrophotometer, the seeded broths were standardized to the value 0.5 of the absorbance according to McFarland standard at the wavelength of 517nm.

Preparation of Sample: The extracts were obtained from the Soxhlet extraction method using 95% ethanol. 4 different concentrations of the extracts were prepared at 25, 50, 100, 200μg/ml. 2 mg of extracts was dissolved in 10ml of ethanol, forming a stock solution with a concentration of 200μg/ml. Then it was double-diluted by mixing 2ml of the stock solution and 2ml of ethanol to obtain the concentration of 100μg/ml. The same procedure was repeated and obtained 50μg/ml in concentration. Next, 1ml of stock solution was taken and mixed with 2ml of ethanol to obtain a concentration of 25μg/ml. 4 test tubes were prepared and 0.2ml of the sample solution were taken and transferred into the test tube prepared. 4ml of 2.5% sodium carbonate and 0.2ml of Folin-Ciocalteu reagent was added to each of the test tubes. The test tubes were allowed to sit for 2 hours. The absorbance of the standard solution was examined by 750nm UV spectrophotometry and was recorded.

Preparation of Blank: 0.2ml of Folin-Ciocalteu reagent, 4ml of 2.5% sodium carbonate and 0.2ml of ethanol were added into the test tube and it was allowed to sit for 2 hours. The absorbance of the standard solution was examined by 750nm UV spectrophotometry. The values of absorbance of standard and sample obtained were then utilized in plotting the graph of UV absorbance against the concentration of sample and standard.

Serial Dilution of Minimum Inhibitory Concentration (MIC) Assay

Before starting the MIC assay, the biosafety cabinet was sanitized with 70% alcohol and the UV light was switched on for 10 minutes. 2.5 g of plant extract was measured using an analytical balance and mixed with 25ml of 0.5% DMSO (dimethyl sulphoxide), forming the stock solution with a concentration of 10mg/ml. The mixtures with the concentration of 50, 25, 12.5, 6.25, 3.125, 1.5625 mg/ml were formed upon two-fold serial dilution. 2 ml of the stock solution and 2ml of the standard McFarland seeded broth were taken by using a micropipette and mixed in the sterilized test tube, thus obtained a concentration of 50mg/ml. 2 ml of the stock solution and 2ml from the first test tube were taken by using a micropipette and mixed in the sterilized test tube, thus obtained a concentration of 25mg/ ml. 2 ml of the stock solution and 2ml from the second test tube were taken by using a micropipette and mixed in the sterilized test tube, thus obtained a concentration of 12.5mg/ml. 2 ml of the stock solution and 2ml from the third test tube were taken by using a micropipette and mixed in the sterilized test tube, thus obtained a concentration of 6.25mg/ml. 2 ml of the stock solution and 2ml from the fourth test tube were taken by using a micropipette and mixed in the sterilized test tube, thus obtained a concentration of 3.125mg/ml. 2 ml of the stock solution and 2ml from the fifth test tube were taken by using a micropipette and mixed in the sterilized test tubes.

2ml of the mixture was pipetted and discarded, thus obtained a concentration of 1.5625mg/ml. The positive tube that contained seeded broth and the negative tube that contained sterile nutrient or tryptic soy broth were prepared accordingly. The micropipette tips were discarded after finished transferring each set of test tubes. These tubes were fitted with cotton wool and covered with double-folded aluminium foil the tubes were incubated for 24 hours at the temperature of 37˚C. The turbidity of each of the tubes were observed and recorded. In contrast, the extract that tested against the E. coli showed clear solution at concentration of 500 mg/ml, 250 mg/ml and 125 mg/ml. This indicated that ethanolic Soxhlet extract of Morus rubra did not exhibit antibacterial action against E. coli at these concentrations. Hence, these three assay tubes were subculture on fresh sterilized nutrient agar plates to find out the MBC of the fruit extract on E. coli. From the MBC analysis, the nutrient agar plates for the S. aureus showed the bacterial growth revealed that the ethanolic fruit extract had bacteriostatic or bactericidal effect against S. Aureus. However, positive results were obtained for the E. coli in which there is no observed bacterial growth on all three nutrient agar plates. Therefore, the fruit extract possessed equivalent MIC and MBC on E. coli, ranged from 125 mg/ ml to 500 mg/ml. These results suggested that ethanolic Morus rubra extract was more susceptible to the gram positive bacteria than gram negative bacteria. The antibacterial properties of the red mulberry may be due to the presence of phenolic compounds in abundance such as flavonoid. At a low concentration, the phenols were acted as bacteriostatic and at a high concentration, phenols may act as bactericidal. The results are shown in Table 7. MCB results are laid down.

Antioxidant screening

The MR were cleanly washed and air-dried at room temperature for 1 week to prevent deterioration. MR were passed through a sieve 1.40 mm to remove the unwanted impurities and then pulverized into powder form using the mortar and pestle. The extraction of the seeds was carried out using ethanol as an extracting solvent. The Soxhlet extraction method was employed to extract the chemical constituents in the MR. 19.38 gm of the MR powder was inserted into a thimble 300 ml of ethanol was measured accurately and added into the round bottom flask. The running of tap water has remained until the whole apparatus cools down. The MR extract contained in the round bottom flask was poured into a cleaned and dried conical flask (1000 ml). The conical flask was covered with cotton wool and aluminium foil to prevent evaporation. The ethanolic extract of MR was evaporated by using the rotary evaporator. The temperature of the rotary evaporator was set at 80˚C. The process was continued until no notable changes were observed. The MR extract was poured into a clean beaker. The collected pure extract was introduced into a China dish and placed on the hot water bath for further evaporation.

Determination of total Phenolic Content Preparation of Standard

Gallic acid was used as a standard in this assay and compared with the sample to identify the presence of phenolic compounds in the plant extract. Five different concentrations of Gallic acid were prepared at 1, 2, 4, 6, 8 and 10μg/ml. The stock solution was prepared by dissolving 10mg of Gallic acid in 10ml of 95 % ethanol. Then, 1ml of the solution was diluted with 9ml of ethanol to obtain a concentration of 100μg/ml. The same procedure was repeated until the final concentration of 1μg/ml was obtained. From the stock solution, 1.0, 0.8, 0.6, 0.4, 0.2, 0.1ml were pipetted into 6 different tubes and labelled accordingly. The volume was then made up to 10ml with 95% ethanol. Another 6 clean tubes were prepared. 0.2ml of the standard solution were taken and transferred into the test tube prepared. 4 ml of 2.5% sodium carbonate and 0.2ml of Folin-Ciocalteu reagent was added to each of the test tubes. The test tubes were allowed to sit for 2 hours. The absorbance of the standard solution was examined by 750nm UV spectrophotometry and was recorded.

Preparation of Sample: Four different concentrations of the extracts were prepared at 25, 50, 100, 200μg/ml. 2 mg of extracts was dissolved in 10ml of ethanol, forming a stock solution with a concentration of 200μg/ml. Then it was double-diluted by mixing 2ml of the stock solution and 2ml of ethanol to obtain the concentration of 100μg/ml. The same procedure was repeated and obtained 50μg/ml in concentration. Next, 1ml of stock solution was taken and mixed with 2ml of ethanol to obtain a concentration of 25μg/ml. 4 test tubes were prepared and 0.2ml of the sample solution were taken and transferred into the test tube prepared. 4ml of 2.5% sodium carbonate and 0.2ml of Folin-Ciocalteu reagent was added to each of the test tubes. The test tubes were allowed to sit for 2 hours. The absorbance of the standard solution was examined by 750nm UV spectrophotometry and was recorded.

Preparation of Blank: 0.2ml of Folin-Ciocalteu reagent, 4ml of 2.5% sodium carbonate and 0.2ml of ethanol were added into the test tube and it was allowed to sit for 2 hours. The absorbance of the standard solution was examined by 750nm UV spectrophotometry. The values of absorbance of standard and sample obtained were then utilized in plotting the graph of UV absorbance against the concentration of sample and standard.

DPPH Radical Scavenging Assay (diphenyl-picrylhydrazyl hydrate)

Preparation of DPPH Solution: 0.1mM of methanolic DPPH was freshly prepared by dissolving 3.94mg of DPPH crystalline powder in 100ml of methanol and kept in a clean beaker. The beaker was covered with aluminium foil to prevent oxidation.

Preparation of Standard: BHT was used as a standard in this assay. Six different concentrations of BHT solutions were prepared at 10, 20, 40, 60, 80 and 100μg/ml. The stock solution was first prepared by dissolving 10mg of BHT in 10ml of methanol. 1ml of the solution was then diluted ten-fold with 9ml of methanol to obtain a concentration of 100μg/ml. From the stock solution, 10, 8, 6, 4, 2, 1ml were pipetted into 6 different test tubes and made up to 10ml with methanol. Then, 3ml of 0.1mM DPPH reagent was added to 2.5ml of different concentrations of methanolic extracts. The mixtures were shaken and labelled accordingly. The test tubes were allowed to keep in the dark for 30 minutes. The absorbance was measured at 518nm using a UV spectrophotometer.

Preparation of Sample: The steps in preparation of DPPH solution were repeated in the preparation of the sample, in which the BHT was changed to the plant extract. The absorbance was measured at 518nm using a UV spectrophotometer.

Preparation of Blank: The blank solution was prepared by mixing 3ml of 0.1mM DPPH reagent and 2.5ml of methanol, the solution was allowed to stand in the dark for 30 minutes. The absorbance was measured at 518nm using a UV spectrophotometer. The values of absorbance of standard and sample obtained were then utilized in plotting the graph of UV absorbance against concentration of the sample and standard.

Antibacterial Assay

Sterility Test of Ethanolic MR Extract

Before the initiation of phytochemical screening, antibacterial and antioxidant assay of MR extract. The extract was streaked on nutrient agar and was incubated for 24 hours at the temperature of 37˚C. Due to the movement control order in Malaysia, the plant extract was kept in the fridge for about 3 months, therefore the growth promotion test is able to determine whether microbes were present in the plant extract. This enables us to ensure positive results for all tests, especially antibacterial assay. There was no bacterial growth observed after 24 hours of incubation.

Serial Dilution of Extract: Before the dilution of plant extract, the 0.5% DMSO was prepared by measured 0.5ml of DMSO and mixed with 99.5ml of sterilized distilled water. 400mg of plant extract was weighed with the use of analytical balance and it was transferred to a clean beaker that contained 40ml of 0.5% DMSO. This gave rise to the formation of a stock solution with a concentration of 10mg/ml. Next, the beaker was subjected to sonication to ensure complete mixing of the two different liquid. From the stock solution, 10, 8, 6, 4, 2, 1ml were pipetted into 6 different sterilized universal tubes and were labelled accordingly. The volume was then made up to 10ml with 0.5% DMSO. The universal tubes were tightly screwed and kept in the refrigerator for storage.

Preparation of Bacterial Strains: 1.95g of nutrient broth powder and 1.5g of tryptic soy broth powder were weighed accurately using an analytical balance and transferred into 4 different conical flasks (100ml). These conical flasks were labelled accordingly.

Preparation of Nutrient Agar Plate: 11.2g of nutrient agar powder was weighed 3 times and transferred into 3 conical flasks (1000ml). 400ml of distilled water was measured accurately and poured into each of the flasks. After putting magnetic beads into 3 of the conical flasks, these conical flasks were placed on the magnetic stirrer to facilitate the dissolving process. The mouth of the conical flasks was fitted with cotton wool and covered with double-folded aluminium foil. The conical flasks were subjected to sterilization with the use of autoclave for 2 hours at the temperature of 121˚C. In the biosafety cabinet, the freshly prepared sterilized nutrient agar was poured into the sterilized Petri plates. The inoculation loop was used to eliminate the bubble formed on the surface of the nutrient agar before solidification occurs. Approximately, 25ml of the nutrient agar was poured into the sterilized Petri plates, these plates were allowed to cool down and solidified in the biosafety cabinet. These plates were incubated in an upside-down position at the temperature of 37˚C and were taken out during the agar well diffusion test.

Preparation of Tryptic Soy Agar Plate: Tryptic soy broth or Trypticase soy broth (frequently abbreviated as TSB) is used as a culture broth to grow aerobic bacteria. It is a complex, general purpose medium that is routinely used to grow certain pathogenic bacteria, which tend to have high nutritional requirements (i.e., they are fastidious). Its agar counterpart is tryptic soy agar (TSA). One of the components of Tryptic soy broth is Phytoene which is an enzymatic digest of soybean meal). TSB is frequently used in commercial diagnostics in conjunction with the additive sodium thioglycolate which promotes growth of anaerobes. Tryptic Soy Agar was only applied for the Bacillus subtilis out of the 4 chosen bacterial strains. 20g of tryptic soy agar powder was weighed by using an analytical balance and transferred into a 1000ml conical flask.

500ml of distilled water was poured into the conical flask and labelled accordingly. After putting the magnetic bead into the conical flask, the conical flask was placed on the magnetic stirrer to facilitate the dissolving process. The mouth of the conical flask was fitted with cotton wool and covered with double-folded aluminium foil. The conical flask was subjected to sterilization with the use of autoclave for 2 hours at the temperature of 121˚C. In the biosafety cabinet, the freshly prepared sterilized tryptic soy agar was poured into the sterilized Petri plates. The inoculation loop was used to eliminate the bubble formed on the surface of the tryptic soy agar before solidification occurs. Approximately, 25ml of the tryptic soy agar was poured into the sterilized Petri plates, these plates were allowed to cool down and solidified in the biosafety cabinet. These plates were incubated in an upside-down position at the temperature of 37˚C and were taken out during the agar well diffusion test.

Phytochemical Screening of Ethanolic MR Extract: The MR was extracted with 95% ethanol, and the plant extract was undergone phytochemical screening. In the present study, the results obtained for the phytochemical screening of MR ethanolic extract was analysed and it was found out that alkaloids, anthraquinone, carbohydrate and flavonoids were present in the sample. The alkaloid content was tested with Mayer’s and Wagner’s reagent. Mayer’s reagent is an alkaloidal precipitating reagent which its function is to determine the presence of alkaloids in natural products. Most alkaloids will be precipitated in a neutral or slightly acidic solution owing to Mayer’s reagent. Cream colour precipitate will be obtained upon observation. The ethanolic extract of MR showed positive results for both Mayer’s and Wagner’s tests, which indicates the MR contained alkaloids component.

Antioxidant Assay

Determination of Total Phenolic Content (TPC): In this research, the antioxidant potential of the MR was determined by using DPPH free radicals scavenging method and BHT was used as a standard. The DPPH is a stable free-radical which has a colour of purple, as the antioxidants react with the DPPH, the DPPH will be converted into nonradical DPPH-H form. Besides that, the colour of the DPPH will be decolorized from purple to light yellow colour. The degree of decolorization indicates the potency of the plant extracts in scavenging the free radicals.

Subsequently, the plant extract was prepared in the concentration of 10, 20, 40, 60 , 80 and 100 μg/ml and mixed with the DPPH, the absorbance was determined at 518nm after kept the tubes in the dark for 30 minutes. Phenolic compounds are very essential plant constituents which responsible for the antioxidant activity due to its redox properties. As a basis, Folin-Ciocalteu reagent was used to measure the phenolic content of different concentrations of plant extract. In this test, the Gallic acid was used as a standard and the total phenolic content was calculated by using the formula C = (A/B) x dilution factor. The results were derived from the calibration curve of Gallic acid, it was expressed as Gallic acid equivalents (GAE) per gram of samples. In the present study, the total phenolic content found was 6.420 mg GAE/g and 6.097 mg GAE/g for the concentrations of 50 and 200μg/ml respectively. The following formula was used for the antioxidant activity determination.

The concentration and absorbance of Gallic acid determined by U.V and concentration of MR ethanolic absorbance is shown in Table 8 and Graph 1 is drawn, respectively. The concentration, absorbance and the corresponding percentage of scavenging of BHT for DPPH Free Radical Scavenging Assay is shown in Table 9. The concentration, absorbance and the corresponding percentage of scavenging of ethanolic MR extract is placed Table 10 while Graph of percentage scavenging against the standard concentration is drawn in Graph 2. Table 11 represents The concentration, absorbance and the corresponding percentage of scavenging of ethanolic MR extract. The Graph of percentage scavenging against the sample concentration is shown in Graph 3.

Antihyperglycaemic Activity Screening of Maceration Extract

Animal

Healthy, adult, Sprague-Dawley (SD) rats (180 ± 20 g) were used for anti-hyperglycemic studies. The animals were obtained from Central animal house, AIMST University, Malaysia. Approval from the AIMST University Human and Animals Ethics Committee was obtained.

Induction of Diabetes

Healthy, adult male SD rats were used for the experiment. Diabetes mellitus will be induced in overnight fasted rats by administration of single intraperitoneal (I.P.) injection of freshly prepared streptozotocin (STZ) with a dose of 60 mg/kg/mL [12]. Anti-hyperglycaemic activity of ethanolic extract of MR was studied using STZ-induced diabetic rats. The diabetic animals were showed decreases in body weight but the results were not significant (Table 2). The diabetic rats showed significant increases in the levels of glucose throughout the study when compared with that of control animals. Whereas the diabetic animals treated with glibenclamide or ethanolic extract of MR (100/ 200 mg/kg) showed significant decreases in the glucose levels when compare with that of diabetic control animals. As shown in Tables 12 & 13, the normalized blood glucose levels of 200 and 400 mg/kg Morus rubra treated groups did not exhibit significant difference as compared to the 20 mg/ kg glibenclamide treated group since week one. This revealed that the anti-hyperglycaemic effect of the Morus rubra was comparable with that of glibenclamide.

Discussion

One of the objectives of this research was to determine the phytochemical properties of MR. The MR extracted with 95% ethanol and the plant extract was undergone phytochemical screening. The presence of phytochemicals is a marker that the plant can be an essential source of precursors in the formation of newer synthetic drugs. In the present study, the results obtained for the phytochemical screening of MR ethanolic extract was analysed and it was found out that alkaloids, anthraquinone, carbohydrate and flavonoids were present in the sample. Moreover, the extractive value estimation should be carried out to determine the amount of the active constituents in a given amount of plant material and identify which extraction solvent is more suitable for the given plant sample. By using this method, phytochemicals present in the plant were extracted maximally. Phenolic compounds are very essential plant constituents which responsible for the antioxidant activity due to its redox properties. As a basis, Folin-Ciocalteu reagent was used to measure the phenolic content of different concentrations of plant extract. In this test, the Gallic acid was used as a standard and the total phenolic content was calculated by using the formula C = (A/B) x dilution factor. The results were derived from the calibration curve of Gallic acid, it was expressed as Gallic acid equivalents (GAE) per gram of samples. In the present study, the total phenolic content found was 6.420 mg GAE/g and 6.097 mg GAE/g for the concentrations of 50 and 200μg/ml respectively.

In this research work, the antioxidant potential of the MR extract was determined by using DPPH free radicals scavenging method and BHT was used as a standard. The DPPH is a stable freeradical which has a colour of purple, as the antioxidants react with the DPPH, the DPPH will be converted into non-radical DPPH-H form. Besides that, the colour of the DPPH will be decolorized from purple to light yellow colour. The degree of decolorization indicates the potency of the plant extracts in scavenging the free radicals. According to the results obtained, the IC50 was calculated for the BHT. The antibacterial activity of MR was tested by using the Escherichia coli, Staphylococcus aureus, Salmonella typhi, and Bacillus subtilis. The extract concentrations used in the agar well diffusion method were 0.1, 0.2, 0.4, 0.6, 0.8 and 1.0 mg/ml, other than that, 5mg/ml of penicillin and ciprofloxacin was playing the role as a standard in this study. In the present study, there was no zone of inhibition observed in all concentrations of ethanolic MR extract. The microorganism used were all in active condition, this can be proven as the ciprofloxacin as well as penicillin showed a clear zone of inhibition. In addition, the bacteria strains utilized were susceptible towards MR as stated [15-20], therefore it was concluded that the extracts have no antibacterial activity at the concentration of 0.1, 0.2, 0.4, 0.6, 0.8 and 1.0 mg/ml against gram negative. In the case of MIC test, the plant extract with the concentration of 0.1, 0.2, 0.4, 0.6, 0.8 and 1.0 mg/ml were utilized.

Conclusion

In conclusion, the phytochemical screening of ethanolic extracts of MR had determined the presence of alkaloids, flavonoids, carbohydrates and anthraquinones. The antibacterial activity of MR was determined by using the agar well diffusion and MIC assay. The micro-organism used were Escherichia coli, Staphylococcus aureus, Salmonella typhi, and Bacillus subtilis. There was no antibacterial activity observed in the agar well diffusion with Escherichia coli and the MIC assay [21-29]. The antioxidant activity of the plant extract was assessed through the method of DPPH test while the total amount of phenolic compounds in the extract can be determined through the TPC test. It was suggested that MR can be a potential source as a natural significant antioxidant and less marked antimicrobial agent. The MR is a natural source that worth for further explore as it is inexpensive, natural, harmless and easy to obtain.

Interests of Conflict

The authors declare that there is no conflict of interests in the present publication.

For More Articles: Biomedical Journal Impact Factor: https://biomedres.us

Journals on Gynecology

Remote Monitoring of the Health Status of Pregnant Women at Risk for Preeclampsia

The Role of Remote Technologies in the Quality Management System and Safety of Medical Care

On April 26, 2021, Deputy Chairman of the State Duma Irina Yarovaya at a meeting of the Presidium of the Council of Legislators of the Russian Federation under the Federal Assembly of the Russian Federation called for simplifying the exchange of data between medical institutions and patients. In the Sverdlovsk region, an automated information system of mobile notifications “AIST_SMART” for pregnant patients and doctors began to operate. Using a smartphone or, say, a tablet, pregnant patients in their personal account get the opportunity to keep an electronic diary of self-control of their health. The diary has the functions of automatic interpretation of the results and the formation of signal information for the obstetrician-gynecologist. Now pregnant women do not need to fill out paper diaries of self-control (Figure 1), call their doctor or the reception of the antenatal clinic in order to report the results – the process is fully automated.

The women’s consultation received an IT tool for remote interaction with pregnant women and women in child child. The introduction of “AIST_SMART” technologies made it possible to replace paper diaries with electronic ones. Medical data of the patient are collected in a single database and allow you to track the dynamics of the patient’s health around the clock. The results of electronic diaries are automatically processed by the system and if no abnormalities are detected, the data is simply recorded in the system and does not disturb the doctor (Figures 2 & 3). In case of detection of deviations in the patient’s state of health, the system marks the identified deviations and sends a notification to the doctor about the current state (Figure 4). Mobile notifications instantly convey accurate and detailed information about the patient’s state of health and thus contribute to the timely decision to hospitalize in case of detection of preeclampsia / severe arterial hypertension. Remote health monitoring functions as follows.

biomedres-openaccess-journal-bjstr

Figure 1: Paper diary – as it WAS.

biomedres-openaccess-journal-bjstr

Figure 2: Data of the diary of self-control of blood pressure, the norm.

Registration in the System “AIST_SMART”

To register the patient in the personal account at the initial appointment of a pregnant patient, a consent-instruction [1] is issued to connect to the mobile service “AIST_SMART” with an individual QR code. At home, the patient reads the QR code using the camera of her smartphone or tablet and, according to the instructions, undergoes the registration procedure, forming a digital four-digit PIN-code. From now on, it is guaranteed 24/7 technical support. The QR code serves as the patient’s identifier and the link between her electronic medical record (EHR) in the AIST “RAM” and the personal account in the “AIST_SMART” system. To register a doctor in your personal account, you must log in to the medical information system – AIST “RAM”, in which all medical personnel of the obstetric service in the region work. Open the “Personal Account” tab and register by scanning an individual QR code. So, in order to access electronic self-control diaries, the doctor and the patient connect to the AIST_SMART service, and after registering in the system, notifications about the results of remote health monitoring will be received on their mobile device. The doctor does not need to call on the phone to find out how she feels, what her blood pressure, temperature, etc.

How the Mobile Alert System Works

Formation of Notification of the Result of Self-Control Diaries

This process is fully automated. AIST_SMART performs the role of an intellectual assistant to the obstetrician-gynecologist/ midwife. The patient fills in the diary data, and the doctor receives ready-made results with automatic interpretation. Now the patient will not forget her paper diary at home, and the doctor will be able to make decisions on the tactics of management, taking into account not only the data on a face-to-face visit, but comprehensively taking into account the results of the patient’s home self-control, which is important when selecting antihypertensive therapy in patients with arterial hypertension.

Pregnancy with Arterial Hypertension and at Risk for Preeclampsia

All patients in this category should carry out home monitoring of blood pressure with keeping a diary [2]. The self-control diary can be kept both by filling out the extended web-form of the diary, and by means of a chatbot in AIST_SMART, where the patient can send data in the format of a simple message: “pressure 120 70” and the service automatically recognizes, processes the data and records them in her personal account. If deviations of blood pressure above the norm are detected, AIST_SMART will automatically offer the patient a further algorithm of actions:

Indicate Complaints and the Presence of Proteinuria According to the Results of the Test Strip (Figure 5)

Emergency Hospitalization without Further Action is Recommended (Figure 6)

All notifications in case of deviations are automatically sent to the attending physician and the doctor in the Obstetric Remote Consultation Center (hereinafter referred to as the ADCC) for the routing of the patient 24/7. Doctor of the ADC on the basis of the results of the self-control diary (Figure 7) and obstetric status according to the data in the electronic medical record (hereinafter – EHR) in the AIST “RAM”, where there is information about all the results of the examination, the course of pregnancy and diagnoses, decides on further management tactics: to continue outpatient treatment or hospitalization in an obstetric hospital. The ADCC doctor fixes his decision in the EHR, making out a remote consultation for the attending physician of the antenatal clinic or obstetric hospital, if the patient is hospitalized in the MO level 1.2.

In the absence of indications for hospitalization, the results of the remote consultation are sent automatically to the attending physician of the antenatal clinic. Subsequently, the attending physician within the framework of the next outpatient visit will be able to track the patient’s condition, the effectiveness of the prescribed antihypertensive therapy, viewing trends in diaries, and adjust the therapy based on a comprehensive analysis. If a decision is made on the need for hospitalization, the doctor of the ADC through a confidential “working” chat in AIST_SMART can contact the patient and clarify her consent to hospitalization and the possibility of transportation by personal transport. If consent is obtained (Figure 8), the doctor of the ADCC draws up an add. The patient receives a notification about the issued referral indicating the obstetric hospital, the date and time of hospitalization (Figure 9). In turn, the doctor of the obstetric hospital also receives information that the patient is sent to him both through the AIST “RAM” (Figure 10) and in the personal account of AIST_SMART through automatic notifications in the directions (Figures 9&10).

You do not Need to Receive a Paper Direction

If necessary, you can print the direction at the place of treatment of the patient, using a single information space of the regional obstetric monitoring of AIST “RAM”. All the directions that a woman received during pregnancy are reflected in her personal account in the “My directions” section. The patient can open any document, even if the connection with the Internet has disappeared.

Advantages of Remote Monitoring of Health

The transition to electronic diaries of self-control allows you to identify complications of the gestational process in the case of arterial hypertension and timely send the patient to hospitalization to prevent adverse events, which is from the main directions of the quality management system and safety of medical care. AIST_ SMART allows you to create constant feedback with the patient and thereby form a patient-centric model of care as one of the priority areas for the development of modern medicine and healthcare in general. All of the above increases the compliance of doctor-patient interaction and directly affects the quality and safety of medical care in the context of the widespread prevalence of arterial hypertension in the population (pregnant women are no exception), which meets modern needs of society and solves the tasks set by the Government of the Russian Federation in the field of digitalization of healthcare [3-5].

Conflict of Interest

No conflict of interest with any institution/organization.

For More Articles: Biomedical Journal Impact Factor: https://biomedres.us

Journals on Surgery

Level of Activity Limitation Due to Joints Pain among Hemophilia Patients

Introduction

Hemophilia is an inherited type of disease in which clotting factor VIII cannot produce properly in the body. These diseases can lead to prolonged bleeding after injury or surgery and sometimes bleeding in the joint [1]. The first time hemophilia was discovered in the 2nd century AD and a full description of hemophilia was written in the 19thcentury.The ant hemophilic factor was discovered in the middle of 20 century [2]. Approximately 40,000 peoples are affected by hemophilia worldwide and it is the most complicated disease in the world [3]. Hemophilia is the type of X-linked group disease in which blood coagulation factor VIII cannot produce. Based on clotting factor hemophilia has two types. The deficiency of clotting factor VIII is called hemophilia A and the deficiency of clotting factor IX is also called hemophilia B [4]. Hemophilia A is the most common genetic disorder about 80 % of people have hemophilia A in the overall population of hemophilia diseases. The prevalence of hemophilia A (HA) 1 per 5000 in the general population and the prevalence of hemophilia B (HB) is 1 per 30,000 in overall general papulation .Hemophilia is mainly present in the male population .on based on coagulation factor activity hemophilia is also divided into three further groups .Clotting activity less than 1 percent is severe if 1-5 % is moderate and if clotting greater than 5-30 %. The intensity of bleeding is depending on hemophilia severity. If the intensity of hemophilia is severe, the spontaneous bleeding occurs in soft tissues, joints, nose, and other parts of the body, and if the intensity of diseases is moderate or mild the prolonged bleeding occurs after injury or surgery [5].
Bleeding in joints is more common in hemophilia patients due to a lack of clotting factors. The bleeding in the joint produces more complications in joint. Inflammatory reactions start due to hem arthrosis. Hemophilic arthropathy starts due to repeated episodes of bleeding in joints. The inflammation of the synovial membrane in a joint can lead to a breakdown of articular cartilage of the joint. The articular breakdown starts in early childhood in hemophilic patients. Chronic pain starts in hemophilic joints due to the breakdown of articular cartilage. Chronic hemophilic arthropathy can various effects on bone health, it can cause chronic pain in joints, swelling, limit the daily activities of life, decrease the range of motion of joints and also decrease the quality of life in hemophilic patients. The most common joints which are affected by hemophilia are ankle, knee, hip, elbow, and shoulder joints. There are usually weight-bearing joints that have a bad impact on physical movements. The bleeding the joints cause hypertrophy of physics which lead to valgus deformity in hemophilia patient [6].
Joint illness linked with recurrent joint bleeding causes discomfort and functional impairment in people with hemophilia (PWH) (hemarthroses). Discomfort is common in PWH, according to many studies [7,8] and pain associated with hemophilia has been linked to a worse health-related quality of life (HRQoL). PWH also has mental health problems [9,10]. According to the EQ-5D- 3L, depression affects around one-third of PWH, and the Patient Health Questionnaire (PHQ-9), a scale used to evaluate the severity of depressive symptoms in adults, 37 percent of PWH fulfilled the criteria for depression in another research [11]. The influence of hemophilia on emotional well-being, like other elements of HRQoL, is rarely studied in the therapeutic context. In the comprehensive care environment or to individualize hemophilia therapy, neither general nor disease-specific patient-reported outcome (PRO) tools are routinely employed [12]. Greater expertise with and validation of PRO instruments in PWH may expand their usage for clinical outcome monitoring, as well as provide possibilities to improve patient dialog and treatment of specific outcomes.
The repeated episode of bleeding in joints can start the inflammatory reaction in joints. This inflammatory reaction starts the breakdown process in joints. The breakdown has a serious impact on bone and joint health it can lead to osteoporosis of bone, articular cartilage damage, and bony osteophytes formation in joints, decrease the range of motion of joints and also decrease the daily activity of life. Hemophilia patients have a great risk of depression. The main reason for depression in hemophilia patients is a decrease in the activity of life [13]. Swelling, heat, and immobility are all symptoms of joint bleeding. Furthermore, acute bleeding produces significant discomfort in the affected joint, a symptom that has received little attention in prior research. The bulk of studies in this area focused on the management of pain in general and the use of analgesics [14]. The hemophilia patient faced many psychosocial problems. This problem related to their education and jobs and is also a problem for the caregiver of children with hemophilia and barrier for happy living the people with hemophilia because they cannot perform the daily activity due to pain in joints and difficulty to concentrate his work [15].
Recurrent bleeding, in addition to the acute discomfort, triggers a persistent process that results in synovitis, increased cartilage degradation, and bone deterioration, eventually leading to hemophilic arthropathy. Despite the existence of numerous potential pathophysiological ideas, the actual underlying processes for either blood-induced arthropathy or, more specifically, joint bleedinginduced pain are yet unknown. Similar to other inflammatory joint diseases, the associated inflammatory response might be addressed as one possible source of pain complaints [16,17]. All of these mechanisms, on the other hand, contribute to hemophilia’s reported joint discomfort. As a result, current research is focusing on the causes and effects of persistent pain caused by hemophilic arthropathy. Because pain therapy is often ineffective, and many analgesic and anti-inflammatory medications are prohibited due to their clotting-inhibitory effects, a deeper pathophysiology understanding of pain in persons with hemophilia (PWH) is vitally necessary [18]. Hemophilic patients faced many problems in our society. They face social, mental, and physical problems. The reason for study in hemophilia to find out the activity limitation due to pain or hemarthrosis.

Literature Review

J Michael soucie (2015) et al. Conduct a cross-sectional study in a hemophilic treatment center in the USA. The study sample size was 4343 males aged 2-19 years with hemophilia diseases. They collect the data to assess the joint range of motion. They concluded that the range of motion limitation in hemophilia patients depends on the severity of disease and damage of articular cartilage due to bleeding in joints [19]. M. Witkop (2017) et al. Purpose a crosssectional study to find the prevalence and joint pain due to bleeding joint in people with hemophilia. Their study sample size was 381 whose age is middle to 37. They found that 71 % of people have a severe type of hemophilia and pain in the joint more common the people with hemophilia. In this study, they concluded that the functional activity limitation and quality of life decrease in people with hemophilia are due to chronic pain in the joint [7]. Tyler and W Buckner (2018) conducted a study in which they find the prevalence of functional limitation or living quality in hemophilia patients. The study sample size was 381 adult patients with hemophilia whose age was medial to 34 old. They use the visual analogs scale and brief pain inventory v2 short form to collect the data. They found that patients present severe pain in joints and functional limitation and also decrease the quality of life due to pain in joints. They concluded that early asses of joints bleeding and proper history improve the quality 0f life and activity of daily life [20]. Heng Zhang (2019) et al purpose a cohort study in China to identify the health-related quality of life in children. The study sample size was 42 children and the data was collected from kid’s life assessment tools. The conclusion of that study was health-related quality of life decrease in the children with hemophilia which depend on the severity of hemophilia or joint bleeding and bleeding joint decrease the activity of limitation [21].
MjidDavari and Zahra Gheribnaseri (2019) et al. conducted a cross-sectional study to determine the joints health status and living quality in hemophilia patients. The data was collected from the HR-QO2 questioner and joint health is to collect from hemophilic joint health score the study sample size was 38 people with hemophilia. They concluded that health-related quality of life in hemophilia patients was very low and many joints problems are found due to bleeding in joints [22]. Merel A and timmer (2020) purpose a study to determine the movement or behavior pattern in hemophilia patients. The study sample size was 107 people who have hemophilia. They collect the data from the Kruskal wall test and HJHS TOOLS. They found that runner and bike person with hemophilia is a few limitations in their life and they also concluded that sitting or standing was better for joint health [23]. In 2019 Dr. Edward Nguyo Maina purpose a cross-sectional study to find the prevalence of musculoskeletal problems in people with hemophilia. His study sample size was 37 people with hemophilia. He was data collected from the gilbert joint scoring system. He found that 86.5 % recurrent bleeding in joint, 75.7% of people have limited range of motion, and 70% have flexion contracture formation in joint with hemophilia. They found that musculoskeletal problems was linked with the severity of diseases [24].

Objective

The objective of this study was to determine the: “Level of activity limitation due to joint pain among hemophilia patients.”

Rationale

Hemophilia causes activity limitation or other health disorders in children. The Research gap exist to determine the level of activity limitation occur in hemophilia patients due to pain in joints. This study may also helpful for physiotherapy field to find the best physiotherapy treatment for hemophilia patients regarding their activity limitation. The main rationale of my study to find advance prevention and eliminates the activity limitation risk factor in further studies.

Operational Definitions

Outcome measure tools that was used in the study is Activilm Questionnaire.
The ACTIVILM Questionnaire focus on assessing the basic knowledge of activity limitation by different question their correct answer [25].
Variables:
a) Dependent variable: Activity limitation & pain
b) Independent variable: Hemophilia patient are independent variable.
Value of sensitivity/ specificity/validity/ reliability=0.95.

Materials and Methods

A. Study Design: Design of study was Cross-Sectional.
B. Study Settings: Data for this research was gathered from hemophilic center in Lahore.
C. Duration of Study: 06 months.
D. Sample Size: Sample size is calculated using following formula and parameters.

Here Z 1−α/2 = is standard normal variate (at 5% type 1 error (P<0.05) it is 1.96 and at 1% type 1 error (P<0.01) it is 2.58). As a majority of studies P values are considered significant below 0.05 hence 1.96 is used in formula.
p = Expected proportion in population based on previous studies or pilot studies.
d= Absolute error or precision − Has to be decide by researcher Using 75.7% proportion of the condition sample size is 152 (Table 1).

biomedres-openaccess-journal-bjstr

Table 1: Antibody characterics used for immunohistochemistry.

Nguyo, E.M., Prevalence of musculoskeletal complications among hemophilia patients as seen at Kenyatta National Hospital. 2020, University of Nairobi.

E. Sample Technique: Non-probability convenient sampling was used.
F. Criteria of Sample Selection:
a) Inclusion Criteria:
i. Hemophilia patients.
ii. Age between 5-19 years.
b) Exclusion Criteria: The people who have joint bleeding due to hematoma or other joint disorder such as juvenile arthritis.

Data Collection Procedure

The data was collected after approval from the ethical board of concerned institute. The study design for the study was a descriptive cross-sectional study. The data collected from only people with hemophilia diseases. A convenience non-probability is used as a sampling technique for a minimum sample size of 152 and father data was added according to study requirement to minimum choice of error. The duration of the study was of 6 months and eligibility criteria for participants include volunteers. The data was collected from the ACTIVLIM questionnaire that including the activity limitation assessment and knowledge. The data was collected in the different hemophilic centers in Lahore city. The data collected in the form of a hard copy. And distribute to hemophilia patients. Hemophilia patient was filled the form.

Ethical Consideration

The data was collected after the approval of the ethical board. The participant was provided with information regarding the study and informed consent was signed by the participant. Volunteers were preferred. The identity of participants kept confidential and the participant was allowed to withdraw from the study.

Statistical Analysis

Data was analyzed by using SPSS software for the questionnaire.

Results

a) Among 152 participants, male were 146(96.1%) and female were 6(3.9%) ( Figure 1).

biomedres-openaccess-journal-bjstr

Figure 1: Frequency distribution of Difficulty in gender.

Discussion

A study conducted by Buckner, Tyler Win 2018, Study aimed to determine the Assessments of pain, functional impairment, anxiety and depression in US adults with hemophilia. According to this study, participants reported feeling tired (93 percent), worn out (86 percent), very nervous (68 percent), downhearted and depressed (55 percent) and so down in the dumps that nothing could cheer them up (41 percent). According to our study Among 152 participants, male were 146(96.1%) and female were 6(3.9%). Putting on a T Shirt was difficult among 27(17.8%) and Easy among 125(82.2%).Washing ones upper body was difficult among 35(23.0%) and Easy among 117(77.0%).Dressing ones lower body was difficult among 83(54.6%) and Easy among 69(45.4%). Taking a Shower was Impossible among 2(1.3%), difficult among 87(57.2%) and Easy among 63(45.4%).Sitting on the toilet was Impossible among 12(7.9%), difficult among 91(59.9%) and Easy among 49(32.2%).Taking a bath was Impossible among 4(2.6%), difficult among 85(55.9%) and Easy among 63(41.4%) [25].
A study revealed patient was unable to perform the activity, or need complete assistance to perform the activity like transfers/ squatting and running. Some need partial assistance/aids/ modified instruments/modified environment to perform the activity like eating, bathing, dressing going up a stairs, walking running. The other group able to perform the activities without aids or assistance, but with slight discomfort, unable to perform the activities similar to their healthy peers like eating, bathing, dressing going up a stairs, walking and running. A few subjects were able to perform the activities without any difficulty similar to their healthy peer. According to our study among 152 participants, walking upstairs was Impossible among 9(5.9%), difficult among 96(63.2%) and Easy among 47(30.9%). Stepping out of a bath tub was impossible among 1(0.7%), difficult among 53(34.9%) and Easy among 98(64.5%).Opening a door was difficult among 12(7.9%) and Easy among 140(92.1%).Walking outdoor on level ground was Impossible among 4(2.6%), difficult among 52(34.2%) and Easy among 96(63.2%). Washing ones face was difficult among 25(16.4%) and Easy among 127(83.6%). Hanging up a jacket on a hat stand was difficult among 67(44.1%) and Easy among 85(55.9%). Wiping ones upper body was Impossible among 1(0.7%), difficult among 52(34.2%) and Easy among 99(65.1%). walking upstairs was Impossible among 6(3.9%), difficult among 134(88.2%) and Easy among 12(7.9%) [26].
According to another study knees (23.7 percent), elbows (23.7 percent) and ankles (37.4 percent) were the most often reported sore joints (18.9 percent) among hemophilia patients. On the International Physical Activity Questionnaire, 51% said they had done nothing in the previous week. The median sub scores for four physical health domains were lower than the median sub scores for four mental health domains on the SF-36v2 health survey. Leg functions (median, 66.7) and lying/sitting/kneeling/standing (median, 67.5) were the most impacted Hemophilia Activities List domains (range 0 (worst)-100 (best)), whereas self-care was the least impacted (median, 100.0). Ankle scores (median, 6.0; range, 0-40) on the HJHS were lower than elbow/knee scores (median, 4.0/4.0).and according to our study Among 152 participants, Carrying a heavy load was Impossible among 13(8.6%), difficult among 133(87.5%) and Easy among 6(3.9%). Getting in to a car was difficult among 24(15.8%) and Easy among 128(84.2%). Standing for a long time was Impossible among 12(7.9%), difficult among 117(77.0%) and Easy among 23(15.1%). Walking more than 1 km was Impossible among 23(15.1%), difficult among 117(77.0%) and Easy among 12(7.9%). Closing a door was difficult among 8(5.3%) and Easy among 144(94.7%). Hopping on one foot was Impossible among 5(3.3%), difficult among 97(63.8%) and Easy among 50(32.9%). Putting on a backpack was Impossible among 3(2.0%), difficult among 105(69.1%) and Easy among 44(28.9%). Running was Impossible among 17(11.2%), difficult among 134(88.2%) and Easy among 1(0.7%) [27].

Conclusion

Pain was observed most common problem that affected daily activities and quality of life among hemophilia patients. Respondents reported functional impairment that limit the daily routine work and activities they participated in especially with activities involving the lower extremities.

Limitations

a) Due to low population of hemophilia so data collection took time.
b) The data was collected from single hemophilia center in Lahore.
c) Difficulties in collection of data because of Covid-19.

Recommendation

a) Study should be analyzed through clinical analysis in future.
b) Seminars can be conducted to spread the awareness among patients.
c) Longitudinal study should be conducted to evaluate the long term effects of hemophilia on joint pain.
d) The data should be collected from all over hemophilia treatment centers of Pakistan.

For More Articles: Biomedical Journal Impact Factor: https://biomedres.us

Open Access Journals on Biology

Health Risks of Simulium (Boophthora) erythrocephalum (De Geer, 1776) in the Valencian Autonomous Region, Eastern Spain

Introduction

Black flies (Diptera: Simuliidae) constitute a harmful group of arthropods due to their bites, allergic reactions, and parasitic diseases. In some places, such as Spain, they do not act as disease transmitters, though it is important not to forget their vector role in the transmission of the parasitic agent triggering human onchocerciasis. Climate change and global warming can contribute to the displacement of Simuliidae from their endemic places (Central Africa, South America, Central America, and Yemen) to the European continent. Simulium erythrocephalum (De Geer, 1776) is significant because of its possible action as a vector vehicle and transmitter of disease-causing agents, and because it is a telmophagus insect that lacerates the skin and blood capillaries. In addition, it inoculates saliva whose anesthetic, vasodilator, anticoagulant, and antithrombin substances prevent the host from perceiving the pain of the bite, prevent blood clotting and contribute to increased blood flow in the area, facilitating its intake [1-3]. These components can cause allergic reactions such as dermatitis (which can persist for several days), poisoning such as simuliotoxicosis [4,5], and even asphyxia due to airway obstruction [6]. This species can cause “Black Fly Fever”, a medically recognized syndrome consisting of headache, feverish sweating, chills, swollen lymph glands, joint pain, nausea, lack of energy, laziness, feeling tired and psychological depression [7]. These symptoms are due to the reaction to compounds secreted by the salivary glands [8]. This syndrome can have a significant economic impact due to sick leave, disability compensation, prolonged treatment, hospitalization, and even job loss [7]. The bites of this species can cause intoxication of the blood flow, the symptoms of which consist of accelerated circulation, dyspnea, hyperthermia, hypothermia, nervous disorders and, in extreme cases, death [9].

However, they not only affect man directly but also indirectly, negatively impacting tourist and recreational activities located in rivers and nearby areas, creating economic losses in the tourism sector [1,5]. Therefore, suffering the bites of these Diptera is a brake on the well-being of people and their sources of economic livelihood. Historically, the study of these nematocerous dipterans in Spain was not approached from a health perspective, due to the low significance of their bites in the past. However, from 1995 to the present, the situation has changed considerably. This dipteran is acquiring great relevance in certain regions of the national territory, among which the Valencian Autonomous Region stands out [10,11] where they are colonizing river basins and water channels due to the improvement of the water quality of the rivers, the expansion of the distribution area of plant species used by larvae and pupae as adhesion support, and by the effects on local climatology due to climate change and global warming. All these causes are favoring the increase in simuliid populations, their dispersal, settlement, and colonization in areas where their presence was not perceived in the past. These factors are leading to an exponential increase in the nuisance to human populations close to the breeding, growth, and development areas of the flies. Females of S. erythrocephalum cause discomfort to humans both in Spain [3,12-15] and European countries [16-18]. The simultaneous hatching of adults raises the population level to the status of a plague, causing outbreaks such as those that occurred in the Danube [7] and Ebro [19,20] rivers. Indeed, evidence shows that on certain occasions, administrations have had to resort to the mechanical removal of hydrophytes and helophytes from riverbeds manually or with the aid of an amphibious vehicle to reduce the populations of S. erythrocephalum and other hematophagous species. Land and air treatments with formulations based on the use of Bacillus thuringiensis variety israeliensis have been used in areas that required it, such as La Ribera (Figure 1). Of this species, its anthropophilic preference is recognized [18,21], as well as the tendency of females to form swarms and attack in masse [18]. For these reasons, S. erythrocephalum can act as a potential transmitter of Onchocerca volvulus in Europe. In fact, laboratory studies have already shown that it is a competent vector for the transmission of this filaria [22].

The main objective of this work focused on knowing the distribution of S. erythrocephalum, and on graphically representing the range of air displacement of adults and the municipalities subject to their range of displacement, to highlight the localities whose citizens are at low risk of being bitten. In this regard, it should be noted that the Valencian health system is organized in 24 public health departments (PHD) according to DECREE 205/2018, of November 16, of the Consell, which approved the health map of the Valencian Autonomous Region. These departments are equivalent to the health areas contained in the General Health Law (14/1986 of April 25). The health departments are the fundamental structures of the Valencian health system, being the geographical demarcations into which the territory of the Valencian Autonomous Region is divided for health purposes.

Materials and Methods

From 2013 to the present, a field study has been carried out in which samples were taken from the 14 hydrographic basins and their main tributaries that flow through the Valencian Autonomous Region: Cenia, Cérvol, and Mijares in the province of Castellón; Palancia, Turia, Júcar, and Serpis in the province of Valencia; and Girona, Jalón, Algar, Amadorio, Monnegre, Vinalopó, and Segura in the province of Alicante. For this, a direct sampling was used in each of the points studied, which consisted of an active search for 15 min to detect the presence of the black fly in any substrate of the river. The environmental and physicochemical parameters of the water were also georeferenced and measured. Subsequently, the collected preimaginal individuals were transported under refrigerated conditions to the laboratory where they were processed. Subsequently, taxonomics were identified and classified using dichotomous keys [23,24] and a Leica brand MZ APO stereoscopic microscope assisted with a Leica brand model CLS 100 X cold light source as described in [14,25]. Ultimately, the classified specimens were deposited in the Entomology Collection of the University of Valencia (General Study). Finally, a geographic information system (GIS) was used to prepare the risk map. In addition, note that the bite data provided by the Conselleria de Sanitat Universal i Salut Pública of the Generalitat Valenciana were analyzed using ArcMapTM, ESRI’s ArcGIS® software. Through this program, the cartography referring to the DPH of the Valencian Autonomous Region was elaborated, as well as the relation of the population density and incidence of stings by municipality based on the flight range of the adults represented by buffers. To obtain these results, cartography in vector format provided by the National Center for Geographic Information was used regarding the geographic location of the population areas and the delimitation of the municipal boundaries. The information regarding population density was obtained from the municipal data bank of the ARGOS information portal of the Generalitat Valenciana. The integration of all these factors, providing them with a range of color, allows us to observe the differences in incidences in the studied area.

biomedres-openaccess-journal-bjstr
Figure 1: Departments of Health affected, breeding sites, and flight ranges of S. erythrocephalum.

Results

Of the 137 samplings carried out in the study area, the presence of S. erythrocephalum was verified in four sampling stations. Two were located in the middle (SER1) and upper (SER2) section of the Serpis river, and the other two were in the lower section of the Júcar river basin, one in its tributary the Albaida river (JUR1) and another in the insertion from another of its tributaries, the Magro River (JUR2) (Figure 2). From these breeding areas, and knowing that the flight range of the adults of this species is between 20 and 30 km [7, 8,17], three zones of influence were configured around each of the points where the identified species were found.In the maps, a maximum distance of 15 km was considered as the furthest dispersion range. This decision was made considering that some authors confirmed females of the species traveling up to 5 km in search of hosts from which to obtain blood [19]. At greater distances, it is assumed that the females tend to reduce their movements and therefore their bites, although they are capable of traveling greater distances if required (Figure 2). In this manner, three risk zones were delimited around each of the points where the presence of the species was corroborated. The first zone, with a radius of 5 km, is represented in maroon and indicative of high risk; the second, with a 10-km radius, is represented in orange and indicative of medium risk. The third zone, with a 15-km radius, is represented in yellow and indicative of low risk.

biomedres-openaccess-journal-bjstr

Figure 2: Risk map according to the flight range of S. erythrocephalum females, and information regarding the positive sampling points. SER1 (Villalonga, province of Valencia, 96 meter (m) altitude, 37.6% relative humidity, 17.9°C, coordinates N 38° 52′ 54.7ʺ W 00° 14′ 12.6ʺ), SER2 (Cocentaina, province of Alicante, 372 m altitude, 21% relative humidity, 15.3°C, coordinates N 38° 45′ 10.2ʺ W 00º 25′ 29.8ʺ), JUR1 (Genovés, province of Valencia, 88 m altitude, 79.3% relative humidity, 14.3ºC, coordinates N 38° 59′ 6.2ʺ W 00º 29′ 6.0ʺ) and JUR2 (Algemesí, province of Valencia, −7 m altitude, 64.4 % relative humidity, 31.2°C, coordinates N 39° 11′ 12.7ʺ W 00° 24′ 39.4

The variable population density of the municipalities located in any of the three risk areas varies between 2 and 4,039 inhabitants/ km2, which means that the risk reaches different magnitudes between localities that are under the influence of the same risk area. The measure of the population density of the municipalities involved is provided in quintiles according to the number of inhabitants per km2 (Figure 3a). This population density can affect the behavior of the females of the species, inciting them to move to a greater or lesser distance in search of their mandatory nutritional requirement. In this way, females of the four populations detected may exhibit different displacement behaviors. As mentioned, the location of the urban nuclei of the municipalities can mark the pattern of flight distance exhibited by the females of S. erythrocephalum. Therefore, it can be seen that municipalities with a lower population density (0–25 and 25–79) are at low risk (yellow halo, 10 to 15 km), while municipalities with a medium population density (79–206 and 206–894) are in greater numbers and intermediate risk (orange halo from 5 to 10 km). Finally, most of the municipalities with the highest population density (894–12,592) fall within the low-risk halo (15 km away from the breeding place), although they also represent the largest number of municipalities located at high risk (red halo 0 to 5 km) (Figure 3b). Therefore, although a priori it would be expected that the closer the municipality is to the breeding place the greater the number of recorded bites, the data show that these occur more frequently in population centers with the highest density of inhabitants per km2. This conclusion is met repeatedly throughout the twelve months of the four years studied (2015, 2016, 2017, and 2018) without major alterations. In addition, the General Directorate of Public Health and the Valencian Autonomous Region Health Department were contacted to collect data regarding the number of citizens treated in health centers and hospitals as a result of bites caused by insects. The results of interest provided were relevant. Similarly, significant conclusions are provided when analyzing data provided on the number of consultations attended for insect bites during the years 2015, 2016, 2017, and 2018 of the seven health departments involved (PHD9 Valencia-Hospital General, PHD11 La Ribera, PHD12 Gandía, PHD13 Dénia, PHD14 Xàtiva-Ontinyent, PHD15 Alcoi, PHD17 Alicante-San Juan), whose domains coincide with the flight areas specified in the four breeding foci (Figure 1).

biomedres-openaccess-journal-bjstr

Figure 3: a) Total number of bites by municipality considering population density. b) Situation of the municipalities with respect to the flight ranges of S. erythrocephalum and incidence of bites by municipality.

In the first place, and as a consequence of the proximity between the health departments and the breeding centers of S. erythrocephalum, it is assumed that the consultations of citizens affected by insect bites were due to the eating habits of this family of Diptera. Second, and considering the data provided from the records of the 12 months of the last 4 years by the aforementioned health departments, it is corroborated that the number of cases treated for bites has increased in general from 2015 to 2018 (Figure 4). Although most health departments experienced a notable increase in the numbers of patients requiring medical care, in others, there has been a decrease. For example, PHD10 declined from 117 medical assistances in July 2015 to 95 in July 2017. PHD13 reduced from 188 in August 2015 to 111 in July 2018; and PHD12, with 2,233 consultations in August 2015, lowered to 1,360 in the same month of 2018. Likewise, and jointly analyzing the computation of PHD care, a general trend of an increasing the number of cases is observed year after year (Figure 5a & 5b).

biomedres-openaccess-journal-bjstr

Figure 4: Number of cases of bites treated in health departments of the Valencian Autonomous Region close to breeding sites of S. erythrocephalum.

biomedres-openaccess-journal-bjstr

Figure 5: Total number of bite cases treated during the years 2015, 2016, 2017, and 2018 in health departments of the Valencian Autonomous Region close to S. erythrocephalum breeding sites. a) stings per year; and b) stings per month.

Lastly, it is found that the months in which the highest number of cases have been registered coincide with the annual seasons with favorable physicochemical characteristics for the reproduction, development, and growth of this species. The highest peaks are in the months of June, July, and August and, eventually, in September and October (Table 1). However, analyzing the sum of the data for each year, the months in which the most cases were registered were August 2015 and 2016, and July in 2017 and 2018. Although it is still necessary to deepen the study of the bioecology of this species of sanitary importance, the results of this work reveal the need to consider the ethology of this dipteran when implementing surveillance and control plans to reduce its effects on citizen health.

biomedres-openaccess-journal-bjstr

Table 1: Months in which the highest number of health care for bites has been registered.

Discussion

The presence of S. erythrocephalum in the studied areas, together with the proximity of urban centers along the indicated river channels, entails an incidence on humans. The incidence of bites has increased in recent years in the Valencian Autonomous Region, which has taken measures to reduce its repercussions [10,11, 14]. This same effect is reflected in other areas of Spain, such as the Aragonese Autonomous Region [26]. In this work, the risk areas to which the municipalities are subjected are identified, establishing different ranges based on distances and population densities. In this regard, it is not possible to correlate these data with other data from Spain given the lack of knowledge of it.

In conclusion, and in clear harmony with other authors [16,17,19], it is stated that S. erythrocephalum is one of the simuliid species with the greatest impact on the human population. Fortunately, its current vector potential in Spain is zero. As a result of all the above, it is necessary to acquire a global and integrative perspective to understand the phenological, ethological, and bioecological dynamics of this species. This knowledge facilitates implementation of both the necessary surveillance strategies and the most effective and appropriate control actions in each case as quickly as possible. In addition, the growing and numerous citizen complaints, as well as the innumerable medical treatments shown in this article and other regions of the national territory [26], should encourage health professionals to develop a greater knowledge of the characteristics of the pathologies due to this dipteran. This awareness correctly prepares health practitioners to face this type of clinical picture when manifested in citizens and helps predict expected areas of higher incidence resulting from living near the aforementioned hematophagus. Increased knowledge allows for discerning between types of bites of various arthropodsmore specifically, insects-identifying whether they are due to mosquitoes, simuliids, or others. In this way, the data collected in the health consultations of citizens due to these hematophagous and anthropophilic organisms would be of higher quality and reliability, thus being able to infer and analyze these data with greater scientific rigor. Finally, it is necessary to inform and educate the population of how this dipteran can impact their daily life.

Finally, simuliid species with obligate hematophagy of biomedical and veterinary importance [27] such as S. erythrocephalum are generalist species regarding the type of habitat in which they develop, Therefore, these species are capable of tolerating a wide range of ecological conditions. Under this premise and given the current climate change scenario in which certain authors and institutions predict a decrease in coldwater river habitats and greater environmental variability [28], it would be expected that the resulting conditions would favor the distribution and colonization of S. erythrocephalum to new geographic areas, increasing its harm to the well-being of citizens. Therefore, it is recommended to deepen the study of the ecological requirements of the breeding places of black fly species that, like S. erythrocephalum, can be considered a plague negatively affecting public health as a consequence of increased temperatures from climate change [29]. In this way, the knowledge of the bioecology of the species will play a crucial role when it comes to implementing treatment plans for preimaginal states, minimizing the sizes of their populations and reducing their incidences in public health. In the case of S. erythrocephalum, it is important to know that it is a species whose preimaginal development optimum is 20°C, tolerates values higher than 25°C, shows a narrow range of altitudinal tolerance with its optimum around 75 meters above sea level (masl), so that its distribution in the Valencian Autonomous Region is restricted to elevations between 5 and 240 masl [27]. Likewise, some authors ecologically described this species as preferring lentic and warm waters typical of the middle and lower sections of rivers [30].

In addition, the results provided offer useful information on the location of S. erythrocephalum, which will help in the development and execution of surveillance and control programs.

Conclusions

Simulium erythrocephalum is one of the main black fly species that threatens public health in Spain. In recent years, there have been frequent events of massive hatchings of this simuliid, whose nutritional habits have serious repercussions on health care systems. For this reason, it has been pertinent to carry out the present study. This work provides relevant information on the distribution of the species, risk areas, population density, and incidence of bites per municipality according to the flight range of adult specimens, which is useful. The results obtained can be implemented by researchers, public health practitioners, and policy makers as well as companies specializing in the control of noxious species to minimize the magnitude of the problem of black fly bites in the Spanish health system.

For More Articles: Biomedical Journal Impact Factor: https://biomedres.us

Open Access journals on Medicine

Autism Prevalence in New Jersey Correlates with Low Sulfate in Tap Water

Introduction

Autism Spectrum Disorders (ASD) affect social interaction, communication, behavior and the senses. As of 2016, the prevalence was 1 in 54 for the full United States based on data from the Centers for Disease Control and Prevention (CDC). Prevalence in the state of New Jersey was even stronger at 1 in 32, giving New Jersey the highest rate of autism in the country [1]. It is not well understood why this should be true. Reported reasons mention New Jersey’s reputation for good diagnostic services along with a population characterized by high risk factors, including advanced maternal age, elevated premature rates and low birth weights [2]. It is the purpose of our study to introduce another factor, sulfate deficiency during pregnancy and infancy. Toward this end, we calculate sulfate concentrations in local tap water using the New Jersey Drinking Water Watch database. We determine the sulfate content of private well water using Geological Survey Reports and the New Jersey Private Well Water Testing Program. Then, we compare this data with autism prevalence rates for the birth year 2006 from the New Jersey Autism Registry, seeking the strength of correlation. A strong correlation would suggest that ingested sulfate may be a significant factor in the distribution of autism throughout New Jersey. If the correlation is also inverse and sulfate can be shown to be essential for brain development, it would suggest that increasing the sulfate from food and water may reduce the incidence of autism in New Jersey and elsewhere.

Our focus is sulfate, based on our previous study of mothers of children with autism [3]. In that study, 86 mothers were recruited on Facebook and asked to sample the tap water consumed during their pregnancy, which we later analyzed for sulfate. They provided estimates of the types and amounts of tap water, bottled water and beverages they drank while pregnant. Based on US Department of Education public funding records, ASD prevalence rates were calculated for every state. On average, mothers from states with high prevalence submitted tap water with sulfate concentrations measuring much less than from states with low prevalence (28% sulfate, n=45, p=0.059). Considering both water and beverages, daily consumption of sulfate was compared to estimates of autism severity. Linear regression revealed a mild, but clear, inverse correlation between sulfate and severity (correlation r=-0.32, n=86, p<0.01). These results suggest that sulfate may be helpful in reducing both the incidence and severity of autism throughout the United States. And this led to the present investigation of New Jersey, which publishes a wealth of information on autism and public water.

New Jersey Autism Registry

In 2009, New Jersey created the Autism Registry to better serve the needs of children with autism and their families [2]. All children up to 21 years of age, diagnosed with autism and living in New Jersey are required to be registered. Once registered, families are linked to Case Management Services to provide guidance, resources and support. As of the year 2020, over 32,000 children had been included, making this registry the largest in the country. The Autism Registry provides data to the New Jersey Department of Health, enabling a better understanding of ASD [2]. In particular, a graphic is available on their website which presents a map of New Jersey with counties color coded to show relative prevalence. A similar graphic is presented in Figure 1 derived from the New Jersey data. The map strategy focuses on eight-year-old children born in 2006 to best represent a meaningful comparison between counties. New Jersey’s 21 counties are grouped into 5 prevalence ranges which we designate as Zones 1 through 5. Zone 1 includes counties with the lowest prevalence while Zone 5 includes counties with the highest rates of autism. Table 1 tabulates autism prevalence by zone, rate and county, matching that presented graphically in Figure 1. These prevalence rates were obtained from the NJ Autism Registry and are somewhat lower than CDC estimates. This simply reflects a difference in data collection criteria. In our study, we use the NJ Registry percentages to group counties into zones. The populations shown are from the 2010 census to better reflect the 2006 birth year. Throughout our report, we refer to all municipalities as towns, whether or not they are legally incorporated as towns, cities, townships, boroughs, or villages.

Public Tap Water

Approximately 87% of New Jersey households are connected to public water systems [4]. There are over 600 such systems in New Jersey and they publish Consumer Confidence Reports (CCR) every year, most available online. Since we are interested in the sulfate concentrations of such water, it would seem these reports would be an invaluable resource. However, sulfate is not considered a serious contaminant and most CCR reports do not include such data. When sulfate is included, it is usually reported as a maximum value at the highest of all system test points. Since our study is more concerned with average values, isolated maximums are not very helpful. In a more general sense, CCR water quality reports do provide a valuable overview of water systems and can offer insight into systems that rely on multiple water sources. This typically occurs when a community buys surface water to supplement local wells. For detailed data on sulfate, the Drinking Water Watch database is a better resource [5]. It is available on the website of the New Jersey Department of Environmental Protection under the heading of the Division of Water Supply and Geoscience. The Drinking Water Watch main page allows one to enter the Public Water System Identification Number (PWSID) of any water source in the state. The PWSID is a seven digit number preceded by the letters NJ for New Jersey. For instance, the Atlantic City PWSID is NJ0102001 and when accessed, the database returns an Atlantic City index page with resource tabs and the following information: source water type is primarily surface water and the population served is 39,415. Using Atlantic City as an example, a better understanding of the water system can be obtained by clicking the Water Watch index tab System Facilities, then All Facilities. The resulting page describes the system in terms of treatment plant test points (TP) which may monitor any of the following: surface water inputs (IN), well lines (WL), interconnection columns (CC) and the distribution system (DS). For Atlantic City, there is 1 surface water intake and 15 well lines, all monitored by TP001005. To obtain sulfate test data, click the index tab Chemical Results, then By Contaminant Name and choose Sulfate from a list of nearly 200 chemicals. For TP001005, sulfate test info is presented twice yearly for the last 26 years. This is a convenient result since only TP001005 need be considered. In the more general case, 16 different test points may have resulted and data may have been reported less regularly.

Private Well Water

For the 13% of New Jersey households connected to private wells, other sources of information are required. To obtain an estimate of typical sulfate concentrations for wells, we access Geological Survey well reports from the NJ Department of Environmental Protection. In particular, we use GSR 19 for Northern Coastal Plain wells, GSR 35 for the Newark Basin and GSR 39 for the Highlands, Valley & Ridge regions [6]. For counties not included in these reports, we use the Drinking Water Watch database to search small water systems exclusively using wells. From these sources, a sulfate concentration average for wells in each county can be calculated. For instance, Bergen county data was collected from 15 wells included in GSR 35 covering the Newark Basin. The resulting mean sulfate concentration was 35.3mg/L with a standard deviation of +10.3mg/L.

There are approximately 1,143,000 New Jersey residents served by about 400,000 private wells across the state. To estimate the number of private wells per county, we relied on the Private Well Testing Act Program, which requires all property sold in New Jersey since 2002 to file well information [7]. Knowing the number of wells sold in each county allows for the calculation of percentages of New Jersey state totals. Continuing with Bergen county as an example, as of 2014, there have been 2,195 Bergen well properties sold out of 86,765 for the entire state of New Jersey. The Bergen percentage is then 2.53%, indicating approximately 28,918 Bergen residents have access to private well water. Of course, this analysis assumes that private well sales uniformly reflect the underlying inventory of property across the state.

Methods

This study’s most challenging task was the determination of sulfate concentrations in tap water for all of New Jersey, which includes over 600 water systems in 21 counties and 565 towns. As discussed in the Introduction, we obtained information from the Water Watch database, CCR and GSR reports along with the Private Well Testing Act Program. To organize data collection, we created 21 spreadsheets, one for each county. Then using Wikipedia, a list of towns in order of population was generated for each county spreadsheet. Where possible, towns were associated with one or more PWSID water systems and the number of residents served by each was noted. A simplified spreadsheet layout is presented in Table 2 displaying data from Passaic County. Complete spreadsheets for all 21 counties are included in the Supplementary Materials. For the paragraphs that follow, key spreadsheet columns are italicized and the fields are described.

Typically for a single Community System, the Town Population would be larger than the number of residents served by a water system, which we label the System Population. For instance, a town may be served by more than a single water system or split between several sources, such as purchased surface water and local wells. To account for such variations, we include the spreadsheet fields labeled Percent (%) and Users, to identify the number of people receiving a particular source of water. In a simple system serving just one town, Users would likely represent 100% of the System Population.

The sample spreadsheet in Table 2, continues with a Tpoint field for the treatment plant test point that monitors sulfate levels. If the Tpoint is without parentheses, the referenced system has just one test point or a single point that is a good representative of a group. If the Tpoint is enclosed in parentheses, there are several test points to be considered, typically described by spreadsheet notes. Most commonly, several points must be averaged to account for data from several wells. Notice that a simple average assumes the flowrates are approximately the same for all wells. This may or may not be entirely accurate, but there is no practical way to obtain a better estimate.

Finally, seven Data fields contain sulfate measurements (in units of mg/L) for the years 2002, 2005, 2008, 2011, 2014, 2017 and 2020. Only major systems report sulfate data every year, while most systems usually skip years with a 3 year interval being the most common. Each measurement field is paired with a Weight field, where sulfate concentration is multiplied by the number of Users for that spreadsheet row. When the Weights for all towns are summed and then divided by the total number of Users in the county, a population weighted mean results. This is the sulfate concentration for a typical resident.

Very large systems are included by adding spreadsheet rows for Multi-Community Systems. The Western System owned by New Jersey American Water (NJAW) is an example, providing water to 264,586 residents of 35 towns in Burlington and Camden counties. To determine the allocation of water to each county, we calculate percentages of the populations served in any county to that served by all counties of concern. Then we apply these Percentages to the System Population to obtain the User Population for a given county. Like single towns, these large systems can be characterized by multiple sources of water, each with its unique PWSID. In some cases, it is necessary to break down the system into sub-systems with differing mixtures of water. A good example of this is the NJAW Short Hills System, which serves 217,230 residents of Essex, Morris, Somerset and Union counties, fragmenting into no less than 9 sub-systems.

Private wells are included by adding a single row called Private Well Water Estimate at the bottom of the spreadsheet. For this row, the average sulfate level determined from either Geological Survey Reports or the Water Watch database is entered as a constant value for all years. The Private Well Population is taken from a calculation derived from the Private Well Testing Act Program as previously described. For most counties, the Percentage (which can limit the number of private well Users) is set to 100%. When the sum of all Users in the county exceeds the total county population, Percentage is reduced to prevent a population overflow. It may seem arbitrary to limit the influence of private wells, but well properties may be connected to both wells and public water. In such a situation, one might suspect that the public system is the more likely source for drinking water, reducing the impact of well water for our purposes.

Statistical Analyses

We examine sulfate levels in New Jersey counties and compare against autism prevalence for children born in 2006. County data is reported as the population weighted mean of sulfate concentrations in mg/L. For prevalence zones which aggregate county data, both simple means and population weighted means are considered. All collected data was stored in an Open Office spreadsheet version 4.1.5 by Apache Software. Statistical calculations were performed by the functions AVERAGE, MEDIAN, STDEV, VAR, TTEST, CORREL and FORECAST. Linear regression lines, Pearson correlation coefficients and null hypothesis probabilities are presented throughout the paper. Graphs were created manually within the Open Office word processor.

In addition to the statistical quality of the data, several issues may affect this analysis. The Autism Registry reports prevalence for eight-year-old children in their county of residence. For families that have moved, this may not match their birthplace. Also, tap water represents available sulfate, not necessarily sulfate actually ingested by the mother or infant. It is quite common in today’s world to replace some tap water with bottled water. And sulfate from other sources, such as beverages and food, are not considered. Hopefully, such factors are reasonably uniform across counties, making comparisons appropriate. A strong correlation between sulfate and autism is suggestive of a causative relationship but not sufficient to prove it. Such proof must arise from independent evidence showing sulfate to be directly involved and capable of causation. This issue is examined in the Discussion with reference to published medical literature, detailing dysfunctional sulfur metabolism within autism and the consequences of sulfate restriction.

Results

Sulfate measurements from water systems in the Water Watch database form the basis of spreadsheets for the 21 counties of New Jersey. The results are summarized by prevalence zone, county and year in Table 3. Per the New Jersey Autism Registry, Zone 1 counties have the lowest prevalence of autism for the birth year 2006. Each yearly estimate of sulfate is the weighted mean of measurements of tap water for all towns within a county with populations typically exceeding 1% of the county population. For any given town, sulfate reporting may be from a single test point or the average of many points. And the measurement frequency ranges from once every 3 years to several samples per year. As such, these results are informed estimates rather than samples from a uniform data set.

To examine the correlation between autism prevalence and tap water sulfate, linear regression analysis is applied to this data. The years 2005 and 2008 are chosen to best represent the drinking water available to mothers during pregnancy and to children during early infancy for the birth year 2006. Two regressions are considered, simple means and population weighted means as shown in Table 4. For simple means, there are 42 data points, one for each of 21 counties in years 2005 and 2008. This highlights how well each county fits into the 5 prevalence groupings. The results show a mild inverse correlation of r=-0.32 for the data set of n=42. The null probability that such a relationship is a fluke of pure chance is estimated at p<0.03, meaning less than 3%. Looking at the data more closely, the four counties Cumberland, Cape May, Hunterdon and Mercer seem to be somewhat out of step with the full group, which lowers the correlation to mild.

The second regression examines population weighted means. So, counties with larger populations would have more influence on the weighted means. This better represents the average level of sulfate of typical residents in each prevalence zone. The number of data points for this set is reduced to n=10, a weighted mean for each of the 5 prevalence zones in years 2005 and 2008. The results show a strong inverse correlation of r=-0.94 with a null probability of p<0.001, a very low 0.1%. That is a surprisingly strong correlation between local tap water and the presentation of autism.

Results in Graphical Form

The results are best visualized with the help of line graphs. To illustrate the data in Table 3, sulfate means for prevalence zones are plotted for each 3 year period from 2002 through 2020. Figure 2 presents simple sulfate means. Figure 3 shows population weighted means, to better represent the tap water available to typical residents of a zone. These graphs demonstrate significant separation between zones for most years. Focusing on the years 2005 through 2008, to highlight maternal pregnancy and early infancy for children born in 2006, a cleaner view of sulfate means may be presented. Simple sulfate means (Mean) and population weighted means (W Mean) are shown in Figure 4. For this figure, sulfate means are plotted against each of the 5 prevalence zones. A linear regression of this data is shown in Figure 5, within a standard deviation envelope. As expected, the curves depict a general decline in available sulfate as prevalence increases.

Discussion

Why is sulfate important for autism? One characteristic of autism is dysfunctional sulfur metabolism. In particular, the oxides of sulfur are implicated: sulfur dioxide, sulfite and sulfate (SO2, SO32- and SO42-). Sulfate may be ingested directly or it may be produced as an end product of the transsulfuration pathway. In this pathway, the amino acid methionine contributes sulfur dioxide and sulfite which is finally oxidized by sulfite oxidase enzyme to become sulfate. An English study reports the urine of those with autism contains 50 times the sulfite and double the sulfate of neurotypicals [8]. In an Arizona study that investigated blood sulfate levels, free sulfate was 35% and total sulfate was 72% of non-autistic individuals [9]. In addition, a French study of nasal stem cells found decreased expression of either the molybdenum cofactor sulfurase or aldehyde oxidase genes (MOCOS or AOX) in 91% of a small group (n=11/12) of autistic participants [10]. Both of these genes are part of the molybdenum cofactor pathway, responsible for sulfite oxidase enzyme, among several others. Impaired sulfite oxidase production results in an increase of sulfite as noted above.

Sulfate is a common nutrient and functions in a variety of chemical processes including the development of tissue structure for important organs. During human pregnancy, maternal circulating sulfate levels double during the final trimester. This highlights the importance of sulfate in fetal development [11]. In particular, heparan sulfate is essential for neuron regulation. In studies of mice with compromised heparan sulfate synthesis, symptoms similar to those found in autism resulted, including impairments in social interaction, expression of repetitive behavior and difficulties with vocalization [12]. In humans, the examination of postmortem brain tissue in young individuals showed reduced levels of heparan sulfate for those with autism vs neurotypicals [13]. Finally, sulfate supports sulfonation and sulfotransferase enzymes which help to remove xenobiotics and certain drugs. Through a sulfonate intermediary, sulfate is attached to unwanted chemicals increasing water solubility to facilitate removal [14]. Without sufficient sulfate, developing children may be at heightened risk from environmental toxins.

The working assumption underlying our study is sulfate deficiency coupled with genetic mutations involved with sulfur metabolism are significant risks which may lead to autism. Our results show sulfate in tap water to be strongly correlated (r=-0.94) to the prevalence of autism in New Jersey. Of course, tap water is just a surrogate for all sources of sulfate in the diet of mothers and infants. Water only becomes important when dietary sulfate in food and beverages is restricted and the natural metabolism of methionine falls short. In our study, mean tap water sulfate concentrations differ by a slim 10mg/L between high and low prevalence zones. Such a small difference is probably just the tip of the iceberg. There are clues of this nature in the medical literature. In Waring’s English study 20 years ago, urine was analyzed for those with autism and compared against neurotypicals. The results showed autistic urine to contain 6800μM sulfate compared to a normal reading of 3000. Assuming daily urine discharge at 1.4 liters, the extra sulfate in urine for those with autism was 510mg per day. This suggests that tissue in those with autism may be starved for sulfate. And this assumption is confirmed by Adam’s 2011 Arizona study showing blood levels are below normal, only 35% in the case of free sulfate. Perhaps increasing sulfate consumption by even a fraction of 510mg per day could lower the prevalence of autism in New Jersey.

As noted previously, many factors seem to influence the development of autism, including awareness, medical access, maternal age, prematurity and birth weight. The influence of sulfate must be balanced with these other risk factors. Looking closely at the sulfate results in Table 3, four counties appear to be out of step with the majority: Cumberland, Cape May, Hunterdon and Mercer. For these counties, the influence of sulfate is less important than something else. What might that be? An interesting candidate is wealth as measured by median household income. Hunterdon county has the highest median household income in New Jersey at $100,980 [15]. In fact, Hunterdon is often rated among the wealthiest in the United States. Cumberland reports the lowest income in New Jersey at $50,651. Cape May borders Cumberland and has the second lowest household income in the state. Both have very low levels of sulfate in tap water, yet are in the mid-range for autism prevalence. On the other hand, Hunterdon is bordered by Mercer county and both have higher than average sulfate in water, yet are in the highest prevalence zone. As a possible explanation, consider that higher income elevates autism awareness, quality of medical care and pressure toward delayed maternal age. So even in the presence of higher sulfate, these factors might push Hunterdon and Mercer toward additional cases of autism. Likewise, the low income of Cumberland and Cape May, could reduce the diagnosis of autism by lowering autism awareness, quality of care and age of motherhood.

It’s interesting to examine how New Jersey tap water compares to the rest of the United States. The Environmental Protection Agency (EPA) estimates that the national median sulfate concentration of all public water systems is 24mg/L [16]. The range is near zero to over 600mg/L, suggesting the average would be much higher than the 24mg/L median. The New Jersey average for the last 20 years has been about 21mg/L sulfate. This may help to explain why New Jersey has such a high rate of autism compared to other states. A revealing graphic is presented in Figure 6 showing average sulfate levels in the four most populous New Jersey towns relative to the dotted median for the full country. The Passaic Valley Water Commission (Little Falls and Wanaque Systems) serves the towns of Patterson, Clifton and Passaic. The sulfate concentration of this water is high by New Jersey standards, typically above 40mg/L. On the other hand, Newark (Pequannock and Wanaque Systems) provides water with very little sulfate, typically around 10mg/L. And Jersey City and Elizabeth have low sulfate water similar to Newark. It is important to note that these numbers are for tap water but many households prefer even cleaner water with less sulfate. New Jersey publishes State Health Assessment Data from family surveys which include comments about drinking water habits. In 2013, only 20% of families drank unfiltered tap water while 37% used filtered tap water and 40% preferred bottled water [17]. Note that this data was published before the lead crisis in Newark that certainly must have pushed the percentage for bottled water even higher.

Bottled water is an interesting modern phenomenon, rare 70 years ago when autism was virtually unknown but very common in today’s world. Most bottled water is simply purified local tap water with sulfate and most other minerals completely removed. This is true of Aquafina, Smart Water, Sam’s Choice and most supermarket brands. Sparkletts bottled and/or delivered water measures about 3mg/L. And even Poland Spring, a popular spring water from Maine, has a sulfate concentration of just 5mg/L. (This data is from published water quality reports for these brands or our own tests using a Hanna Instruments Model HI 96751C digital photometer.) Again looking at Figure 6, if Passaic Valley customers reject their tap water and drink 2 liters of purified water instead, they give up 80mg of sulfate every day, perhaps increasing their risk of autism. Bottled water is not the only factor that has reduced sulfate in the modern world. Since the enactment of the Clean Water Act of 1972, the EPA has been tasked with cleaning up public water in all of the United States. Clearly, this is good for the country as it minimizes the microbes and toxins that pose health hazards. Of course, water that has been cleaned to contain fewer contaminates will naturally contain less sulfate. The reduced sulfate content of some tap water and most purified bottled water may be important to our understanding of autism.

Conclusion

Using sulfate in tap water as an indicator for dietary sulfate, we compare the county by county distribution of sulfate in water to the prevalence of autism. We use published prevalence rates from the Autism Registry for the birth year 2006. Then we calculate sulfate concentrations for over 600 water systems as cataloged in the New Jersey Water Watch database. Concentrating on the years 2005- 2008 to represent maternal pregnancy and child development through infancy, we compare the sulfate means for water against autism prevalence in all 21 New Jersey counties. The resulting correlation of a linear regression analysis shows a significant, although mild, relationship between sulfate and autism prevalence. When the simple sulfate means are adjusted to population weighted means to better represent the sulfate available to a typical family, the correlation becomes very strong (correlation r=-0.94, n=10, p<0.001). This is a surprisingly robust indicator even though other factors may likewise contribute to the development of autism. Based on our results, it may be possible to significantly reduce the incidence of autism by supplementing with sulfate rich food and water during pregnancy and early childhood. Examining New Jersey data, increasing sulfate concentrations in tap water by as little as 10mg/L may reduce autism prevalence by meaningful margins. The medical literature shows sulfate to be a necessary nutrient, important for organ development, brain function and toxin removal. In those with autism, blood sulfate concentrations are well below neurotypical levels. Our previous Facebook study correlated autism severity with low sulfate in beverages consumed during pregnancy. Our current study documents a strong correlation between autism prevalence in New Jersey and low sulfate in local tap water. These are very hopeful clues to autism prevention that warrant further investigation.

Declarations

Funding and Conflicts of Interest

This work was funded by Rybett Controls, Inc. The author is both an officer and shareholder of Rybett Controls. He donated his time to this project, receiving no compensation for his involvement. The author has some mild characteristics of autism which has led to his interest in this subject. Interestingly, he was born in Long Beach, California long before the advent of purified, bottled water and where sulfate in tap water is in the 48 to 124mg/L range. He is an electrical engineer with degrees from Caltech. Rybett Controls has no products related to autism except an Amazon book titled Autism, Enzymes and the Brimstone Demons [18]. The research published in this book laid the ground work for the sulfate study described by this paper. The book includes an economical recipe for sulfated water which we whimsically call Brimstone Water. For legal protection, Rybett Controls owns the trademark for Brimstone Water although the recipe is unprotected and freely available for all to use. Neither Rybett Controls nor the author have patents, commercial affiliations or business interests relating to autism and declare no conflicts of interest with this research study other than the book and trademark.

Availability of Data and Material

The Supplementary Material for this article includes a master spreadsheet with sub-sheets that calculate sulfate levels for all 21 New Jersey counties plus a summary. To obtain this spreadsheet, simply send a reasonable request to the author via email ( rybett@ aol.com ). The primary data sets analyzed by this study (Autism Registry prevalence, Water Watch test results, New Jersey GSR reports) are located on the web under References.

Author Contributions and Acknowledgment

All work within this study was performed by the author. The author would like to thank the New Jersey Autism Registry for publishing county by county prevalence rates on their website. Also, the New Jersey Department of Environmental Protection should be congratulated for their user friendly Water Watch database software.

Ethics Approval

The information used in the study was from data sets in which all relevant personally identifiable information had been removed. Prevalence was aggregated by the New Jersey Autism Registry at the county level and published on their website. Therefore, this project did not require institutional review for research with human subjects nor individual consents to participate. This article does not contain studies with animals or plants.

For More Articles: Biomedical Journal Impact Factor: https://biomedres.us

Open Access Journals on Infectious Diseases

Antimicrobial Resistance: An Emerging Public Health Threat on One Health Perspectives

The emergence of multidrug-resistant (MDR) superbugs is extremely alarming. In most cases, infections arising from MDR superbugs do not respond to treatment with a few antimicrobial agents. This issue is on the verge of establishing pre- and postantimicrobial agent eras. In the latter, last-resort antibiotics will be unable to treat infections caused by Gram-positive and Gramnegative MDR bacteria [1]. The magnitude of this human health issue has been described by the World Health Organization (WHO) through the 2014 “Global Report on Antimicrobial Resistance Surveillance,” which is based on reports from 114 countries. The main findings include the high resistance to third generation cephalosporins and fluoroquinolones reported for Escherichia coli and Klebsiella pneumoniae, and the high resistance to carbapenems displayed by K. pneumoniae for both nosocomial and communityacquired infections. Similarly, high resistance to methicillin has been reported for a strain of Staphylococcus aureus [2]. The recognition of antimicrobial resistance among humans, animals, and ecosystems has led to the concept of “One Health,” a holistic term that distinguishes the important links between human, animal, and ecosystem health. As a public health issue, it involves implementing programs, policies, and research that carry out multidisciplinary work, bringing several sectors together to achieve better results. This approach englobes three essential points: understanding the mechanisms of bacterial resistance, using combined therapeutic approaches as clinical options, and discovering new antimicrobial agents [1,3].

The “One Health” approach is necessary to control and prevent infectious diseases, including emerging infections and antimicrobial resistance. This approach is crucial for antibiotic resistance because many antibiotics used in human medicine are also used in veterinary medicine and livestock production, leading to antimicrobial resistance selection. In addition, there is evidence indicating that at least some clinically relevant resistant bacteria and/or their resistance genes can be transferred between animals and humans across ecological and geographic barriers [4]. Given the dimensions of antimicrobial resistance in humananimal- ecosystem health, it seems reasonable to adopt a One Health approach to this problem. This approach includes taking steps to preserve the continuous efficacy of existing antimicrobials by eliminating their inappropriate use and limiting the spread of infection. The agriculture and veterinary sectors are particularly concerned about mass medicating animals with antimicrobials that are also used in humans, such as third generation cephalosporins and fluoroquinolones. Another concern is the use of medically important antimicrobials added to animal feed as growth promoters. These include colistin, quinolones, tetracyclines, and macrolides, and may cause the development of bacterial resistance in animals, which can be transmitted to humans directly or indirectly [5,6]. In conclusion, the concept of antimicrobial resistance and a “One Health” approach is crucial for understanding and mitigating the transmission of resistance genes among the human-animalecosystem interface. Despite significant new findings regarding antimicrobial resistance at this interface, other aspects must be explored to fully understand the origin, emergence, dissemination, and evolution of antimicrobial resistance.

Conflict of Interest

The author declares that she has no conflict of interest.

For More Articles: Biomedical Journal Impact Factor: https://biomedres.us

Journals on Toxicology

Cell Junctions Present in Reconstructed Human Skin Models

Introduction

From several decades, reconstructed skin models have been developed both in the field of public research, in the cosmetics and pharmaceutical industries. All these approaches are based on the principle of isolation of primary cells, cultivation of cells in a monolayer and then specific differentiation of the tissue at the airliquid interface in order to obtain a multi-layered and specialized tissues [1,2]. Since the first experiments carried out by Rheinwald and Green in 1975 [3] on the isolation and culture of human primary keratinocytes on a monolayer of fibroblasts, techniques have evolved towards a culture of keratinocytes without a nourishing sub-layer. The technical changes were more focused on the culture media in order to obtain a tissue close to the characteristics of the in vivo skin. As a result, the epidermis is now cultivated on deepidermized dermis, inert filters or even more or less complex collagen matrices [1,4-8]. The growth and differentiation processes of the reconstructed epidermis, however, have changed little with a growth phase of keratinocytes in immersion and a differentiation phase induced with a medium concentrated in calcium ions [9,10]. These technical approaches improve the characteristics of reconstructed tissues with for example, better organization, structure, cohesion conferring them, a better integrity close to skin characteristics. The main role of the skin is to ensure a barrier function against external environmental stresses and to avoid water loss [11]. The maintenance of the skin integrity against stresses is due to the presence of numerous cutaneous junctions between cells and skin compartments [12,13]. In the skin, a stratified epithelium, from basal layer to stratum corneum we noticed the presence of focal adhesions (FA), dystroglycans and hemidesmosomes (HD) which ensure the adhesion to dermal compartment, cell-cell junction with GAP junctions, adherens junction, desmosomes then tight junctions in the granular layer and finally corneodesmosomes at the level of stratum corneum (Figure 1) [14]. The adhesion between the epidermis and the dermis is insured by a highly specialized zone called the Dermoepidermal Junction (DEJ).

biomedres-openaccess-journal-bjstr

Figure 1: Schematic representation of cell-cell and cell-matrix junctions.

The DEJ confers a fine-tuned architecture to the skin useful for the maintain of the skin homeostasis. The DEJ regulates cell adhesion, cell differentiation and motility, and plays an important role in the communication between the epidermis and the dermis [15]. The DEJ also influences the basal keratinocyte polarity and defines the basal surface where proliferating epidermal cells are attached [16]. The DEJ is a highly complex structure composed to hemidesmosomes, focal adhesions and dystroglycans. Hemidesmosomes are found in different tissues such as the cornea, the skin [17] allowing the maintain of these tissues. HD have important role in cell adhesion, wound healing, tissue morphology allowing the maintenance of tissue structure and integrity. HD, half of desmosome, are small structure about less than 0.5μm consisting of a tripartite plaque with an inner and outer plaque separated by a less dense zone [18]. HD consist of α6β4 integrin, plectin (P1a), tetraspanin CD151, BPAG1 (or BP230) and collagen XVII (or BP180 or BPAG2) [19].

These junctions link anchoring intermediate filaments in the epidermal compartment and fibrils on the extracellular matrix side among which the following proteins are mainly found keratins K5, K14, collagen VII and IV and other proteins like laminin 332 (laminin 5) [20]. In addition to hemidesmosomes, focal adhesions are dynamic adhesions allowing also keratinocyte junctions to the extracellular matrix through the connection of α3β1 integrin transmembrane proteins to the actin cytoskeleton and on the opposite to laminin 332 to the extracellular matrix [21]. FA are involved in different processes like cell communication, proliferation, migration, apoptosis, spreading, wound healing and differentiation. The FA is a protein complex composed about more 50 proteins divided into three groups:
i) The structural components (talin, vinculin, kindlins also named FERMT1-3)
ii) The enzymatic components (Focal Adhesion Kinase (FAK), Integrin-Linked Kinase (ILK) and Tyrosine-Protein Kinase SRC-1 (SRC))
iii) Adaptors (paxillin, P130, LIMS1…) [21-23].
The dystroglycans, another complex present in DEJ, were shown as expressed by keratinocytes and fibroblasts in human skin [24] and localized in the epidermal basement membrane. The dystroglycans allow a closed-link with the actin cytoskeleton of epidermal basal keratinocytes and with the extracellular matrix in human skin [24,25]. The integrity of the epidermis compartment is ensured by cell-cell junctions present between epidermal cells in all layers including stratum corneum. Among all junctions, GAP junctions link the cytoplasm of two cells allowing intercellular exchange of ions and small molecules [26]. This intercellular communication is important for the maintenance of skin homeostasis, including keratinocyte growth and differentiation [27], regulation in melanogenesis [28]. In fact, GAP junctions are channels assembled from connexin subunits (26, 32 and 43) belonging to connexin family about 21 members. The assembly of 6 connexins forms an oligomer called connexon, transported to the plasma membrane [29].
The connexon docks with a connexon of adjacent cell and form a GAP junction channel. These GAP junctions are regrouped into GAP junction plaque. In addition to GAP junction, desmosomes form the intercellular junctions (0.2–0.5μm in diameter) allowing the link of intermediate filaments to the plasma membrane giving a resistance to mechanical stress in the skin and other tissues [30]. The desmogleins (Dsc1-3) and desmocollins (Dsg1-4), transmembrane proteins of the desmosome, belong to the cadherin family of calcium-dependent adhesion molecules. The cytoplasmic tails of desmosomal cadherins are associated with the desmosomal plaque proteins: plakoglobin and desmoplakin belonging to the armadillo and plakin family of linker proteins respectively [31]. The tethering of cytoskeleton is insured by interaction of desmoplakins with the keratin intermediate filaments giving rise to inner dense plaque [32,33]. A third cell junction complex is adherens junctions (AJs) which have conserved plasma-membrane structures that mediate cell–cell adhesions organized into two complexes of proteins: nectin/afadin and cadherin/catenin.
The AJs form extracellular adhesive contacts between cells, and intracellular links to the actin cytoskeleton. E-cadherin and the catenin family members including p120-catenin, β-catenin, and α-catenin are the main components of AJs [34]. Two types of cadherins are expressed in the epidermis: P-cadherin expressed in the basal layer and in hair follicles, and e-cadherin in all layers of the epidermis. AJs are involved in several processes such as cytoskeletal dynamics, cell polarity, cell adhesion, cell shape, division, growth, apoptosis and barrier function [35]. At the upper layer of the epidermis, another type of junctions is present. Indeed the tight junctions are localized in the granular layer, thus ensuring the barrier function, cell polarity and preventing epidermal water loss and solutes [36]. Tight junctions are protein complexes containing more than 40 proteins that form the semi-permeable mechanical connections between cells.
The tight junctions consist of three main type of structural transmembrane proteins that are common to all tight junctions: claudins belonging to a family of 26 members, Tight Junctionassociated MARVEL proteins (TAMP) as occludin or tricellulin and junctional adhesion molecules (JAM-A, -B or -C) [37]. The tight junctions are linked to the cytoskeleton through protein adaptors called Zonula Occludens (ZO-1, -2, and -3) and MUPP1 (Multi-PDZ Domain Protein 1) forming the junctional plaque. Most of the proteins forming these junctions are found in the stratum granulosum including claudins 1, 4, 6, 7, 11, 12 and 18, occludin, ZO-1, ZO-2, MUPP-1 and cingulin [38]. And finally in the stratum corneum, composed of corneocytes responsible of the epidermis turnover and conferring a regenerating power of the skin, corneodesmosomes ensure the link to each other. Corneodesmosomes are a modified form of desmosome, indeed they are formed upon integration of corneodesmosin (CDSN) released by lamellar granules [39] during the conversion of desmosome to corneodesmosome in the stratum corneum of the epidermis [33]. CDSN glycoproteins embedded within the desmoglea (the intercellular space of desmosomes) to form the desmosomal plate [40].
Deposition of loricrin, a major component of the cornified cell envelope, begins at the desmosomal plaques in the cytoplasm of cell present in the upper layer of the stratum granulosum [39]. These junctions are degraded to allow the desquamation process by proteases as kallikreins and cysteine proteases (cathepsins) in contrast to protease inhibitors as LEKTI counterbalance to the stratum corneum formation [41]. In this article, we highlighted the presence of cell-cell junctions and cell-matrix junctions both in reconstructed epidermis and full thickness (combination of dermis and epidermis) and the integrity of the barrier function demonstrated with the penetration of lucifer dye after chemical stress (SDS).

Material and Methods

Ethical Compliance

Samples were obtained from anonymous human healthy donors. Surgical residues were harvested according to French regulation (agreement DC 2021-4617) and procurement of written informed consent from the patient.

Cell Culture of Normal Human Keratinocytes and Fibroblasts

Normal human primary epidermal keratinocytes (NHKs) were isolated from surgery (circumcision). An enzymatic digestion was used to dissociate the epidermis from the dermis indeed the biopsies were incubated in the Dispase II (Sigma, France) at 4°C overnight. Then a second enzymatic digestion was used to separate the epidermal keratinocytes with Trypsin-EDTA (Sigma, France) at 37°C for 10 minutes from epidermis cut into small pieces. The cells were centrifugated and the pellet was taken in a specific medium complemented with BPE (Gentaur, France). Cells were placed at 37°C in a humidified atmosphere containing 5% of CO2. In parallel, the dermis explant was placed in a Petri dish and incubated with DMEM with 1g/L of glucose (Lonza, Switzerland), 2mM L-glutamine (Lonza, Switzerland), Gentamycin (Euromedex, France) complemented with 20% FCS (Biowest, France). The explants were incubated at 37°C in a humidified atmosphere containing 5 % of CO2. At the appearance of fibroblasts, the dermis explant was removed and the culture medium was replaced by DMEM with 1g/L of glucose (Lonza, Switzerland), 2 mM L-glutamine (Lonza, Switzerland), Gentamycin (Euromedex, France) complemented with 10 % FCS (Biowest, France) and incubated at 37°C in a humidified atmosphere containing 5% of CO2.

Reconstruction of Epidermis

After keratinocyte isolation, the NHKs were seeded on a 0.5cm² inert polycarbonate membrane (Nunc, Thermo Fisher Scientific, USA) in a proprietary chemically-defined media and were placed at the air-liquid interface until 17 days at 37°C in a humidified atmosphere containing 5 % of CO2.

Reconstruction of Skin Equivalent (Dermis and Epidermis)

After fibroblast isolation, dermal equivalents were prepared using a neutralized solution containing bovine type I collagen (Collagen Solution, USA) diluted in complete DMEM [(1g/L of glucose, 2mM L-glutamine; Lonza, Switzerland), 10 % FCS (Biowest, France) and gentamycin (Euromedex, France)]. The mixture was dispensed onto 12-well tissue culture plates and incubated 24 hours at 37°C to allow the polymerization. After polymerization, complete DMEM medium was added to each well. Dermal equivalents were maintained at 37°C in a humidified atmosphere containing 5 % of CO2. After 4 days of contraction, the matrix was transferred in the proprietary chemically defined medium at the air-liquid interface. The NHKs were seeded on the dermal matrices and placed at 37°C under 5 % CO2. After 3 days of culture, the full thickness was placed at the air-liquid interface at 37°C in a humidified atmosphere containing 5 % of CO2.

Histology and Immunohistochemistry

For histological analysis, the reconstructed human epidermis and skin equivalent were fixed in the 10% formalin buffer (Sigma, France). After successively dehydration, the tissues were then embedded in paraffin. Paraffin section (4μm) were deposited on glass slides, deparaffinized and then successively rehydrated in xylene baths, alcohol of different percentages and water. The Hematoxylin & Eosin staining (H&E) staining was performed by placing the sections in a hematoxylin bath for 3 minutes. The sections were rinsed with water for 5 minutes at room temperature. The slides were then placed in an eosin bath for 2 minutes. The tissues were then dehydrated in successive baths of absolute alcohol and xylene. After mounting a coverslip with Eukitt* (O. Kindler), the photos were acquired with a Qimaging* Retina 2000R Fast1394 camera and processed by using the Q-Capture Pro 7 (QImaging, England) acquisition software.
For immunohistochemistry (IHC), the reconstructed human epidermis and skin equivalent were fixed in the 10% formalin buffer (Sigma, France), then embedded in paraffin. Paraffin sections (4μm) were deposited on glass slides, deparaffinized and rehydrated with successive bath of xylene, absolute alcohol and water. The exposure of the antigens was realized by treatment of the sections with 0.01 M citrate buffer pH6 and 0.25 % pepsin or 0.05 % trypsin (Zymed, Invitrogen, Thermo Fisher Scientific, USA) for 15 minutes at 37°C. After the fixation, the saturation of nonspecific sites was performed with 5% BSA buffer (Sigma, France) for 30 minutes, primary antibody was applied at room temperature for 1 hour (Table 1). The sections were rinsed in PBS and the secondary antibody (Alexa Fluor Donkey anti-rabbit, Alexa fluor Goat anti-mouse, Alexa Fluor Goat anti-rat, (Invitrogen, Thermo Fisher Scientific, USA) was deposited at room temperature in dark for 1 hour. Finally, the slides were incubated with 0.3μM 4’,6’diamidino-2-phenylindole (DAPI, Molecular Probes, USA) for 5 minutes at room temperature in the dark and mounted with Fluoromount-G® (Electron Microscopy Sciences, USA). The photos were taken with a Qimaging EXI blue camera coupled to Volocity acquisition software (Improvision, England).

https://biomedres.us/table/biomedres-openaccess-journal-bjstr.ID.006362.T001.png
Table 1: Antibody characterics used for immunohistochemistry.

Barrier Integrity Assay

To observe the barrier integrity, a Sodium Dodecyl Sulfate (SDS) (Sigma, France) stress (concentration 0.1 to 0.75 % w/v diluted in PBS 1X) was applied topically for 3 hours. Then epidermises were rinsed 3 times with PBS 1X and then Lucifer yellow 1mM was applied topically for 2 hours to visualize the diffusion of this passive dye throughout the epidermis. Epidermises were rinsed 3 times with PBS 1X then tissues were fixed with formalin solution neutral buffer 10 % and embedded in paraffin. Paraffin sections (4μm) were deposited on glass slides, deparaffinized and rehydrated with successive bath of xylene, absolute alcohol and water. The slides were incubated with 0.3μM 4’,6’diamidino-2-phenylindole (DAPI, Molecular Probes, USA) for 5 minutes at room temperature in the dark and mounted with Fluoromount-G® (Electron Microscopy Sciences, USA). The photos were taken with a Qimaging EXI blue camera coupled to Volocity acquisition software (Improvision, England).

Results

The reconstruction of cutaneous tissues such as epidermis or more complex tissue (dermis combinate with epidermis for example) is not only a layering of keratinocytes but a cellular stratification with the presence of specialized keratinocytes with specific functions and characteristics according to the corresponding epidermal layer such as basal, spinous, granular layers or stratum corneum. To investigate the integrity of the tissue due to the presence of cell junctions, immunodetections of specific proteins related to junctions were realized on these reconstructed tissues. Claudin-1 (a major protein involved in tight junction), e-cadherin (a main protein involved in cell-cell junction), b1 integrin (protein involved in cell-matrix adhesion and more specifically to collagen fiber) and corneodesmosin (a protein involved in the stratification of stratum corneum) were selected. Prior to realize immuno-detection of specific proteins, a histological observation of the human reconstructed tissue by hematoxylin and eosin (H&E) staining was performed to compare the structure of reconstructed epidermis to native human skin (Figures 2a & 2b).

biomedres-openaccess-journal-bjstr
Figure 2: Characterization of reconstructed human epidermis.

he structure of reconstructed epidermis is similar to native skin with the presence of all differentiated layers; basal layer with columnar keratinocytes, spinous layer, granular layer with the presence of keratohyalin vesicles and finally a stratum corneum constituted of several layers of corneocytes. The detection of b1 integrin is located to the basal keratinocytes, this is in adequation with the function of b1 integrin to anchor the epidermis to the extracellular matrix at the dermoepidermal junction. The detection of both claudin-1 and e-cadherin were localized at the membrane of cells in the suprabasal layers. Detection of these proteins are less pronounced in basal layer. Corneodesmosin was expressed in the lastgranular layer of the epidermis and all layers of the stratum corneum where this protein is progressively proteolysed during corneocyte maturation and desquamation. The presence of specific proteins involved in the cohesion of epidermis seems to confirm the efficiency of barrier function of epidermis in the reconstructed tissues.
To validate this epidermal function, a passive dye was topically applied on the top of the RHE to observe the diffusion after a chemical stress by SDS at various concentrations (Figure 3). Treatment with SDS, a well know surfactant, disrupted cell junctions resulting in a deep penetration of dye Lucifer yellow inside the epidermis. This diffusion is dependent to the concentration of SDS, indeed at lowest concentration (0.1 %) the lucifer yellow was only present in the stratum corneum, and diffusion was not observed in viable cell layers. But on the opposite, at the highest tested concentration (0.75 %), lucifer yellow penetrated completely inside the reconstructed epidermis (Figure 3). After the reconstruction and the characterization of the in vitro epidermis, a more complex tissue combining dermal and epidermal compartment was studied. Prior to detect the presence of specific cell junction proteins, a histological staining by H&E was performed to compare the structure of full thickness to native skin.

As we observed a similar structure of reconstructed human epidermis to the epidermis of native skin, the observation of the epidermal compartment in the full thickness model is similar with the presence of all differentiated layers; basal layer with columnar keratinocytes, spinous layer, granular layer with the presence of keratohyalin vesicles and finally a stratum corneum (Figures 4a & 4b). The global structure of reconstructed tissue is similar to native skin (except for the presence of dermal papilla) but due to the early stage of reconstruction (day 10), the stratum appeared thinner than the epidermal stratum observed in RHE at day 17. Cohesion of the epidermal compartment with the dermal compartment is fully present all along the tissue. The detection of b1 integrin is localized all along the dermoepidermal junction, collagen XVII, laminin 332 and collagen IV were also expressed at the DEJ. As observed on reconstructed epidermis alone, the detection of both claudin-1 and e-cadherin are localized in the membrane of cells constituting suprabasal layers, the detection of these proteins are less pronounced in the basal layer.

Conclusion

Reconstruction of in vitro skin models from human cells is a real advantage for the research field and also it has been a revolution for toxicological studies to avoid the use of animals. These RHE are “real skin” and not only a superposition of cells which allowed the validation of these models by ECVAM (European Council of Validated Alternatives Methods) to use them for several toxicological studies such as skin irritation or corrosion (respectively OECD TG439 (2021) and 431 (2019), [42,43]). To obtain these validations, the “in vitro skin” must have similar properties to native skin and more precisely in term of barrier function. This barrier function is ensured by the stratum corneum with its structure in “bricks and mortar” (bricks symbolize corneocytes and mortar the intercellular lipids). In addition of the stratum corneum, to ensure this barrier function, cohesion between epidermal cells in the viable layers is essential. To ensure the tissue cohesion, there is several types of epidermal junctions such as GAP junctions, tight junctions (essentially located in the stratum granulosum), desmosomes, corneodesmosomes (in the stratum corneum) and hemidesmosomes, focal adhesions, dystroglycans in the basement membrane.
In this study, both reconstructed human epidermis and full thickness models presented all differentiated layers of a native human epidermis. Indeed, four typical epidermal layers are well differentiated with the presence of columnar keratinocytes in the basal layer, spinous layer constituted of 2-3 layers of polyhedral keratinocytes above the basal layer and the stratum corneum. The cells of the epidermal layers come from the migration of cells of basal layer. In the stratum spinosum, cells are provided with spicules or thorns, hence their name of spiny cells. These spines are in fact desmosomes to which microfilaments are attached. The third layer, the stratum granulosum, with characteristic cytoplasmic keratohyalin vesicles comprising loricrin, trichohyalin and profilaggrin (the precursor of filaggrin), contributes to the formation of interfibrillar cement by keratin filament aggregation. Thus, the function of keratohyalin vesicles is to stabilize the tonofibrils at the level of the corneocytes, by contributing to the formation of the insoluble matrix of the stratum corneum that leads to keratinization.
The cohesion of the spinous layers is also ensured by different junctions such as tight junctions evidenced by claudin-1 and desmosomes that are conversed in corneodesmosomes evidenced by corneodesmosin. Finally, the stratum corneum is formed by a superposition of anucleated and completely keratinized cells, the corneocytes, forming very elongated lamellae. All epidermal cells are firmly attached to each other, thus causing a mechanical cell coupling inducing resistance of the epidermis to mechanical stresses and a part of communication between cells are ensured by the presence of GAP-type junctions. The barrier function integrity can be observed by the detection of specific junction proteins involved in cell-cell adhesion. Claudin-1 (tight junction) and e-cadherin (adherens junctions), detected by specific antibodies, were presents in all suprabasal layers (spinous and granular) both in reconstructed epidermis and full thickness. It is interesting to notice that the detection of these proteins was absent or very weak in the basal layer.
This lower detection is due to the presence of proliferating cells and stem cells which initiate the renewal of the epidermis, indeed basal keratinocytes expressed high levels of β1 integrins and lower levels of e-cadherin and claudin-1. Presence of these two proteins is crucial because e-cadherin favors the incorporation of claudin-1 in the structure of tight junction and a decrease of claudin-1 plays a central role in dermatitis atopic [44]. The cohesion of the epidermal compartment to the dermis is also ensured by several proteins forming complex such as hemidesmosomes, focal adhesions or dystroglycans. Our in vitro model presented proteins belonging at the DEJ demonstrated by the presence of collagen XVII (hemidesmosomes), laminin 332, collagen IV and β1 integrin (focal adhesion). The study of the cell-cell junctions and cell-matrix junctions are very important to better understand skin diseases. The development of in vitro models deficient in specific proteins can be a perfect tool in this investigation.
Indeed, for example hemidesmosome are very important bonds because mutations in the genes encoding these proteins induce serious pathologies such as bullous dermatosis which results from the loss of interaction between plectin and collagen XVII [45], in mice the deficiency of β1 integrin induced a resistance to skin scleroderma resulting in reducing dermis thickness [46]. To develop specific in vitro models, the combination between molecular biology and tissue engineering allows to modify genetically the cells then to reconstruct human tissues deficient in the expression of specific proteins involved in cell-cell junctions or cell-matrix junctions to mimic diseases.

Open Access Journals on Gynecology

Reduced Outpatient Obstetrics and Gynecology
Visits During COVID-19 Pandemic in a Medium-Sized
Regional Hospital, Japan

Introduction

The coronavirus pandemic crippled the healthcare delivery around the world [1,2]. Many countries, including Japan, implemented guidelines to diminish exposure, and individuals were encouraged to stay-at-home orders and self-quarantine to reduce transmission risk of infection, particularly those considered high risk for coronavirus infection (e.g. the elderly and immunocompromised). It brought about unprecedent transformed healthcare services, any form of routine medical care should be avoided and only emergency services may be provided [3,4]. Every country, region and state improved the guidelines according to their infection status and regional requirements [5]. Therefore, we attempted to critically investigate the changes in the number of the outpatient obstetrics and gynecology visits during the pandemic period compared to that of pre-pandemic period at the mid-sized care hospital in the region of Japan.

Materials and Methods

This prospective study was carried out by retrieving outpatient visit data from registries of Matsunami General Medical Center (Gifu, Japan) and the Department of Obstetrics and Gynecology. The data collected from January 2018 to March 2020 was categorized into the pre-pandemic period and the data from April 2020 to September 2021 was grouped into the pandemic period. The statistical analysis was performed with Student’s t-test, and a P-value of <0.05 was considered significant.

Results

Total number of outpatient visits during the initial 3 months of COVID-19 pandemic decreased by17.3 % (from 20643 ±871.1 to 17088 ±886.0 per month, p<0.05) compared to before COVID-19 pandemic (January 2018 to March 2020) (Figure1). There was no significant gender difference in pre-pandemic and pandemic periods. During the pre-pandemic period, approximately 10% of total visits received obstetrics and gynecologic care (Figure 2). The number during the initial 3 months of COVID-19 pandemic was significantly lower than the pre-pandemic period (852 ± 49.1 vs 1136 ± 55.3, p<0.05). The refrain from consultation for obstetrics and gynecologic consultations had a slight tendency to remain throughout pandemic period (means of 957 ± 77.7).

Discussion

This retrospective study was designed to investigate the effect of the pandemic on the changing trends of obstetrics and gynecology outpatient. The analysis of patients in the pre-pandemic would reflect the usual pattern of cases attending our regional center and the drops in outpatient visits during the initial 3 months of COVID-19 pandemic seemed to more premiant than that of total institutional visits (17.3% vs 25.0%). This was followed by gradual relaxations that led to resumption of healthcare visits even under pandemic. Restriction of movement during the initial 3 months of pandemic period prevented the patients from seeking prompt obstetrics and gynecology-related care and inability to receive the required treatment. Similar changing trend were also noticed in emergency or cancer cares [6-9]. In addition, patient may also intentionally avoid visiting hospitals due to scary infections. Awareness about the restriction of obstetrics and gynecology services during the initial pandemic period may lead to resumption of healthcare visits even under pandemic. Limitations of this study include that we did not categorize emergency, urgent and elective and that we did not observe the attendance age and clinical diagnosis. Further research is needed to understand how decreased outpatient visits during the pandemic may affect attendance outcomes.

Conflict of Interest

The authors declare that they have no conflict of interest.

For More Articles: Biomedical Journal Impact Factor: https://biomedres.us

Journals on Pharmaceutical Sciences

Quantification of Flavonoides and Phenols of Bravo Bean Extract (Capparis flexuosa L. Caparaceae)

Introduction

The use of plants for medicinal purposes is not present only in contemporaneity, since the course of human history there was already the search for plants that possessed the curative capacity, even with little knowledge about them, the men of antiquity already used them and distinguished them for the various purposes. Medicinal herbs are fundamental in the treatment of various pathologies, especially in communities isolated from large urban centers [1]. With the advent of navigations it was possible to discover new continents, presenting to the world the great therapeutic arsenal derived from plants, indispensable to modern medicine [2]. Nature has always been a source of charm for man, not only for the useful resources of its food and maintenance, but for being its greatest source of learning and inspiration [3]. Brazil is a privileged country in biodiversity since, of all the plant species in the world, 20% is in The Brazilian territory. Several native or nonnative species face risk of extinction due to the degradation of their habitat and exploratory [4].

Although Brazil has a great biodiversity, there are still few species cataloged and strictly studied as their therapeutic potential, which makes it difficult to make use of these. However, ethnobotany research in the Northeast has shown satisfactory results, especially of plants adapted in the caatinga [5]. The caatinga biome is present only in The Brazilian territory, with an area of 844,453km2, which corresponds to 11.00% of the national territory, predominant of all states of the Northeast and North region of Minas Gerais [6]. This biome has long been considered poor in biodiversity, however, studies have shown its rich biological diversity. More than 2,000 species of vascular, succulent, woody plants and various species of bees, amphibians, birds and mammals have been recorded. Among several species of caatinga, several plants have antioxidant action and several other biological activities, and are used as a remedy for popular use, with leaves, stems and seeds sold in markets and free fairs [6,7-9].

Thus, it is possible to emphasize the species belonging to the family Caparaceae more precisely the species Capparis flexuosa L. (Caparaceae), which is popularly known as wild beans, stands out for presenting a favorable development in semiarid regions, such as the northeast, and in a dry period the occurrence by biological production is satisfactory of this species. Its morphological characteristics consist of a shrub-tree size of perennial leaves, in the late afternoon insects and bees become attracted by their flowers, because they have the ability to ezalarem odor, more precisely due to the main floral resource that it has nectar [10]. Due to its meliferous relevance, C. flexuosa L. is recommended to be cultivated in regions that have as activity the creation and conservation of bees, for the extraction of honey. In addition, this forage exercise an important activity in cattle ranching activities in the northeast, which serve as food for the herds, mainly for sheep and goats, thanks to their resistance to develop in dry periods [11].

In traditional medicine, wild beans are presented as a contributor to several diseases, such as: sinusitis through its inhalation, and against snake bite reactions, from the embehest of the liquid resulting from its peel shaved with water. In view of the attributions of wild beans in traditional medicine, it is important to quantify phenolic compounds and flavonoids of the leaves of C. flexuosa, given the great biological and pharmacological importance of these bioactive compounds in the human organism [12-15]. Therefore, the objective of this study was to quantify the total phenol and flavonoid content of the leaves of C. flexuosa L, using spectrophotometric techniques.

Methodology

Obtaining the Crude Ethanol Extract

The leaves were collected, identified, dried at room temperature and subsequently crushed. The extraction of the chemical constituents was performed by macerated in P.A. ethanol for two weeks. The extractor liquid was concentrated in rotaevaporator at a temperature of 45 °C degrees Celsius, to obtain the crude extract.

Phenolic Compounds – Folin Ciocalteau

The quantification of phenolic compounds and flavonoids was performed by the analytical method of quantification by external standardization, with the aid of a UV-VIS spectrophotometer. The method for determination of total phenols was adapted from [16], and consists of the reaction of the constituent acids of the folinciocalteau reagent and phenolic or non-phenolic compounds. To quantify the phenol content, a calibration curve of manic acid was performed with concentrations ranging from 0.15 to 0.005 mg/mL. After preparing the calibration curve, the plant extract solution was prepared. Initially, 0.005 g of the plant sample was weighed and diluted in 5 mL of MeOH. Then, a rate of 0.075 mL of this solution was removed and 0.425 mL of MeOH (stock solution) was added. To perform the reading, 100μL of the stock solution, 500μL of folin – Ciocalteau and 6 mL of Distilled H2 for each sample were added in amber glass (in triplicate- for eachsample). It was subsequently stirred in the vortex for 1 minute, then 2 mL of 15% sodium carbonate was added and stirred again in the vortex for 30 seconds. The last procedure for the preparation of the solutionswas transferred to the solution to a 10 mL volumetric balloon and the volume was completed with Distilled H2O; and then the solutions were incubated in the dark for 2 hours. To obtain the white, a solution of 100μL of MeOH, 500μL of the Reagent Folin-Ciocalteau and 1 mL of H2The distilledwas prepared. Soon after, 2 mL of sodium carbonate was added 15% and then stirred for 30 seconds in the vortex. Subsequently completed the volume of the solution in a 10 mL volumetric balloon. The solution was incubated in the dark for 2 hours. Before any reading, the whitepp p zeroe the spectrophotometer was used. A UV-VIS spectrophotometer with a wavelength of 750 nm was used to read the solutions.

Quantification of Flavonoid Content

The analysis was adapted to the study by [17]. Initially, the calibration curve was prepared with the quercetin pattern, where 1mg of quercetin was weighed and diluted in 1ml of MeOH. Then, dilutions were performed at concentrations of 0.03; 0,025; 0,020; 0,015; 0,01; 0,005; 0.0025 and 0.00125mg/ml. Soon after, it weighed it and 1mg of the crude extract and diluted it in 1ml of MeOH. After preparing the stock solution, the solutions (in wells – in triplicate) were made for reading that contained 200μl of the test solution of the plant sample and 100μl of 2% aluminumchloride solution. The solution for white (in triplicate) was prepared with 200μl of MeOH and 100μl of 2% aluminum chloride methanic solution. Then the well plate was kept in the dark for 30 minutes. After the time, the reading was performed in aPECTrophobimeter UV-VIS at 420nm. The flavonoid content was determined by interpolation of the average absorbance of the samples against the quercetin calibration curve (replacement of the straight equation) and expressed in mg of EQ (quercetin equivalent) per g of the extract.

Results and Discussion

Phenolic substances are widely distributed in nature, about 8000 phenolic compounds have been found in plants [18]. These compounds can be classified according to their chemical structure, in classes such as simple phenols, phenolic acids, acetophenones, phenylaacetic acids, hydroxycinamic acids, phenylpropenes, coumarins, xanthones, anthraquinonas, flavonoids among others [19]. One of the most importantclasses of phenolic compounds are flavonoids. This class is widely distributed in the plant kingdom, being found in fruits, seeds, roots, splints, flowers, teas and wines. They are aromatic substances and have basic structure C6-C3-C6, with 15 carbon atoms. The two rings are aromatic (rings A and B) joined by three carbons that form a heterocyclic with ring C [20]. By the Folin–Ciocalteau method, the total phenol content of the extract of C. flexuosa leaves was determined by the spectrophotometric method. The total phenol content was identified by interpolation of the absorbance of the samples against a calibration curve constructed with patterns of lalic acid [21], as shown in Graph 1.

biomedres-openaccess-journal-bjstr

Graph 1: Calibration curve of the lalic acid.

By interpolating the absorbances of the species C. flexuosa, a content of 1916.9 mg EAG/g of extract was obtained; a result being superior to others already described in the literature. According to JUNIOR (2015) [15], when analyzing the wild bean, a phenol content of 595.47 mg EAG/g of extract was obtained. Assim as phenolic compounds, flavonoids also play an important role in the protection of living organisms against oxidative agents, present in plants, which act as bioactive agents, such as anti-inflammatory, antiallergic, anti-hemorrhagic, action against diabetic retinopathy and among others, highlighting its performance mainly as antioxidant [8,13,14]. Thus, there was a quantitative analysis of the flavonoid content of the species C. flexuosa, obtaining a content of 84.04 mg EQ/g of extract, byinterpolating the absorbances of the sample with a standard quercetin curve (Graph 2).

biomedres-openaccess-journal-bjstr

Graph 2: Quercetin calibration curve.

Conclusion

The preliminary spectrophotometric analysis of the crude extract of the leaves of the species C. flexuosa showed significant values of phenolic compounds and flavonoids. Therefore, future studies should promote the identification of compounds and/ or structural isolation and characterization, monitored by pharmacological bioassays, aiming to identify the active ingredients in different experimental models of inflammatory, cardiovascular and metabolic diseases.

For More Articles: Biomedical Journal Impact Factor: https://biomedres.us