Biomedical Journal of Scientific & Technical Research (BJSTR) is a multidisciplinary, scholarly Open Access publisher focused on Genetic, Biomedical and Remedial missions in relation with Technical Knowledge as well.
Author: biomedicalopenaccessjournals
The only motto of Biomedical Journal of Scientific & Technical Research (BJSTR) Publishers is accelerating the scientific and technical research papers, considering the importance of technology and the human health in the advanced levels and several emergency medical and clinical issues associated with it, the key attention is given towards biomedical research. Thus, asserting the requirement of a common evoked and enriched information sharing platform for the craving readers.
BJSTR is such a unique platform to accumulate and publicize scientific knowledge on science and related discipline. This multidisciplinary open access publisher is rendering a global podium for the professors, academicians, researchers and students of the relevant disciplines to share their scientific excellence in the form of an original research article, review article, case reports, short communication, e-books, video articles, etc.
Bio-Filtration as a Solution for the Detrimental Health Effect of Excess Fluoride in Drinking Water
Introduction
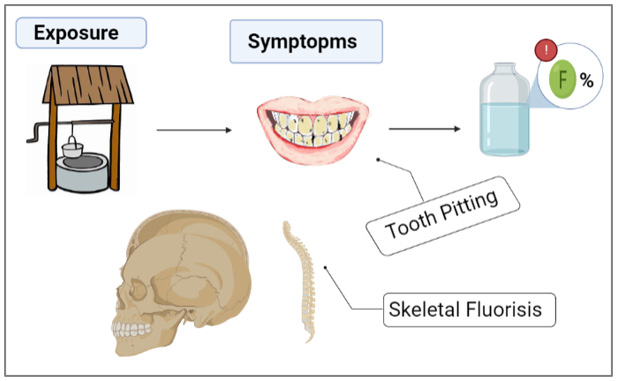
One of the main importance of water filtration is to prevent water-related illnesses and diseases. To this day, various explored methods were used in the remediation of water of different types of contaminants such as flocculation [1,2], coagulation [3], solventextraction [4], co-precipitation [5], precipitation [6], ion-exchange [7], photo catalysis [8], adsorption-desorption [9], reverse-osmosis [10], nano-membrane filtration [11]. The adsorption technique is considered one of the attractive and commercial options to eliminate of the most pollutant substances whether macro- or micro- organic/inorganic ions from water, due to its simplicity of steps and high activity. Moreover, the purification of water by using adsorption technique has been applied to several matter as absorbent such as agricultural residues and industrial residues, and biomaterials wastes, which are modified and applied in biosorption of contaminants from water [7,9-12]. Fluoride is an ionic form of fluorine and can be found in food and numerous sources of drinking water. It can be also purchased as a dietary supplement [12]. Many kinds of toothpastes contain fluoride because these ions serve as an armor against tooth decay [13]. Approximately 80% of the fluoride taken orally is absorbed. Humans retain around 50% of the fluoride they consume, and most of this amount is deposited in teeth and bones (Graphical Abstracts 1 & 2). The remaining 50% is excreted in the urine.
Graphical Abstract 1: Problem statement.
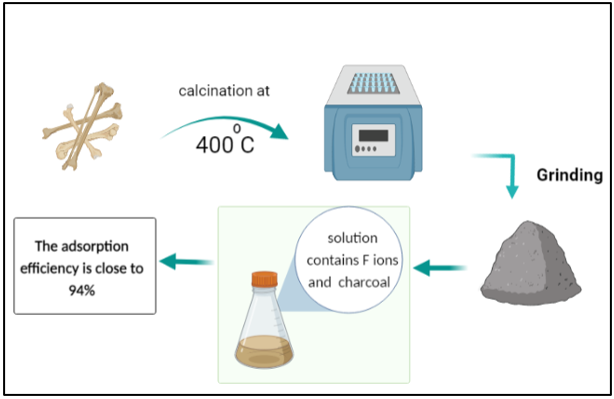
Graphical Abstract 2: Solution.
However, young children can retain an especially high percentage of the consumed fluoride, because their bones and teeth absorb more fluoride than those of adults [14]. The principle and mechanism of pollutants removal by adsorption technology from different types of water based on forms layer of condensate pollutants (called adsorbate) which is migrated from aqueous solution to the surface of solid (called adsorbent) as either in the form of liquid-solid interface [11,15]. Excess fluoride is harmful to human health. Groundwater wells worldwide have been reported to contain water with fluoride concentrations exceeding the acceptable level of 1.5 mg/L. This fact was attributed to local ground stones exhibiting high percentages of fluoride in their composition [14]. Excessive fluoride consumption can lead to several health issues, such as skeletal fluorosis, a disorder marked by bone and joint pain as well as joint tenderness. The overconsumption of fluoride during the formative years of tooth enamel can also lead to dental fluorosis, which leads to tooth discoloration, and/or tooth pitting [15]. Many researchers have attempted to develop water filtration strategies to lower the levels of fluoride or metals that contaminate water [16]. Biomaterials have shown great promise in water filtration because of their environmentally favorable properties, high filtering efficiency, and low cost [17].
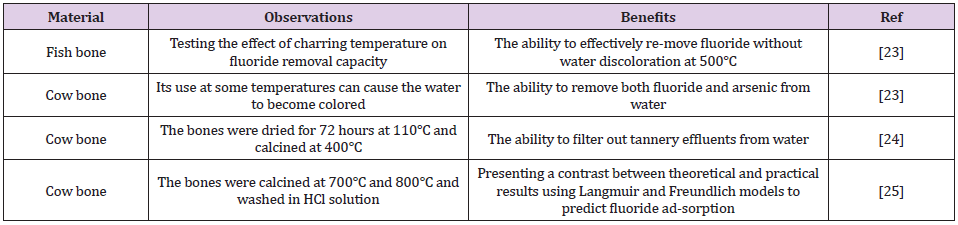
Charcoal, which may be manufactured from a variety of biomaterials, is one of the most commonly used bio-filters. Water contaminated with heavy metals can be treated using different processes, which include ion exchange, precipitation, reverse osmosis, catalysis, coagulation, and adsorption [18,19]. Heavy metal adsorption is dependent on the nature of the adsorbents, which can be composed of natural or man-made mate-rials including clay [10], sludge [11], industrial waste, activated carbon, and plants [12]. Bone char is an adsorbent made up of 90% calcium phosphate and 10% carbon. It can be created using one of the two methods: treatment with chemicals and physical treatment leading to carbonization of bones [20,21]. Cow bone char is com-monly used to purify water contaminated with heavy metals, as shown in (Table 1). The aim of the current study was to produce a lowcost, effective, and environmentally friendly biochar adsorbent from cow bone through physical activation (carbonization), and subsequently use it to remove fluoride from the polluted water [22]. Furthermore, it was also proposed to enhance this bio-filter by adding nanocomposites. Nanocomposites have very high surfaceto- volume ratios, which makes them ideal components for the adsorption process [23,24].
Table 1: Bone charcoal use based on the literature review.
Experiments
Cow bones were collected and processed by rinsing them several times with hot water to remove residual muscles and other joint tissues. Then the bones were allowed to dry in the open air. The dried bones were calcined in a furnace for 1 h at 400°C. The resultant charcoal adsorbent was crushed using a gate mortar and stabilized for further testing. It can be stated that the filters were produced with little to no expenses. A stock solution of CaF2 with a 100-ppm concentration of fluoride was prepared to test its adsorption in the cow bone sample. First, 1 g of charcoal was added to the 100 mL solution in a separate beaker, which was then placed in a shaker operated at room temperature and a 251 min-1 frequency for 5 h. Next, on the same day, the solution containing cow bone charcoal was filtered from impurities and charcoal leftovers using filter paper to prepare a sample for ionic chromatography (IC) [25]. IC was utilized for determining the concentrations of calcium and fluoride ions in the prepared CaF2 solution. Ion chromatographs can measure concentrations of important anions such as fluoride, chloride, nitrate, nitrite, and sulfate, as well as major cations such as lithium, sodium, ammonium, potassium, calcium, and magnesium in the parts-per-million (ppm) range. Ion chromatography can also be used to determine the concentrations of organic acid [26].
The surface structure of cow bone charcoal was studied by using a scanning electron microscope (SEM) (Model: JSM-7100F) at 10000 × magnification [27]. In conjunction with SEM, the energy dispersive X-ray (EDX) analysis technique was used to perform the elemental analysis and chemical characterization of the material. EDX utilizes an electron beam that strikes the surface of a conducting sample (placed under SEM) to determine its elemental content [28].
Results and Discussion
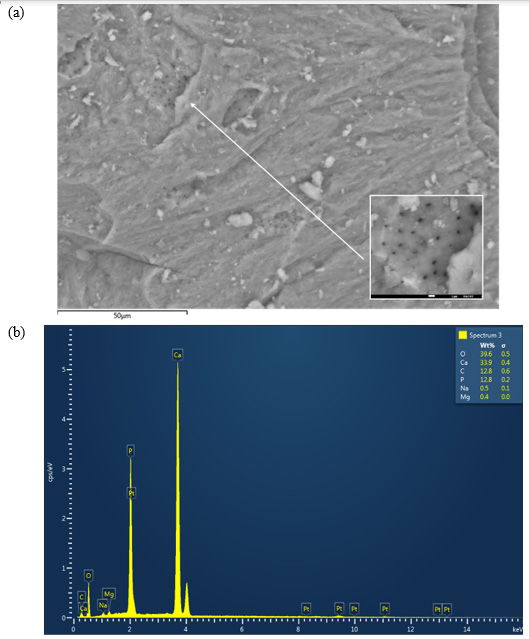
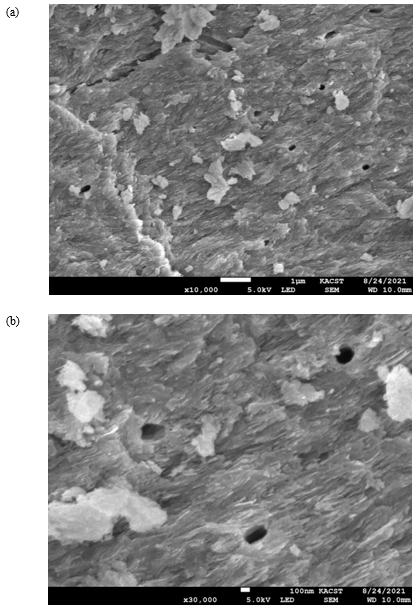
The SEM micrographs of the cow bone biochar explained the sample morphology by analyzing the microstructure of the bone powder, as shown in (Figure 1a). The corresponding EDX graph is presented in (Figure 1b). A close look at (Figure 1a) reveals cracks and irregular surfaces, as expected after grinding, where Vickers hardness can be determined (it is planned to be measured in the upcoming study). Furthermore, SEM micrographs showed that the studied samples had several heterogeneous porous layers, which represent a key feature relevant for fluoride adsorption. The pores appeared to be localized symmetrically in certain regions in the grooves on the surface of the bone. The sample composition revealed by EDX results was as follows: O2, 39.6 wt%; Ca, 33.9 wt%; C, 12.8 wt%; P, 12.8 wt%; Na and Mg, 0.9 wt%.
Figure 1: (a) Scanning electron microscope (SEM) micrograph of the cow bone charcoal shows several groups of symmetrically distributed pores. (b) The corresponding energy dispersive X-ray (EDX) graph of the bone constituents.
The surface morphology of the cow bone is particularly distinctive in terms of the hard appearance and the distribution of pores, which are of critical importance in filtering large species from water (Figure 2). Hence, the surface geometry and the source of adsorbent provided different types of active sites onto surface of adsorbent [29-35] (Table 2).
Figure 2: (a) SEM micrograph of cow bone charcoal shows symmetrically distributed pores on the surface (red arrows) with diameters in the range of several hundred nanometers, as shown in (b).
Table 2: The effect of bio-filtration with cow bone charcoal on fluoride removal.
Conclusion
The examined cow bone charcoal filter achieved maximal fluoride adsorption of 93.6%, which can be attributed to its porous nature. The prepared bio-filter has a very high adsorption capacity and is energy-efficient as it works at room temperature and does not require energy consumption. It means that using cow bone charcoal is a cost-effective filtration technique that should be further investigated to optimize the performance of nanocomposites and to set up measures for its widespread manufacturing.
Supplementary Materials
N/A.
Author’s Contribution
Alasmari, E, M, carried out experiments and engaged in various article-related tasks. Alsharif, S. H. performed the experimental measure-ments. Khayyat, M. M. designed the experiments and prepared the final version of the manuscript.
Funding
This work was performed as part of the joint program of KACST and Mohiba ITHRAA 2021.
Data Availability Statement
The obtained results have been presented in the cur-rent article, and any further details can be provided upon request made to the cor-responding author.
Acknowledgment
The authors would like to thank Dr. Saeed M. Alshehri, the director of MSRI, KACST, for his kind support throughout the project.
Conflicts of Interest
The authors declare that the research was conducted in the absence of any commercial or financial relationships that could be construed as a potential conflict of interest.
Research of Associations of Polymorphisms p53 and p21 with the Risk of the Carcinogenesis gastric
Introduction
The Preservation of sustainable growth of gastric carcinoma rates, low detectability at preventive examination, prove the relevance of a problem and prove the need of searching new approaches to prevention and early diagnosis of this tumor. The conception of formation of groups of high oncological risk and carrying out targeted medical examination in these groups, are capable to provide positive dynamics in prevention of malignant tumor of stomach. Variability of the functional activity of the considered genes is caused by a genetic polymorphism [1]. Now more than 30 polymorphisms of a gene p53 are known. The modern researches are devoted generally to assessment of an exonic polymorphism of G215C (changing the amino-acid sequence of protein r53) and polymorphisms in the third (dup16in3- duplication of 16 couples of nucleotides) and a pole (replacement of G>A; of A in 61 couple of nucleotides) introns [2].
In foreign and domestic researches it is established that an allele C polymorphism of G215C p53 it is associated with the risk of development of ovarian carcinoma [3], carcinoma of lung [2], an alternative genotype-with the increased risk of developing of a breast cancer [4]. Data on existence of associative connection between polymorphic G215C options of the gene p53 and the gastric carcinoma are contradictory. So, H Shen & coworkers [5] and M Cañas & coworkers [6] are shown the connection of risk of development of the gastric carcinoma with a carrier statealleleArg. In works of other scientists the association of risk of development of the given oncopathology with carrier state of Pro/Pro genotype at the Korean population [7, 8], and also with a carrier state of genotypes of Arg/Pro + Pro/Pro in the Chinese population [9]. The gene p21 is localized in site 6p.21.2 and represents an inhibitor of the cycline-dependent kinase playing an important role in a stop of a cell-like cycle [10,11].
Results of researches of polymorphic variants of a gene p21 are not numerous and mainly devoted to assessment of one polymorphism of C98A localized in Codonum 31 and causing replacement of Ser by Arg in the amino-acid sequence of protein. In 5 promoter of the gene p21 polymorphic sites of A1026G and G369C which also have the functional value as polymorphisms in the pro-motor sequences are capable to lead to reduction of speed and frequencies of acts of initiation of synthesis of RNA, and as a result, to decrease in an expression of the gene are presented. These literatures concerning the gene expression p21 at tumors of various localizations are ambiguous: the colorectal carcinoma, cervix carcinoma, head and neck carcinoma and small cell carcinoma of lung connect with decrease, and a prostate gland carcinoma and breast cancer, on the contrary, with increase in an expression of the gene of p21 [12].
In Kuznets ova IU [2] research and coworkers it is established that an allele A, the genotype of AA of a polymorphism of A1026G and an allele C polymorphic variantG369C of the gene p21 are associated with increase in risk of development of carcinoma of lung. In Chen Z work et al. [6] it is shown that the heterozygous genotype 9T/11T in promoter area of the gene of p21 (rs4135235) is potential risk factor for the gastric carcinoma in the Chinese population. The researches devoted to correlation assessment between polymorphisms in the pro-motor region of the gene p21 and the risk of development of the gastric carcinoma in Caucasian population in the modern literature practically do not meet. In this regard essential value assessment of polymorphic variants of regulator genes of a cell cycle p53 G215C and p21 A1026G and G369C at the patients with gastric carcinoma [13]. The goal of research: to estimate distribution of polymorphic variants of genes p53 G215C and p21 A1026G and G369C at the gastric carcinoma [14].
Methodology
The work is carried out on exemplars of operational material (Histologically the verified locuses of tumoral tissue) 200 patients (75 women and 125 men, average age of 56±9 years) with the diagnosis of the gastric carcinoma. The group of comparison was made by 260 healthy donors, with comparable characteristics on gender and age, without oncological pathology, chronic inflammatory processes, and autoimmune, heritable and mental diseases. Considering genetic heterogeneity on p53 and p21 in various populations the research included individuals only of the Caucasian origin. For receiving the genomic of DNA use the commercial set of “FF-PET DNA kit” (Qiagen, Germany) Beforehand carried out dew axing of exemplars of operational material.
DNA from leukocytes of blue blood which was taken away single-passly prior to treatment, allocated with a standard method (set “DNK-sorb-AM”, Federal State Institution of Science “CNIE” of Russia Federal Consumer Rights Protection and Human Health Control Service, Moscow). Typing of the allocated DNA samples by polymorphic options of genes r53 G215C, r21 A1026G and G369C carried out by method of a polymerase chain reaction in the mode of “real time” with hybridizationaly-fluorescent detection, using the oligonucleotide of primers and probes [2] corresponding steam. An inspection of a hypothesis of reliability of distinctions between the studied groups was carried out with use of criterion χ ² Pearson (at value of absolute frequencies more than 10) and Fischer’s criterion (at value of absolute frequencies less than 5). The association between risk of development of a disease and determined by genotypes was estimated, counting the relation of chances (OR).
Results
The analysis of polymorphic G215C options of a gene r53 allowed to establish that patients with cancer of a stomach have an occurrence frequency allele C (23,35%) was higher (p=0,001), than at healthy faces (14,62%). Genotypes of GC and CC (22,50 and 12,00% respectively) at patients with cancer of a stomach were registered on average by 1,6 times more often than in group of monitoring (14,62 and 7,31% respectively). The risk of development of malignant new growths of a stomach for healthy carriers allele C polymorphic locus of G215C of a gene p53 increases in 1,7 (CI95%1,25-2,51), at GC genotype carriers-in 1,8 (CI95%1,10-3,07), CC-by 1,9 times (CI95%0,99-3,90). Studying of distribution of polymorphic G1026A variants of a gene p21 showed that at patients with cancer of a stomach the frequency of occurrence of a homozygous genotype of AA (15,50%) exceeded that at healthy faces (6,54%) more than twice [15]. Frequency of occurrence “pathological” allele A of a gene p21 was 1,5 times higher than G1026A at patients with the gastric carcinoma, than a similar index at healthy faces (32,25 and 20,96% respectively).
At healthy individuals of carriers аллеля And polymorphic G1026A option of a gene r21 the risk of development of a carcinoma of the stomach increased by 1,8 times (CI95%1,32-2,44), at GA genotype carriers-in 1,5 (CI95%0,96-2,27) and AA genotype-by 3 times (CI95%1,52-5,99) [16]. The analysis of the polymorphic site of G369C of a gene r21 showed statistically significant increase in frequency of occurrence minor allele C at patients with cancer of a stomach. Frequency of occurrence of a genotype of CC at patients with cancer of a stomach was 3 times higher, than at healthy faces. Assessment of a risk significance showed that at carriers allele the C risk of development of a carcinoma of the stomach increased in 1,8 (CI95%1,25-2,55), a genotype of CC – by 3,3 times (CI95%1,39- 8,18).
Conclusion
Results of the conducted research allow drawing the conclusion that the risk of development of the gastric carcinoma is associated with a carrier stateallele C, genotypes of CC and GC of polymorphic locuses G215C of a gene p53 and gene G369C p21, and also allele A and genotypes of AA and GA of polymorphic A1026G option of a gene p21. Formation of groups of high oncological risk on the basis of the analysis of polymorphisms of genes p53 G215C, p21 A1026G and G369C will allow to increase considerably effectiveness of oncological medical examination of the population and to improve early diagnostics of the gastric carcinoma.
Correlation of Hepatitis B Virus Surface Antigen Titer with Hepatitis Delta Virus Replication Level and Histological Activity in Chronic Hepatitis D
Introduction
Chronic hepatitis delta (CHD) is a serious cause of viral hepatitis throughout the world, with high morbidity and mortality rates [1-3]. Estimates suggest that 15-20 million people worldwide have been infected by hepatitis delta virus (HDV). In Turkey, HDV remains a serious health problem, with epidemiologic studies in East and Southwest Anatolia regions showing delta super infection in 9-58% of HBV infected individuals [4]. HDV was first isolated in 1977 from the hepatocytes of hepatitis B virus (HBV) surface antigen carriers (HBsAg) as a nuclear antigen that differed from HBsAg, core (HBcAg) and e (HBeAg) antigens [5,6]. HDV is a defective virus, requiring the HBV envelope proteins, but can replicate within cells in the absence of HBV [7]. HBsAg, however, is required not only for HDV infectivity [8].but also for its packing and extracellular release [9]. Treatment of CHD is complicated by features of HDV. For example, many other viruses encode the enzymes related to their replication and development. Thus, viral replication can be inhibited by inhibiting the synthesis or activity of these enzymes. HDV, however, encodes only HDV RNA-dependent ribosome, with other enzymes involved in viral replication being cellular enzymes. Treatment of CHD should be related to the structure and life cycle of HDV and its relationships with HBV.
Serum HBsAg concentrations are indirect indicators of intrahepatic covalently closed circular (ccc)-DNA concentrations. Since HDV requires HBsAg for virion formation, CHD may be treated by eliminating HBsAg. Administration of the nucleoside analog (NA) clevudine to woodchucks chronically infected with HDV reduced HDV RNA synthesis, with viremia controlled through decreased cccDNA formation [10], thus confirming the importance of HBsAg concentration to HDV viremia. We therefore investigated the relationships between quantitative serum HBsAg and HDV RNA levels and the histopathology and biochemical characteristics of CHD patients, as well as comparing their HBV DNA and HBsAg concentrations.
Materials and Methods
Study Population
We assessed 46 patients with CHD and 87 with chronic hepatitis B (CHB), including 33 who were HBeAg positive and 54 who were HBeAg negative; all patients were treated and followed up at our outpatient clinic between 2005 and 2009. Patients were included in the study if they were > 18 years of age, were positive for HBsAg and HBV-DNA (<2000 IU/mL) for ≥ 6 months or were positive for anti-HDV antibody and HDV-RNA for ≥ 6 months, and had elevated (≥2-fold) serum alanine aminotransferase (ALT) concentrations for at least 6 months. In addition, all patients had liver biopsies, obtained on the same day or within the same week that biochemical tests were performed, showing results consistent with chronic hepatitis. Patients with chronic delta hepatitis were excluded if they had any history of antiviral drug use; had any concomitant autoimmune, metabolic or viral chronic liver disease or co-infections, as shown by positivity for autoantibody, anti-HAV IgM, anti-HCV, or anti-HIV. Patients were also excluded if they had decompensate liver cirrhosis (Child B and C stages) or could not undergo liver biopsy; if they had substance addiction and/or alcohol use (> 20 g/day for females,> 30 g/day for males); if they had a concomitant malignancy, including heap to cellular carcinoma; if they had a history of organ transplantation; or if they did not sign the informed consent form. Written informed consent was obtained from each subject following a detailed explanation of the objectives and protocol of the study which was conducted in accordance with the ethical principles stated in the “Declaration of Helsinki” and approved by the institutional ethics committee.
Virological Evaluation
Blood samples were taken from each patient on the day of liver biopsy; at least 0.5 ml of serum was stored in Eppendorf tubes (Eppendorf, Italia srl, Milano, Italy) at -80°C until assayed.
HBsAg Quantification
Serum HBsAg concentrations were quantified using an ARCHITECT i2000 SR device and ARCHITECT HBsAg (Abbott Diagnostics, Wiesbaden, Germany) kits. This chemiluminescence microparticle immunoassay (CMIA) of HBsAg in serum and plasma had a confirmation limit of 0.05-250 IU/ml. Samples with HBsAg concentrations higher than 250 IU/ml were diluted 1:500 and, if necessary, 1:1000, as described in the ARCHITECT HBsAg kit protocol [11].
HBV DNA Determination by Real Time PCR
DNA was isolated from the serum samples stored at -80°C using QIAamp DNA mini kits (QIAGEN, Hilden, Germany). HBV DNA was measured using HBV Rotor Gene (HBVRG) PCR kits and Real Time PCR. A 110 bp fragment was amplified using the primers, 5’-GACCACCAAATGCCCCTAT-3’ (forward) and 5’-CCRAGAYYGAGATCTTCTGCGAC-3’ (reverse), which included R and Y markers. Amplification reactions were performed in 30 μl HBV RG master mix (tampon, dNTP, primer, probe and enzyme) and 50 μl reaction mixtures containing 20 μl templates DNA. The amplification protocol consisted of an initial denaturation at 95°C for 10 min, followed by 45 cycles of denaturation at 95°C for 15 seconds, annealing at 55°C for 30 seconds, and extension at 72°C for 15 seconds in a Rotor Gene 2000 device [12]. The copy limit of the test was 26 copies/ml. To prevent contamination, all pupating procedures were performed in laminar flow cabinets and separated chambers and using filtered pipette tips [13].
HDV RNA Determination by Real-time PCR
RNA was isolated from the serum samples stored at -80°C using QIAMP Viral RNA mini kits (QIAGEN, Hilden, Germany). Viral RNA was transcribed to cDNA using the Primer Design Precision Reverse Transcription kit. Each reaction mixture of 20 μl contained 10 μl RNA and 10 μl of cDNA master mixture (dNTP, MMLV 5X buffer solution, MMLV enzyme, and primer mixture) and was incubated for 1 hour at 42°C. The cDNAs were stored at -20°C until PCR was performed. HDV RNA was measured using Real-Time PCR quantification kits for HDV (Primer Design, Southampton, Hants, UK), which contained primers and probes showing 100% homology with all reference sequences in the phylogenetic tree of HDV.HDV RNA PCR was performed using nested PCR [14], with the first step using the primers 5’-GCCCAGGTCGGACCGCGAGGAGGT-3’ and 5’-ACAAGGAGAGGCAGGATCACCGAC-3’ and the second step using the primers 5’-GAGATGCCATGCCGACCCGAAGAG-3’ and 5’ GAAGGAAGGCCCTCGAGAACAAGA-3’. The PCR products were electrophoresis in 2% agarose gels, with the presence of a 405 bp band defined as positive for HDV RNA. The cut-off value for HDV RNA was 100 copies/mL. Primer and probe mixtures were prepared according to the Taqman principle. During replication, the forward primer for pathogen DNA/cDNA was hybridized with the reverse primers. The Taqman system utilized probes with a reporter fluoro chrome (FAM) at the 5’ end and an inhibiting fluoro chrome (TAMRA) at the 3’ end; these probes bound to the region between the primer binding regions on single stranded target molecules. As hybridization between the probe and targeted molecule continued, the signal from FAM was inhibited by TAMRA.
When primer elongation, initiated after the binding of primers to the targeted nucleic acid, reached the probe binding point, the probe was degraded from the 5’ end by the 5’-3’ nuclease activity of the Taq DNA polymerase. This freed the reporter fluoro chrome and initiated signaling, with the degree of signaling proportional to the amount of amplicon produced during each cycle [12]. The kit included a positive control, in which the concentration of the target sequence was 2×10⁷ copies/ ml. This sample was serially diluted to 2×10⁶ copies/ml, 2×10⁵ copies/ml, 2×10⁴ copies/ml, and 2×10³ copies/ml to obtain standard curves for the quantitation of HDV RNA in the serum samples.
Histopathologic Evaluation
All biopsy specimens were evaluated by a single specialist pathologist (M.G.), using the modified Knodell Ishak Scoring System for staging and grading [15]. Stage 3 and/or 4 (presence of bridging fibrosis) was defined as severe fibrosis, and stage 5-6 was defined as cirrhosis. For histological activity indexing, samples with 0-7 points were grouped as having minimal/mild activity and those with 8-18 points were grouped as having moderate-severe activity [16].
Statistical Analysis
All statistical analyses were performed using SPSS 11 version (SPSS Inc, Chicago, IL, USA). Virologic parameters, including HBsAg, HBV DNA and HDV RNA concentrations were converted to log10 using Microsoft Office Excel 2007. Results were expressed as mean ± SD or, when appropriate, as medians. Independent groups were compared using t-tests, continuous variables using the Mann- Whitney U-test, and categorical variables using Pearson’s χ2 test and Pearson correlation coefficient. One-way ANOVA was used for comparisons of more than two groups. ROC curves were used to compare diagnostic results of continuous variables in two groups. P < 0.05 was defined as statistically significant.
Results
Characteristics of Patients
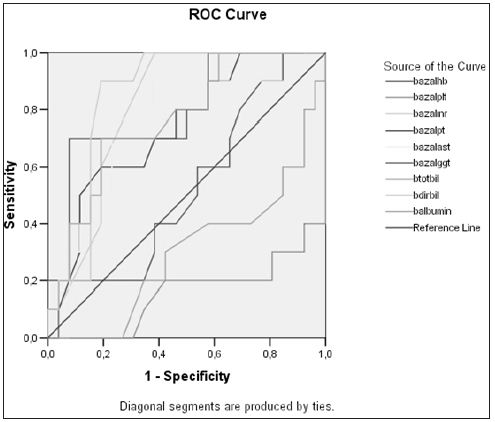
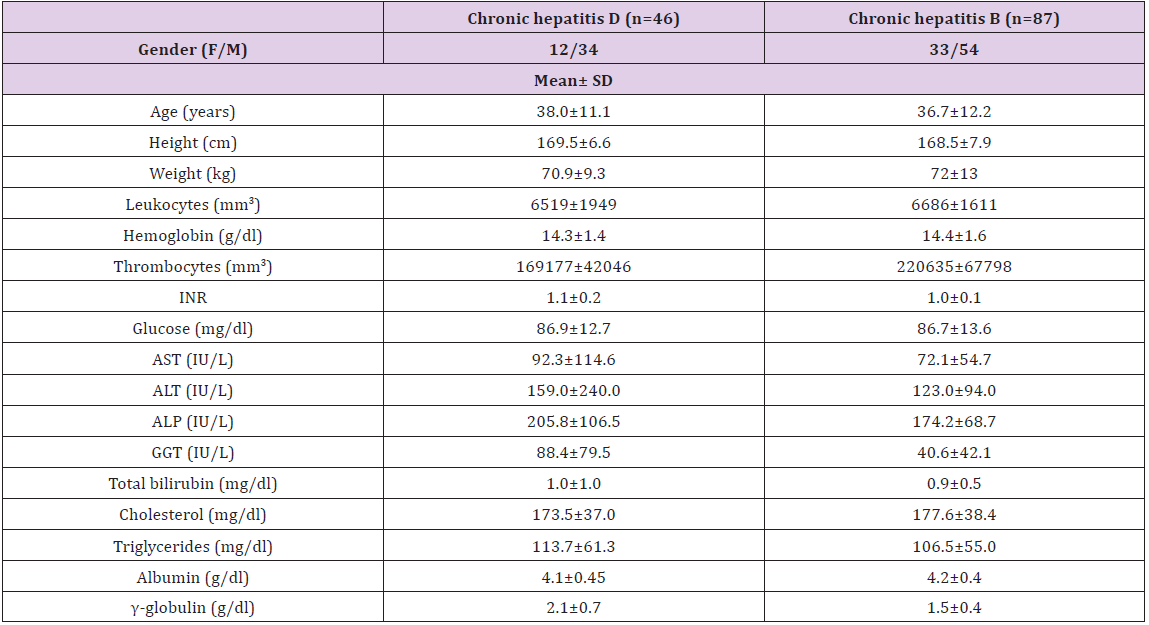
We assessed a total of 133 patients, of mean age 37.2 ± 11.8 years (range, 17- 63 years), including 45(34%) females and 88 (66%) males. Of the 133 patients, 46(34.6%), [12(26%) females and 34 (74%) males], had CHD, and 87 (65.4%), [33 (38%) females and 54 (62%) males], had CHB. Of the 46 patients with CHD, 34 (74%) were precirrhotic and 12 (26%) were cirrhotic. Of the 87 patients with CHB, 33 (38%) were positive and 54 (62%) were negative for HBeAg, with 80 (92%) being precirrhotic and 7 (8%) cirrhotic. The demographic and biochemical characteristics of these patients are summarized in Tables 1. We found that the thrombolytic count was significantly lower (p= 0.001), while the GGT (p= 0.001) and γ-globulin (p=0.001) concentrations and INR (p= 0.04) were significantly higher, in patients with CHD than in those with CHB. When we assessed the 46 patients with CHD, we found that mean serum albumin concentration and thrombolytic counts were lower, and that INR and concentrations of AST, GGT, and total and direct bilirubin values were higher, in the 12 patients with than in the 34 without cirrhosis. In analyzing the factors predictive of cirrhosis in CHD patients, we found that low serum albumin concentration, low thrombolytic count, PT elongation, increased INR, increased serum total and direct bilirubin concentrations, and increased AST and GGT were predictive. ROC curves showed that an AST upper limit of 60 IU had a sensitivity and specificity of 70% and that a GGT upper limit of 70 IU had a sensitivity and specificity of 81% in predicting cirrhosis (Figure 1).
Figure 1: Parameters predictive of liver cirrhosis in patients with chronic hepatitis delta infection.
Table 1: Demographic and biochemical characteristics of patients with Chronic Hepatitis B and Chronic Hepatitis D.
Virologic and Histopathologic Evaluation
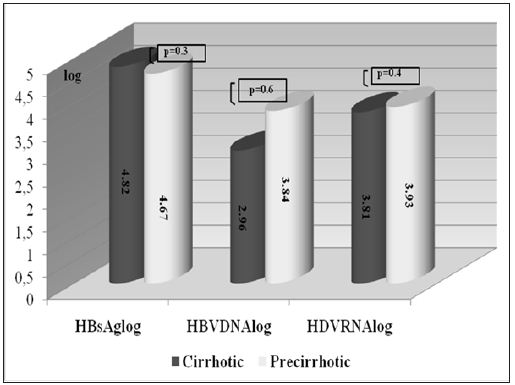
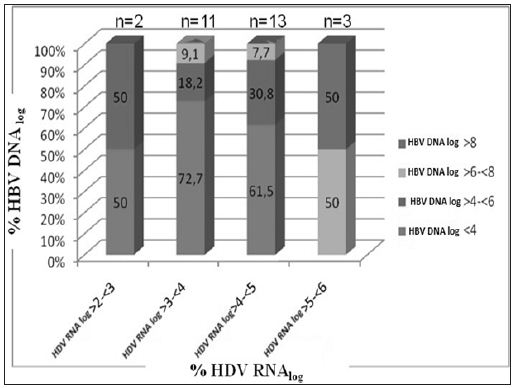
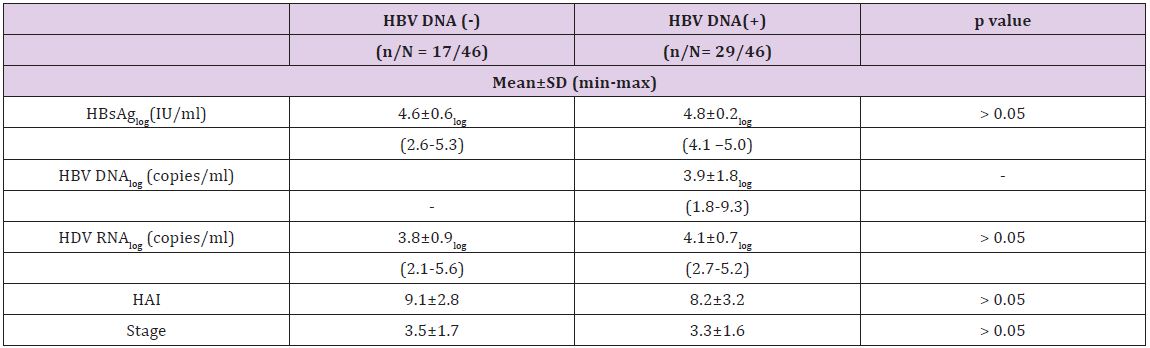
The mean log HDV RNA concentration in patients with CHD was 4.0 ± 0.8 and the mean log HBsAg concentration was 4.7±0.4. We observed a significant positive correlation between HDV RNA and HBsAg concentrations (p = 0.043 and r=0.3). There was no correlation, however, between serum HDV RNA level and serum AST (p=0.39 and r=0.13) or ALT (p=0.30 and r=0.15). Moreover, there was no correlation between HDV RNA concentrations and histological activity (p=0.99, r=0.01), with the mean log HDV RNA concentrations in the groups with minimal (HAI index 0-7 points) and moderate-severe (HAI 8-18 points) activity of 4.0±0.6 and 4.0±0.9, respectively. Likewise, there was no correlation between serum HDV RNA concentration and fibrosis stage (p=0.37, r=-0.13). When we divided patients with CHD into pre-cirrhotic and cirrhotic groups, we found that they had similar virologic parameters (Figure 2). Of the 46 patients with CHD, 17 were negative for serum HBV DNA (< 26 copies/ml), whereas the other 29 were positive (Table 2). The mean serum HDV RNA concentrations were 46563±101239 copies/ml (range 133–359044 copies/ml) and 32036±42556 copies/ml (range 460–154811 copies/ml), respectively, with logarithmic means of 3.8± 0.9 (range 2.1–5.) and 4.1±0.7 (range 2.7– 5.2), respectively (p>0.05). The mean serum HBsAg concentrations were 55416±42608 IU (range 400 – 171030 IU) and 66775±25324 IU (range 18415–116265 IU), respectively, with logarithmic means of 4.6±0.6 (range 2.6-5.3) and 4.8±0.2 (range 4.1–5.0), respectively (p>0.05).The mean HBV DNA concentration in the 29 CHD patients positive for HBV DNA was 72064638 ± 382515197 copies/ml (range 59-2060821400 copies/ml), with a logarithmic mean of 3.9±1.8 (range 1.8-9.3). There was no correlation between serum HBV DNA and HBsAg titers in these CHD patients positive for HBV DNA (p= 0.61, r=-0.98) or between HBV DNA concentrations and HAI (p=0.53, r=-0.8). The fibrosis scores of CHD patients positive and negative for HBV DNA were similar (3.5±1.7 vs. 3.3±1.6, p= 0.6). Similarly, HDV RNA concentration was not correlated with necroinflammatory activity or fibrosis score. Patients with CHD whose HBV-DNA’s positive were subdivided into two (as (<10000 copy/ml and ≥ 10000 copy/ml) and investigated in terms of basal ALT, necroinflammatory activity and fibrosis. Although each of three parameters was higher in the group with HBVDNA level of ≥ 10000 copy/ml, this difference did not suggest any significance when statistically evaluated (p > 0.05). When we assessed HDVRNA and HBV DNA concentrations in patient’s positive for both, we found that low HBV viremia (< 4 log) was usually accompanied by high HDV viremia (Figure 3).
Figure 2: Comparison of viral markers in patients with chronic hepatitis delta.
Figure 3: Distribution of serum HDV RNA and HBV DNA concentrations in patients with chronic hepatitis delta (n= 29, when HBV DNA negative cases were excluded).
Table 2: Virologic and histopathologic characteristics of patients with chronic hepatitis D and positive or negative for HBV DNA.
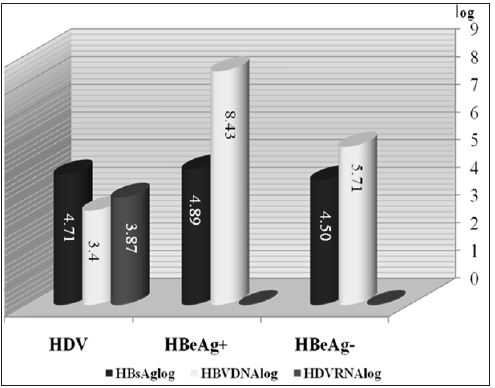
We found that mean HAI was higher in CHD patients negative than positive for HBV DNA, but the difference was not statistically significant (9.1±2.8 vs. 8.2±3.2, p=0.17). Of the 17 CHD patients negative for HBV DNA, 5(29%) had HAIs of 0-7 points and 12(71%) had HAIs of 8-18 points. In comparison, of the 29 CHD patients positive for HBV DNA, 12(41%) had HAIs of 0-7 points and 17(59%) had HAIs of 8-18 points (Table 2) and (Figure 3). Serum ALT, AST, ALP and GGT concentrations were similar in CHD patients positive and negative for serum HBV DNA. We found that the mean HBsAg concentration was significantly higher in CHB patients positive than negative for HBeAg (p=0.001), but was similar in CHB patients positive for HBeAg and CHD patients (p = 0.42). Similarly, HBsAg concentrations were significantly higher in patients with CHD than in CHB patients negative for HBeAg (p = 0.006) (Figure 4). In the patients with CHB, we observed a positive and moderate correlation between serum HBV DNA and HBsAg concentrations (p=0.002, r=0.33). When we assessed histological characteristics, we found that mean HAI (8.5±3.0 vs. 6.1±2.8, p=0.001) and mean fibrosis stage (3.4±1.6 vs. 2.3±1.3, p=0.001) were significantly higher in CHD than in CHB patients. Among the 46 patients with CHD, 23(50%) had severe fibrosis (stage 3-4) and 11(24%) were cirrhotic (stage 5-6), with only 12(26%) having stage 1-2. In contrast, of the 87 patients with CHB, 58 had early stage fibrosis (stage 1-2), 22 (25%) had stage 3-4 and only 7(8%) were cirrhotic (stage 5-6).
Figure 4: Virologicmarkers in patients with chronic hepatitis B and chronic hepatitis delta.
We also compared the demographic, biochemical, virologic and histopathology characteristics of CHB patients positive and negative for HBeAg. We found that the mean ages of these groups were 31.4±11.8 years (range 18-58 years) and 40.1±11.4years (range: 17-63 years), respectively, showing that patients positive for HBeAg were significantly younger (p= 0.001). The mean weight of these patients also differed significantly (67.5±13.6 kg vs. 74.7±12.8 kg, p= 0.01). Median thrombolytic counts were higher in the HBeAg positive than in the HBeAg negative group (237500 vs. 207000, p= 0.02), but there were no other differences in biochemical characteristics. Mean log serum HBV DNA (8.40±1.51 vs. 5.66±1.55, p= 0.001) and HBsAg (4.8±0.4 IU vs. 4.5±0.5 IU, p=0.001) titers were significantly higher in HBeAg positive than in HBeAg negative patients. In contrast, mean HAI (6.1±2.7 vs. 6.08±2.9) and mean fibrosis stage (2.4±1.4 vs. 2.2±1.3) were similar in the two groups.
Discussion
We have compared the demographic, biochemical, virologic and histopathology characteristics of CHB and CHD patients naïve to treatment; to our knowledge, this is the first such study to compare virologic parameters quantitatively in these patients and to assess the relationships between virologic and histopathology characteristics. Although we observed a correlation between serum HDV RNA and HBsAg concentrations, we observed no relationship between HAI and fibrosis stage. Serum HBsAg concentrations were higher in HBeAg positive than in HBeAg negative CHB patients, but were similar in HBeAg positive CHB and CHD patients. HBV viremia was not detected in 37% of the patients with CHD, whereas 59% of CHD patients positive for HBV had low HBV titers (< 4 log HBV DNA copies/ml). However, there was no inverse correlation between HBV DNA and HDV RNA concentrations. In patients with CHD, biochemical parameters for cirrhosis included increased AST, GGT, γ-globulin, and total bilirubin concentrations, and decreased thrombolytic counts and albumin concentrations. Measurements of HDVRNA by qualitative PCR methods do not indicate the exact magnitude of viremia. However, HDV RNA quantification is difficult. HDV RNA has the appearance of a thick rod, due to 70% base pairing in the inner regions of the HDV RNA. This can decrease PCR efficacy, to as low as 83%, by inhibiting DNA synthesis [17]. Since the sequences of HDV types differ by more than 37% [18], the primers and probes chosen for preserved regions (i.e. ribosome’s) may not be suitable for every type. Furthermore, since there is no international standard or control, calibration of quantification is impossible. New-onset real-time PCR systems are very sensitive [19]. And have been employed in a few studies [16,20,21]. In agreement with our findings, one previous study found no correlation between HDV RNA concentrations and histopathological findings [16]. That study, however, evaluated only patients with CHD, not those with CHB.
Importantly, we found that concomitant HBV viremia did not affect biochemical and histopathological parameters in patients with CHD. In contrast, the progression of chronic liver disease was found to be more rapid and severe in patients with concomitant HDV and HBV infection [22]. Our findings are in agreement with studies showing that biochemical and histological findings in patients with CHD were not related to HBV DNA concentrations [16,23]. Moreover, no correlation was observed between HBV DNA and ALT concentrations in patients with CHD, suggesting that liver damage in these patients was mainly caused by HDV, not HBV; infection [2]. Liver damage in patients with CHD was not affected by HBV confection. In contrast, HDV was found not to have direct cytopathic effects, with hepatocellular damage in CHD being immune-mediated [24]. We observed no correlation between serum transaminase and HDV RNA concentrations. Although ALT concentrations were found to be higher in patient’s positive than negative for HDV RNA [25], a later study, in which HDV RNA was measured semi quantitatively, showed no correlation between ALT and HDV RNA [23]. The correlation we detected between serum HBsAg and HDV RNA titers in patients with CHD suggests that HBsAg may be a key to the treatment of CHD. Antiviral agents that decrease HBsAg titer may therefore suppress HDV RNA.A study on 53 patients with CHD showed that HBsAg and HDV RNA titers decreased in parallel in patients responsive to IFNα-2b, but neither was affected in interferon-unresponsive patients [26]. Our results indicate that serum HBsAg may be a marker of HDV viremia in patients with CHD.
HBV and HDV are thought to occur together, with HDV suppressing HBV viremia. Our findings indicated, however, that decreased HBV DNA did not correlate with increased HDV viremia. Many of our CHD patients were negative for HBV DNA or had low titers (< 4 log copies/ml). The low numbers of CHD patients positive for HBV DNA may have caused a discrepancy between low HDV viremia (≥2 and ❤ log) accompanied by somewhat high HBV viremia (≥4 and <6 log) and high HDV (≥5 and <6 log) accompanied by high HBV (≥6 and ≥8 log) viremia. A cross-sectional and longitudinal study of HDVRNA and HBVDNA in 37 CHD patients naive to treatment showed that both viruses had dynamic and complex replication profiles: The cross-sectional evaluation showed that both viruses were replicative in 15 patients (40.5%), HDV alone was replicative in 12 (32.4%), HBV alone was replicative in 6 (16.2%), but both were inactive in 4 (10.8%). Longitudinal evaluation, however, showed that HBV replication increased in the presence of HDV replication [24].
In conclusion, we found that HDV viral load correlated with HBsAg titer, but not with histological, activity, fibrosis stage, or HBV viremia. Our findings indicate that CHD is a more serious disease than CHB.
Genetic Variability, Heritability and Correlation Study of Physiological and Yield Traits in Relation to Heat Tolerance in Wheat (Triticum aestivum L.)
Introduction
Wheat (Triticum aestivum L.), a cereal grass of Graminae (Poaceae) family and of the genus Triticum, is the world’s largest cereal crop. It has been described as the ‘King of Cereals’ because of the acreage it occupies, high productivity and the prominent position it holds in the food grain trade. It occupies an inimitable position in human life as it is the major source of food and energy with a large number of end use products like chapathi, bread, biscuits, pasta and is also a good source of fodder for animals. Wheat is grown on 215.9 million hectares throughout the world, which produces 725.91 million tons of grain [1]. It provides, on an average, one fifth of total calorific input to the world population (FAO, 2008). Wheat in India is grown over an area of 29.86 million ha producing 95.85 million tones [2].
With the enormous increase in the population, the demand for wheat is also increasing such that it is expected that by 2020 the country’s demand for wheat will be 88 million tonnes. Wheat production in recent years has reached a plateau where further increase in productivity and yield is somewhat difficult. The constraints of biotic and abiotic stresses are a greater challenge to the crop scientists and plant breeders. Heat stress is a key abiotic stress affecting crop and cereal production in all regions of the Indian wheat belt [3]. Field data suggests that yield losses can be in the order of 190 kg/ ha for every one degree rise in average temperature and in some situations having a more severe effect on yield loss than water [4,5]. Heat tolerance is a complex phenomenon and difficult to measure. Many selection criteria based on morpho-physiological traits were reported to be associated with performance under heat stress in wheat [6].
Heat tolerant metabolism reported to be indicated by longer leaf chlorophyll retention, canopy temperature depression, photosynthetic rate, leaf senescence. The other traits like biomass, 1000-grain weight and grain yield itself are also highly responsive to heat tolerance. Many investigators reported the traits like high tillering capacity, relatively higher grain weight, acceptable spike fertility, higher spike number, grains per spike, early ground cover etc. to be associated with yield under heat stress and tolerance. High temperature stress in the recent years has been major factor affecting the wheat productivity especially, in the arid and semi arid regions of the world [7]. The earth temperature is constantly increasing. The cultivation of wheat is limited by temperature at both ends of the cropping season. Since plant tolerance to temperature stress is heritable, selection and breeding can be used to improve this trait.
Breeding cultivars with improved tolerance to temperature, however, is a difficult task because of the limited understanding of the genetic and physiological basis of heat tolerance in plants; confounding effects of heat and drought stress; limited understanding of what stages of plant growth can be used as selection criteria and lack of efficient and accurate tests to select for the component physiological mechanisms that give heat tolerance. The relationship between the morpho-physiological traits associated with heat tolerance is very much important in selecting suitable selection criteria for heat tolerance. The association between the traits related to heat tolerance could be better understood through correlation study both at genotypic and phenotypic levels [8]. On the basis of nature and magnitude of genotypic and phenotypic correlations, breeding programs may measure such traits to assist in the selection of heat tolerant genotypes. Therefore, the present investigation was undertaken to examine the relationships between heat tolerant traits and yield.
Materials and Methods
Twenty genotypes were undertaken for assessment of direct selection parameters (variability, heritability, and genetic advance), indirect selection parameter (correlation) and their relation with heat tolerance. This investigation was carried out at the Agriculture Research Farm of Institute of Agricultural Sciences, Banaras Hindu University, Varanasi during the Rabi season of 2011-12 and 2012- 13 in randomized block design with 3 replications. Seeds of each genotype were sown in unit plot size of 3m long with 6 rows 23 cm apart. Standard agronomic practices were adopted for both experiments. Observations were recorded on grain yield and its related traits, viz., days to heading, days to anthesis, days to maturity, grains per spike, 1000-grain weight. Besides these, chlorophyll content at heading and at anthesis stages by Minolta SPAD-502 chlorophyll meter as well as canopy temperature depression (CTD) was measured by using a hand held infrared thermometer based equipment (Sixth Sense LT-300) from vegetative stage to dough stages were studied.
Data were recorded on five random plants from each entry per replication for all the above mentioned traits except CTD, where single reading itself gives the average of scores of leaves. The data were subjected to the analysis of variance [9] and further, biometrical procedures were followed to estimate genotypic and phenotypic coefficient of variation [10], heritability in broad sense [11], genetic advance [12] and correlation [13].
Result and Discussion
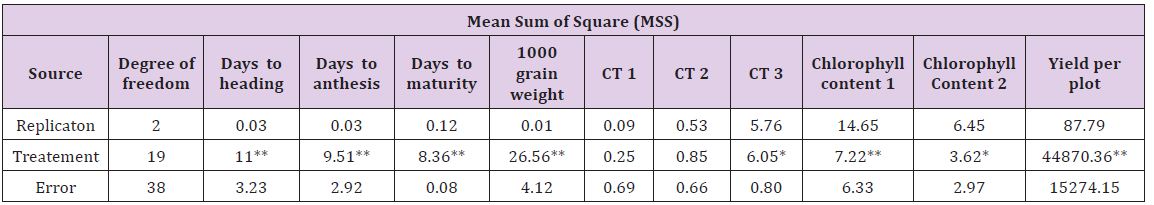
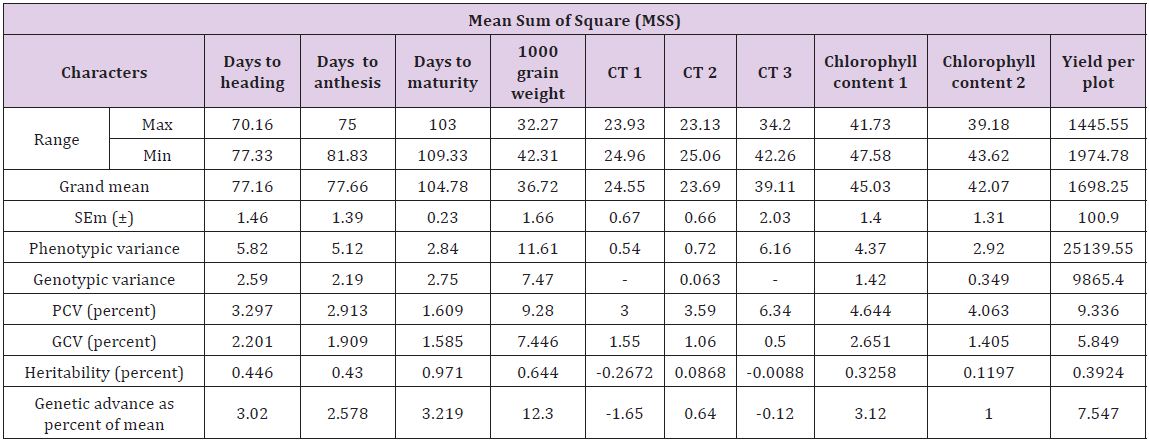
The analysis of variance for different characters is presented in Table 1. The results showed highly significant difference for most of the characters under study among twenty genotypes. This suggested that there is an inherent genetic difference among the genotypes. The estimates of range, mean, phenotypic coefficient of variation (PCV), genotypic coefficient of variation (GCV), heritability (broad sense) and genetic advance are presented in Table 2. The characters like 1000 grain weight and plot yield exhibited higher values of phenotypic variance while other traits also showed similar trend. This suggests that there is a good scope of selection for these factors [14-16]. The phenotypic coefficient of variation was higher than their respective genotypic coefficient of variation for all the traits [17-22]. The1000 grain weight and yield per plot showed maximum phenotypic coefficient of variation. This variation was minimum for days to [23].
Table 1: Analysis of variance (ANOVA) for all the characters under study in twenty lines of wheat.
*Significant at P ≤ 0.05 level of significance
**Significant at P ≤ 0.01 level of significance
Estimates of phenotypic variance (σ2p) were higher than genotypic variance (σ2g) (Table 2). A wide range of (σ2p) was observed for days to heading, chlorophyll contents, days to anthesis, grain weight and plot yield while moderate range of variance showed by the traits days to maturity and canopy temperature at different physiological stages. The result of phenotypic coefficient of variation revealed that yield per plot exhibited highest phenotypic coefficient of variation (9.336) followed by 1000 grain weight (9.28). Also chlorophyll content, days to heading and CT at different stages showed wide phenotypic coefficient of variation while, the remaining characters showed moderate to low phenotypic coefficient of variation. Genotypic coefficient of variation was high for 1000 grain weight (7.45) followed by yield per plot (5.85). Also chlorophyll content and CTD at different stages showed wide genotypic coefficient of variation. And remaining characters showed moderate to low genotypic coefficient of variation [24- 26]. The minimum value of genotypic coefficient of variation was observed for days to anthesis, days to maturity and CT [14,27].
Table 2: Range, Mean, SEm (±), Phenotypic and genotypic variance, PCV, GCV, heritability, genetic advance as percentage of mean for all physiological and yield traits under study in wheat.
Thus, the traits with high GCV are to be considered during selection. The heritability ranged from 11.97 percent to 97.1 percent. High heritability estimate was exhibited by days to maturity (97.1), 1000 grain weight (64.4), days to heading (44.6) and days to anthesis (43). The remaining traits showed moderate levels of heritability. The estimate of genetic advance as percent of mean was highest for yield per plant 1000 grain weight (12.30) followed by yield per plot (7.55), and the traits like days to heading, days to anthesis, days to maturity and chlorophyll content showed moderate advance while the CT showed less genetic advance [15,28-30]. High heritability coupled with high genetic advance as percent of mean was recorded for 1000 grain weight and yield per plot indicating effectiveness of selection for the improvement of these traits [16,24,28,31,32]. Also CTD and chlorophyll content at different stages exhibited moderate heritability coupled with moderate genetic advance indicating their effectiveness for selection of genotypes tolerant to high temperature [8,33].
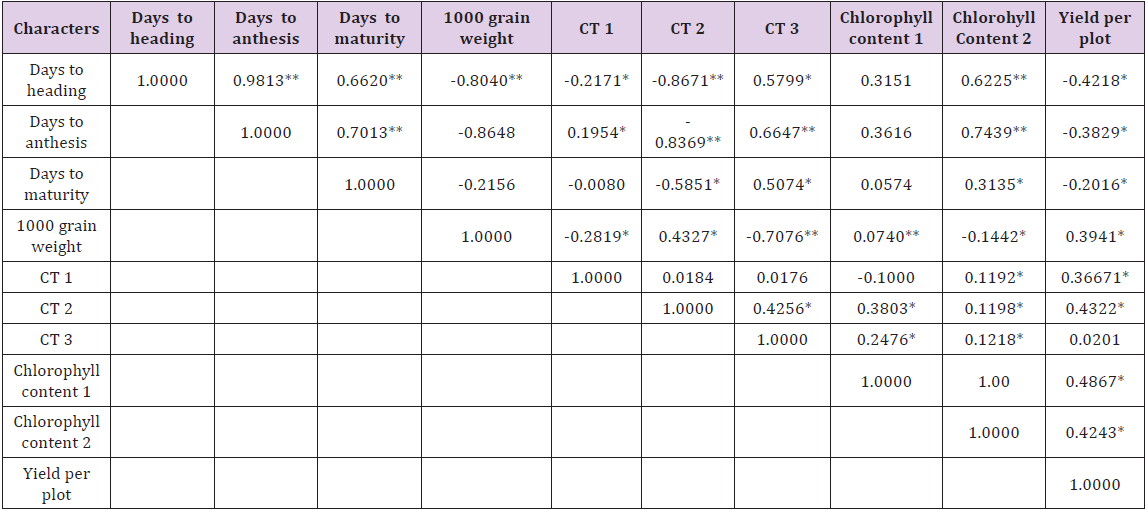
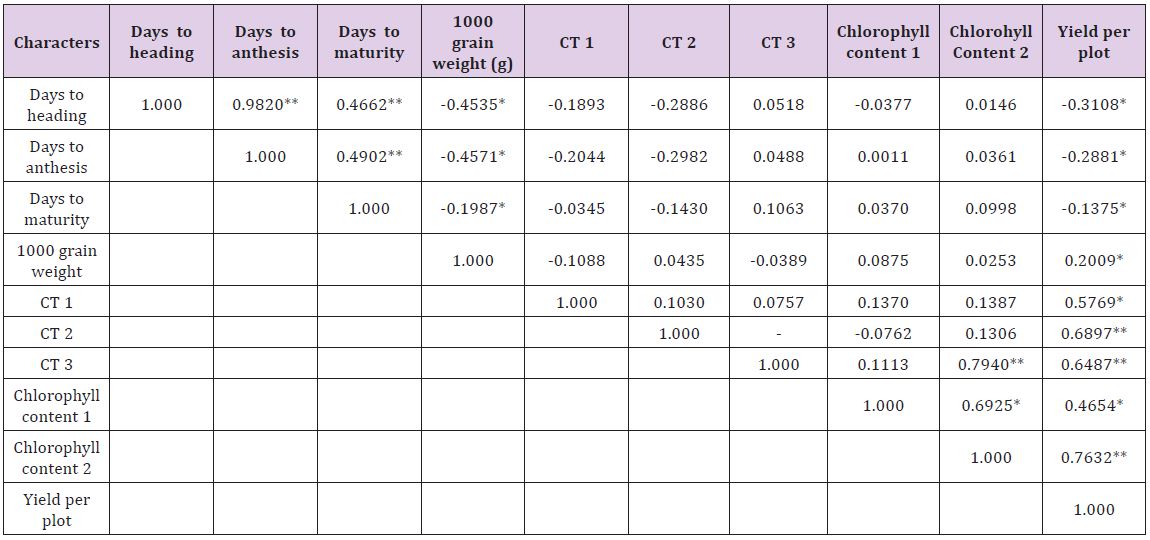
Genotypic and phenotypic correlation coefficients were worked out among all the characters under study and the results have been planted in Tables 3 & 4, respectively. The phenotypic correlation coefficient was highly significant and positive for yield per plant with 1000 grain weight and grains per spike. Also highly significant correlation for yield per plot was obtained with canopy temperature depression at anthesis and late milking stages and significant correlation for yield per plot per plot was observed with spike length and spikelet per spike though at 5 percent level of significance. Chlorophyll content at anthesis and CTD at heading and late milking also showed significant and positive correlation with yield. A significant but negative correlation for yield per plot with days to maturity was observed.
Table 3: Genotypic (rg) correlation coefficients of all the physiological and yield traits.
**Significant at P ≤ 0.01 level of significance
*Significant at P ≤ 0.05 level of significance
Table 4: Phenotypic (rp) correlation coefficients of all the physiological and yield traits.
**Significant at P ≤ 0.01 level of significance
*Significant at P ≤ 0.05 level of significant
Among component traits positive and highly significant correlation was observed for days to heading with days to anthesis, days to maturity and CTD at late milking stage. Days to anthesis exhibited positive and highly significant correlation with days to maturity and CTD at late milking stage. This suggests that higher seed weight is possible in varieties which show high CTD i.e., low canopy temperature in heat stress conditions. Therefore the selection of such genotypes is useful in breeding for heat tolerance. A significant and positive correlation was observed for chlorophyll content at anthesis with days to heading, days to anthesis and plant height [34-36]. The plot yield had non-significantly negative association with days to maturity [37,38]. This indicates that the early genotypes in semi arid condition are capable of escaping the terminal heat stress which is the major yield reduction factor.
Conclusion
Climate change and sustainable development are interlinked problems that pose a serious challenge to humanity. High temperature stress in the recent years has been major factor affecting the wheat productivity especially, in the arid and semi-arid regions of the world. The earth temperature is constantly increasing. It can be concluded from the above mentioned findings and details that the genotypes used in the study exhibited considerable variability and association among themselves for various traits under study. Thus, providing the ample scope for selection of elite genotypes and those which are tolerant to heat stress. Several approaches like QTL mapping and association genetic analysis should be useful in an effort to relate specific alleles to trait variation and to identify candidate genes.
Acknowledgement
We are thankful to the UPCAR Lucknow, for providing genotypic materials and Department of Genetics and Plant Breeding, Institute of Agricultural Sciences for providing all the necessary support to conduct this research programme.
The Use of Measurement Uncertainty on Clinical Laboratories Results
Opinion
Clinical laboratories should produce the required data and analytical results in order to achieve the true interpretation and use of the results. The objective of a measurement is to detect an estimate for the true value of analytical results. The measurement uncertainty (MU) is a parameter, associated with the result of a measurement that characterizes the distribution of the values that could reasonably be attributed to the measure and [1]. Clinicians might interpret better at clinical decision levels knowing the MU of a test. The interpretation of values which are close to cut-off levels may change, when they evaluated with MU. Therefore, reporting clinical laboratories results with estimation of MU is significant to show measurements that contained within the true limits and the level of confidence. With the acceptance of the International Organization for Standardization (ISO) laboratory standard Medical Laboratories – Particular Requirements for Quality and Competence (ISO 15189), laboratories have been required to provide estimates of MU for all quantitative test results [2]. According to ISO 15189, MU should be provide available by the laboratory on request (Figure 1).
Figure 1: According to ISO 15189, MU should be provide available by the laboratory on request.
MU provides quantitative estimates of the level of confidence that a laboratory has in its analytical precision of test results and therefore represents the expected variability in a laboratory result if the test is repeated a second time [3]. MU consists measuring procedure components which are pre- and postan alytical variation and biological variation [4]. Limit values of laboratories results (within MU) are being more careful follow-up and alarming the clinician. MU is the appropriate approach for meaningfully comparing measurement results with reference values. In our opinion, the clinicians must take into account of the MU during the evaluation of clinical laboratories results. We trust that MU can help clinicians and patients to better understand the accuracy of results and evaluate clinical decision levels. At the same time, MU is useful for clinical decision but have yet to show their strength in laboratory medicine. Also, the MU is still new in the field of quantity measurement. The pros and cons of uncertainty should elucidate on their use in practical performance specifications.
Institutional Review Board Roles and Functions to Conduct Clinical Trials at a Medium-Sized Regional Hospital, Japan
Introduction
Clinical trials are a key resource for the discovery of new diagnostic, treatment and prevention methods for disease. Many of today’s most introduced prevention and treatment modalities are based on previous clinical trial results. Clinical trials are an important part of improving quality of health care [1]. Facilitators of participation in clinical trials have been linked to recommendations by reliable health care providers, a supportive family, satisfactory doctor-patient relationship that depends on culture, financial incentives, anticipation of a personal benefit to participants, convenience to participants and culturally appropriate advertisements [2]. To address such facilitators and barriers of clinical trial participation in communities, we report our institutional review board (IRB) of Matsunami General Hospital [3]. A typical central medical institution anchor of the region, Japan.
Role of IRB
IRB has the authority for jurisdiction over research involving primarily drugs, devices and biology’s that must be approved by the Ministry of Health, Labor and Welfare, Japan. The clinical research or trials are defined as: “research conducted on human subjects to determine or verify pharmacologic, absorption, metabolism, safety and efficacy of one or more research products, in addition to clinical or pharmacodynamics effects and adverse events or reactions.”
IRB Members
We do not include a member of more than one ethic committee and managers of the institution in which the trial is going to be concluded. IRB consists of following background members:
a) 3 medical experts with experience in international study designed in compliance with good clinical practice
b) 1 nurse who has over 20-year experience in clinical practice
c) 1 pharmacist who has over 20-year experience in clinical practice
d) 3 non-medical persons
e) 2 persons with learned knowledge and experience who are unaffiliated with the institution
f) 2 persons in clerical support unit
Current statue of Clinical Trial Acceptance
A total of 32 clinical trials were completed in our institution between 2004 and 2016 (Table 1). Research subjects were distributed different disciplines, approximately 30% being diabetes mellitus-related.
Table 1: Contracted clinical research 2004-2016.
Comments
Clinical trials accepted in our institution are in quality and quantity inferior as compared with those in government institutions of similar size [4]. One of major differences may result from the provoked evolution of regulations. Our institution regulations on clinical trials may be structured with the aim of attracting more community-based trials to the regional community and to meet the criteria of management policies. Aside from the institutional incentives, the lack of accreditation of IRBs raises concerns regarding the compliance of organizations, IRBs or the researchers and/or the research staff with a human study protection attempt, quality assurance and quality improvement measure accountability, adequate resources availability, and transparency by communication and interaction with the community, research participants and researchers. Encouraging IRBs to apply for accreditation would strengthen any flaws in structure of operating protocols and help our institutional circumstance to have its goal to raise its share in drug research investments. Before approving the trials, IRBs should introduce the policy to better assess the existing uncertainties in a given investigation study, employing tools, such as survey of specialists, official announcement of the protocols and systematic reviews with a focus on identifying golden standard treatment that should be contained in consideration of the proposed trial, as previously described [5]. It may be the most plausible to make an assertion that the IRB needs contributing to improvement in quality and quantity of clinical trials.
Spinal Dermal Sinus and Sacral Endothelial Cyst with Recurrent Bacterial Meningitis: A Case Report and Systematic Review of the Literature
Introduction
Congenital dermal sinus is dermoid and epithelial cyst from skin tissue or epithelial tissue residue in the cranial cavity or intraspinal canal during embryonic development. The entry of sinus is usually located in the occipital, back, waist midline skin, with hair hyperplasia, and sinus connect skin with nerve tissue which constitute the anatomical basis of infection of the nervous system. We report 1 case of recurrent bacterial meningitis caused by sacral sinus and sacral canal endothelial cysts. Meanwhile, the related literatures are systematically searched and reviewed, which provide experience for the diagnosis and treatment of bacterial meningitis caused by congenital sinus.
Case Presentation
A previously healthy 8 month-old boy was admitted because of a 9 days’ fever and a 2 times’ convulsions. Physical examination revealed a febrile, obtunded with anterior bulging fontanel. Neck stiffness was noted. Laboratory tests showed WBC10.6×109/L, neutrophile granulocyte 58.5%. C-reactive protein (CRP) 93mg/L (normal value below 8 mg/L). An urgent computed tomography (CT) of the head was performed, with normal results. Bacterial meningitis was suspected and a lumbar puncture confirmed the diagnosis. The cerebro-spinal fluid (CSF) was 8200×106/L white blood cells with neutrophile granulocyte 88%, increased total protein (190,7 mg/L) and decreased glu-cose levels 0.2mmol/L. Serum glucose level was normal (5mmol/L). The child received intravenous dexamethasone and ceftriaxone (100mg/kg. d) as empiric treatment which results of poor effects, so vancomycin (60mg/kg. d) was added. Escherichia coli with ESBL (+) was confirmed in both double blood and cerebrospinal fluid (CSF) cultures, which was sensitive to carbapenems and amino glycosides. So we replaced ceftriaxone with meropenem (120mg/kg. d) in treatment.
Five days later, the child’s condition improved, with fever resolution. Suddenly, 10 days after hospital admission, the child manifested irritability and lethargy. Moreover, a bulging fontanel was noted at the physical examination. During the hospitalization time (51days) of the child, we used cefatriaxone (4days), vancomycin (21days), meropenem (47days), compound sulfamethoxazole (60mg/kg.d) (7days, combined with meropenem), amikacin15mg/ kg.d (15days, combined with meropenem). We noticed that after the condition and examinations of child had been improved for several days, it would become worsen again. This had happened several times. Then, the patient transferred to another hospital. A needle sized skin dimpling was noticed at sacrococcygeal this time. And the child’s parents told the doctor that sacrococcygeal sinus was found after the child was born. Brain MRI revealed ventricular dilatation and hydrocephalus. Lumbar vertebra MRI revealed sacral sinus, extra medullary subdural nodules of the lumbar spine, neurogenic tumors, meningioma. The patient received sacrosacral sinus excision.
Pathology (lumbosacral skin and subcutaneous tissue) revealed cuticle cyst in subcutaneous tissue. After the surgery, the patient received postoperative continuous lateral ventricle drainage for 21days. And amikacin (10mg/kg) with dexamethasone (0.5mg) were given by lateral ventricle for 7days. The brain MRI showed that the hydrocephalus was alleviated. 21days after the surgery, the patient received lateral ventriculo ventriculoperitoneal shunt. After 3 days anti-infection with ceftazidime (120mg/kg. d), the patient was discharged. One month after discharge, the child had recurrent fever again, with 2 times’ convulsions. New symptoms appeared, including astasia, urine incontinence and constipation. Lumbar vertebra MRI showed that intraspinal tumor and syringomyelia at the lumbar 3-4 level. The patient received intraspinal occupying resection and neurolysis. Intraspinal occupying culture revealed: Escherichia coli. Pathology suggested: mature teratoma. Antibiotics were used according to drug sensitivity test. After the treatment, the child recovered well and was discharged from the hospital. The patient was followed up with no recurrence.
Systematic Review of the Literature
Using dermal sinus and bacterial meningitis as key words, we searched databases including PubMed, Embase and Chinese databases such as CNKI, VIP, and Wanfang database from the beginning of the database to November 2017. We have 22 Chinese articles and 77 English articles. Repetitive studies, non-Chinese or English literature that cannot be analysis from the cases were excluded; we got 68 cases bacterial meningitis caused by sacral sinus. Most of the patients, age from neonate [1] to adult [2], complained of fever, headache, vomiting and convulsions. Few people had back pain, lower limb pain and limping as initial symptoms. And some patients didn’t have typical symptoms while headache and vomit were transient.
Some patients were admitted in hospital without any symptoms and signs except fever. That may be related to repeated infection of low toxicity bacteria, opportunistic pathogens and early application of antibiotics. Some patients who had obscure onset and prolonged course were misdiagnosed as tuberculosis meningitis due to lack of systemic toxic symptoms and acute inflammatory reaction. In cases reported on the dermal sinus, there were 13 cases of occipital, 1 case of neck, 5 cases of chest and 18 cases in lumbosacral region. In those cases with pathogens isolated from blood or cerebrospinal fluid samples, 2 samples were proteus, 3 samples were Staphylococcus aureus, 3 samples were Escherichia coli, 2 samples were group B Streptococcus and 1 sample was Klebsiella pneumoniae. Other pathogens include Pseudomonas aeruginosa, anaerobes, Staphylococcus aureus and Escherichia coli [3]. Most of the pathogenic bacteria were derived from the normal colonization on the skin. Morgenstern believed that different bacterial meningitis caused by anatomic abnormalities (including the sinus), can provide some useful suggestion in the location of the abnormalities [4]. However, the results of the pathogen literature analysis showed that the implications were very limited.
Discussion
It was quite hard to diagnose and treat congenital dermal sinus if the patients only had clinical manifestations of bacterial meningitis, while with insidious sinus orifice and without local infection. It may be hard for the patients having dermal sinus with spinal endothelial cysts or epithelial cysts to have sinus and cysts completely removed because of tight adhesion with the spinal cord or nerve root. In this case, although the child had definite infectious pathogen and received enough dosage of effective antibiotics, meningitis was still recurring. He was treated by surgical excision of the dermal sinus in the first surgery. But the cyst in the spinal canal was not thoroughly removed. So the patient had re-infection of the same pathogen. In the second surgery, after the cyst in the spinal canal was thoroughly removed, no recurrence was found. So early diagnosis and surgical treatment is appreciated. Escherichia coli are one of the common pathogen in infant’s bacterial meningitis. It is necessary to find out the reason why the symptoms recurring after receiving appropriate antibiotics treatment. Immune deficiency, congenital anatomic abnormality, trauma and operation are all important f actors of recurrent meningitis. From the experience of this case, there was something we should pay attention to:
a. Inquire the patient history detailed;
b. Systematic physical examination, especially the midline craniospinal axis;
c. Proper imaging examination besides brain MRI.
Spinal MRI is the best imaging method for the diagnosis of intraspinal cysts, which can indicate the position of the cyst, and provide a reliable basis for clinical diagnosis and operation. In the treatment, we should actively search for the infection pathogens, select sensitive drugs according to the results of drug sensitivity experiments combined with clinical efficacy, and combined treatment should be taken into consideration when necessary. Early surgical treatment should be considered while controlling infection. In this case, the prognosis of the patient was good after thoroughly surgical removal of the sinus and spinal canal cyst which were the primary infective focus. But for children with complications of intracranial and intraspinal abscess, which caused severe neurological dysfunction, without timely surgery, the prognosis was poor. Delayed diagnosis is mainly due to the doctor’ unawareness of this type of anatomic abnormality. The importance of early diagnosis, proper examinations, surgical treatment and close follow up in patients with recurrent meningitis is stressed.
Role of Matrixmetalloproteinases in Periodontal Disease – A Review
Introduction
Periodontal disease is a common, complex, inflammatory disease characterized by the destruction of tooth supporting soft and hard tissues of the periodontium, including alveolar bone and periodontal ligament. Although the inflammation is initiated by bacteria, the tissues breakdown events that lead to the clinical signs of disease result from the host inflammatory response that develops to combat the challenge presented by the subgingival biofilm. Microbial products trigger the release of pro inflammatory cytokines and host derived enzymes, the excessive and/or dysregulated production of which results in tissue breakdown. Once the immune and inflammatory processes are initiated and the complex cytokine network is established, various inflammatory molecules play a direct role in the degradation of both non mineralized and mineralized tissues of the periodontium. One such family of inflammatory molecules is the matrix metalloproteinases which are released from different cell types present in the lesion including macrophages, leukocytes and fibroblasts or other resident cells. Human MMPs also called as Matrixins, are a group of structurally related but genetically distinct endopeptidase enzymes. They are produced at low levels or not at all in restingstate adult tissues. Control of extracellular proteolysis by MMP is critically important for survival of organisms, and this is performed by interaction with various inhibitors like endogenous inhibitors, TIMPs. This review article gives an overview of the physiological functions of MMPs and its role in the pathogenesis of periodontal diseases.
History
Study by Woessner [1] was considered as a milestone before the discovery of first MMP, Later in that year, Jerome Gross and Charles Lapiere [2] were the first to identify an MMP using a biochemical approach. In 1966, MMP-1 was purified from tadpole tail fin and back skin. MMP-2 was identified as a higher molecular mass species (72 kDa) with gelatinolytic activity; purified from human rheumatoid synovial fibroblasts by Goldberg and colleagues whereas MMP-3 was identified as a lower molecular mass species (54 kDa) from rabbit synovial fibroblasts by the Werb laboratory in 1985 and subsequently named Stromelysin [3]. In the late 1980s, Ed Harris et al. [4] first proposed the name MMP. Subsequently, the International Union of Biochemistry and Molecular Biology designated the family with the unique name MMPs and assigned each family member with an enzyme number. To be classified as an MMP family member, the enzyme should meet the following requirements:
a) proteolysis of at least one extracellular matrix(ECM) component
b) catalysis dependent on zinc at the active site
c) activation by proteinases or organomercurials
d) inhibited by EDTA,10-phenanthroline and any one of the TIMPs
e) cDNA has sequence homology to MMP-1
Initially it was thought that the proteinase be secreted in a proform but now this no longer holds as MMP-11 and MMP-28 are intracellular activated by furin and are secreted in active forms; even the membrane-bound MMPs are not necessarily secreted [5].
Classification of MMP
a. Based on the substrate specificity MMPs are classified into the following types [6].
b. Collagenases -MMP-1, MMP-8, MMP-13
c. Gelatinases- MMP-2, MMP-9
d. Stromelysins- MMP-3, MMP-10,MMP-11,MMP-12
e. Matrilysins- MMP-7, MMP-26
f. MT-MMPs (Membrane type) -MMP-14, MMP-15, MMP-16, MMP-17, MMP-24
g. Other MMPs- MMP-18,MMP-19,MMP-20, MMP-21,MMP- 23,MMP-27,MMP-28
Domain Structure Of MMP
MMPs are structurally similar but differ in substrate specificity. T he following features are seen in the structure [7]:
a. Signal peptide
b. Propeptide
c. Furin-cleavage site insert
d. Catalytic domain
e. Fibronectin-like repeats
f. Hinge region
g. Hemopexin domain
h. Membrane insertion extension
Modes of Action
Modes of action of MMPs are as follows [8]:
a. MMPs may affect cell migration by changing the cells from an adhesive to non adhesive phenotype and by degrading the ECM.
b. MMPs may alter ECM microenvironment leading to cell proliferation, apoptosis, or morphogenesis.
c. MMPs may modulate the activity of biologically active molecules such as growth factors or growth factor receptors by cleaving them or releasing them from the ECM.
d. MMPs may alter the balance of protease activity by cleaving the enzymes or their inhibitors.
Regulation of MMP Activity
The activity of MMP against extracellular matrix substrates is regulated at 4 “gates” [9]:
I. Transcriptional regulation of MMP genes
II. Precursor activation
III. Differences in substrate specificity
IV. MMP inhibitors.
Role of MMP in periodontal diseases
In periodontal diseases, MMPs play key role in the degradation of the ECM, basement membrane and protective serpins as well as in the modification of cytokine action and activation of osteoclasts. Organisms like Porphyromonas gingivalis and Aggregatibacter actinomycetemcomitans do produce collagenases for the breakdown of ECM but they do not help much in periodontal collagen degradation. One way to differentiate between mammalian and bacterial collagenases is by their different mode of collagenolysismammalian collagenase cleaves the undenatured triple helical collagen molecule at a single site resulting in characteristic 3/4 and 1/4 fragments, whereas bacterial collagenase attacks the collagen substrate at multiple sites resulting in more than 200 peptide fragments. The extracellular matrix not only consists of collagen fibrils but also their associated proteoglycans and fibronectin which must be removed first in order for the collagenase to have access to the collagen substrate. MMP-3 (stromelysin) is effective at degrading proteoglycans and fibronectin [10].
Both resident gingival and periodontal ligament fibroblasts produce collagenases that are thought to be involved in normal tissue turnover. Inflammatory cells such as neutrophils and macrophages are also responsible for production of MMPs with neutrophils being the major source of collagenase and gelatinase in inflammatory diseases such as periodontitis [11,12]. Epithelial cells can also produce elevated levels of these enzymes, which may facilitate the apical migration and lateral extension of the junctional epithelium and the subsequent loss of connective tissue attachment [13]. The evidence for the role of MMPs in periodontal destruction is strong and has been supported over many years by a number of studies; few of them are quoted in the Table 1.
Table 1: Studies related to MMPs.
Estimation of MMPs in Periodontal Disease
Matrix metalloproteinases can also process various bioactive non matrix substrates, such as cytokines, chemokines, growth factors and immune mediators, thereby mediating both anti and pro-inflammatory processes. Therefore, the levels of matrix metalloproteinases should not be interpreted solely as surrogate markers of tissue destruction but also as part of physiological or anti-inflammatory defense [21]. Based on these biochemical or immunological findings, the oral fluids have been a target for extensive research on diagnostic utilization of MMPs and their regulators as potential candidates in chair-side tests for monitoring periodontal and peri-implant diseases [21]. Samples collected to estimate the levels of different MMPs include- Saliva, GCF, and Tissue sample. Various proteomic techniques are being used to estimate the levels of these MMPs which are listed in Table 2.
Table 2: Proteomics techniques.
Role of MMP Inhibitors in Periodontal Disease
A disturbed balance between MMPs and TIMPs might contribute to the disease process in degenerative diseases. Similar patterns of MMP and TIMP expression can be found in different diseases involving matrix degradation. In some cases, the occurrence of MMPs and TIMPs in body fluids such as saliva, gingival crevicular fluid (GCF), or serum provides additional information about the progression of the disease. In healthy periodontal tissue, TIMP levels are generally higher than in inflamed periodontal tissue, in which MMP levels exceed TIMP levels. The more severe the inflammation, the higher the concentrations of active MMPs. In GCF and in gingiva from humans, MMP-1, -2, -3, and -9 are significantly increased, whereas TIMP-1 and -2 are significantly decreased. The inhibition of MMP expression or activity, or increased TIMP expression, might reduce tissue destruction in periodontitis.
Different inhibitors include [22]:
a. Alpha 2- macroglobulins
b. Tissue inhibitors of metalloproteinases
c. Inhibiting antibodies
d. Synthetic inhibitors
Endogenous or natural inhibitors such as tissue inhibitors of matrix metalloproteinases and Alpha 2-macroglobulin bind in a non-covalent fashion to members of the matrix metalloproteinase family. TIMPS probably control matrix metalloproteinase activities pericellularly, whereas Alpha 2-macroglobulin functions as a regulator in body fluids. During inflammation, however, the latter high-molecular-weight protein may escape the vasculature and also function in the extracellular matrix [10]. Multiple synthetic peptides have been formulated in an attempt to synthesize more specific chelators including phosphorus containing peptides, sulfur-based inhibitors and peptidyl hydroxamic acid derivatives.
The most widely used synthetic peptides, and the ones receiving the most attention as potential pharmaceutical agents, are the hydroxamic acid derivative. Synthetic Inhibitors of MMPs fall into three pharmacologic categories [23]:
a. Collagen peptidomimetics and non peptidomimetics, Peptidomimetic MMP Inhibitors- Batimastat, Marimastat Nonpeptidic MMP Inhibitors – BAY 12–9566, AG3340, BMS- 275291, CGS-27023A
b. Tetracycline derivatives- Doxycycline, Col-3 (metastat)
c. Bisphosphonates (Figure 1).
Figure 1: Action of various inhibitors at different levels [24].
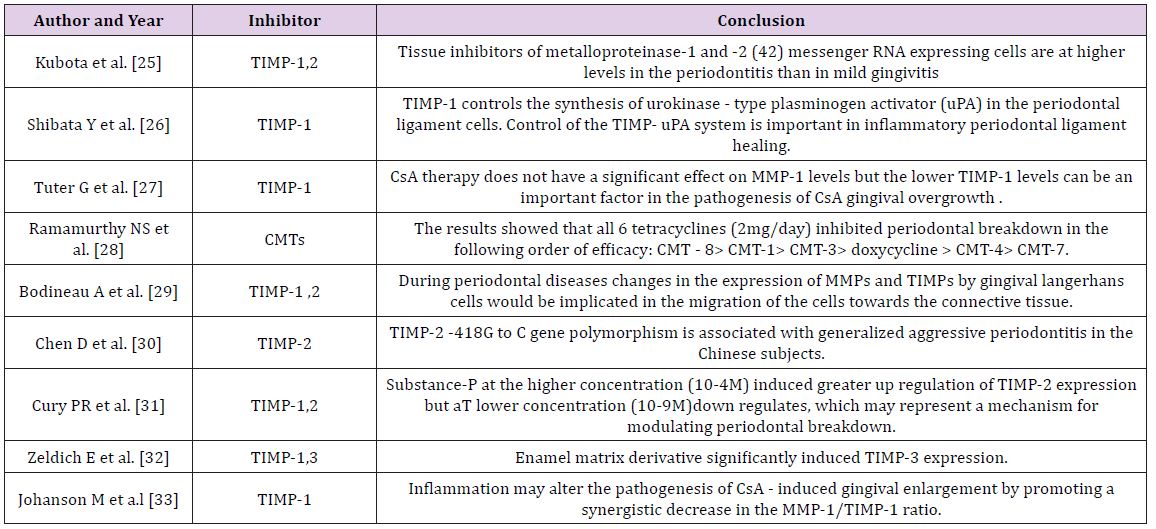
Various studies have been done to evaluate the effect of TIMPs on periodontium. Few of them are listed in Tables 3 & 4.
Table 3: Studies Pertaining to MMPs inhibitors.
Table 4: Various MMPs and their inhibitors.
Conclusion
There is much evidence for the role of matrix metalloproteinases in the destructive processes of periodontal disease distinguishing them as a viable target for a chemotherapeutic approach. The use of a host modulatory agent such as a matrix metalloproteinase inhibitor can assist with conventional treatment for periodontitis and, when used adjunctively, can enhance and make clinical therapeutic responses more predictable in the more susceptible patient.
Neonatal jaundice is a common condition that pediatricians encounter in their practice. It is also a significant cause of neonatal morbidity world-wide and is estimated to be present in 60% of term neonates and 80% of preterm babies. Interventions to prevent progression of neonatal jaundice significantly reduce the morbidity and mortality rate of neonate [1]. Elevated serum bilirubin can damage neurons and for this reason it is measured in the neonate with obvious jaundice or signs of underlying disease [1]. Data derived from risk instruments that incorporate several factors, support the potential multifactorial etiopathogenesis of marked hyperbilirubinemia; albeit genetic contributors may go undetected and individual factors confer different degrees of risk.
Methodology
A descriptive study was conducted to assess the risk factors of neonates with hyperbilirubinemia at Sree Gokulam Medical College Hospital, Trivandrum. Using consecutive sampling technique quantitative data was collected from 110 neonates diagnosed with hyperbilirubinemia and undergone phototherapy in Neonatal units and OBG wards. Pretested and validated questionnaire and checklist was used to collect the data. Permission was obtained from institutional research committee and institutional authority. Collected data were analyzed using SPSS-18; descriptive analysis was done to know the empirical information on neonates with hyperbilirubinemia.
Results and Discussion
More than half (53.6%) of the neonates received phototherapy were males, majority of the neonates (79.10%) were classified as term according to gestational age, (81.8%) were classified as normal birth weight, (83.6%) were classified as appropriate for gestational age. More than one fourth of the neonates (31.8%) had ABO incompatibility, 9.1% had Rh incompatibility and 4.5% had both Rh incompatibility and ABO incompatibility. Nearly quarter of the neonates (21.80%) had cord bilirubin level > 2.5 mg %. 9.1% of neonates had hypoglycemia as postnatal complication. More than quarter of the neonates had caput succedenum (25.5%), (39.1%) developed yellowish discoloration (physiological jaundice) on third (49 to 72 hours) postnatal day. A large majority of the neonates (80.9%) received phototherapy for < 24 hours and nearly half of the neonates (44.5%) were in high risk zone as per nomogram designation of risk zone category for receiving phototherapy procedure. more than half of the neonates (68.2%) received direct breast feeding after birth. More than three fourth of the neonates (76%) received demand breast feeding before diagnosing hyperbilirubinemia. There was a progressive declination of bilirubin level to normal range after initiating phototherapy from day 0 to day 2.
Regarding the maternal variables of neonates with hyperbilirubinemia, it was found that nearly three fourth of the neonates mothers (66.4%) were primi. More than half (59.5%) of the multi parity mothers mentioned that their previous child had history of receiving phototherapy. Nearly one fourth of the mothers (14.5%) had GDM (gestational diabetes mellitus). Singh M has stated that gestational diabetes mellitus is a maternal risk factor for the neonate to develop jaundice [1]. More than half of the mothers (60.9%) received oxytocin derivatives during intranatal period. This finding is consistent with study findings by [2]. That the mean total and direct bilirubin levels were higher in neonates delivered using oxytocin (0.4 ± 0.1 and 17.99 ± 0.4, respectively), compared to those without oxytocin induction (0.383 ± 0.1 and 16.2 ± 0.28, respectively) (p = 0.001). More than half of the mothers (66.4%) had normal vaginal delivery. The present study finding is consistent with findings by [2], that the mean total bilirubin level was significantly higher in newborns delivered per vaginally (17.3 ± 3.5 mg/dl), compared to cases born by cesarean section (16.1 ± 3.9 mg/dl) (p = 0.02) [2].
Conclusion
The study has identified various risk factors and variables related to mother and neonates with hyperbilirubinemia. Detection of risk factors by the neonatal health team early in the mother and neonate can protect and prevent the neonate from mortality of hyperbilirubinemia.
Opportunities for the Bioeconomy of Olive Oil Byproducts
Introduction
Bioeconomy is defined as the use of biological sciences for improving adding value to the economic activity (products and services). Bioeconomy refers to the set of economic activities relating to the invention, development, production and use of biological products and processes Oborne [1]. These benefits are expected to improve health outcomes, boost the productivity of agriculture and industrial processes, and enhance environmental sustainability. It is well known that a reduction in dietary saturated fat has generally been thought to improve cardiovascular health. Dietary and policy recommendations frequently focus on reducing saturated fatty acid consumption for improving cardiometabolic health. Milk and dairy foods contain saturated fats, and their consumption often leads to a rise in plasma cholesterol level. Metaanalyses suggest a reduction in risk in the subjects with the highest dairy consumption relative to those with the lowest intake Elwood & Pickering [2].
There is a growing interest in improving fatty acids prole of milk fat by including appropriate fat sources in dairy ruminant diets. The aim is to reduce the content of medium chain saturated fatty acids (FA), which have a hypercholesterolemia effect, and increase the fatty acids considered beneficial, such as polyunsaturated FA of the n-3 series and rumenic acid (cis-9,trans-11 18:2) in milk fat Lock & Bauman [3]; Martínez Marín, Gómez-Cortés et al. [4]. The source for these polyunsaturated FA acids has been suggested to be oilseeds (sugarbeet, lineseed) and their oils. Furthermore, low quality olive oil has been also used as a source of polyunsaturated FA Castro, Cabezas et al. [5]. Intensive dairy goat, sheep and cow milk production in the Mediterranean basin is based on imported conventional ingredients to be included in concentrates. There is an opportunity for applying the principles of circular economy and bioeconomy to produce milk with lower contain saturated fat by using byproducts of olive oil chain to replace conventional ingredients with the double effect of both reducing feed cost and improving milk quality (and dairy products) relative to human health.
Use of olive oil by-products as animal feedstock
Olive cultivation is widespread in the Mediterranean regions and the olive tree spread beyond the Mediterranean (e.g. Australia, Argentina, United States of America, etc.). Feeding by-products to livestock is a practice as old as the domestication of animals. Olive byproducts have been used for Mediterranean small ruminants (goat and sheep) and also for dairy cows. Also for non-ruminant olive byproducts have been also been used. By-products derived from the olive trees and olive oil extractions are: Olive leaves (OL) that is to a mixture of leaves and small branches from both, the pruning of olive trees as well as the harvesting and cleaning of olives prior to oil extraction from olives. Olive cake (OC) consists of olive pulp, skin, stone and water although the specific characteristics of OC may differ according type of oil extraction and before and fresh or dry.
Olive stones (OS) may be a single by-product when they are well separated from pulp either before or after oil extraction. Finally, olive cake ash (OCA) that is the ashes resulting after OC is used as feedstock in biomass energy plant. Additionally, some experiences has been done using low quality oil or calcium soaps of olive oil fatty acids (CSFA). The most frequent used byproduct is the olive pomace (OP) that is one of two major by-products of the olive oil extraction industry, for every 100 kg of olives, 40 kg of OP (highly variable depending on technology). Cost reduction is a consequence of the substitution of concentrate feed with a price around 200 EUR/ton for olive byproduct with a cost of 12 EUR/t. The result of this substitution within the recommended limits achieve a 10% reduction in the cost of goat milk without affecting the yield, Molina-Alcaide, Morales-García et al. [6].
Effects of Olive Oil by-Products as Feedstock in Animal Products
Nasopoulou and Zabetakis [7] review the use of OP as an alternative dietary lipid source in compounded fish feeds resulting in the formulation of functional fish feeds and aquacultured fish according to the EU legislation (EC 1924/2006). The evidence shows an improvement of meat product with OP improve the cardioprotective properties of the final produce (fish farms) by enriching the fish lipid profile with specific cardioprotective lipid compounds of plant origin Sioriki, Smith et al. [8], Parrillo et al. [9], Nasopoulou & Zabetakis [7] also quote the use of OP as a feedstock for animal (terrestrial) feed, with some recent research in pigs Martins et al. [10] demonstrating that oleic acid supplementation have complementary effects and influence the nutritional quality of pork and DSF. Regarding ruminants, olive leaves are fibrous with a low digestibility, especially of crude protein, and they promote very poor rumen fermentation. It has also been observed that for lactating animal’s olive leaves result in an improvement in milk fat quality compared to diets based on conventional forages Molina- Alcaide & Yáñez-Ruiz [11].
The knowledge regarding the use of OC is also in line with the evidence of OL, and a significant number of authors have published the evidence. Goat milk shows a significant change in milk composition with increase, with a common result showing that contents of milk fat and milk total solids, as well as their yields, increased in the OC die with a reduction on less saturated fatty acids (FA) and more monounsaturated FA than the control, Castro et al. [5], Gomes et al. [12] and Molina-Alcaide et al. [11]. The mentioned authors agree with the conclusion that the addition of moderate amounts of oil byproducts to the diets of dairy goats has favorable effects on milk fatty acid composition from the point of view of the human consumer, without negative effects on animal performance.
Additionally, research with lactating ewes has been focused in the use of calcium soaps of fatty acids (CSFA) with different original oil (sunflower, soya and olive oil). Results with lactating ewes are also are consistent with the findings for milk goat, with Casals et al. [13], Gargouri et al. [14]; Titi & Obeidat [15]. Regarding the milk fat contain of cows according the literature review points out that a milk fat reduction is more likely when non-protected fat sources are included in diets based on corn silage but the reduction decreases with other forages Martínez Marín et al. [4], the research in milk cows is less numerous than the evidence for small ruminants (goat and sheep) with OC and other byproducts has not been frequent probably because the high productivity of milk cows and she sensitivity to changes in diet, although some positive experiences have been found with the addition of limited volumes of OL, OC and CSA.
Conclusions and Proposal For Further Research
This short note has presented the knowledge regarding use of olive oil byproducts, as low cost source for improving fatty acids contain of milk fat by including appropriate fat sources in dairy ruminant diets and therefore to reduce the content of medium chain saturated fatty acids (FA), which have a hypercholesterolemia effect, and increase the fatty acids considered beneficial, such as polyunsaturated FA. There is an opportunity to reduce the cost of dairy feed, and improve health contain of dairy products and additionally increase the value of olive oil byproducts that are currently either an environmental problem, or used as a feedstock for composting or direct field application or in the best of the cases as a fuel for biomass to energy plants. According to the principles of bioeconomy European Commission [16], the use as fertilizer or energy is the less valued alternative with animal feed or human food as prefer end destination of agricultural biomass. The use of these alternative low cost byproducts is done by some farmers without proper control and with ad-hoc formulations and methodology to be converted in a new industry that get higher value for olive byproducts, thus enhancing rural areas and simultaneously improving the quality of dairy products. Additionally, research should be done in the analysis of dairy processed products (cheese, yogurts, etc.) in order to test the quality not only from the cardiovascular point of view but also from flavor and other market qualities.