Biomedical Journal of Scientific & Technical Research (BJSTR) is a multidisciplinary, scholarly Open Access publisher focused on Genetic, Biomedical and Remedial missions in relation with Technical Knowledge as well.
Author: biomedicalopenaccessjournals
The only motto of Biomedical Journal of Scientific & Technical Research (BJSTR) Publishers is accelerating the scientific and technical research papers, considering the importance of technology and the human health in the advanced levels and several emergency medical and clinical issues associated with it, the key attention is given towards biomedical research. Thus, asserting the requirement of a common evoked and enriched information sharing platform for the craving readers.
BJSTR is such a unique platform to accumulate and publicize scientific knowledge on science and related discipline. This multidisciplinary open access publisher is rendering a global podium for the professors, academicians, researchers and students of the relevant disciplines to share their scientific excellence in the form of an original research article, review article, case reports, short communication, e-books, video articles, etc.
Successful Excision of a 15x20cm Giant Solitary Fibrous Tumor on Nape, Originating From Submesenchymal Cells
Abstract
Objective: Solitary fibrous tumors are mostly benign tumors that originating from submesenchymal cells of parietal or, more commonly, visceral pleura.
Case: In that case, we have hospitalized a male patient, who was attended to the emergency service with massive bleeding, with a giant (15 x 20cm) mass located on his nape. The operation was planned as a collaboration of plastic and cardiovascular surgery teams. After a successful surgical excision histopathologically, the result was solitary fibrous tumor.
Discussion: Our approach resulted in a satisfying operative result without harmful complications in such a difficult case. In our opinion, surgical approach should always be thought as an option regardless of size in case of solitary tumors.
Solitary fibrous tumors are mostly benign tumors that originating from submesenchymal cells of parietal or, more commonly, visceral pleura. They contain both normal and abnormal vascular structures. Usually, they become symptomatic due to ulcerations, bleeding and compression of surrounding tissues. We have hospitalized a male patient, who was attended to the emergency service with massive bleeding, with a giant (15 x 20cm). Solitary fibrous tumor located on his nape. The case was decided “not suitable for interventional embolization” so it was widely excised by plastic and cardiovascular surgical teams. The tumor was removed by surgery. Its weight was 1788gr. This is a rare clinical pathology, which has not been published in the English literature before.
Case report
An 80 years old male patient had a history of CABG and low EF (25%) and was suffering a progressively growing, discoloring mass on his nape since 5. He was followed in a rural hospital for 4 years. He had been forwarded to an advanced center because of the magnitude of the tumor and cardiac condition of the patient. He had major bleeding requiring transfusion one year ago. He was hospitalized in our intensive care unit (ICU) due to massive bleeding. He had a big (15 to 20cm) pulsatile mass on his nape, which was oozing bloody and requiring compression (Figure 1). Vascular supply of the mass was visualized by computerized tomography neuroangiography. Both subclavian arteries (left sided dominancy) were supplying the ulcerative tumor. Due to large diameter supplying arteries and excising blood flow, interventional embolization was unsuccessful. Surgical excision and bleeding control were planned. Vital stabilization was maintained with transfusion of 14 bags of packed red cells and freshly frozen plasma. He had received diuretics and positive isotropic treatment (moderate dose of dopamine -5mcg/ kg/m-) for heart failure and monitorzed in the ICU. The operation was planned as a collaboration of plastic and cardiovascular surgery teams. Voluntary informed consent from the patient received with the teams. The procedure was initiated under general anesthesia and on prone position.
The mass was circumferentially sutured with continued 1/0 vicryl. After skin incision, vascular connections were dissected. It was widely excised. All vascular structures, connected to subclavian and vertebral arteries, were controlled with either electrocautery or 2/0 silk sutures. After safe controlling of the bleeding sources, excision of the mass was concluded (Figure 2) and the 15 cm to 20cm excision material was sent for pathological examination (Figure 3). Plastic surgeons had prepared two fascia-cutaneous flaps from the thigh of the patient to repair the margins of the skin defect and central portion of the defect was cloded with a split thickness skin graft (STDG), which was obtained from his right thigh. Operation was terminated with “tie-over” dressing of the wound (Figure 4). Histopathologically, the result was Solitary fibrous tumor. (cd34, focal+, s100-, desmin-, cd117-, ema-, ki67, bcl2+, keratin-, caldesmon-, cd99-, aktinfokal+). Solitary fibrous tumor of the pleura was rare neoplasms andaccount for less than 4% of all pleural tumors. That originates from mesenchymal cells of the submesothelial tissue of the pleura. He was monitored in the ICU for two days and after an uneventful period of care, transferred to the ward.
Discussion
Solitary fibrous tumors are mostly benign vascular tumors that characterized with spontaneous regression in 80% of cases [1-3]. Solitary fibrous tumor is a commonly benign vascular proliferative lesion that can be present at any age [2-4]. Lesions usually expand to the surrounding tissue and become ulcerative in several years. Diagnosis of the tumor is based on physical examination [5]. They have very frequent slow secondary regression. There are several therapeutically modalities such as injection of sclerosing solutions and steroids, laser therapy, radical surgery, radiotherapy and embolization. We report an 80 year old case with a giant cutaneous solitary fibrous tumor of 15 x 20cm in diameter, diagnosed 5 years ago, with massive bleeding, requiring transfusions. Physical examination did not show any other cutaneous vascular malformations. He was hospitalized for infection and bleeding of the giant tumor 6 months ago as a cutaneous hemangioma. He had not been intervened because of complexity of the tumor and his cardiac status. We discuss here the diagnostic, therapeutic and operational aspects of this pathology and review the literature. Solitary fibrous tumors have to be carefully followed for evaluation. Bleeding and compression of surrounding tissues may result in catastrophic events. Best results can be obtained with surgery. In this case, we have not observed any residual lesions. Circular excision and purse-string suturing technique were safe to control bleeding. Large scar after excision can be easily repaired by plastic and reconstructive surgery. Our approach resulted in a satisfying operative result without harmful complications in such a difficult case. As a result,surgical approach should always be thought as an option regardless of size in case of solitary tumors.
Effect of Nitrogen, Zinc and Boron on Nutrient Concentration at Maximum Tillering of Wheat
Abstract
A field investigation was carried out at Palampur with sixteen treatment combinations consisting of four levels of N (0, 50,100 and150 per cent of recommended dose), two levels of Zn (0 and 10kg ha-1) and two levels of B (0 and 1kg ha-1) in factorial randomized block design. Highest grain (45.83 q ha-1) yield of wheat was recorded under 150 per cent of recommended dose of nitrogen which was 84.8 per cent higher than control. Application of 10kg Zn ha-1 increased the grain yield by 9.7 per cent. Similarly, boron application @ 1 kg ha-1 increased grain yield by 8.1 per cent. In general, application of nitrogen increased the concentrations of N, P, K, Mn, Fe, Cu, Zn and B in plants at maximum tillering of wheat. N, K, Mn, Cu and B concentration of wheat at maximum tillering increased with increasing level of nitrogen upto 150% recommended dose of nitrogen. P concentration increased upto 100% dose of nitrogen while Zn and Fe concentration increased upto 50% recommended dose of nitrogen. Application of Zn @ 10kg ha-1 resulted in increased N, K, Zn and B concentrations and decreased Fe, Mn and Cu concentrations. P concentration in plants of wheat at maximum tillering was not affected significantly due to Zn application over no Zn application. Boron @ 1kg ha-1 significantly increased N, P, K, Zn and B concentrations at maximum tillering of wheat.
Key words: Nitrogen; Zinc; Boron; Nutrient Concentration; Maximum Tillering; Wheat
Introduction
A crop absorbing enough of plant nutrients is expected to yield higher than a crop accumulates lower nutrients. Thus estimating nutrient concentrations is essentially an important task to have strategies for sustained higher yields. Nitrogen is one of the major plant nutrients and is an essential constituent of all living cells. It plays a number of functions in the plant growth as it is a constituent of proteins, enzymes and chlorophyll, and takes part in metabolic processes involved in the synthesis and transfer of energy. Its importance in crop production is emphasized by the knowledge that nitrogen generally occurs in relatively small quantities in soils in the available forms and is used in large quantities. However, continuous heavy application of only one nutrient disturbs the nutrient balance and leads to depletion of other nutrients as well as the underutilization of nutrients supplied through fertilizers. Single nutrient approach has often caused reduced fertilizer use efficiency and consequent problems of multiple nutrients deficiencies in cerealbased cropping systems. Accelerated depletion of micronutrients from soil reserve due to enhanced food grain production has accentuated the micronutrients deficiencies in many parts of India, which has brought sharp reduction in the macronutrient (NPK) use efficiencies Shukla [1-3].
Nearly 50 per cent of the Indian soils are deficient in zinc and likely to respond to its application. Deficiency of boron (33 per cent) follows zinc with one-third of the soil samples falling in deficient category Katyal. Responses to applied zinc and boron have been obtained across the soils in different agro-ecological regions of country. In view of imparting sustainability to the crops and cropping systems, incorporation of these products along with major NPK fertilizers open up new area of research. The high rainfall conditions prevalent in zone-II of Himachal Pradesh may favour the losses of these micronutrients. Their application in soil is expected to improve the crop productivity and may influence the use efficiency of macronutrients particularly of nitrogen. Keeping these facts in view, the present study was planned to reveal the influence of nutrients application in soil on nutrient concentrations on plants and subsequent effect of yield of wheat under mid hill conditions of Himachal Pradesh.
Materials and Methods
A field experiment was conducted at the Experimental Farm of the Department of Soil Science, CSK Himachal Pradesh Krishi Vishvavidyalaya, Palampur (320 6′ N latitude 760 3’’ E longitude and 1290 m altitude) during rabi 2010-2011. The area is characterized by wet temperate climate having severe winter and mild summer with mean annual temperature from 10.40C in January to around 300C during May-June. The average annual rainfall ranges between 1500 to 3000mm, out of which about 80 per cent is received during June to September. The mean relative humidity in the region varies from 29 to 84 per cent, the minimum being in April and maximum in July and August. The soil of experimental site was Typic hapludalf and acidic in reaction with pH value of 5.3. The experimental soil was silty clay loam in texture, medium in organic carbon, low in available N and medium in available P and K. The contents of DTPA extractable Fe, Mn and Cu were adequate whereas DTPA Zn was marginally adequate and hot water soluble B was insufficient. Sixteen treatment combinations were replicated thrice in factorial RBD and comprised four levels of nitrogen (0, 50,100 and 150 per cent of recommended dose of N), two levels of zinc (0 and 10 kg ha-1) and two levels of boron (0 and 1 kg ha-1).
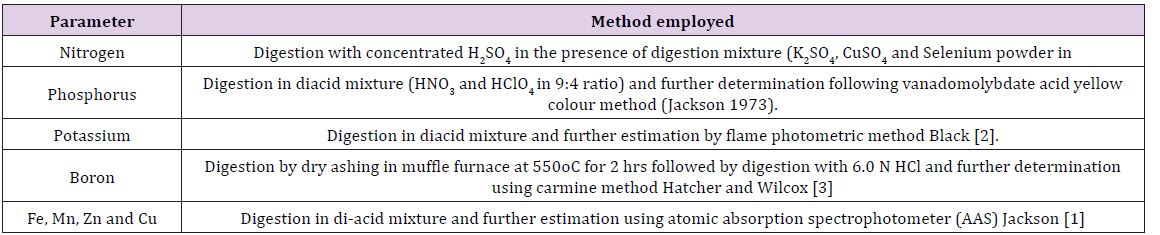
Recommended dose of N, Pha2O5, K2O for wheat is 120, 60, 30 kg ha-1. Half dose of N and full dose of P, K, Zn and B were applied at sowing time. The remaining half dose of N was top dressed at 30 DAS. The sources of N, P, K, Zn and B were urea, single superphosphate, muriate of potash, zinc oxide and borax, respectively. The wheat variety ‘HPW-155’ was sown on 29th November 2010 and harvested on 25th May 2011. The crop was grown with recommended package of practices under irrigated conditions. The wheat plant samples were collected at maximum tillering stage. Grain and straw samples were collected during threshing. The wheat plant samples collected at tillering stage and grain and straw samples collected after the harvest were brought to laboratory fresh. Then washed immediately in order to make them free from dust or any other adhering substances. Samples were first washed under running tap water. Subsequently, these samples were washed with acidified distilled water (1ml concentrated HCl per liter) followed by thorough rinsing twice with distilled water. The samples were then dried in an oven at 600C. The dried samples were then ground in a grinder fitted with stainless steel parts to pass through 1 mm sieve. These are then kept in paper bags for subsequent analysis. The detail of methods employed for chemical analysis is given below in (Table 1).
Table 1: The methods used for determination of nutrient concentration in plant samples.
Result and Discussion
Nutrient Concentration at Maximum Tillering
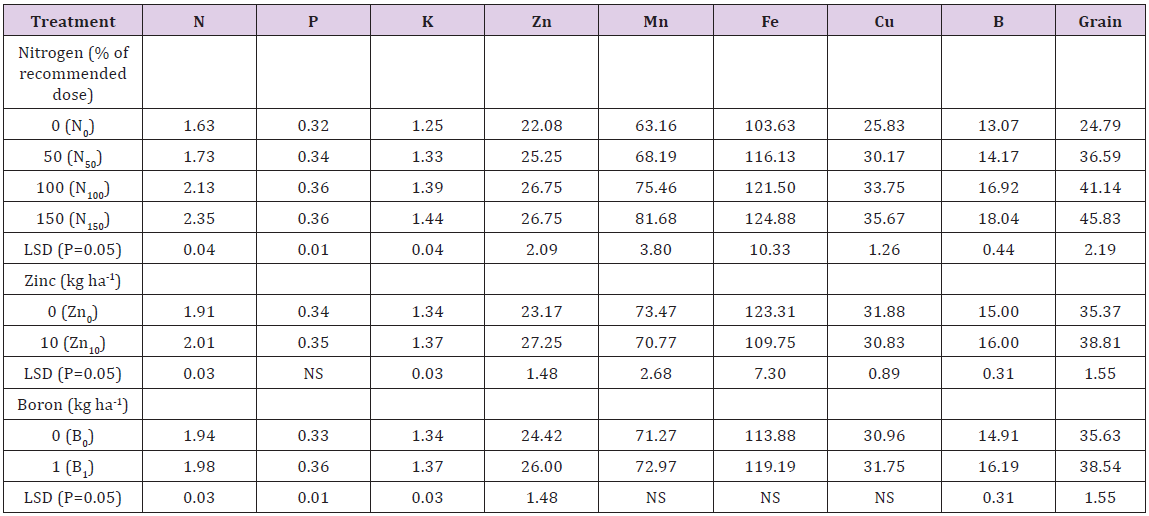
Application of nitrogen significantly affected its per cent concentration in plants of wheat at maximum tillering (Table 2). The variation in concentration of nitrogen was 1.63 per cent under no nitrogen application (N0) to 2.35 per cent under the treatment receiving super optimal dose of nitrogen (N150). This substantial increase can be due to increased N availability enabling plants to take up more nitrogen. Secondly, N application might have increased the root growth which favoured more removal of nitrogen by wheat plants. Zinc application @ 10kg ha-1 resulted in significant increase in nitrogen concentration of wheat tillers. It increased from 1.91 per cent under no Zn application to 2.01 per cent under Zn10. This increase in nitrogen concentration might be attributed to better plant growth as zinc helps in nitrogen absorption due to synergistic relationship between nitrogen and zinc. Similar findings were obtained by AbdEl-Hady [4]. Application of boron @ 1kg ha-1 significantly influenced nitrogen concentration over no B application. Nitrogen concentration increased from 1.94 per cent under B0 to 1.98 per cent under B1, respectively. It might be due to the role of boron in the absorption of nitrogen Das [5].
Table 2: Effect of nitrogen, zinc and boron on macro (%) and micronutrient concentration (mg kg-1) at maximum tillering and grain yield of wheat.
The phosphorus concentration of wheat at maximum tillering increased with increasing level of nitrogen upto 100 per cent recommended dose of nitrogen. Further increase in N level (N150) did not increase the P concentration of wheat tillers over its preceding level. Similar results were reported by Yadav [6]. However, application of Zn (Zn10) could not increase phosphorus concentration of wheat at maximum tillering over no Zn application (Zn0). Boron application @ 1kg ha-1 resulted in significant increase in phosphorus concentration. The increased P concentration might be due to the favourable effect of B which alters the permeability of plasma lemma at the root surface in such a way that P absorption increases Patel and Golakiya [7]. Nitrogen application resulted in higher K concentration. The maximum concentration (1.44 per cent) was recorded at highest rate of nitrogen application (N150) which was significantly better over rest of the N levels (N0, N50 and N100). The results are in accordance with those reported by Yadav [6]. K concentration also significantly increased with application of zinc @ 10 kg Zn ha-1. Similar results with application of zinc on K concentration in plants were reported by AbdEl-Hady. Similarly, application of boron @ 1kg ha-1 increased potassium concentration at maximum tillering (1.37 per cent) over no boron application (1.34 per cent). Slight increase in K content with boron application may be due to the fact that it depresses the uptake of Ca which otherwise has antagonistic effect on K as reported by Reeve and Shive [8].
Zn concentration increased from 22.08mg kg-1 under N0 to 26.75mg kg-1 under N100. Further increase in N level to 150 per cent of recommended nitrogen did not increase the concentration of Zn any more. The increase in Zn concentration might be due to synergistic effect between nitrogen and zinc as adequate supply of N enhanced the translocation of Zn from roots to other parts of plants. Further better root and shoot growth with the application of N might have led to better utilization of the zinc and other cations from the soil solution. Similar results were reported by and Lin et al. [9]. Zinc concentration increased with the increase of zinc in nutrient solution. Application of zinc @ 10kg ha-1 (Zn10) resulted in significantly higher zinc concentration (27.25mg kg-1) over no zinc application (23.17mg kg-1). The increase in Zn concentration with the application of Zn may be attributed to its enhanced supply through ZnO added externally. Ai-Qing et al. [10] also reported an increase in zinc concentration with its addition. B increased the zinc concentration by18 per cent over no application of B. Similar results were reported by Kaur [11]. Manganese concentration increased consistently from 63.16mg kg-1 under N0 to 81.68mg kg-1 under N150.
Per cent increase in Mn concentration due to application of 50, 100 and 150 per cent of recommended N was 7.9, 19.4 and 29.3, respectively. Similar observations were reported by Lin et al. [9]. Mn concentration decreased with the application of zinc @ 10kg ha-1 (Zn10). It might be because of negative effect of zinc on translocation of Mn as reported by Narwal and Malik [12]. Boron application could not significantly influence Mn concentration at maximum tillering of wheat. Iron concentration at maximum tillering increased with the application of nitrogen. It ranged from 103.63 mg kg-1 under control to 124.88 mg kg-1 under N150. However, the increase was not consistent above the application of 50 per cent of recommended N as the differences among N levels (50-150 per cent of recommended N) were not significant. Application of zinc @ 10kg ha-1 decreased iron concentration at maximum tillering from 123.31mg kg-1 under Zn0 to 109.75mg kg-1 under Zn10. This indicated mutual antagonism between these two nutrients. The antagonistic relationship might be attributed to the competition of Fe+2 with Zn+2 at absorption sites of roots causing inhibition in absorption of each other and also resulting in ionic imbalance. The ferrous (Fe+2) iron competes with zinc (Zn+2) in the uptake process for formation of chelates or other reactions Sinha and Sakal [13]. Similar results were reported by Ai-Qing et al. [10] in wheat. Application of boron increased Fe concentration under B1 (119.19mg kg-1) over B0 (113.88mg kg-1) but the difference was not significant.
There was significant and consistent increase in Cu concentration in wheat tillers with increased levels of nitrogen from 25.83 mg kg-1 under N0 to 35.67 mg kg-1 under N150. Application of 50, 100 and 150 per cent of recommended dose of N increased Cu concentration in wheat tillers by 16.8, 30.6 and 38.0 per cent, respectively. This might be due to better root and shoot growth and healthy plants in presence of higher nitrogen levels. As a result the plants might have taken up higher amount of nutrients including copper. Similar observations were reported by Lin et al. [9]. However, application of zinc @ 10kg ha-1 significantly reduced copper concentration in plant at maximum tillering. The decreased Cu concentration with Zn application might be attributed to antagonism of zinc (Zn2+) and copper (Cu2+) ions having same ionic radii and charge which compete with each other for the absorption sites in the plasma membrane of roots as both ions have been found to be absorbed by the same transport system Choudhary et al. [14]. Copper concentration varied from 30.96 at B0 and 31.75 at B1, however the increase in Cu concentration was not significant.
Boron concentration at maximum tillering increased significantly and consistently with increase in nitrogen level from 0 to 150 per cent of the recommended dose and values ranged from 13.07 mg kg-1 under control to 18.04 mg kg-1 under N150. Application of 50, 100 and 150 per cent of recommended dose of N increased B concentration in wheat tillers by 8.4, 29.4 and 38.0 per cent, respectively. This could be due to more vegetative growth and root growth, which release root exudates resulting in increased boron availability in soil and finally the uptake by plants. The results of the investigation are in consonance with the findings of Hellal et al. [15]. Application of zinc @ 10kg ha-1 also enhanced the boron concentration at maximum tillering from 15.0mg kg-1 under Zn0 to 16.0mg kg-1 under Zn10. Similar results have been reported by Kaur [11]. Likewise, boron application increased boron concentration significantly from 14.91 mg kg-1 under B0 to 16.19 mg kg-1 under B1. The per cent increase in B concentration was worked out to 13.4 over no B application. The increase in boron concentration may be ascribed to increased availability of boron through the addition of borax.
Grain Yield
There was consistent increase in grain yield of wheat upto 150kg N ha-1. Application of 50, 100 and 150 per cent of recommended dose of N increased the grain yield of wheat by 47.5, 65.9 and 84.8 per cent, respectively over the control. Increase in yield by N might be due to increased vegetative growth, more synthesis of carbohydrates and their translocation for the synthesis of organic nitrogen compounds which are constituents of protoplasm and chloroplasts. The results are substantiated by the findings of the studies conducted by Mattas et al. [16] and Roshan et al. [17] at different locations. Significantly higher grain yield was recorded with the application of Zn. The per cent increase in grain yield with Zn application was 9.7 over no zinc application. The increase in grain yield on zinc addition might be due to enhanced formation of growth hormones such as auxin. Further, it also promotes starch formation and seed maturation. Such a response to application of zinc in deficient soil was quite obvious. Similar findings were reported by Keram et al. [18]. Application of boron @ 1kg ha-1 also increased the grain yield of wheat. The per cent increase in grain yield with B application was 8.1 over no B application. The increase in grain yield of wheat on boron application might be due to positive role of B in reproductive physiology essential for grain formation and development in the boron deficient soil Agarwal et al. [19]. Beneficial effects of B on grain yield of wheat have also been reported by other workers Debnath et al. and Nadim et al. [20,21].
Biobank is a depository for biomaterials for biomaterials from a representative portion of a representative portion of a human population.
a) The Biobank acts as a vault with intricate detailed information pertaining to the individuals from whom biological materials have been collected.
b) Data collection: Data collection and proper and proper cataloging are essential are essential components for the success components for the success of a Biobank [1-3].
Types
a) Tissue bank Tissue bank
I. Surgical tissues,
II. Transplant tissues
III. Transplant tissues
b) Cancer / Tumor bank Cancer / Tumor bank
c) Cord blood / Stem cell bank Cord blood / Stem cell bank
d) Blood bank Blood bank – Dried Blood Spots Dried Blood Spots
e) Body fluids Body fluids
i. Synovial,
ii. Urine,
iii. Sputum,
iv. Buccal scrapings,
v. scrapings,
vi. Sperm
f) DNA / RNA bank DNA / RNA bank
g) Cornea bank Cornea bank Functional Division
Divisions
Cell and Molecular Biology Cell and Molecular Biology
a) Blood Center Blood Center
b) Pathology
c) Genetics
d) Bioengineering
e) Cryobiology
f) Bioinformatics
g) Ethics
Indications
a) Research work-biomedical experiments for a particular disease in a specific population.
b) Routine work-health centers, hospitals, health centers, hospitals, blood transfusion centers and Public / Private pathological laboratories.
c) Epidemiological work– monitoring in susceptible populations after disease outbreak, poisoning and / or pollution.
Ethical /safety issues
For tissue banking, freely given informed patient consent is mandatory. Patient consent forms needs to be upgraded from time upgraded from time -to -time following IRB regulations.
a) Model Consent Form
b) Confidentiality
c) Quality assurance checks necessary for right from planning, implementation, up to documentation and analysis.
d) Safety is crucial:
Biobank in India
NIMHANS: Brain Biobank
ACTREC, Mumbai: cancer Biobank
Repositories in India
a) Organ Retrieval Banking Organ Retrieval Banking Organization (ORBO), Organization (ORBO), AIIMS, New Delhi
b) National Repository for National Repository for Cell Lines / Cell Lines / Hybridomas, NCCS, Pune
c) Mycobacterial Repository, Mycobacterial Repository, JALMA, Agra JALMA, Agra
Conclusion
India has a population India has a population of over a billion and is of over a billion and is the world the world’s largest s largest democracy. India has a very high burden of communicable and communicable and non -communicable communicable diseases. India has the means to make a modest start towards establishing a Biobank.
Structure of Single Particles from Randomly Oriented Ensembles Using an X-Ray Free Electron Laser
Abstract
The method of time-resolved crystallography offers a method of studying fast changes in structure during a chemical reaction. However, being a crystallographic method it is restricted to crystal structures. The problem with this is that most chemical reactions under physiological conditions happen in solution and not on molecules which are part of a crystal. The main problem with trying to find chemical reactions in solution is that one needs a powerful source of X-rays which will give a measurable signal even from small numbers of randomly oriented molecules. The newly developed X-ray free electron laser allows this when combined with a novel theoretical technique. Of course we understand one of the strengths of working with crystals is that the signal comes not from one but from trillions of identically oriented unit cells. The fact that the unit cells are identically oriented means that the X-rays do not have to scatter off a single molecule (or unit cell) to give a sensible signal. Since all molecules are identically oriented information about an idealized average molecule may be obtained from scattering by a crystal even though the different photons scatter off different molecules. The problem is that most chemical reactions do not take place in crystals.
Two main developments allow us to overcome this limitation. One is the development of the X-ray free electron laser (XFEL) which is capable of producing X-rays many orders of magnitude brighter than any previous X-ray source. If it is possible to determine the structure of a single particle without the need for crystals we will have achieved our goal. Luckily there has been a corresponding increase in understanding of scattering by disordered arrays. One of the things that has become realized recently is that if one concentrates not on the bare intensities of scattering, but on what are known as their angular correlations these said correlations are characteristic, over most of their range, of the structure but on not of the orientation of the molecules, provided the scattering is from a dilute disordered ensemble. Consequently, the way has been opened for the study of molecules via scattering by ensembles that are not identically oriented. What is more, techniques have further been developed for following fast changes in the structure of such molecules in a pump-probe experiment.
As evidenced by the Krebs (or citric acid) cycle [1] life functions via a series of chemical reactions. The experimental study of such reactions is therefore of great interest. Methods of studying such reactions date back at least to fem to second time- resolved photoelectron spectroscopy [2]. High spatial resolution was added by the use of x-rays in the technique of time-resolved crystallography [3]. This latter method originates in the era where there existed only weak X-ray sources. At that time X-rays were used to obtain information about a single molecule only by scattering off a large number of identically oriented copies. Luckily there exist natural structures (crystals) that many substances form which allow this. A typical crystal used in such work contains perhaps a trillion (1012) identically oriented molecules. A problem is that most chemical reactions in nature do not take place in crystals. Indeed steric hindrance may prevent many important reactions in solution from ever happening in crystals [4].
Two recent developments may allow this limitation to be overcome. One is the development of a much brighter X-ray source known as a X-ray free electron laser (XFEL). The world’s first XFEL, the Linac Coherent X-ray Source (LCLS) is now operational at Stanford in the U.S. Another such machine is now operational near Osaka in Japan. Others are planned, in many countries, e.g. Germany, Switzerland, Korea and China. It is true that these machines are very expensive and require the resources of a rich nation or group of nations. Consequently there is likely, by and large, to be only a single machine per country for the foreseeable future (although a second XFEL is planned for the US). There has also been a corresponding improvement of theoretical understanding of fundamental diffraction theory as it had been realized the angular correlations amongst the scattered intensities are characteristic of the structure of a molecule but not of its orientation.
Chemical bonds tend to make each molecule identical apart from their orientations in a solution and the method of angular correlations is ideal to study such reactions. It is true the molecules are swimming in a sea of solvent molecules, in this case largely disordered water molecules. The effects of scattering by solvent have not been studied a lot, but the case of cryo-EM where the molecules swim in vitreous ice, the effect the vitreous ice, consisting of largely randomly oriented waier molecules, the solvent is found not to contribute much to the correlated scattering, and so can be ignored, except that coming from the solvent which might be about 100 times more prevalent that the solute may give rise to Poisson scattering that might interfere with the measured correlations. However, Poisson noise reduces the greater the intensity. Consequently, the scattering by a much larger solvent is actually advantageous.
One of the greatest experimental challenges with single particle work at an XFEL is the extremely low “hit rates” of about 0.1%. This means about 99.9% the beam hits empty solvent which contains no particle of interest. The ability we describe in this paper of obtaining structural information from ensembles of particles allows us to use a much higher concentration and overcomes the hit rate problem. Our hit rates are essentially 100%”
Theory
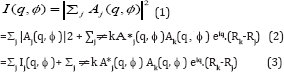
Before proceeding further we would like to discuss angular pair correlations that play a central part of our theory. Suppose A. are the scattered amplitudes from protein j of a set that is illuminated. The total intensity expected to be measured in a coherent instrument like an XFEL is thus
Here the first summation contained on the incoherent (intensity) summation over different particles (already considered in [5-13] and [14] while the second summation contains the new (coherent) terms which give rise to interparticle interference. Likewise,
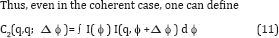
Where q’ is the scattering vector corresponding to the point (q, ϕ ,+Δϕ) on the detector (in polar coordinates). Here also the first summation contains the incoherent terms and the second summation contains the interparticle interference additions. So for coherent scattering, the pair angular correlation defined by
Where the expression <…>DP represents an average over the measured diffraction patterns and the I’s in the integrand may be taken from (3) and (4). Thus,
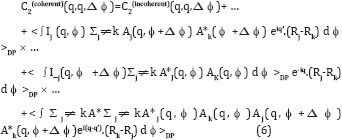
Now in integrating over ϕ neither q nor q’ ever become zero unless one considers q=0 or q’=0, which only exist under the beam stop, and are therefore not measured. Thus in practice the 2nd and 3rd terms on the RHS are negligible since they are associated with random phases. On the other hand, the 4th term has an argument of the exponential that can become zero even on the resolution ring, and therefore does not need to be small at the points where the argument becomes zero. Here C2(incoherent) contains only contributions from the first incoherent summations in (3) and (4) in addition to the newer coherent terms. The 4th term contains double sums in (3) and (4). In the end only the 1st and 4th terms survive, and one may write, to a good approximation
Where C2(incoherent) contains only contribution from the first (incoherent) summations in (3) and (4) and the remaining term contains the specifically interparticle interference effects that arise from the coherence of the XFEL. Here Δϕ represents the vector in the direction of increasingΔϕ. For most values of Δϕ, the randomness of Rj-Rk makes the phases associated with the exponential random and thus the difference between the coherent and incoherent expressions become negligible. An exception occurs when Δϕ approaches zero. Then despite the randomness of Rj– Rk the phases of the exponential terms tend towards zero, which is clearly not random. It will also be noted that at this point Aj(q, ϕ + Δϕ) ® Aj(q, ϕ) and Ak(q, ϕ+Δϕ) ® Ak(q, ϕ), and so the integrand of (7) ® Ij(q, ϕ) I_k(q, ϕ) which is always positive.
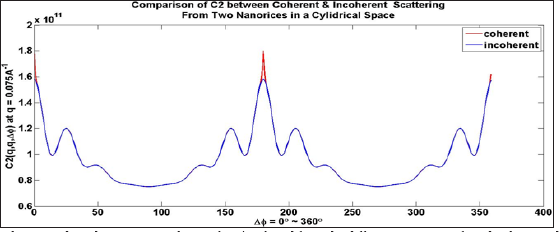
Consequently, C2(coherent) is always greater that C 2(incoherent) Thus, the coherent peak will always be larger than the incoherent peak, as seen by the red part of the curve and consequently at the equivalent point at ϕ=2π. For a flat Ewald sphere, Friedel’s Law requires that the intensity at Δϕ = π be equivalent to that at Δϕ =0, and hence Figure 1 (which assumes a flat Ewald sphere) has three highly localized red regions consisting of coherence peaks. This is, of course, for two randomly oriented particles. For more randomly oriented particles the height of these peaks will be higher while the widths will be the same (and inversely proportional to the width of the illuminated area via the uncertainty principle) (Figure 1).
Figure 1: Coherent and incoherent C2 correlations for q’=q found from the diffraction patterns of randomly spaced particles by averaging all the diffraction patterns.
Note the difference between the correlations is only that the coherent patterns have an extra high but narrow peaks at Δϕ=0,π (for a flat Ewald sphere, due to Friedel’s Law), and 2 π (same as 0). Alternatively, if one chooses to plot the correlations for |q-q’| greater than the width 2 π /L, where L is the lateral coherence length, the coherent and incoherent C2‘s will be equivalent throughout the entire range [15]. For a dilute ensemble of randomly oriented particles therefore, over most of the range of Δϕ our previous assumption that C2 be represented by the incoherent value remains true. Thus,
is still valid to a good approximation for coherent radiation. For a flat Ewald sphere, one can take θ (q)= π/2 and cos( θ (q)}=0 and sin( θ (q))=1, so, to a good approximation,
Figure 2: Diffraction patterns of two individual nanorice particles of random orientations (top panels), the diffraction pattern of two incoherently superimposed ones (bottom left panel) and of coherently superposed ones (bottom tight panel).
We next tried to simulate the conditions of a nanoparticles representing a small protein like photoactive yellow protein (PYP) within a coherence volume that one would expect of a focal spot size of 0.1 microns (the design specification of the Linac Coherent Light Source (LCLS) at Stanford, California) and the smallest droplet size claimed of (0.3 microns). This gives an illuminated volume of 0.03 cu. microns. For single particles the resulting diffraction patterns are as shown on the first two panels of Figure 2, When there are two randomly oriented particles the diffraction pattern looks like the one in the 3rd column if one assumes no coherence between the two diffraction patterns. When one introduces coherence the diffraction patterns due to two particles appear like that in panel 4, with a set of narrow inference fringes characteristic of the spacing of the particles. Even in this case the values of C2 of the incoherent and coherent cases are almost identical over most of the range of Δϕ due to the randomness of the particle positions making the specifically coherent terms sum to a small quantity [15] (Figure 2).
Note that only the coherently added diffraction patterns have interference fringes. The effects of the interference fringes on the C2‘s almost disappears over most of the range of (q,q; Δϕ) since the fringes are randomly spaced and oriented. This gives rise to essentially the same C2‘s as in the incoherent case except for isolated regions around at Δϕ =0, π and 2 π when the phases become zero and are therefore not random. Similar peaks appear in Kam’s two-point triple correlations C3(q,q; Δϕ) [10], i.e. they also have narrow peaks at Δϕ =0, π and 2 π . On the other hand there are no coherent peaks associated with the correlations between different resolution rings such that |q-q’| is greater than 2 π /L, where L is the transverse coherence length [15].
In this case the integral over the coherent curve in Figure 1 gives almost the same answer as an integral over the incoherent curve in the same figure that has been considered before, in order to find Bl(q,q). Similarly an integral over C3(q,q;Δϕ) may be performed to find a good approximation to Tl(q,q). Since both B and T are found from the same diffraction pattern (whether it comes from a single particle or several) it is possible to reconstruct an image of a single particle since both C2 and C3 are proportional to the number of particles. Since both C2 and C3 are derived from the same set of diffraction patterns the ratio of C2 to C3 will be the same as for single particle, thus allowing exactly the same algorithm for any collection of diffraction patterns corresponding to an arbitrary number of particles. This allows one to reconstruct an image of a single particle from the angular correlations of many, even with the existence of interpartice interference. For incoherent scattering this has been demonstrated in 2D even with experimental data [6]. However, we think this is the first time this capability has been demonstrated in 3D (Figure 3).
Figure 3: Density of single particle of nanorice of size approximately 50 A recovers from an illuminated area of approximately 1000 A squares from 8000 two particles simulated diffraction patterns including noise and interparticle interference.
In cases where the extra coherent peaks give rise to significant changes in the values of B, and T, an integral that avoids these points gives almost the same value as the incoherent case. This is a bit like the principal part of an integral in complex analysis, except that the ordinate is not infinite in this case, the result of the integral over these regions remains very small. Consequently, the integral over the restricted range for the coherent case gives almost the same result as the integral over the whole range for the incoherent case [15]. It should be noted these deviations between the coherent and incoherent cases are confined to cases where q=q’ (same resolution ring). Alternatively, one may avoid this problem if one retrieves information only from different resolution rings (off-diagonal C2‘s and C3‘s) (or q ≠ q’ (since the deviation between the coherent and incoherent cases only occur for the correlations with q=q’ at these localized points). Even if one chooses to obtain information from the terms with q=q’ one may avoid the sharp coherent peaks and obtain the quantity Bl(q,q’) to a good approximation [15].
Where N is the number of particles scattered off. This quantity may contain vital information about the diffraction volume we seek.
Where I is the total intensity of the diffraction pattern, provided one avoids the narrow regions around Δϕ =0 (and their Friedel counterparts) that are characteristic of coherent radiation. At least in 2D it is clear [10] that this is a quantity independent of the orientation of the particle and hence diffraction pattern. (It is in 3D also [7,8]). The quantity depends only on the difference, Δϕ, the azimuthal angle between two points involved in the calculation of the correlations. Effectively one is comparing the scattering of a single particle in various relative directions, a quantity that is independent of the particle orientation. The fact that this is independent of particle orientation makes it suitable for use with an ensemble of identical particles differing only in orientation. The total signal will be proportional to the number of particles, thus we gain the advantage of a crystal (or at least of a microcrystal) with a signal contributed by multiple particles. Since there are some questions about the feasibility of the signal-to-noise ratio with a large number of particles, the initial tests will be on a small number of particles.
This will be possible since an XFEL will be expected to be initially focused on an area of radius 100 nm, perhaps 20 times larger in linear dimensions than a small protein. The Legendre transform of C2, see Eq. (9), gives rise to a quantity that can be shown to be characterized by the spherical harmonic expansion of the scattered intensities. That is, it can be shown that if the coefficients I_lm(q) may be extracted from these quantities, one may reconstruct a 3D diffraction pattern of the scattered intensities via the expansion
I(q) = Σlm Ilm(q) Ylm(θ,ϕ) (12)
Where Ylm( θ , ϕ) is a spherical harmonic of angular momentum quantum numbers (lm). θ and ϕ are 3D polar angles. A problem is that, in general, the extraction of the Ilm coefficients from the Bl’s is not a trivial task, although there are specific high-symmetry circumstances when this has been shown to be possible [11,12]. One of these is when there is azimuthal symmetry in the particle for example a grain of nanorice. In this case the azimuthal symmetry of the particle results in an azimuthal symmetry of the diffraction volume [15] If the diffraction volume is azimthally symmetric, one may take m=0 in (10). This immediately suggests
|I10(q)|=√B1(q,q) (13)
This gives the magnitudes of all allowed values of the expansion coefficients. The only remaining task is to find their phases. They may be found from the diagonal triple correlations defined by
Which may be evaluated from the ensemble of diffraction patterns just as easily as the pair correlations (we don’t need to be concerned about the coherent peak as it is so narrow that we can ignore it His still allows us to capture the incoherent peak Alternatively one can devise an algorithm that uses only C2(q,q’;Δϕ) with |q’-q|>2π/L where L is the width if the illuminated area. It may be shown that over most of the range of Δϕ even for coherent radiation (once again it would be best to avoid the red high-intensity peaks in Figure 1 at Δϕ =0, π, and 2π if q=q’ (correlations taken over the same resolution ring) [16].
Reconstruction of a Single Particle from Multiple Particle Diffraction Patterns
The importance of scattering by multiple particles is because there is still a considerable gap between the focal spot size aimed for by the XFEL instrument manufacturers and the sizes of typical proteins. Suppose one uses a concentration of 0.6 moles/ m3 as in SAXS. The design specification of the world’s first X-ray free electron laser (XFEL), the Linac Coherent Light Source (LCLS), is for a focal spot size is about 0.1 micron square, and since the minimum size of a liquid droplet claimed is about 0.3 microns [17], the volume illuminated will be about 3×10-21m3, or else about 1.8×10⁻²¹ moles. But Avogadro’s number is about 6×10 molecules/mole. Thus the minimum number of molecules illuminated will be about would be about 400.
Thus we have to conclude that for the study of small proteins such as PYP, single molecule studies are still some way in the future, and that, in the meanwhile, we need either nanocrystals or a number of independently randomly oriented molecules, and a theory of type presented here if clustering of the molecules can be avoided. If the molecules cluster, it’s probably better to use a “hitfinder” to eliminate multiple particle hits beforehand and then to use any of the theories proposed (including this one) for structure solution
Although this has been claimed before [7,8], we have now actually tested this proposition in real simulations, not stopping at showing that the correlations are the same (apart from a scaling factor), but reconstructing an image from two particles per shot from the correlations. We have shown that a particle may be reconstructed from both B1(q,q) and T1(q,q)’s from a single particle if m=0. We show here that exactly the same method may be used for multiple particles in independent random orientations in each snapshot diffraction pattern since the scaling factor of both B and T are the same for a given number of particles. This will always be the case: the diffraction patterns from which B and T are evaluated will come from exactly the same numbers of particles since in general they will be from the same diffraction patterns. For purposes of illustration here we considered only two particles in independent random orientations, but this illustrates the main point. We simulated
Where (α 1,β 1,γ 1) and (α 2,β 2,γ 2) are independent sets of random Euler angles. We did explicit simulations of the expected diffraction patterns and calculated from them the angular correlations B and T and reconstructed from them, by the same algorithm for the single-particle case, a real space image. The image we found is shown in Figure 3.If indeed the conditions of a dilute ensemble of identical particles can be achieved, there will be no need for a hit-finder program [18] to reject multiple-particle hits provided the particles are truly random in position (dilute ensemble). The fact that the particle-number-dependent scaling factors are the same for the pair and two-point triple correlations means it is not necessary to know at the outset exactly how many particles there are in the ensemble since both the pair correlation and two-point triple correlations are derived from diffraction patterns with exactly the same number of particles.
The possibility of using diffraction patterns possibly from multiple particles adds considerably to the capability of the use for the XFEL for structure determination of individual particles as it will add greatly to the “hit-rate”. Our simulations suggest that here may be even advantages to considering diffraction patterns from ensembles of multiples in terms of convergence. In light of this the only case we see for hit-finder program at least one that determines single particle hits is when the particles tend to stick together and agglomorate. In such a case it might be better to determine the structure from single particles. In should be pointed out that despite the fact that it is capable of dealing with cases of multiple randomly oriented particles, it is also a method of determining the structure of a single particle from diffraction patterns of a single particle in random orientations [18].
The values the magnitudes of the spherical harmonic expansion coefficients are determined from (13). Also, as B^q,q) is determined by the integral of a real quantity C2 with a real Legendre polynomial, it is real and has a positive square root. The only remaining task is to determine the sign of Il0(q). We can determine this sign from the triple correlations by assuming, as it must be for nanorice,that azimuthal symmetry of the amplitudes implies azimuthal symmetry of the intensities from the usual Clebsch-Gordon rules for adding angular momenta. In this case, all magnetic quantum numbers are equal to zero, and the triple correlation reduces to a sum over only the angular momentum quantum numbers l, and not also magnetic quantum numbers m. Thus,
Where G is a gaunt coefficient [19] Note that the two-point triple correlations are scaled for multiple particles by exactly the same factor N as the quantities Bl.
Since an ellipsoid has azimuthal symmetry about a particular axis, we can choose that particular axis as z-axis, thus eliminating any other components of the magnetic quantum number except m=0. |Il0(q)| can be obtained directly from B1(q,q) via (13). The only unknown here is sign of I_(l0}(q). The sign can be determined by fitting all possible signs of Il0(q) to the values T1(q) of the triple correlations calculated directly from the diffraction patterns of random particle orientations in (16). It should be stressed that the number of equations is equal to the number of distinct Tl(q,q) values, namely the numbers of q and l values, as is the number of unknowns Il0(q), so there is no information deficit [20] (Figure 3).
After obtaining the signs of the Il0(q), the single particle diffraction volume can be calculated from
I(q)=Σ1 I10(q) Y10(q) (17)
And an iterative phasing algorithm produces the real space image of Figure 3.
It should be pointed out that, for a single particle, the structure of such a simple particle had been determined even experimentally by a different method [21], which is a true single particle method and does not have the ability to reconstruct a single particle from diffraction patterns of multiple ones. In fact, the ability to recover an image of a single particle from the diffraction patterns of many is unique to our method. It should also be pointed out that Figure 3 was obtained from diffraction pattern intensities simulated under the coherence assumption since the difference between the coherent and incoherent intensities are highly localized at Δϕ =0, π and 2π in the angular correlations.
Experimental Determination of the Time-Resolved Structure of Proteins
Armed with these facts about angular correlations, and their remarkable ability to study structure from disordered ensembles, we return now to the main problem addressed in this paper, namely the recovery of time-resolved information about proteins from XFEL diffraction patterns. Paradoxically, it is easier to extract useful information from more complex particles in a time-resolved experiment of the form of Figure 3, although the advantages suggested above of not needing to focus on a single particle remain. In this arrangement the particles are incident on an XFEL in a liquid jet. A short time before the incidence of the X-ray beam on the liquid jet it is illuminated by light from an optical laser which puts suitable molecules into a light-induced excited state. A schematic diagram of the apparatus is shown in Figure 4. Although this experiment describes excitation by light, other similar experiments may be considered in which one studies the set of molecules immediately after they has been mixed with a substrate, for example. As we have already seen.
Figure 4: Schematic diagram of the experiment on deducing time-resolved structure from disordered ensembles.
A quantity that is independent of the particle’s orientation (although dependent of the particle structure) is those related, example to the angular pair correlations, C2. This will undoubtedly change Bl(q,q’) by a quantity δ B(q,q’), which in turn may be measured by measuring the values of B. before and after the reaction. Interestingly, it is possible to find a linear relation between δBl(q,q’) and the change in the electron density δp (r) of the molecule. Since in general there will be a time delay between the optical laser excitation of the molecule and its interrogation by the X-ray beam, if the structure after the excitation may be deduced from the measured X-ray diffraction patterns, one would get a handle into the structure a specified time after the excitation. Since this time interval may be varied by just choosing to illuminate the particle beam a different distance from the incidence of the X-ray beam, one is able to follow the time-resolved changes in the structure of the photo excited molecule that is the course of light- induced chemical reaction.
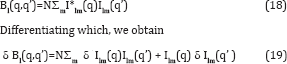
The central experimental quality one uses is Bl(q,q’) which we have seen is the Legendre transform of C2(q,q’;Δϕ) which, being a pair correlation, is characteristic of the particle structure, but not of its orientation [7,8]. We ultimately want to find the change δ p(r) in the electron density of each molecule (assumed identical, as one must expect of molecules) corresponding to an 0 Bl(q,q’) which in turn is derived from the experimentally measured C2(q,q’; Δϕ). It can be shown that the quantity Bl(q,q’) can rewritten in the alternative form
In terms of the spherical harmonic expansion coefficients Ilm(q) of the diffraction volume of a single particle. Also note that
δIlm(q) = ∫δI(q) Ylm(q) dq. (20)
In order to relate this to the change δp in the electron density one should convert small changes in the intensity to small changes δ A in the amplitude, which one can do by differentiating. Since
At first sight it is a bit disappointing that both δ A and its complex conjugate appear on the RHS. However as we will see, this is of little consequence since the quantity we are ultimately after, namely the change in the electron density of the molecule, δp(r), is real. Since
It’s possible to relate both to the change δp (r) in the real electron density. In summary, it is possible to find a linear real relation
Where fk is the form factor of the k-th atom in the molecule Eq. (24) is the relationship we sought [22,23]. Note that since B1 is a quantity independent of the number of identical particles, all our arguments for the scattering is not off one but an ensemble of particles of random orientations still hold. This is of advantage experimentally as we have pointed out before. This relationship has many similarities to the difference Fourier formula used in conventional time-resolved crystallography [3,24]. They both require as input the “dark” structure, i.e. the structure of the unexcited molecule. They both recover the difference density δp in the frame of reference of the “dark” structure. In both cases, the latter factor allows the difference electron density to be displayed ultimately using standard crystallographic software superimposed on a model of the “dark” structure that the changes in the structure on photoexcitation are more obvious. It should be noted that although individual particles are in random orientations an initial reconstruction of the angular correlations allows one to reconstruct the electron density in an orientation of one choosing (since all orientations correspond to the same angular correlations). We choose the frame of reference of the “dark” structure, by a suitable definition of the matrix M, because it allows the display of the electron density changes using exactly the same software as time- resolved work with crystals.
One thing we should point out is that like the difference Fourier method, this is a non-iterative way of getting at the difference electron density directly from the measured data. It seems to be accurate enough to determine structural changes at the level of the residues of a protein. This is seen in Figure 5 [22] in which is shown the expected difference electron density calculated by our algorithm of the expected difference structure of photoactive yellow protein (PYP) 2 ms after photoexcitation. This figure suggests that the reconstruction survives Poisson noise which is included in the simulations. It will be noted that after 2ms two residues are expected to move simultaneously, the chromophore as well as the nearby ARG residue which moves in response. Some evidence of the movement of both is just seen in the reconstructions, although the larger movement of the chromophore is more evident. As is customary in time-resolved work, the red regions indicate a deficiency of electron density in the final image and a green lobe indicates an increase in the electron density. Thus looking at these electron density maps gives an indication of the structural changes a short time measured time after photoexcitation.
Figure 5: Difference electron density expected 2ms after photoexcitation. These calculations offer a realistic simulation as they assume that the diffraction patterns include Poisson noise. We consider three different numbers of particles as well as three different incident photon counts.
In keeping with our featured capability of the correlation method it will be noted that the right hand column features as many as 25 randomly oriented particles. These simulations were performed assuming an incoherent source of X-rays as the intensity from many particles is assumed to be the sum of intensities from single particles. The distinction with the coherent case is not very important over most of the range of the correlations as the randomness of particle positions give the scattering a kind of incoherence [9]. The only region where the coherence plays a part in when q=q’ and δϕ is approximately zero, π (due to Friedel symmetry) or 2 π (same as zero). We have suggested how to deal with these differences [15] (Figure 5)
Conclusion
The significance of this work is that if these simulations are realized in practice, we now have, for the first time, a method of finding the structures of particles such as molecules from diffraction patterns of copies of many of the molecules even if they are not of identical orientations as in a crystal. In the last application we have shown that even time-resolved structure may be determined of molecules that are in random orientations, thus opening to experimentally observing realistic chemical reactions. It should be pointed out that many of the effects we have ignored, such as scattering by solvent, are fairly unimportant for the time-resolved problem since here we look at differences in the correlations between the photo excited and ground state molecules, where such factors tend to subtract out. Indeed in the time-resolved problem we study only features of the diffraction patterns that are different due to the photoexcitation. Of course solvent is perhaps 100 times as prevalent as solute and could give rise to Poisson noise that does not cancel between the photo excited and ground state structures so some care has to be exercised.
An experiment has recently been reported in which the structure of the Mimi virus has been determined experimentally by a variant of the single particle methods described earlier [23]. It has been previously shown by us [10,11] that under various high-symmetry situations, that it is possible to determine the structure of the particle from simulated diffraction patterns. In an experiment to recover time-resolved structural variations, starting from a knowledge of a nearby structure, using many of the same quantities, namely, the angular correlations, have also been shown to be capable of recovering time-resolved changes in a structure from the knowledge of a closely related structure of a single molecule in realistic simulations, including shot noise [24] even from diffraction patterns of multiple particles, as we demonstrate here. This possibility is unprecedented in structural work with XFEL diffraction patterns. This method also works on diffraction patterns of multiple particles in independent random orientations.
Vermitechnology Based Tribal Women Empowerment for Economic Development in Himachal Pradesh
Abstract
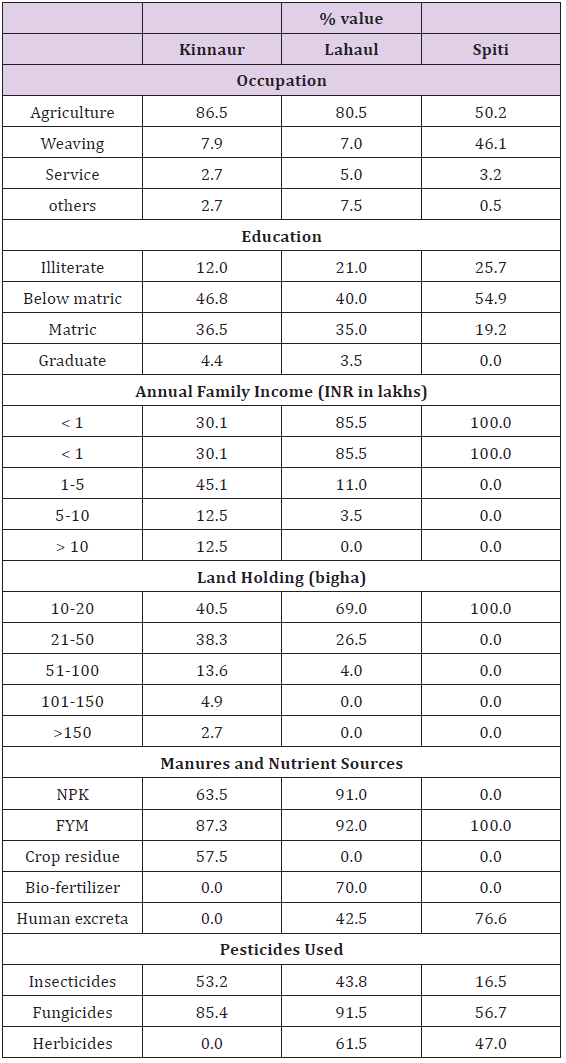
A novel technique of converting decomposable organic wastes into valuable manure (compost) through earthworm activity is a faster and beneficial process. The earthworms are used as the natural bioreactors for making decomposition of the waste materials. Keeping in view the vast availability of organic wastes in Himachal Pradesh, a project was undertaken in tribal areas of the state to train women for dissemination of the technology and their economic upliftment. The study was conducted in two districts of Himachal Pradesh viz. Kinnaur and Lahaul & Spiti. From these two districts 68 villages were randomly selected (27 in Kinnaur and 41 in Lahaul and Spiti) and 858 farm families (371 in Kinnaur and 487 in Lahaul & Spiti) were approached through a pre-tested interview schedule. The independent variables selected for the study were educational status, annual income of the family, size of land holding, cattle population, organic waste, crop husbandry information, manures and pesticides used. The population engaged in agriculture was 86.5, 80.5 and 50.2% in Kinnaur, Lahaul and Spiti, respectively. Due to the cultivation of cash crops such as apple, pea, potato, rajmash etc. income of the tribal families was satisfactory especially in Kinnaur. However, in Lahaul and Spiti 85.5 and 100% farm families fall under low income group.
Crop residues were available in Kinnaur. In Kinnaur, Lahaul and Spiti only 53.2, 43.8 and 16.5%, respectively, of the families were using insecticides. The respective use of fungicides in these areas was by 85.4, 91.5 and 56.7% families. None were using herbicides in Kinnaur, while 61.5 and 47% families were using in Lahaul and Spiti, respectively. In Kinnaur, Lahaul and Spiti 97.9, 95.5 and 96.9% of the total families were rearing cows. Thus after crop husbandry, animal husbandry/dairying is the other important activity taken up by the tribal farmers. In Kinnaur, Lahaul and Spiti quite a satisfactory amount of waste was available for this activity being taken up in a big way in the area. The kitchen waste in villages is directly fed to the livestock reared by the farmers. In total, 30 training programmes were organized in far flung and difficult to reach villages, where 1245 tribal women farmers were trained and 175 vermicomposting units were set up. The vermiculture were distributed free of cost for these units. The participation in State Tribal Festival at Rekangpeo helped in spreading vermitechnology activity to about 5000 tribal farmers. These studies were a step for tribal/rural development for providing balanced nutrients for enhanced crop productivity as well as a source of earning a rural livelihood.
India produces about 3,000 million tons of organic wastes annually which could be utilized for recovering important resources like manures, fuel, food and fodder. Beside biogas and alcohol, this huge amount of waste has also the potentiality to produce 400 million tonnes of plant nutrients Dash and Senapati [1]. A novel technique of converting decomposable organic wastes into valuable manure (compost) through earthworm activity is a faster and beneficial process. The earthworms are used as the natural bioreactors for making decomposition of the waste materials. In whole of Himalayan region in general and tribal belt in particular, the majority of agricultural operations are carried out by women, where as men mostly engaged in earning livelihood, procuring agricultural inputs and marketing of the agricultural produce. Keeping in view the vast availability of organic wastes in Himachal Pradesh and involvement of women in agriculture, a project was undertaken in tribal areas of the state to train women for dissemination of the technology and their economic upliftment.
Methodology
As desired by the sponsoring agency, the study was conducted in two districts of Himachal Pradesh viz. Kinnaur and Lahaul & Spiti. From these two districts 68 villages were randomly selected (27 in Kinnaur and 41 in Lahaul and Spiti) and 858 farm families (371 in Kinnaur and 487 in Lahaul & Spiti) were approached through a pretested interview schedule. The independent variables selected for the study were educational status, annual income of the family, size of land holding, cattle population, organic waste, crop husbandry information, manures and pesticides used. The training camps (one day, off campus and on-campus) have been organized by involving village gram pradhans, Mahila mandal Pradhans and the self help groups. The Pradhans of these two democratic village bodies as well as SHG’s in many of training programmes were fully involved in training programmes, establishment of vermitechnology units and culture distribution to tribal women farmers. Farmers have been distributed literature on the technology and after care of the units so established. The follow up visits were also conducted to see the success of units so established, feed back and further educating the farmers. The on-farm trials on rajmash were conducted in Kinnaur whereas on pea in Lahaul.
Result and Discussion
Occupation and Education
The majority of the population in the tribal belt was engaged in agriculture including horticulture for their livelihood. The population engaged in agriculture was 86.5, 80.5 and 50.2% in Kinnaur, Lahaul and Spiti, respectively (Table 1). This was the major strength, for success of the vermicomposting activity to be taken up in the tribal belt. The majority of the tribal area remains covered with snow in winter, and crops are not grown in the field during that period. Therefore, weaving is the next major activity taken up by 7.9, 7.0 and 46.1% of the surveyed families in Kinnaur, Lahaul and Spiti, respectively. Majority of the population was illiterate or below matrix which was mostly engaged in agriculture or horticulture.
Table 1: Occupation, education, annual income, land holding, manures and nutrients and pesticides used.
1 bigha = 800m2
Income and Landholding
Due to the cultivation of cash crops such as apple, pea, potato, rajmash etc. income of the tribal families was satisfactory especially in Kinnaur. However, in Lahaul and Spiti 85.5 and 100% farm families fall under low income group. Since vermicomposting is a low investment requiring activity, indicating self reliance on the part of the farmers for this activity to be taken up independently provided technical know-how given. Operational/owned land holding size was also satisfactory and all the surveyed families possessing more than 10bighas (1bigha= 0.08ha) of land. This indicated that besides taking Vermicomposting as a livelihood enterprise, the produce (vermicompost) is itself required by the farm family for its own use in the farm.
Sources of Nutrients and Pesticides Used
Majority of the families use FYM as a source of nutrients produced either by themselves or through purchase. Crop residues are also available in Kinnaur. In Lahaul and Spiti 42.5 and 76.6% of the population were also using human excreta as a source of nutrients in their fields. In Spiti, none of the families were found using fertilizers. However, in Kinnnaur and Lahaul 63.5 and 91.0% of the families were using commercial fertilizers. But in Kinnaur, fertilizers being used were much below the optimum level that too in the cash crops especially apple. If organic farming is to be taken up, the area has to be withdrawn completely off the pesticides use as these are used indiscriminately. In Kinnaur, Lahaul and Spiti 53.2, 43.8 and 16.5% of the families were using insecticides and 85.4, 91.5 and 56.7% families were using fungicides. None were using herbicides in Kinnaur, while 61.5 and 47% families were using herbicides in Lahaul and Spiti, respectively.
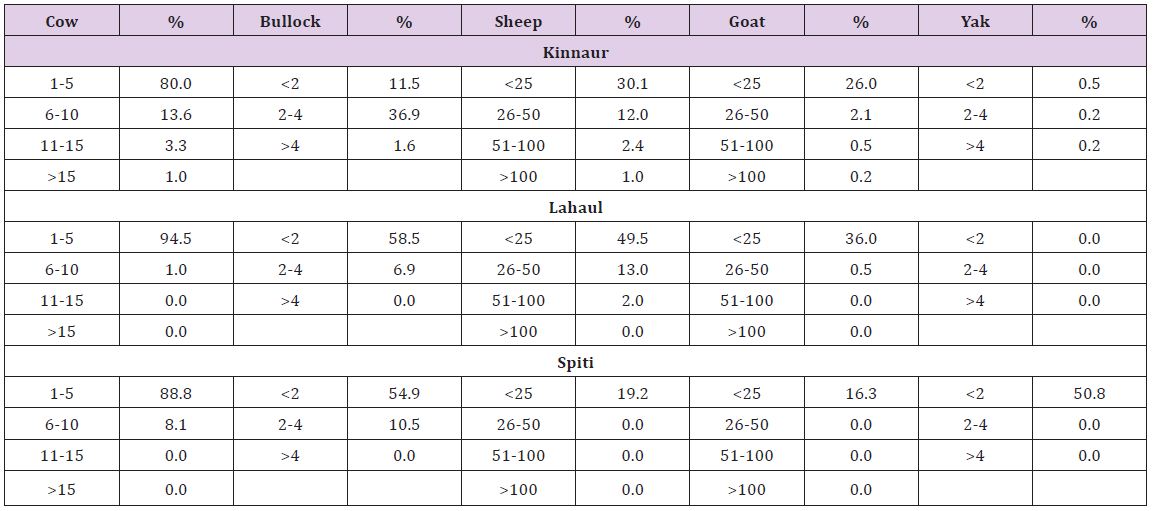
Cattle Population
Majority of the population was rearing quite a satisfactory number of cattle (Table 2) as large number of area was available for grazing. Stall feeding was done only in winter or for milch animals. In Kinnaur, Lahaul and Spiti 97.9, 95.5 and 96.9% of the total families were rearing cows. Thus after crop husbandry, animal husbandry/dairying was the other important activity taken up by the tribal farmers. Topography of whole of the study area and thus the cultivated fields were undulating. As such the mechanical cultivation of the fields was possible only to a limited extent for which the efforts are yet to be geared. So plouging and such other operations in the field were done using bullock power. 50% of the families in Kinnaur and 65.4% each in Lahaul and Spiti were possessing bullocks by themselves for cultivating their fields and supply of manures. Sheep and goat rearing was also taken up by quite a large number of populations especially for wool and meat purposes. Yaks were reared by more than 50% of the surveyed population in Spiti and by less than 1% population in Kinnaur. The manure obtained from this large number of animal population was by and large not properly composted; rather it was dried for reducing the weight for easy carrying in the difficult terrain and fields located away from the villages. Vermitechnology in this endeavourer play a pivotal role improving upon the quality of the compost as well as reduction in weight for easy carrying Bansal and Rana [2].
Table 2: Cattle population.
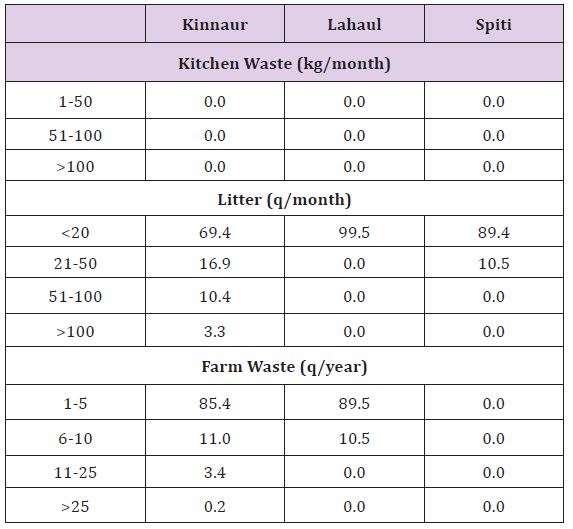
Organic Waste
In Kinnaur, Lahaul and Spiti quite a satisfactory amount of waste was available for this activity being taken up in a big way in the area (Table 3-5). However, in none of the districts kitchen waste was available for using in vermicompost preparation. The kitchen waste in villages was directly fed to the livestock reared by the farmers.
Table 3: Organic waste.
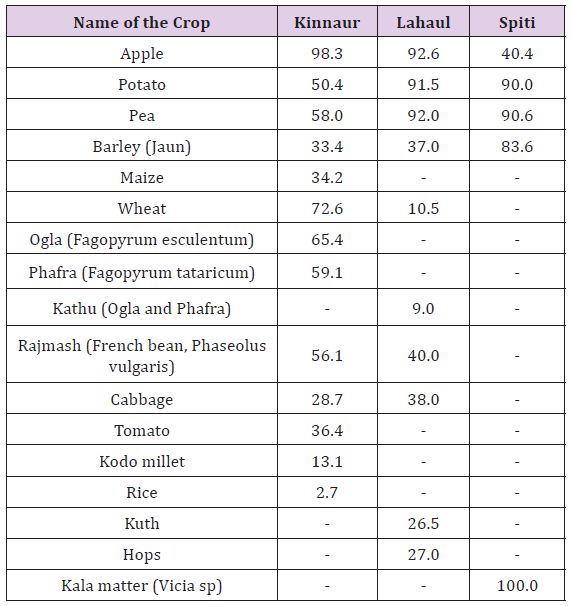
Table 4: Crop husbandry (Percent farm families).
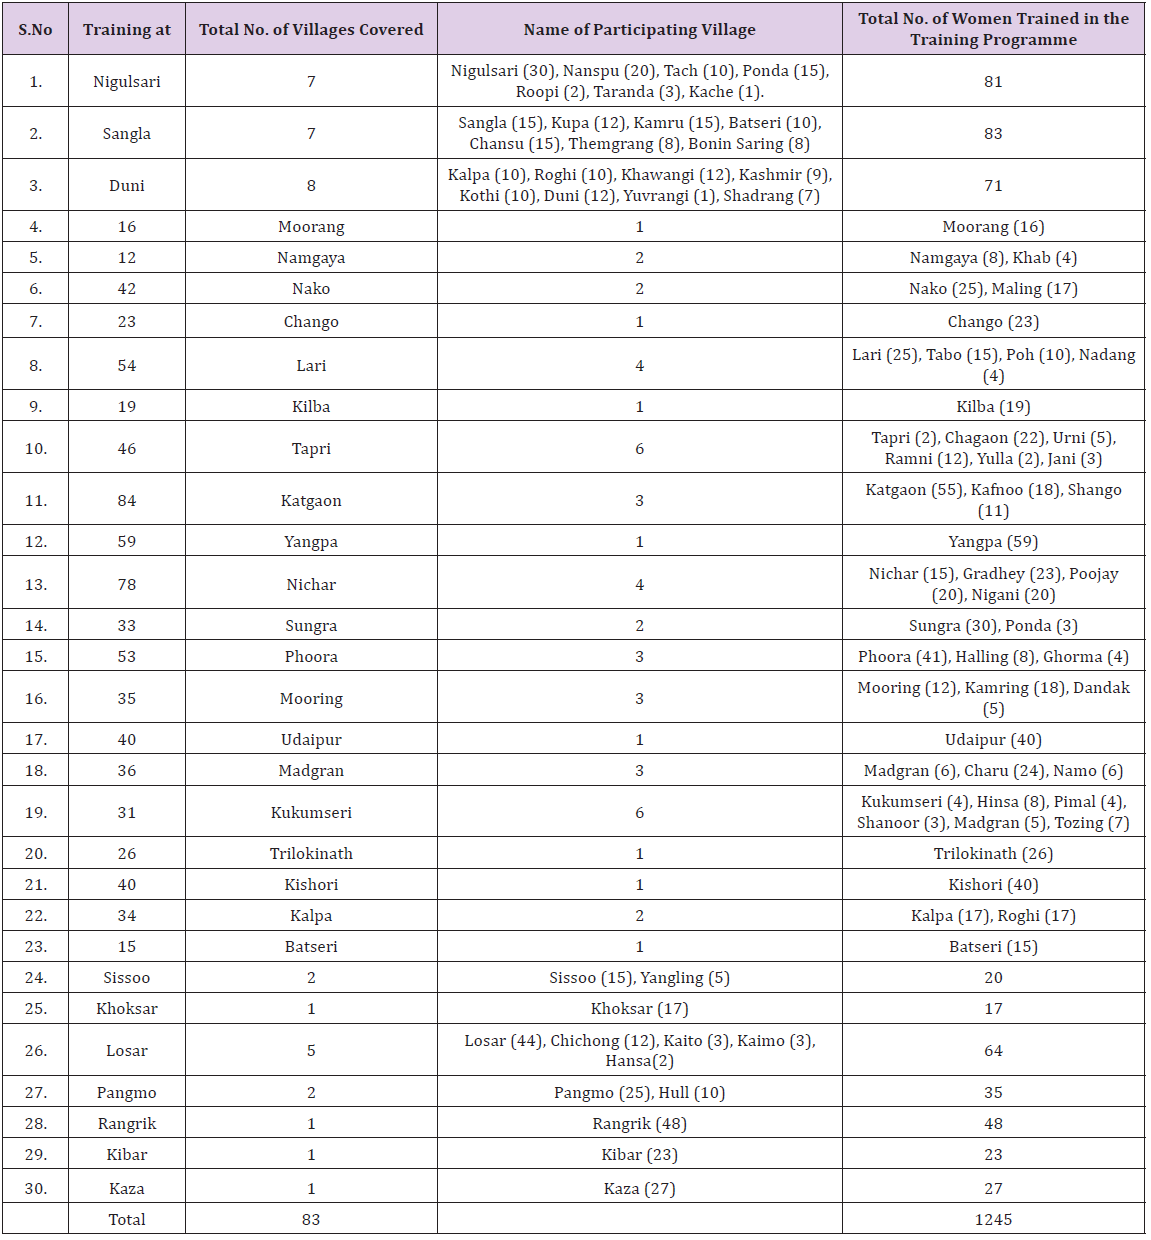
Table 5: Vermitechnology Training Programme organized and the women trained during 2006.
Crop Diversity
Being high altitudes, the larger area in the tribal belt remains under snow in winter and one or at the most two crops in a year was a common feature of cropping. Crops were grown in summer except in the lower reaches of Kinnaur. The crops grown in plains during winter also find place in summer in the tribal area. The off-season produce of the crops like pea, French bean, potato fetches premium prices in the plains. Only a few crops were grown but diversity was greater in Kinnaur followed by Lahaul. However, in Spiti, five crops were mainly grown. Keeping in consideration, the vast availability of raw material for the production of vermicompost, resources and man power available, the efforts were initiated to educate the women through training camps, establishing composting units on the participatory mode, distributing brochures and pamphlets, and organizing activities such as ‘vermin mela’ etc.
Trainings
Twenty four one day vermitechnology training camps were organized where women from 83 villages participated. In all 1245 women farmers were trained about organic farming, organic waste recycling and importance and use of vermicompost. The farmers were educated about the importance of utilization of organic/ agricultural waste for conversion into valuable compost through vermicomposting which otherwise was burnt considering it an absolute refuse.
Vermitechnology Units
176 vermitechnology/vermicomposting units were established with the precondition of the availability of the crop residues/ animal waste and to those who evinced keen interest in the camps. The complete list of farmers under whose disposal the activity undertaken is available with the authors. Three demonstration units were also set up one each at the main campus Palampur, HAREC, Kukumseri and HAREC, Sangla.
Brochure and Pamphlet
One bilingual “Vermicompost: Agricultural Gold from Garbage” a 24 page brochure with coloured pictures was brought out. The brochure describes technology through pictures, sources of nutrients, species of earthworms to be used, preparation of compost bed, raw materials, filling of bed, collection of vermicompost, precautions, advantage of vermicompost, usage and how it can be a micro-enterprise for women. Another 4 page pamphlet was also brought out in Hindi describing vermitechnology in simple language, raw materials to be used, bed preparation, collection of compost, its uses and usages.
Vermistall/mela
Participated in the State Tribal Festival at Recongpeo and set up a stall depicting vermitechnology for the tribal farmers. The setting up of stall was a great success where about 10,000 farmers who visited the stall were sensitized about the production and use of vermicompost from farm organic wastes. The stall was declared second in order of merit and has been awarded a cash prize of INR 1500/-. From the follow up visits in all the villages, it has been observed that Pradhans and farmers were taking interest in vermicomposting and units were working well. In many villages farmers have started using vermicompost so obtained for crop cultivation/in orchards. The technology was a great success in future as per the results in the first year.
On-farm response
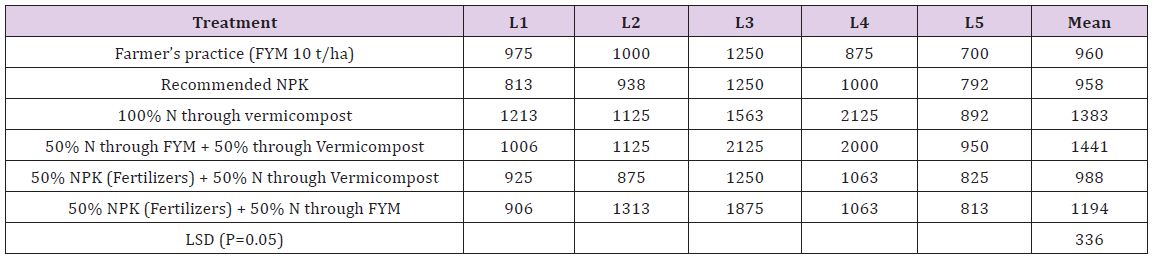
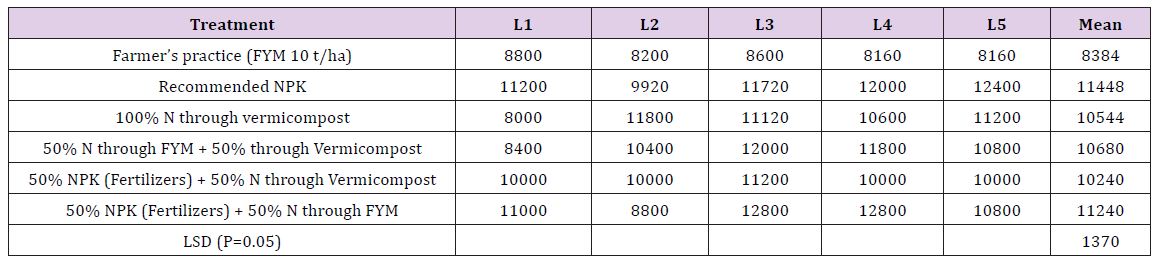
The on-farm trials were conducted on French bean in district Kinnaur (Table 6). The data were received from five trials/ locations. The perusal of data revealed that 50% N through FYM + 50% through vermicompost and 100% N through Vermicompost remaining at par, resulted in significantly higher seed yield of French bean over rest of the treatments. 50% N through FYM + 50% through vermicompost and 100% N through vermicompost increased seed yield of French bean by about 50 and 44 percent over the farmers’ and recommended practices. The on-farm trials on pea were conducted in Lahaul (Table 7). The data were received from five trials/locations. The perusal of data revealed that the integrated nutrient management teatments remaining at par with recommended application of nutrients resulted in significantly higher yield of pea over farmers practice. The findings of the present investigation conclusively inferred that vermitechnology is an effective strategy to increase yield and enhance the profitability of the tribal women. The different extension approaches followed to make abreast a small proportion of the tribal women need to be replicated in rest of the area to strengthen the livelihood security of rest of the population.
Table 6: Effect of treatments on yield of French bean (Rajmash).
Table 7: Effect of treatments on yield of Pea (kg/ha).
A Study to Assess the Effectiveness of Structured Teaching Programme on Knowledge of ‘Electrocardiogram’ Among 2nd Year B.Sc. Nursing Students in Selected Nursing College at Indore
Abstract
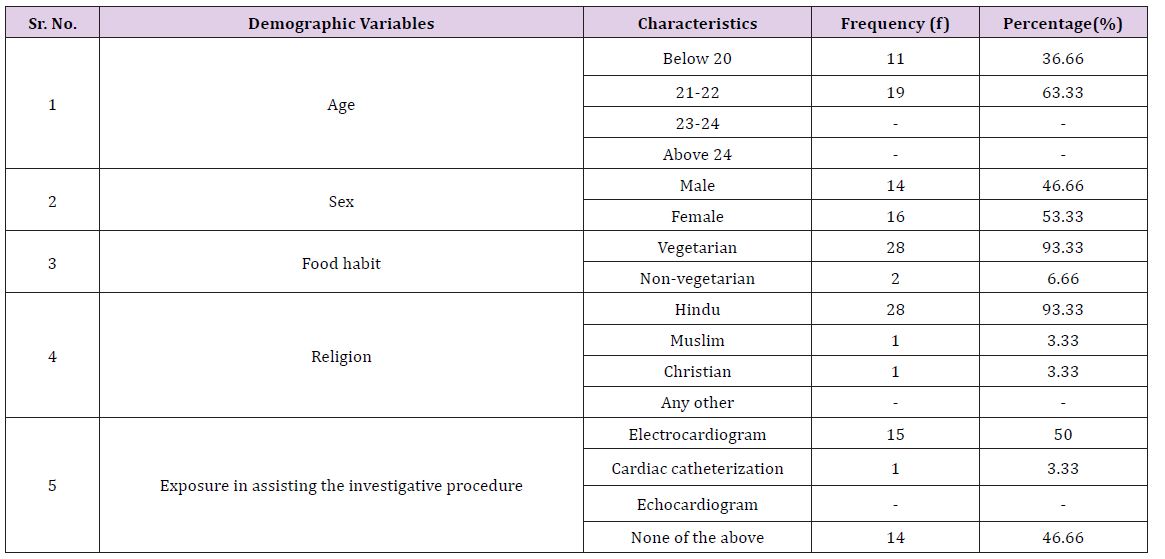
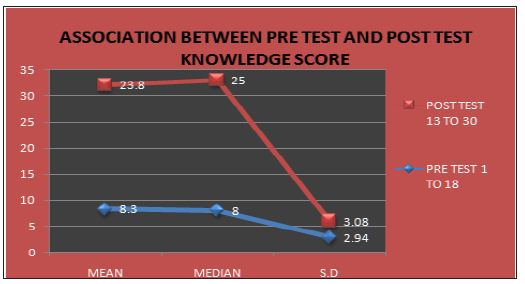
The study was conducted to assess the effectiveness of structured teaching programme on knowledge of ‘electrocardiogram’ among nursing students. The study was conducted in Nursing College at Indore. Total samples were 30. Non probability purposive sampling technique was used .The research tool was developed in English after an extensive of literature and experts opinion. The structured questionnaire was used as an instrument to measure the level of knowledge of nursing students about ECG at Indore. This study revealed that samples had poor knowledge (63%) and very few of them had good knowledge (7%) whereas the level of knowledge in very poor range is (30%). Moreover, there were no any single respondent set in excellent and very good category of knowledge. Chi square test was calculated to find out the association between the demographic variables and the level of knowledge regarding ECG among nursing students and it resulted there is association between the demographic variable e.g. age and exposure in assisting the investigative procedure and the level of knowledge [1,2].
Electrocardiography is the most commonly used diagnostic test in cardiology. If properly interpreted, it contributes significantly to the diagnosis and management of patients with cardiac disorders. Importantly, it is essential to the diagnosis of cardiac arrhythmias and the acute myocardial ischemic syndromes. These two conditions account for the majority of cardiac catastrophes. It is appropriately used as a screening test in many circumstances. Basic knowledge of the ECG is usually the most difficult to assimilate, as it implies learning the basis of interpretation. With technological advances, changes in provision of healthcare services and increasing pressure on critical care services, ward patients’ severity of illness is ever increasing. As such, nurses need to develop their skills and knowledge to care for their client group. Competency in cardiac rhythm monitoring is beneficial to identify changes in cardiac status, assess response to treatment, diagnosis and postsurgical monitoring. Every nursing student, nurse or even resident doctor must be aware of the importance of correlating clinical findings after a complete examination with the ECG finding. A good basic ECG interpretation may rely on the ability to combine clinical skills with basic ECG interpretation [3].
Need for the Study
a. Akhil S Kumar (2010): A Pre – experimental to “effectiveness of structured teaching Programme on knowledge regarding interpretation of electrocardiogram 60 second year B.Sc Nursing students in N.D.R.K College of nursing, Hassan, Karnataka. Probability sampling–Simple random technique is used. But result there was not much difference in pre test and post tests score [2].
b. Woods LS (2006): The ECG is a graphic display of the electrical forces generated by the heart. The ECG is the gold standard for non invasive diagnosis of cardiac arrhythmias and conduction abnormalities and useful tool in evaluating the function of implanted devices such as pace maker and implanted defibrillators. In 1902, a Dutch Physiologist, Willem Einthoven recorded the first ECG with his 270 kg machine, to string galvanometer for which he was awarded a Nobel Prize.
Objectives of the Study
a. To assess the Pre test knowledge regarding electrocardiogram among 2nd year B.Sc. Nursing students.
b. To assess the Post test knowledge regarding electrocardiogram among 2nd year B.Sc. Nursing students.
c. To assess the effectiveness of Structured Teaching Programme regarding electrocardiogram among 2nd year B.Sc. Nursing students.
d. To find the association between level of knowledge with selected socio demographic variables.
Hypotheses
a. H1: There will be significant difference between the pre test and post test knowledge score on electrocardiogram among 2nd year B.Sc. Nursing students at the level of 0.05.
b. H2: There will be significant association between selected socio demographic variables of Second year B.Sc. Nursing students and pre test knowledge score on electrocardiogram [4].
Material and Methods
a. Research design: Pre experimental design.
b. Setting: The study was conducted in selected nursing college at Indore.
c. Population: The target population and the accessible population were same for the present study i.e. 2nd year B.Sc. Nursing students in an Indore Nursing college, Indore.
d. Sample: 30 samples.
e. Sampling Technique: The Random purposive sampling technique.
f. Data analysis: The demographic variables were organized by using descriptive measures (frequency and percentage). The association between the level of knowledge and the selected demographic variables were assessed by Chi square test [5].
Result and Discussion
Majority of 2nd year B.Sc. Nursing students were in the age group of below 20 years (53.33%) followed by 21 22 years (46.6%) and no one was above 22 years old. Majority of 2nd year B.Sc. Nursing students were females (53.33%) and minimal percentage of the sample were males (46.6%). Second year B.Sc. Nursing students by their exposure in assisting the investigative procedure. They were assisted for electrocardiogram procedure (30%) followed by cardiac catheterization (30%). Echocardiogram (23.33%) and (16.66%) percentage of Second year B.Sc. Nursing students had not assisted for any procedure. It was inferred that some o f Second year B.Sc. Nursing students had exposure in assisting electrocardiogram procedure (Table 1).
Table 1: Frequency & Percentage distribution of students by their demographic characteristics.
In this present study the mean and standard deviation in pre test assessment score was 7.93, (SD=3.12) and in post test assessment mean score was 23.8 (SD=3.08). The result shows that the STP is effective and helpful to raise the knowledge (Figure 1). In the association between socio demographic variables and pre test knowledge of Nursing students of 2nd year B.Sc.in relation to the age and exposure in assisting the Investigative procedure the chi square value obtained 7.14 (P=0.028<0.05, df=2) and 15.2 (P=0.02<0.05, df=6) respectively which showed significance at p<0.05 levels [6,7].
Figure 1: Association between pre test and post test knowledge score.
Conclusion
This study reveals that majority of the nursing students have adequate knowledge and regarding ECG after implementation of STP in Indore nursing college at Indore.
Maytenus ovatus (Schweinf.) of the family Celastraceous is a shrub usually spiny with whitish flowers bearing reddish fruits and is widespread in the savannah regions of tropical Africa [1]. Mountains and sub-mountainous regions of African countries, viz., Ethiopia, Kenya, Tanzania, Uganda, Mozambique and others are wild habitats for the species, Maytenus ovatus, M. serratus, M. heterophylla and M. senegalensis [2]. Maytansine, a benzo-ansamacrolide (ansamycin antibiotic) is a highly potent microtubuletargeted compound that induces mitotic arrest and kills tumor cells at sub-nano-molar concentrations was originally isolated from the Ethiopian shrub, Maytenus ovatus. Maytansine binds to tubulin at the rhizoxin binding site. It inhibits microtubule assembly, induces microtubule disassembly, and disrupts mitosis. Maytansine exhibits cytotoxicity against many tumor cell lines and also inhibit tumor growth in vivo [3]. Since the discovery of Maytansine from Maytenus ovatus in 1972 as a potent cytotoxic agent, further 53 more maytansinoids have been identified from wild plants, microorganisms and mosses [4].
Results and Discussion
Maytansine, the highly cytotoxic natural product, could not succeed as an anticancer agent in earlier clinical trials conducted on humans because of systemic toxicity. The potent cell killing ability of maytansine was further tested in a targeted delivery approach for the selective destruction of cancer cells. A series of new maytansinoids, bearing a disulfide or thiol substituents were developed synthetically. Several of these maytansinoids were found to be even more potent in in-vivo experiments than maytansine. The targeted delivery of these maytansinoids, using monoclonal antibodies, resulted in high, specific killing of the targeted cancer cells in-vivo and remarkable antitumor activity in-vivo [5]. Some plants that indicate potential as an anticancer agent in laboratorybased in-vivo research including species of Maytenus are currently being studied extensively.
There can be many years between promising laboratory work and the availability of an effective anti-cancer drug. In the 1950’s scientists began systematically examining natural organisms as a source of useful anti-cancer substances [6]. It has recently been argued that “the use of natural products has been the single most successful strategy in the discovery of novel anti-cancer medicines”. These phyto-chemicals that is selectively more toxic to cancer cells than normal cells have been used in screening programs and are developed as potential chemotherapy drugs. Cancer is a malignant neoplastic disease characterized by uncontrolled growth of cells with the ability of the cells to migrate and spread to distant sites [7]. The most commonly occurring cancers are carcinomas while sarcomas, leukemias, lymphomas, melanomas and gliomas also pose big threat to human lives in the present day life all over the world.
Maytansinoids exhibit broad spectrum activity in ultra low concentrations (nanogram to microgram ranges). Early work on maytansine, the most widely studied of this series was hampered by exceptionally low yields (0.2 mg/kg of plant part) of this compound from Maytenus species. Higher yields of maytansine (12 mg/kg) have been obtained from Putter1ickia verrucosa also of the family Ce1astraceae [8]. In a clinical trial, toxicity of maytansine was manifested by profound weakness; nausea and prolonged diarrhea to the extent that a few patients refused further treatment. But much more beneficial antitumor responses were observed by the administration of maytansine and its derivatives/ analogues and hence this group of compounds is undergoing extensive evaluation in current clinical oncology experiments.
Background of the Invention
United States Patent Number 3,896,111 of July 22, 1975, awarded to Kupchan [9], it was disclosed that certain African woods, in particular Maytenus ovatus and M. buchananii contain certain factors which demonstrated significant anti-leukemic activity in microgram/kilogram level. One of these factors, the chemical structure of which was disclosed in the patent was identified as “maytansine”. The starting material for the development of maytansine based drugs by the procedures of the invention of Kupchan [9] is maytansine containing plant material, suitably woody portions of stem and bark. The preferred sources are wood from Maytenus ovatus, Maytenus buchananii and Putterlickia verrucosa. Wood of these plants is ground on a hammer mill to give slivers of a size of the order of 1 cm × 1 mm, but also includes larger slivers and dust particles.
The wood chips are processed in batches of approximately 1,400kg of wood and are extracted with ethanol suitably containing up to about 5% by weight of moisture. The process also utilizes approximately 5,500 to 6,500 liters of extracting solvent per 1,400kg batch of wood. Extraction is carried out in a recycling, large scale soxhlet type apparatus over a time of approximately 100 hours. The solvent is removed from the extracted mass to yield an initial crude isolate (corresponding to Kupchan fraction) of the order of 25 to 30 grams of extract per kilogram of charged wood and by further purification maytansine is isolated. Maytansine, a benzo-ansa-macrolide, first isolated from the bark of the Ethiopian shrub Maytenus ovatus is a vital cytotoxic agent and its derivatives bind to tubulin near the Vinca alkaloid binding site. Two maytansine derivatives, emtansine also referred to as DM 1 and ravtansine also referred to as DM 4 have been widely used in combination with reversible and irreversible linkers [10](Figure 1).
Figure 1:
Trastuzumab emtansine (T-DM1; Roche in partnership with ImmunoGen) which received marketing patent in 2013 is a human epidermal growth factor receptor drug [11]. As shown in preclinical studies, the drug combines the distinct mechanisms of action of both DM1 and trastuzumab, and has antitumor activity in experimental human tumor models. T-DM1 has been approved as a secondline treatment for breast cancer patients that have previously failed to respond to therapy with trastuzumab chemotherapy. SAR3419 (Sanofi in collaboration with ImmunoGen) is another representative example of a maytansine-based ADC (Antibody Drug Conjugate) and this drug in clinical trials has demonstrated a response rate more than 70% in large B-cell lymphoma patients. Most of the African cultures have a verbal tradition and therefore, written information on cultural features in the past are not so readily available from Africa as from many other parts of the world.
The ethno-botanical information on the uses of these plants was sometimes documented on herbarium labels and, in this way, ethno-botanical information on a number of plants began to accumulate. Systematic accounts in written form dealing with medicinal plants in Africa are of a fairly recent date, while reports dealing with ethno-pharmacological aspects are more recent. A number of traditional national pharmacopeias have appeared, starting with the Madagascar Pharmacopeia in 1957 and research in the field of ethno-botany and ethno-pharmacology has developed rapidly in many African countries. The African Pharmacopoeia, covering traditional medicine of many African countries, has been published by the Scientific Technical Research Commission of the Organization of African Unity, starting with volume 1 in 1985.
Recently, the Association for African Medicinal Plants Standards, from Mauritius, started the publication of Monographs on medicinal plants which provide botanical, phyto-chemical, pharmacological and commercial information on the most important medicinal plants used in Africa. In Africa, the ethno-pharmacological and botanical knowledge on the uses of medicinal plants is often orally passed down from generation to generation. Although traditional medicine has been recognized as a part of primary health care programs in many African countries, there is a need to evaluate scientifically the crude extracts of plants for their medicinal and pharmaco-dynamic properties, clinical usefulness and toxicological potential.
Mertansine, a semi-synthetic derivative of Maytansine
Mertansine, also called DM1 (and in some of its forms emtansine), is a thiol-containing maytansinoid that for therapeutic purposes is attached to a monoclonal antibody through reaction of the thiol group with a linker structure to create an antibodydrug conjugate (ADC). ADCs with this design include trastuzumab emtansine, lorvotuzumab mertansine, and cantuzumab mertansine. Some of these compounds are still experimental; many others are in regular clinical use (Peter, 2013) [12].
a. Mechanism of action of Mertansine
Mertansine is a tubulin inhibitor, meaning that it inhibits the assembly of microtubules by binding to tubulin (at the rhizoxin binding site). The monoclonal antibody binds specifically to a structure (usually a protein) occurring in a tumour, thus directing mertansine into the tumour cells. This concept is called targeted cancer chemo-therapy.
Conclusion
Ethiopian forests and wild habitats are potential sources of rich bio-diversity which include highly potential medicinal plants that can be utilized in the traditional practices of Ethiopia and at the same time can be exploited in the modern systems of medicine. Killer ailments like, cardio-vascular diseases, cancer, HIV, diabetes is posing big threat to human lives not only in Africa but all throughout the world. In this context, more and more medicinal plants need to be explored for their cultivation and utilization in human health care. The scientific community involved in the discovery and isolation of Maytansine from Maytenus ovatus for the treatment of leukemia; breast and lung cancers deserve high admiration. The search for more medicinal plants needs to be undertaken in Ethiopia for utilization in different aspects of human healthcare.
New Surgical Strategy for Abdominal Wall Defects. A Successful Swine Model Experiment
Abstract
Background: The purpose of this study was to develop a large incisional hernia pattern made on an animal that is clinically relevant, to design a new original surgical technique to repair abdominal wall defect, and to evaluate its effectiveness, Methodsing to apply it on patients.
Methods: Physical examination and ultrasound scan was performed at fixed intervals at 3, 7, 14 and 30 days. Postoperative complications were followed. To evaluate the resistance of the repair, the swine model went through gestation and given birth process.
Results: There are the following situations: wound infection, enteric fistula, stoma, or retraction of the abdominal wall, when direct synthetic mesh repair is inadequate. Biological meshes may be placed to achieve abdominal wall reconstruction, but they are associated with a high recurrence risk. The good result is based on the flap properties of biocompatibility and incorporation into the surrounding tissue. If some surgeons questioned the flap repair, which would not provide the required resistance, the reinforcement with the mesh would ensure it. The advantage of using the flap directly into the defect reduces the risk of infection. Mechanical test of abdominal rectus muscle across the repair site was performed and no test is better than the gestation and given birth process.
Conclusion: The technique accomplishes the reconstruction of a functional dynamic abdominal wall via the antilogous vascularized tissue flap and the mesh insertion, which will reinforce the repair. We recommend it due to the fast tissue regeneration and resistance to pressure forces on different physiological acts.
Keywords: Flap; Reconstruction; Abdominal Defect
Introduction
Despite the frequency of ventral hernia repair, there is little consensus in the literature about the ideal approach for this difficult problem. In the repair of abdominal wall defects, the surgeon must consider a multitude of factors to identify the appropriate surgical technique to accomplish the reconstructive goals [1]. The reconstruction of the abdominal wall has become a new surgical superspeciality, which needs to be investigated. Plastic surgeons use native abdominal wall whenever possible and general surgeons suggests the use of synthetic or biologic mesh in ventral hernia repairs. One particular group of patients are those with contaminated wounds, enterocutaneous fistulas, recurrent incisional hernias, where synthetic mesh is to be avoided if possible. Due to the high risk of mesh infection or mesh rejection that could lead to dramatic consequences [2]. Most recently, biologic mesh has become the new standard in high-risk patients with contaminated and dirty-infected wounds [3].
The cost of the biomaterials should not be an important factor in these cases, but this issue of price cannot be avoided, especially when hospitals do not have enough funds (in poor or developing countries) or have a limited number of meshes (in some developed countries) or, even worse, the patient must support all the costs by himself. Furthermore, this product is usually ordered on a caseby- case basis because of the expense of having large numbers o matrix sheets available for intermittent use [4]. Therefore, flap surgery is the option for such cases. Flap reconstruction offers immediate and definitive wound closure, mitigating the local milieu inflammatory response and local tissue injury [5]. Although these defects can be attributed to a myriad of etiologic factors, the objectives in abdominal wall reconstruction are consistent and include the restoration of abdominal wall integrity, protection of intra-abdominal viscera, and the prevention of herniation [6]. A new experimental surgical repair, an original method for the reconstruction of the abdominal wall, using deep inferior epigastria artery perforator propeller flap reinforced by an on lay prosthetic mesh, is presented for the first time in this article.
Methods
Animals
An experimental protocol was developed on a swine as a model. Anesthesia was performed with atropine sulfate 0,04mg/kg SC, azaperone 2mg/kg IM (Stressing, Belgium), diazepam 0,1mg/ kg IM, ketamine 10 mg/kg IM (Vetased, Romania). This protocol of sedation allowed safe transportation to the preparation room. Protocol was administered to have effect on the induction of general anesthesia (1-2mg/kg IV) (Norfolk , Northern Ireland). The swine was incubated with a straight laryngoscope blade using a number 5.5 – 6 end tracheal tube. To maintain anesthesia, isoflurane was delivered in 100% oxygen (Dragger Fabius Plus XL, Dragger Medical AG & Co – Germany). ECG, respiratory rate, oxygen saturation, pulse, esophageal temperature, ETCO2, FiO2 and anesthetic gas concentration were monitored throughout the surgical procedure. Postoperative analgesia – meloxicam 0.4mg/ kg IM/24 h, Lexicon (Nor brook Laboratories Limited, Northern Ireland) was also performed.
Abdominal Wall Defect Creation
The swine model underwent survival surgery which consisted in creating a standard ellipse 5cm in width and 10cm in length abdominal wall defect, using a surgical steel blade no. 23, through the fascia of the midline linea alba. The peritoneum immediately below the facial incision was kept intact. Full-thickness skin flap– 1.5 cm lateral to the midline – was raised through the vascular prefascial plane. The 1:2 ratio of the flap length to width was maintained to prevent flap ischemia.
New Surgical Repair
Simultaneously, the repair was done using a de-epithelialized flap, harvested in a supine position. An elliptic transverse skin paddle was drawn with a surgical marker on the inferior hemiabdomen. The flap was designed as an island flap based on a single perforator, in our case DIEP, and was rotated through 90 degrees to cover the defect. The flap was then inset without tension and the donor site area was closed first. After the flap was fixed into the defect, the repair was supplemented with a lightweight polypropylene-mesh, in the onlay position, extended beyond the line of the closure by 3 cm in all directions. The mesh was fixed with a continuous suture around the periphery, using a heavy gauge non-absorbable suture. The fascia closure was tension-free, using a continuous suture and the skin was closed with intra-dermal suture using Monocryl 3.0 (Figure 1). To determine the repair strength, due to lack of an tensile tester or other equipped device, I decided to have a tensile testing of the swine model by choosing a natural way. Because a month after surgery the swine model underwent the reproduction process.
Results
Physical examination and ultrasound scan were performed at fixed intervals at 3, 7, 14 and 30 days. Then complications followed: infection, seroma/hematoma, extrusion, hernia recurrence, dehiscence, and necrosis. After a three-day-evaluation a slight edema can be noticed during the physical examination. There are no other concerns regarding the wound healing. Ultrasound scan identified small hematomas formations above the repair, in the subfascial space, even if the mesh was well positioned (Figure 2). Examining the flap perfusion, the perforator vessel was identified and the vessel flow was normal (Figure 3). Seven days later after the surgery, the flap seems to be well incorporated into repair, excepting the extremities of the defect, where mesh elevation is detected. Clinical examination shows a normal process of the wound healing (Figure 4). No changes occur at the two-week evaluation. After a month the results reveal the good repair of the abdominal wall without complications at the US evaluation and also with optimal cosmetic results (Figure 5). After the breeding, the normal gestation period was carried on without any problems, and the swine model gave birth to four piglets. Both mother and piglets are healthy. One-week physical examination of the abdominal wall swine model shows no recurrent hernia being present (Figure 6).
Figure 2: Ultrasound scan identified small hematomas formations.
Figure 3: Ultrasound scans: normal vessel flow.
Discussion
Several options exist for the reconstruction of the abdominal wall defects. The idea for this original repair started with the question: why a perfect mesh and not a combination using the original material reinforced with a mesh? There are many different types of meshes available, and even more products are being brought to the marketplace, having a commercial interest. It is difficult to browse through all of these new products, without longterm clinical and experimental data to support their use [4]. If we add the high costs in purchasing these meshes, all of these hamper and delay the repair process. There are situations, such as wound infection, enteric fistula, stoma, or retraction of the abdominal wall, when direct mesh repair is inadequate. Biological meshes may be placed to achieve abdominal wall reconstruction, but they are associated with a high recurrence risk because they weaken as they dissolve [2]. Placing the flap into the defect, prevents the development of complications, which can jeopardize the repair. The only technique is popular among surgeons because it avoids direct contact with bowel and imparts less tension on the repair [7]. Mechanical test of abdominal rectus muscle across the repair site was performed and no test is better than the gestation and given birth process. Results show that the repaired area did not record any changes throughout all the process and it proved to be a resistant repair.
Among the postoperative complications, only hematomas were recorded, and they were resolved by natural drainage. Hematomas are susceptible of infection and can easily provide the medium for bacterial overgrowth. Any evidence of infection with hematoma may require evacuation of the hematoma to prevent removal of the mesh. No infection, no superficial or deep wound dehiscence, no recurrence even after the birth process was recorded in the swine model. Mesh infection is given by local or systemic factors. Additionally, the properties of the mesh material affect the degree of local inflammatory response and fibro vascular tissue incorporation [4]. The good result is based on the flap properties of biocompatibility and incorporation into the surrounding tissue. And, if some surgeons questioned whether the flap repair would provide the required resistance, the reinforcement with the mesh will ensure it. This technique allows the preservation of the perforator vessel, reducing the risk of subsequent skin necrosis. From an esthetic point of view the repair, combining the two methods used on the swine model, had an excellent result, which did not undergo any changes during the gestation process. The advantage of using the flap directly into the defect reduces the risk of infection. The recurrence rate is an important element to establish the efficiency of surgical treatment [2]. Long-term data analysis, with large case studies, is still needed to obtain detailed information about recurrence, particularly in the assessment of new techniques.
Conclusion
The repair accomplishes the reconstruction of a functional dynamic abdominal wall via the antilogous vascularized tissue flap. Mesh reinforcement of the repair provides resistance under constant pressure and can be indicated to treat young patients. Long-term clinical and experimental data are needed to support its use.
Lessons Learned From Field Deployment of the Hemaapp: A Non-Invasive Hemoglobin Measurement Tool
Introduction
The Hemaapp [1] is a smart phone application that measures the hemoglobin level in your finger by using the phone’s built-in camera and flash. The hemoglobin measurement is done noninvasively, by placing the finger of the patient on the camera of the phone. The light from the flash allows the camera to record the absorption of light by the blood, while the Hemaapp application analyzes the images to determine the level of hemoglobin. The application was developed at the University of Washington’s Ubiquitous Computing Laboratory. The University of Washington team worked with the NGO, Asociacion Red Innova, to test the innovative technology in the field. The team conducted a field deployment in a variety of diverse settings in Peru, including two communities in the Amazon region, an urban-slum community in Lima, and three clinics in Lima. The following report was drafted to reflect the lessons learned in the field.
Participants of the study received an examination with the Hemaapp and then an examination with an invasive method to measure hemoglobin, such as the HemoCue or Complete Blood Count. The results of the two tests were compared to improve the precision of the algorithm of the Hemaapp. 100% of participants indicated that they prefer the analysis by the Hemaapp to an analysis by the HemoCue or CBC. In additional to a satisfaction questionnaire, the research team identified a number of opportunities to improve the diagnostic tool and methods for campaigns that utilize the Hema App.
Some of the findings included:
a) A cloth strip can be installed on the phone case to help hold the finger securely over the camera. This will help the participant from moving excessively during the analysis and ensure that the technician properly placed the subject’s finger over the camera. The cloth strip also serves to block out the ambient light to ensure the light is stable and consistent in all environments.
b) It can be difficult to conduct the Hemaapp measurement on very young children. Some of children in the field study were afraid or uncomfortable about placing their finger on the camera for 15 seconds. As Hemaapp relies on optical measurements through the finger’s skin, if the subject does not hold their finger still over the camera, the excessive motion will render the measurement unusable. Thus, Hemaapp is not suitable for crying children who are resisting. For this reason, we found that it is important to take a moment to reassure the child and gain their confidence. This can be accomplished more easily by showing a video with a cell phone. A future edition of the HemaApp may include a child-friendly video that convinces the child to put their finger on the camera and then continues for 15 seconds to ensure the child does not move during the analysis.
c) A phone case that is appealing to children may also be beneficial for calming the child and encouraging them to participate. Some of the children seemed particularly frightened by the black phone case, but became noticeably less agitated when we showed them the screen display of the phone.
d) We found that children are calmer when sitting in a chair independently rather than on an adult’s lap during the measurement. The independence may reduce the amount of anxiety caused by a lack of control.
e) It is often not feasible to examine children under the age of 10 months with the Hemaapp as their fingers are too small to cover the camera and the flash. An attachment may be constructed in the future to utilize with babies less than 1 year of age.
f) The flash of the camera can get hot. It is best to wait until the finger is placed on the camera, secured with a cloth strip, and then placed securely on a table before turning on the flash, thus minimizing the amount of time the flash is illuminated. When the device is used repeatedly and rapidly, cleaning the flash and camera with alcohol can help cool the light.
g) Participants in the clinics were less willing to participate in the study with the innovative tool than participants in the community. Those in the clinic were more cautious of participating in the study. Those in the communities were excited at the prospect of trying an innovative tool and receiving the exam with the cell phone.
Through the field deployment in Peru we learned several lessons for how to improve the overall effectiveness of the diagnostic tool. Simple modifications of a phone case and steps taken between exams can increase the appeal and effectiveness of the tool, especially when dealing with children. The team at the University of Washington is continuously making improvements to the application and the device to make it more precise and userfriendly. We are continuing to address the challenges identified in the Peru trials to continuously improve the prototype and learn from the end-user. The team at Asociacion Red Innova is planning the next field validation campaign for the Hemaapp with great consideration to the lessons learned from the last deployment. We hope to make the evaluation more appealing to children and streamlining the procedure to improve the efficiency of the measurement. Based on the satisfaction we observed from the recipients of the Hemaapp we know that the tool is highly desired and feasible to execute in large scale anemia screening campaigns in diverse settings. Most of the children and their parents in the Amazonian and urban communities were excited to receive the evaluation with the cell phone. We believe the appeal of the technology represents a great opportunity to make more tools like the Hemaapp for diagnosis, surveillance, and education to improve public health in the future.
The Smile Aesthetics and its Implications in Social Prosthetic Rehabilitations: A Case Report
Abstract
The aim of this study is to individualize the correlative aspects between the type of smile , the degree of visibility of the teeth and the way in which the chosen therapeutic solution, in accordance with the particularity of the clinical case, offers the ultimate clinical success in terms of aesthetic requirements.In order to make the aesthetic evaluations and the contour matches we used photos for the patients faces and teeth and we processed these photos in Corel Draw 7.0. We manually traced the contour of the face and the frontal tooth and we matched the two shapes changing accordingly their dimensions; the smile type was also established through contour detection.The type of prosthesis is fully in agreement with the particularity of the prosthetic field, the presence or absence of specific prosthetic preparation corroborated with the aesthetic restoration through individualized modeling decisively influences the final results.
The multitude of clinical cases requiring aesthetic therapy anchored in both the fixed prosthesis registry and the movable prosthesis, makes it impossible to classify the treatment according to the state of edification [1-4]. What can be deduced from a thorough clinical examination is the extent of the edentation, the degree of compensation in the odontal, periodontal, mucosal and bone support, the maintenance of the stable occlusion relationship and the type of smile [5-7]. The smile involves altering the physiognomy in all the facial stages, but the anatomy of the lower floor level is most important: the labyrinth extends, the upper lip rises and stretches, and the free edge of the lower lip becomes concave [8- 12]. A distance can be measured between the mouth commisura; the smile index can also be calculated: the ratio between the vertical and horizontal dimensions of the laughing slit associated with the smile. The amplitude of the smile determines the degree of exposure of the dental arches and thereby the definition of the area of aesthetic interest to be taken into account during the dental arcade restoration treatments. Smile is a form of non-verbal communication, most often associated with the exposure of dental arches. Appreciation of the relationships between upper lip, lower lip, and mouth commisure with the dental arches during smile is one of the important stages of examination in dental aesthetics [13- 15].
Aim
The aim of this study is to individualize the correlative aspects between the type of smile , the degree of visibility of the teeth and the way in which the chosen therapeutic solution, in accordance with the particularity of the clinical case, offers the ultimate clinical success in terms of aesthetic requirements.
Material and Methods
In order to make the aesthetic evaluations and the contour matches we used photos for the patient’s faces and teeth and we processed these photos in Corel Draw 7.0. We manually traced the contour of the face and the frontal tooth and we matched the two shapes changing accordingly their dimensions; the smile type was also established through contour detection. We preferred to perform these procedures by hand because the automated functions for contour tracing do not deal correctly with the anatomical particular details.
Results and Discussion
The clinical presentation shown here is representative of a social approach, in which we pay special attention to the aestheticfunctional binomial which governs the current therapies, in these particular situations the socio-economic criteria are restrictive. The 55-year-old PZ patient following the clinical and paraclinical assessment was diagnosed as follows: General condition affected by the HTA stage offset, under medication, that favours the treatment stages; Chronic superficial periodontitis at the level of the anterior frontal teeth, of a plurifactorial etiology with slow progression, favorable prognosis by treatment, currently untreated, Total maxillary edentation of plurifactorial aetiology, which induces functional, masticatory, physiological, phonetic, swallowing disorders, evolving slowly, giving local complications such as edema and atrophy of the edentated and loco-regional crest with articular dysfunction, with prognosis favorably untreated, Kennedy Class I stretched mandibular partial joint jaw, of mixed etiology, which induces functional discomfort, swallowing, physiognomy, slowly evolving, causing local complications such as resorption and atrophy of the edentar ridge localized and loco-regional disorders such as joint dysfunction, prognosis favoring treatment, mixed prosthesis treated at this stage.
Malocclusion by modifying occlusal morphological parameters, asymmetric occlusion curves, irregular oblique occlusion; Moderate joint dysfunction, with etiology extended stretch condition and reduced untreated partial edentary states and other detectable etiology through paraclinical examinations, giving discomfort to the masticatory, slowly evolving, with prognosis favorably through treatment Extrapostural and eccentric mandibulo-cranial malrelation, having the etiology of the partialextended edentation and the partially reduced untreated anterior edema, leading to masticatory, swallowing disorders, deglutition, slowly evolving, with favorable prognosis through treatment; Assessment of clinical and biological indices is a decisive starting point for the development of a therapeutic plan. The positive aspects characterizing the general clinical-biological indices are represented by the general good condition of the patient, which allows the development of the treatment stages.The loco-regional indices are characterized by negative aspects negative positioned at the TMJ level, noting aspects of mandibular dynamics characterized by asymmetric condylous excursions, which accompany left-sided latency. Regarding the local odonto-periodontal clinical-biological indices there is a small number of odonto-periodontal units, and the muco-bone support is characterized by the presence of resilient mucosa, irregular crests, negative indices that can be posed by specific training or the choice of a biomaterial with a structure adapted to these particularities (Figure 1).
Figure 1: Aspects of panoramic radiological evaluation.
The negative aspects related to occlusion reside in the changing of the static occlusion parameters due to the morphology and functionality of the mixed restorations which the patient presented, inducing changes in the dynamic occlusion trajectories. The therapeutic plan was governed by the following objectives:
a. Prophylaxis objective:nonspecific local prophylaxissanitary education, general prophylaxis – vitamin therapy, psychotherapy ,specific local prophylaxis.
b. Curative objective: morphological: the maxillary achievement of a complete denture restoration and at the mandibular level of some restorations fixed and partially removable flexible prostheses, restoring the dento-alveolar integrity.
c. Functional: restoring the functions of the stomatognate system: mastication, phonation, swallowing, physiognomy.
At the mandible we face a balanced symmetric-asymmetric edification, corroborated with the orientation of the vector RP(resistance-pressure) towards posterior, shows us both the deficient support area and the topography of the elements of maintenance, support and stabilization, if we remain as a variant in the territory of the removable prosthesis. After investigating and analyzing the treatment plan according to all the mentioned principles and criteria, we chose the following therapeutic solution: at the maxilla-complete acrylic denture, the teeth were chosen from the composite, the shape of the teeth being fully aligned with the shape of the face and the architecture of the maxilla prosthetic field. Regarding the mandibulary solution,we chose an mixed prosthesis variant composed:fixed metal-ceramic restoration at levels 33, 32, 31, 41, 42, 43, 44 and partially removable flexible prosthesis consisting of a dentum-mucosal plaque connector, 2 metal-acrylic mixed sutures with 8 artificial teeth, acrylic, anatomorphic, mediocuspidate and support, stabilization and support elements: elastic clasps. The stages of the treatment:
Preparation of the body and oral cavity
a) Health education,
b) General training,
c) Preprotetic (non-specific) preparation,
d) Preprotetic (specific) preparation-Recovery of organic substructures and correction of preparations at mandibular level (Figure 2).
Figure 2: Aspect ofpreparation of the teeth at the mandibular level.
The proper prosthetic treatment concerned the following steps:
a) Preliminaryimpression recorded in alginic material.
b) Functional impression-it is important to note that on the functional model, all the hybrid prosthesis, both the fixed and the mobilizable component, were made for the purpose of full harmony morpho-functional between the two components. The functional fingerprint was recorded with addition silicon.
c) The recording of the mandibular-cranial relations with the help of the occlusion models and the transfer on the simulator.
d) The checking of the prostheses in the wax. This step is important and precise by superimposing the therapeutic decision marks over the resulting technological elements.
e) Clinical examination, adaptation and fixation by temporary cementation of the fixed prosthesis and verification, adaptation of the partial removable prosthesis (Figure 3).
Figure 3: Aspects of maxillarycomplete denture andpartially mandibular removable.
f) Fixation by permanent cementing of the fixed prothesis.
prostheses and fixed componentent. After superposing the dental contour on the facial one, an optimsuperposing results, and the framing of the smile in the convex one, with contact restores aesthetics of the patient. The final results of the clinical case offer the image of the rehabilitation edentatotal or partial stretched by total prosthesis, respectively mandibular joint prosthesis, therapeutic solutions that created the cranio-mandibular reposition, as well as the restoration of all the functions affected by edentation (Figure 4). A very important factor in obtaining a result of high-level prosthetic treatment is the harmony between the shape of the teeth, their position, their color and the appearance of the gingival tissues adjacent to them, because a harmonious ensemble can not be defined only under conditions of free periodontal structures.For this reason, the gingival color, the level and extent of exposure of the free gum and the interdental papillae in the smile, even the aspect of the fibroma that covers the alveolar processes, are elements whose analysis completes the examination of dento-facial aesthetics.
Figure 4: Superposability of the shape of the face and of the dental shape.
Conclusion
a) Aesthetic exigency, which has become a social phenomenon in today’s life, represents for contemporary dental medicine not only as an important dental problem but also a professional duty.
b) The type of prosthesis is fully in agreement with the particularity of the prosthetic field, the presence or absence of specific prosthetic preparation corroborated with the aesthetic restoration through individualized modeling decisively influences the final results.
c) It is especially important that the therapeutic solution chosen in full accord with the degree of vision of the teeth and the type of smile giving the patients’ natural, but also the elegant result of the precision and observance of the clinical biological parameters that required the rehabilitation.