Biomedical Journal of Scientific & Technical Research (BJSTR) is a multidisciplinary, scholarly Open Access publisher focused on Genetic, Biomedical and Remedial missions in relation with Technical Knowledge as well.
Author: biomedicalopenaccessjournals
The only motto of Biomedical Journal of Scientific & Technical Research (BJSTR) Publishers is accelerating the scientific and technical research papers, considering the importance of technology and the human health in the advanced levels and several emergency medical and clinical issues associated with it, the key attention is given towards biomedical research. Thus, asserting the requirement of a common evoked and enriched information sharing platform for the craving readers.
BJSTR is such a unique platform to accumulate and publicize scientific knowledge on science and related discipline. This multidisciplinary open access publisher is rendering a global podium for the professors, academicians, researchers and students of the relevant disciplines to share their scientific excellence in the form of an original research article, review article, case reports, short communication, e-books, video articles, etc.
An Alternative Method to Reconstruct Severely Atrophic Mandible: Case Report
Introduction
The prosthetic rehabilitation of atrophic jaws has always been a challenge for the professionals involved in it. Depending on the degree of bone atrophy present not even the conventional prosthesis (dentures) cannot estore the aesthetics and function due to insufficient retention of the prosthesis, nerve compression pain, alteration of the proportions between the facial thirds and difficulties in the speech and Chewing. Due to increasing longevity, more active life and a growth in the elderly relationship in the percentage of the population, there has been an increase in the frequency of patients seeking the rehabilitation of the jaws for improving the quality of life.
The modern implant dentistry began in 1966 with the studies of Branemark precisely in this group of edentulous patients to enable aesthetic-functional rehabilitation through protocol type prostheses, where 6 implants were installed in the mandible and the patients received fixed prosthesis after 4 months. Branemark studies have demonstrated long-term predictable results being currently widely used for rehabilitation of these patients. The purpose of this article is to present a viable alternative to severely atrophied jaw rehabilitation with the use of osseointegrated implants and Branemark protocol prosthesis.
Case Report
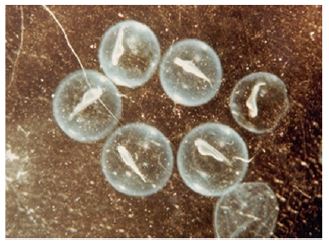
Patient, N.S.A, 72 years old, was referred to the private practice with complaints of feeding and phonation difficulties due to the impossibility of using her inferior prosthesis. She said that at the age of 20 she no longer presented teeth in the mandible and maxilla due to socioeconomic problems that motivated the extraction of decayed elements. A Cone Bean computed tomography scan demonstrated severe bone atrophy with bilateral total inferior alveolar nerve exposure and mean available bone height at the mandibular symphysis of 4 mm (Figures 1 & 2). For the imminent risk of pathological fracture of the mandible, the planned treatment for the patient was the placement of four Cone Morse WS (5.0×5.0mm) implants (Neodent, Curitiba, Brazil) at the mandibular symphysis associated with grafting with Bio oss® (Geistilich Pharma AG, Switzerland) for gain of 1mm in height.
Figure 1:
Figure 2:
A Unilock® 2.0mm, 21-hole high profile (Synthes Maxillofacial, Paoli, PA) miniplate was used to strengthen the mandible using the area of the mandibular branches and mandibular symphysis for fixation (Figure 3). This plate was modeled prior to surgery with the aid of a biomodel made from the DICOM images of cone bean tomography. Pre-modeling of the miniplate allowed its insertion to be performed by trans-oral access, reducing the time and morbidity of the surgical procedure. After 4 months the creation of the Branemark protocol prosthesis type was started and the patient was extremely satisfied with the result obtained (Figures 4 & 5). After 5 years of radiographic control we did not observe perimplant or any intercurrent bone loss (Figure 6).
Figure 3:
Figure 4:
Figure 5:
Figure 6:
Discussion
The physiological changes associated with aging are factors that modify the physical, social and economic life of geriatric patients. These physiological changes may predispose or increase the susceptibility of elderly patients to dysfunction. The reduction of osteogenesis in elderly patients associated with loss of dental elements and consequent reabsorption of the alveolar bone are the main causes related to atrophy of the mandibular bone Bruce et al. [1]; Luhr et al. [2] developed a classification of the degree of mandibular atrophy with the purpose of establishing the level of difficulty in the treatment of fractures in atrophic mandibles. Jaws with 16-20 mm in height of remaining bone are classified as Class I.
Those with 11 to 15 mm of bone height remaining in Class II and finally those with less than 10 mm are classified as extremely atrophic or Class III. The classification of Cawood & Howell [3] evaluates the degree of bone resorption from the moment the tooth was extracted. This classification ranged from 1 to 6 with 6 being the bone resorption end with the maintenance of the basilar bone alone. In the case in question the bone height in the anterior region of the mandible varied from 3.9 to 5mm and in the region of mandible body was 2mm demonstrating a residual bone extremely susceptible to pathological fracture of the mandible. In the past different surgical techniques have been proposed to allow the rehabilitation of atrophic jaws, including osteogenic distraction, onlay grafts, sandwich osteotomy, osteotomy, and graft in mandible basilar bone.
Many of these techniques presented predictable results, however, with increased morbidity of the surgical procedure and some of them with more than one surgical procedure to allow definitive prosthetic rehabilitation. In addition complications such as infection, loss of grafts and fracture of the mandible have been reported and are complications of difficult solution mainly in this group of patients. Bosker in 1996 developed the trans-mandibular implant system to be used on severely atrophied mandibles. Although the original article and subsequent articles have never defined the term “severely atrophied mandible”, most patients included in these studies had residual bone in the anterior region of the mandible of 12 mm or less. The system consisted of a base plate that was attached to the basilar bone of the mandible that contained 4 trans-osseous pins where the prosthesis was made.
The disadvantage of this system is the need for extra-oral access for its insertion and the need for residual bone in the mandibular basilar of good quality for fixation of the anchor screws of the system. Some studies have shown success rates varying from 56% to 75% Bosker and VanDijk et al. [4-6]. In a study conducted in PubMed revealed 14 cases of atrophic mandible fractures secondary to the installation of implants in the anterior region in the period between 1990 and 2012. The authors excluded mandibular fractures secondary to lateralization of the inferior alveolar nerve associated with implant installation Almasri & El-Hakin, Karlis [7]. In most reports the fracture occurred distally the installation of the implants.
The first author to describe the technique used in this patient was Lopes et al. [8] combining concepts of treatment of atrophic mandible fractures and current concepts in Implantology, using a 2.0mm system locking plate and 04 short implants that supported a Branemark protocol type prosthesis. Later, Lopes Alvarenga et al.[9] published a clinical case where they used a locking plate of the 2,4mm system only in the anterior region of the mandible associated with 4 implants that supported an overdenture type prosthesis. The use of the locking plate in a severely atrophied mandible is justified by the necessity of support of the load bearing after the insertion of the prosthesis preventing the pathological fracture of the mandible. We understand that the region of the mandibular body is usually the region of greatest bone atrophy in extreme cases and due to the presence of the inferior alveolar nerve and inadequate bone height it is not always possible to use this region for plate fixation.
For this reason we understand that the plate has to be extended to the mandibular angle region bilaterally. In this case we chose to use 2.0mm system plate because of the low bone height available for fixing the screws. In a randomized clinical study comparing 3 treatment modalities (trans mandibular implant, autogenous bone grafting for vertical gain followed by the installation of 4 implants and the installation of 4 short implants) of severely reabsorbed jaws, Stellingsma et al. [10] concluded that the use of short implants was the best modality of treatment due to the low rate of complications, high implants survival rate, stable implant-bone interface and the possibility of outpatient treatment. Freiberg et al. [11] demonstrated predictable long-term success rates with the use of short implants (Branemark implants 6-7mm) in mandibles without the use of bone grafts (95.5% success rate at 5 years and 92.3% at 10 years of control). Deporter et al. [12] also demonstrated a 92.7% survival over 10 years with 0.03mm mean annual bone loss in short implants that retained overdentures [13-14].
WS Neodent implants were chosen due to the lack of availability of short implants in the national market at the time of surgery. The Cone Morse platform can be easily modified with the placement of tapered minipillars during the prosthesis preparation. As a conclusion, this technique allows the rehabilitation of atrophic mandibles with a single surgical procedure and lower morbidity when compared with bone grafting procedures. A careful medical evaluation of the comorbidities present in this group of patients should be performed as well as the discussion about the advantages, disadvantages and possible complications.
A Perceptive of Mass Spectrometry in Clinical Chemistry: Hyphenation for Benefit of Mankind
Abstract
Clinical chemistry is associated with the metabolonomics which is the characterization of metabolome, which is a set of small molecular mass organic compounds found in a given biological medium. Metabolonomics is very important for understanding the toxicity and biomarkers. Mass spectrometry is a very important analytical technique which is used extensive in clinical chemistry. Different types of mass spectrometers are available and thus there is an improvement in the field of clinical chemistry. This overview will touch upon the various aspects of both the clinical chemistry and the mass spectrometry.
Keywords: Clinical chemistry; Mass spectrometry; Ion suppression; Metabolome
Abbreviations: MS: Mass Pectrometry; SPE: Solid-Phase Extraction; NAPQI: N-acetyl-p-benzoquinone Imine; NIH: Institute of Health; HPLC: High-speed high Performance Liquid Chromatography; MALDI: Matrix Assisted Laser Desorption / Ionization; SELDI: Surface Enhanced Laser Desorption Ionization
Introduction
What is clinical chemistry?
Clinical chemistry [1] can be defined as is the area of clinical pathology that is generally concerned with analysis of bodily fluids. It is also known as chemical pathology, clinical biochemistry or medical biochemistry. The initial study in clinical chemistry in late 19th century was the analysis of various components of blood and urine by simple chemical tests. Then the use of improved technology like spectrophotometric techniques made these analyses more easy and accurate as these are nowadays automated and can be used for a large number of samples. The different biochemical tests can be classified under chemical pathology and are performed mostly on the serum or plasma though can be applied to any body fluid. A large medical laboratory will accept samples for up to about 700 different kinds of tests. Even the largest of laboratories rarely do all these tests themselves, and some must be referred to other labs. This large array of tests can be further sub-categorised into sub-specialities as shown in the organization chart below (Figure 1). Thus it is clear that various types of analysts are present in the samples and techniques like mass spectrometry would definitely be an important tool in terms of sample throughput and detection limits.
Figure 1:
Simply put, mass spectrometry (MS) is an analytical technique that produces spectra (singular spectrum) of the masses of the atoms or molecules comprising a sample of material. The spectra are used to determine the elemental or isotopic signature of a sample, the masses of particles and of molecules, and to elucidate the chemical structures of molecules, such as peptides and other chemical compounds. Mass spectrometry works by ionizing chemical compounds to generate charged molecules or molecule fragments and measuring their mass-to-charge ratios [2-4]. In the present overview, the importance of mass spectrometry will be highlighted with reference to its use in clinical chemistry. Analysis of analyte is carried out in three stages of sample preparation, chromatographic separation and data collection and its interpretation. Each of these stages is extensive in nature and the details are available in literature [5]. This article will attempt to give a brief insight of the various aspects of mass spectrometry in clinical chemistry and the challenges normally encountered.
Experimental Aspects
Sample preparation prior to analysis by mass spectrometry is very crucial and the method adopted depends on the chemical characteristics of the analytes (acidic/basic, lightly/heavily bound) and sample type chosen for analysis (serum/urine). There are a large number of procedures like protein precipitation, liquid-liquid extraction, immunoaffinity purification, dilution and solid phase extraction. However in practice, it is usually a combination of all these procedures that are used [6-12]. This is because the sample matrix decides the procedure adopted. Blood samples are the most difficult samples that need sample preparation because of the complex matrix and low concentration of analytes in the sample. Urine samples can be diluted easily as the concentrations are often higher. Moreover the chemical differences between the analytes of interest and sample matrix decides the preference of sample preparation. Solid-Phase Extraction (SPE) is a separation process by which analytes are separated from matrix owing to differences in their chemical attraction for a solid through which the sample is passed (known as the stationary phase).
The portion that passes through the stationary phase is collected or discarded, depending on whether it contains the desired analytes or undesired impurities. If the portion retained on the stationary phase includes the desired analytes, they can then be removed from the stationary phase for collection in an additional step, in which the stationary phase is treated with an appropriate eluent. SPE results in a rudimentary separation of analytes from potentially interfering matrix components. Immunoaffinity purification (known as immunoextraction) uses antibodies bound to a solid phase to allow for separation of the antibody-bound analytes from the unbound matrix components. For samples with analytes at higher concentrations and less complex matrices, dilution of the sample can be carried out. Introduction of sample into mass spectrometer is an important aspect and it is commonly carried out using a chromatographic method in order to spread out the deliverance of analyte and components of matrix into the mass spectrometer. The chromatographic techniques involve Gas and Liquid Chromatography, wherein the mobile phases are gas (He) and liquid (mixture of aqueous and organic solvents) respectively. The column temperature affects the affinity of the molecules for the stationary phase thus is an important parameter for separating the volatile analytes from matrix components.
The hindrance of functional groups in the analytes in GC analysis can be reduced by derivatization of these compounds. GC-MS is used for comprehensive drug screening in the clinical laboratory. Liquid chromatography (LC) encompasses a variety of analytes and the need for derivatization does not arise. The ratio of the aqueous/organic ratio solvents in the mixture used as mobile phase alters the attraction power between the analytes/matrix with the stationary phase. LC separation though appear similar to SPE is far more precise than the latter.
Analysis by mass spectrometers is possible only when the analytes is in the form of gaseous ions. Therefore ionization methods (convert analytes in solution to gaseous ions) become an important part of mass spectrometry. The main ionization methods adopted in clinical chemistry are electro spray and atmospheric pressure chemical ionization. Electro spray ionization produces smaller droplets of the liquid eluting off from a chromatographic column using combination of voltage, heat, and air, thus increasing the charge per unit volume and the ions (including larger protein species) are sent into the gas phase for analysis by mass spectrometer. In Atmospheric pressure chemical ionization, ions are produced by vaporization of the sample and the electrical discharge produced by plasma, known as coronal discharge ionizes the sample. Different types of mass analyzers are available for analysis.
Basically a mass spectrometer uses a given molecule‘s mass/ charge ratio (m/z) to distinctively identify components of the sample. Different types of mass analyzers are available based on various characteristics like the mass range limit, speed of analysis, mass accuracy and resolution. Time-of-flight (TOF) mass spectrometers use an electric field to accelerate bundles of gas phase ions toward a detector and the time taken is dependent on the m/z of an ion (low m/z ions travel faster). TOF analyzers have in effect indefinite m/z range, very high sensitivity, mass accuracy, and percentage of ion transmission, but a limited dynamic range. Quadrupole analyzers have 4 parallel rods arranged in a square and the charge on these alternate at a set frequency to achieve balanced attraction and repulsion of the ion of interest and thereby a stable path is achieved.
The charge can be changed over the analysis period thus facilitating sequential detection. During the dwell time (period on a millisecond time scale, for which the analyzer remains at a given voltage and frequency), one m/z is detected. Quadrupole analyzers have a limited m/z range, high sensitivity and mass accuracy, but low percentage of ion transmission. Tandem Mass Spectrometry became popular as analyte identification using m/z (morphine / hydromorphone, has m/z peak at ~286) alone does not always give the required specificity. These spectrometers use multiple sets of quadrupoles arranged in series. A common tandem massspectrometry (MS/MS) analyzer will have 3 quadrupoles (referred to as a triple quadrupole mass spectrometer or – triple quad‖). There are many methods of analysis.
The methods of analysis based on linear quadropoles are extensively used in the clinical laboratories. The different methods differ on basis of selectivity of ions detected. Full Scanning is the acquisition of full-spectrum data from a sample and very useful in drug screening and is applicable to more than 200 different drugs or metabolites. However the main disadvantage is the lack of specificity and highly complex mass spectrum thereby reducing its use for routine analysis. When the analyte is known, then the voltage and frequency can be optimized to reduce the interferences from most of the other components in the matrix. This is known as selected ion monitoring (SIM). Thus in this monitoring, both selectivity and specificity for an analyte is high and the spectrum is less complex. It is used for the analysis of very long chained fatty acids. Multiple Reaction Monitoring (MRM) offers best specificity with mass spectrometry. The spectra obtained are less complex and can be used for drug confirmation testing.
Applications in Clinical Chemistry
MS-based analysis in clinical chemistry has been carried out since 1970s, based on targeted methods focusing on particular metabolites or chemical families [13-16]. Toxicological screening is very common in clinical chemistry and it is involved with the metabolomics [17-20]. The metabolome is a set of small molecular mass organic compounds found in a given biological medium. The analysis of complex proteins known as shotgun proteomics is carried out to a lesser extent. Metabolome consists of molecules that are metabolites (organic substances naturally occurring from the metabolism of a living organism). There are two different kinds of metabolites viz endogenous and exogenous metabolites based on their origin.
Endogenous metabolites could be classified as primary (directly involved in essential life processes e.g. amino acids/ glycolysis) and secondary (species for specific biological function e.g. hormones for mammals) metabolites. Exogenous metabolites represent the biotransformation or metabolism products of exogenous compounds, resulting from modification of the original molecule to introduce a functional group and/or conjugation in enzymatic conversion [21,22]. Metabolomics / metabonomics is the analysis of metabolome in a given condition. Nicholson’s definition underlines the role of two major scientific disciplines used in metabonomics: analytical chemistry and biostatistics. Metabolomics is based on the interpretation of data intended facilitate understanding of biological processes. Biological markers or biomarkers are measurable internal indicators of molecular and/or cellular alterations that may appear in an organism after or during exposure to a toxicant and possible disease [23-25]. According to the National
Institute of Health (NIH), a biomarker is -a characteristic that is objectively measured and evaluated as an indicator of normal biologic processes, pathogenic processes, or pharmacological processes to a therapeutic intervention [25]. Metabolites are highly diverse in chemical characteristics and therefore there is no single technique available for their analysis in biological media. Mass spectrometer is one such instrument for metabolite characterization [26-29]. LC/MS is a very important hyphenation technique used for the clinic chemistry. There are large numbers of reports on the analysis for different compounds to understand nephrotoxicity and hepratoxicity [30-33] by analysis of urine and serum samples. These studies were carried out to understand the mechanism or as biomarkers. Acetaminophen (also known as N-acetyl-p-aminophenol, APAP) is frequently used as a model drug for hepatotoxicity. Normally it is removed from the body through hepatic glucuronide and sulphate conjugation.
Presence of larger amounts results in production of reactive metabolites such as N-acetyl-p-benzoquinone imine (NAPQI) which form a conjugate with glutathione (GSH) and finally is degraded to mercapturic acid derivative that can be detected in urine sample. Thus to understand the mechanism of the changes due to toxicity, the mass spectrometric analysis of urine sample becomes helpful. Also NAPQI can also oxidize glutathione and itself form paracetamol [34]. When GSH is completely removed, the reaction with cell macromolecules occurs and this mechanism is given for understanding the hepatic necrosis that occurs. Mass spectrometric analysis of plasma samples could also be used for understanding the mechanism of hepatotoxicity using long-chain acylcarnitines as biomarkers. Studies could also be used to understand the effect of drugs and the time needed for these to cause some effects. Nowadays studies are also focussed on the understanding of various diseases including cancer [35-38]. Clinical diagnostic measurements are carried out to understand the differences between healthy and diseased states.
Pharmokinetics is a branch of pharmacology that deals with the study of the substances administered externally to a living organism. It derives its name from the Greek words pharmakon and kinetikos which mean drug and moving respectively. It is the study of tracing and monitoring the nature of the drug from the moment it is administered to the point where it is completely eliminated from the body. Pharmokinetics also gives an idea of the absorption and distribution of the drug, chemical changes in the body and the effects and routes of excretion of the metabolites [39]. The dose and site of administration of the drug can also affect its pharmokinetic properties [40]. Mass spectrometry is used for the studies of pharmokinetics as the matrix is very complex and there is a need for a technique which is highly sensitive. The most commonly used instrumentation is the LC-MS with a triple quadrupole mass spectrometer. The use of tandem mass spectrometry enhances the specificity. The determination involves the use of calibration curves and internal standards.
The blank samples prior to drug administration need to be done to ensure the validity of the determination as the sample matrix is quite complex. The calibration curves are mostly linear but the curve fitting with complex functions are also reported as the linear range is much lower than the concentration ranges normally encountered [41]. High-speed high performance liquid chromatography (HPLC) in combination with tandem mass spectrometry was used to analyze phenylbutazone and its metabolites and also propiopromazine and promazine.
Challenges in Clinical Mass Spectrometry
Ion suppression occurs when something present in the sample interferes with the ionization process of the analytes. The presences of none or less volatile components reduce the droplet formation and the efficiency of solvent evaporation, resulting in decrease of ion formation. There are various reasons like sample matrix, coelution that can cause ion suppression and these have detrimental effects on both electrospray and atmospheric pressure chemical ionizations. However it has been reported that the effect is more pronounced for electrospray ionization [42]. The studies on biological extract revealed that the main cause of ion suppression is the change in the properties of the spray droplet due to the presence of non-volatile / less volatile components [43]. The presence of non volatile materials like salts, ion pairing agents, endogenous compounds, drugs or metabolites result in the change in the efficiency of the formation or evaporation of droplet. This in turn affects the amount of charged ion that reaches the detector. The mass and charge of individual analytes can cause ion suppression. The molecules with higher mass will suppress the signal of the smaller molecules [44] and also the more polar analytes are prone to suppression [45]. There are different experimental procedures that can be adopted to evaluate the ion suppression. The response of instrument for different calibrators including any internal standards that are injected into the mobile phase. The comparison of the standards added to the pre-extracted samples before extraction or to the specimen matrix can also be used [46].
The different procedures can give different information. The data using the calibrators provides a check of the response value. However the other approaches can show the effect of sample matrix on the Mass spectrometry signal and give an idea whether the loss of signal is due to matrix or due to ion suppression. Ion suppression may result due to the presence of various specimens, both inorganic and organic. The effect of endogenous matrix on ion-suppression is understood by studies [46] wherein it is seen that the donor serum samples were subjected to three separation techniques namely solid-phase, solvent extraction and protein precipitation. To the extracts, caffeine solution was added and analyzed. The results showed that the three extracts contained endogenous components that produced ion suppression > 90% when compared with a caffeine reference solution of same concentration. The injection of drugs or metabolites that maybe present in the specimen is adopted as a coeluting drug does not produce similar mass fragments does not indicate that this compound may not cause ion suppression. The post-column continuous infusion (process of extracting chemical compounds or flavors from plant material in a solvent) into the MS detector [47,48] will give a constant response if there is no ionization interferences.
However, in practice it is seen that there is a suppression of signal corresponding to the void volume of column. The degree of suppression of signal and the time needed for full response is dependent on the nature of the compound [45], sample and its preparation method. It is also possible that ion suppression is not only limited to the column void or initial analysis. It can become more evident during subsequent injections. The ion suppression is also dependent on the concentration of the analyte as this is correlated to the ratio of matrix to analyte. van Hout et al. [48] showed that the ion suppression in the analysis of clenbuterol in urine was 37% and 69 % for a concentrations of 93 and 45 μg/L respectively. These studies showed the advantages of decreasing the matrix to analyte ratio and also the importance of validation of ion suppression measurements in the concentration levels of the analyte normally encountered. Apart from the sample matrix, various other factors also result in ion suppression. The chromatographic ion pairing reagents present in the mobile phase can also affect the signal intensity. Moreover, since these are present in the mobile phase, the effect on ion suppression will be observed throughout the analysis. The solution to this problem is to select an alternative ion pairing agent which is normally a weaker acid. This kind of approach is adopted where in acids like acetic, formic etc are used instead of trifluoroacetic acid.
However if the need to use trifluoroacetic acid arises, then its concentration can be reduced or surface tension lowering modifiers can be added to decrease the effect on ion suppression [49]. There is a process known as – TFA Fix‖ wherein the post-column addition of a sheath liquid of propanoic acid (10%) in 2-propanol is added. There are reports wherein 2-(2-methoxyethoxy) ethanol has been used as a signal enhancer [50] to eliminate the ion suppression due to acetate ions and a 100 fold enhancement was achieved. Another approach is to use the chromatographic conditions to enable the elution of compounds of interest in a region of low or no ion suppression. However this may increase the elution time [51]. As most of the HPLC assays include an internal standard, the conditions are modified so that both the compound of interest and internal standard coelute [52] and the ion suppression for both the compounds will be equal as the peaks coincide. If a stable isotope internal standard is available then the degree of ion suppression will be identical. However it is worth noting that even the use of an internal standard may not completely overcome the problems associated with the accuracy or precision of an analysis which is associated with ion suppression as the ion suppression results in decrease of signal and the signal to noise ratio will be reduced to such an extent that the accuracy and precision will be severely affected. Thus the evaluation of ion suppression is of great importance even when internal standard is used. The ion suppression is also an important parameter that has to be evaluated not only in ESI interfaces but also other MS techniques such as Fourier transform (FTMS), matrix assisted laser desorption / ionization (MALDI) and surface enhanced laser desorption ionization (SELDI) [53-55].
Summary
The metabolome is characterized by a large diversity of chemical structures. The use of LC-MS has gained popularity due to its versatility, sensitivity. This overview gave an insight to the some of the applications of LC-MS in clinical chemistry. The main focus of this over view was to give a simple picture of the both technical and non-technical aspects in a very concise manner. The applications of LC-MS in field of toxicology and as biomarkers have been touched upon. It needs to be understood that the field of clinical chemistry is one among its kind as the information needed is always growing and no study can final. The Literature of course gives the readers the understanding to these problems but in reality the toxicity could arise due to various complex factors and to understand these combinations of many targeted approaches are needed to provide the clinical chemist with the information.
However it is to be mentioned without fail that the constant improvements in mass spectrometry has improved the efficiency of the approaches by making it possible to identify metabolites of interest. Metabolomics is the combination of analytical chemistry, statistics and bioinformatics tools used separately or together to perform the various steps of sample preparation, viz, acquisition of metabolic fingerprints, automatic detection of ions, statistical analyses and identification. Each step is itself a complete science in its own way. The data generated is so large that it needs correct understanding and discrimination to be able to analyze them. This is one of the most important challenges in the field of metabolomics. The mass spectral libraries (available for APIMS- based metabolomics: mass spectral and CID mass spectral libraries) are useful for interpretation of biological datasets and to characterize unknown components. Ongoing improvement in this field is becoming a reality with the information obtained from various researchers and sharing of the spectral libraries in order to help in the characterization of unknown metabolites of toxicological and clinical relevance.
A Case Report about Small Intestinal Metastasis from Esophageal Carcinoma Combined with Bowel Obstruction
Abstract
It is extremely rare for metastatic tumors derived from extra-abdominal sites to arise in the small intestine [1, 2]. Herein, we report a case of the metastasis of esophageal squamous cell carcinoma (SCC) to the small intestine. A 72-year-old male, who had previously undergone subtotal esophagectomy for esophageal carcinoma at our hospital, was admitted with abdominal pain and abdominal distension. Abdominal computed tomography revealed an increase in the thickness of part of the small intestinal wall, which had caused mild bowel obstruction. The patient had no severe symptoms, so we initially administered conservative therapy (a fast venal transfusion), and his symptoms temporarily improved. However, the ileus did not improve so we conducted laparotomy. A solitary tumor was identified in the ileum, which was determined to be the cause of the intestinal obstruction, but no other tumors were seen at intra-abdominal sites. Based on the postoperative pathological findings, the lesion was diagnosed as a metastatic tumor derived from esophageal SCC. After surgery, the ileus vanished, and the patient was discharged without symptoms. We encountered an extremely rare case of small intestinal metastasis from esophageal carcinoma.
Introduction
Recently, some cases of small intestinal metastasis from extraabdominal sites have been reported, but such cases are rare. In patients with esophageal carcinoma, we often encounter liver, lung, and bone metastases, but small intestinal metastasis from esophageal carcinoma is extremely rare. It was first reported by Wang et al. in 1985 [1-4]. Herein, we report a case of small intestinal metastasis from esophageal carcinoma combined with bowel obstruction. We had performed subtotal esophagectomy and 2-field lymphadenectomy because of esophageal squamous cell carcinoma (SCC) 6 years ago to treat the primary tumor.
Case Report
A 72-year-old male underwent subtotal esophagectomy and 2-field lymphadenectomy because of esophageal SCC in the middle thoracic esophagus (pT1bN0M0 stage II) 6 years ago [5]. After surgery, he received chemotherapy, involving 5-fluorouracil, cisplatin, and docetaxel, but it was interrupted during the first course due to kidney dysfunction. Four years and 9 months later, lung metastasis was detected in the right lung on computed tomography (CT). We performed a partial pulmonary resection and found other tumors, which were not detected on pleural preoperative imaging. All of the tumors were resected, and the diagnosis of metastasis from esophageal SCC was confirmed. No additional treatment was administered because the patient exhibited renal hypo function. One year later, some pleural dissemination and lung metastases appeared; however, the patient did not have any symptoms. He subsequently visited our hospital regularly. About 6 years after the subtotal esophagectomy, he presented to our hospital with abdominal pain.
A physical examination revealed slight abdominal pain in his lower abdomen, abdominal distension, and a surgical scar from the medial incision made in the abdomen during the subtotal esophagectomy. A laboratory analysis produced the following results: white blood cell count, 6.3 × 10³/mm3 (normal range, 3.5-9.0 × 10³/mm3); hemoglobin count, 10.8 g/dL (normal range, 13.5-18.0 g/dL); platelet count, 42.7 × 10⁴/mm3 (normal range, 13.0-37.0 × 10⁴/mm3); total bilirubin, 0.5 mg/dL (normal range, 0.4-1.5 mg/dL); albumin, 3.3 g/dL (normal range, 4.1-5.1 g/dL); C-reactive protein; 3.68 mg/dL (normal range, 0-0.3 mg/dL); blood urea nitrogen, 60.0 mg/dL (normal range, 8.0-20.0 mg/dL); and creatinine, 1.71 mg/dL (normal range, 0.-1.1 mg/dL). The patient’s serum level of SCC antigen was 10.8 ng/ml (normal range, <1.5 ng/ ml), and his serum level of carcinoembryonic antigen was 6.6 ng/ ml (normal range, <5 ng/ml). All of these parameters, except the white blood cell count and total bilirubin level, exhibited abnormal values.
Abdominal CT revealed an increase in the thickness of part of the small intestinal wall, which had caused bowel mild obstruction (Figure 1). It was possible that the patient had a malignant neoplasm, such as small intestinal carcinoma or a gastrointestinal stromal tumor. His symptoms included slight abdominal pain and abdominal distension, so we initially administered conservative therapy, and his symptoms temporarily got better. However, his ileus did not improve so we conducted a laparotomy. A solitary tumor was identified in the ileum about 80 cm proximal to the terminal ileum, and it was determined to be the cause of the bowel obstruction. No other tumors were seen in the abdominal cavity, including the small intestine (Figure 2). Thus, we conducted a partial resection of the small intestine.
Figure 1: Abdominal CT revealed that part of the small intestinal wall had become thicker, causing bowel obstruction.
Figure 2: A solitary tumor was identified in the ileum about 80 cm proximal to the terminal ileum, and it was determined to be the cause of the patient’s bowel obstruction.
Macroscopically, the surgical specimen contained a mass measuring 3.0 × 2.5 cm in size, and it occupied the whole circumference of the ileal lumen, resulting in stenosis (Figure 3). Histologically, the lymphatic sub mucosal infiltration of viable SCC tumor cells was observed from the mucous membrane to the serosa. These histological findings revealed that the metastasis was not derived from peritoneal dissemination. In addition, there was no mesenteric lymph node metastasis from the SCC. The patient was discharged without symptoms, but ileus appeared again at 1 month after the partial resection of the small intestine, and so he was re-hospitalized. CT showed that the lung and liver metastases were getting worse, and some bone metastases had appeared.
Figure 3: The surgical specimen contained a mass measuring 3.0 × 2.5 cm, and it occupied the whole circumference of the ileal lumen.
Discussion
Some types of cancer are reported to be associated with intestinal metastases, such as lung cancer, breast cancer, and malignant melanoma. However, metastatic intestinal tumors derived from extra-abdominal sites are very rare [1,2]. We usually examine esophageal cancer patients for liver, lung, and bone metastases, whereas intestinal metastatic tumors derived from esophageal cancer are extremely rare [3,4]. SCC of the esophagus is characterized by extensive lymphatic dissemination via the longitudinal lymphatic system, which runs along the esophagus and drains into the large number of (widespread) lymph nodes found in the thorax and abdomen [6]. It has been reported that the retrograde spreading of esophageal SCC cells into the cervical, mesenteric, or iliac lymph nodes is unusual [7,8].
The intra-abdominal region can be reached from the esophagus via the lymphatic network connecting the esophagus and intestines, lymphatic embolization, and peritoneal seeding of the tumor during surgery. The intra-abdominal region can also be reached via the hematogenous route, especially via the vertebral venous plexus [9,10]. In esophageal cancer, metastases can arise in the intestinal tract via any of these routes. In our case, it is unlikely that tumor seeding during the operation was responsible for the patient’s metastasis because only one small intestinal metastatic lesion formed. Microscopically, the lymphatic submucosal infiltration of viable SCC tumor cells was observed. Based on this finding, lymphoid metastasis is the most likely mechanism by which metastasis occurred in this case, but hematogenous spread cannot be excluded.
One interesting aspect of this case is why the solitary metastasis occupied the whole circumference of the ileal lumen. The lymphatic network develops on the mesenteric side of the small intestine, so mesenteric dissemination via the lymphatic network usually causes metastatic lesions to appear on the mesenteric side, as is seen in breast cancer. This might be explained by the characteristics of SCC. There have been several reports about small intestinal metastasis derived from esophageal SCC [3,4,11]. The tumors in these cases were detected based on their clinical symptoms, such small bowel obstruction and perforation, or were detected via imaging in symptomless patients.
In some cases, multiple metastases arose. In our case, an isolated small intestinal metastasis derived from esophageal carcinoma caused small bowel obstruction. The patient was disease-free for about 4 years and 9 months after undergoing subtotal esophagectomy until a metastatic lesion developed in his right lung. After undergoing partial intestinal resection, he wasdischarged, but the ileus recurred. CT showed that the lung and liver metastases had got worse, and some bone metastases subsequently appeared. Small intestinal metastases derived from esophageal carcinoma might be a significant finding that is generally associated with a poor prognosis. In conclusion, intestinal metastatic tumors derived from esophageal cancer are extremely rare. In addition, such tumors can develop with or without symptoms. Thus, physicians should keep in mind the possibility of small intestinal metastasis derived from esophageal carcinoma when patients who have a history of advanced esophageal cancer present with acute abdominal problems, such as bowel obstruction or perforation.
A Technique to Monitor the Real-Time Proton Leak Status of Cells
Introduction
Proton leak was a detour of protons from their original path leading to the reduction of mitochondrial membrane potential. It leads to the decrease of ATP production per glucose molecule. It is a form of energy loss [1]. Proton leak was found to reduce the reactive oxygen species (ROS) level [2]; therefore, it plays a role in aging [3], diet [4-5] and health [6-9]. A method to monitor the real-time proton leak in cells would help for the understanding of physiological system and disease conditions. When protons were leaked out from mitochondria, it increased the leaking of electrons from electron transport chain [10]. The leaked electron would generate electric signal in Microbial Fuel Cells (MFC). Measuring the electric signal sent out during the process of proton leak would be a way to quantify thereal-time status of proton leak in live cells. Theoretically, higher the electric signal means higher is the proton leak. However, the accuracy of MFC measurements is influenced by the internal resistance of the apparatus. The internal resistance is contributed by the activation loss from electron transfer from cells to the anode, the characteristics of cellular metabolism, the flux of reactants and ohmic loss [11].
Activation loss and cellular metabolism are cell-specific, while flux of reactants and ohmic loss arise more from the MFC equipment and operating conditions, for example the resistance of the electrodes and membrane, the conductivity of the electrolyte solutions and the quality of the electrical contacts [12]. However, the measurement of internal resistance was very time consuming. Therefore, experiments were done to see if there was correlation between electric current with and without correction.
Methods
MFC has two chambers, a cathode and an anode, that are separated by a proton exchange membrane. The cathode was filled with 100ml of 50mM potassium ferricyanide (III) (C6N6FeK3) to function as an electron acceptor, while 100ml of isolated cells (4 x 10⁷ cells/ml) were added to the anode as electron donors. Nitrogen gas was pumped into the anode chamber for 5 min to remove oxygen from the headspace of the anode. A carbon electrode was placed in each chamber connected with external wire that are connected with a digital multi-meter (Tektronix DM4020, USA) to monitor the open circuit voltage (EMF) across the electrodes. Current I, without correction for internal resistance, was calculated using equation 1 with an external resistance (Rext) of 1000Ω.
EMF=IRext (1)
The internal resistance of the MFC was determined in a closedcircuit arrangement shown in Figures 1& 2. Closed circuit voltages were measured in different external resistance of 3,000Ω, 2,000Ω, 1,000Ω, 800Ω, 600Ω, 400Ω or 200Ω. Using the equation 1, the corresponding electric currents were calculated. A polarization curve, that was a plot of electric current with voltage, was generated, and the internal resistance Rint was determined by the slope of the regression [11]. Electric current with the correction of internal resistance was calculated as in equation 2.
EMF=I(Rint + Rext) (2) (Figure 1)
Figure 1: Electrical circuit diagram for internal resistance determination.
Figure 2: Plot of electric current without corrected with internal resistance versus electric current with correction (correlation coefficient = 0.9913).
Result and Conclusion
A good correlation was observed between electric current with or without correction (Figure 2). It indicated that it was possible to use the electric current without correction to correlate with the degree of proton leak in cells. When the experimental conditions were consistently controlled, the changes in electric signal should reflect to the biological changes in cells. In this experiment, 30-minute survival was good for the hepatocytes the cells used in the studies, which further supports the use of MFC in monitoring the proton leak status of live cells. The present technique had advantages over other chemical testing method, because it provided instantaneous information on metabolic changes in tissues.
A Cross-Over Study to Evaluate the Effect of Glucagon-Like Peptide 1 on Women with Polycystic Ovarian Syndrome
Abstract
Background: Crossover design is very popular for a study of new and developmental drugs. However this design tends to be misused regardless of whether it is suitable for underlying research questions.
Method: Given that in clinical practice 2×2 cross over is the most commonly used design, the Hills- Arbitrage approach is suggested to analyze data. Furthermore, we propose fitting a linear mixed model and then conducting a likelihood ratio test to yield a single p-value on data with multiple time points within each stratum.
Finding: Applying these methods to a real data, we evaluate effect of glucagon-like peptide 1 (GLP-1) on women with polycystic ovarian syndrome (PCOS). Despite absence of statistically significant results, this study as the first study to explore direct administration of GLP-1 to PCOS women is nevertheless clinically meaningful. Not only does it show a longer washout period is desired, but also it suggests GLP-1 may have the same positive effect on PCOS as MET does.
Improvement: A larger parallel study is warranted, and clinicians and biostatisticians should collaborate more so that data can be analyzed appropriately and interpreted from both statistical and clinical points of view.
In a crossover study, subjects receive a sequence of different treatments in a random order usually separated by a washout period. One major advantage of the crossover design is that the trial requires fewer patients to produce the same precision as a parallel trial, since each subject receives all treatments and thus serves as his or her own control. However, with data from crossover design trials, it is difficult to separate out treatment effects from both period and carry-over effects. Unlike a parallel clinical trial, a crossover study is typically longitudinal. However, entry- level data analysts tend to ignore the longitudinal data structure and adopt over-simplified methods intended for cross-sectional studies Mills [1] . Even when the longitudinal data structure is taken into account,period and carry-over effects are still often ignored. For example, the typical 2×2 crossover design is often mistakenly analyzed by a paired t-test Diaz-Uriarte [2,3]. Another tendency is to report the results separately for each sequence, i.e., AB and BA separately, which ultimately yields two separate estimates for the treatment effect, sometimes conflicting conclusions in which one sequence indicated treatment effect while no or hazard effect in the other.
The linear mixed effects model (LMM) and the generalized estimation equations (GEE) method are two appropriate and commonly used approaches for longitudinal data. In fact, when Zenger and Liang. Reviewed potential applications of their milestone work, GEE, they specifically used a 2×2 crossover design as an example. Unfortunately, these methods can appear computationally complicated and theoretically difficult for a clinician or an entry-level statistician. Yet in clinical practice, a 2×2 crossover design is the most commonly used design. We suggest to use the Hills-Arbitrage approach Grizzle, Hills and Arbitrage [1,4,5] to analyze data from such a design. The Hills-Arbitrage approach is essentially a two-sample t-test for a continuous variable, and is thus likely to be familiar to clinicians and entry-level statisticians. Furthermore, it had been demonstrated there were connections among LMM, GEE, and Hills-Arbitrage approach by Diaz-Uriarte [4], thus adding further appeal to the Hill-Arbitrage [1] approach. Further, we propose fitting a linear mixed model and conducting a likelihood ratio test to yield a single p-value on data from a 2×2 crossover study with multiple time points longitudinally measured within each sequence and treatment stratum. Clinicians are often concerned about whether there is a treatment effect, and thus having a single p-value on which they can make a decision is a very appealing feature. Polycystic ovarian syndrome (PCOS), a common endocrine disorder affecting 5-10% of reproductive-aged women, is a common cause of menstrual irregularity, hirsutism, and anovulatory infertility Knochenhauer, Asunción [2,6] So far, the crossover design is also a prevalent choice of evaluating the treatment effect of an intervention to PCOS, e.g., Wang [7]. It has been reported that women with PCOS may have altered in cretin hormone response Svendsen [8]. Metformin (MET) is widely used as a treatment for PCOS, probably by increasing glucagon-like peptide 1 (GLP-1) biosynthesis and secretion, thus increasing the incretion effect Svendsen [8]. This motivated us to propose direct administration of GLP-1 to women with PCOS.
Materials and Methods
Hills-Arbitrage approach: First, we give a brief describe on Hills-Arbitrage approach. Using the notation in (Diaz-Urinate 2002; Jones and Ken ward 2003), the statistical model for a 2 by 2 crossover study can be expressed as,
where πj is the period effect for the period j=1, 2, τ d is the direct treatment effect for the treatment d=A,B, Sik is the random subject effect for subject k in sequence i, and eijk is the random noise for subject k in period j and sequence I, and it is assumed that eijk ~ N (0, σ ) 2. Without loss of generality, the response variable yijk is assumed to be quantitative and to have a normal distribution. For each sequence (i.e., AB and BA), the treatment difference was calculated, yielding d12AB, namely, Y1AB -Y2AB and d21BA, namely, Y2BA-Y1BA. The Hills- Arbitrage approach tests the treatment effect (or treatment difference between A and B) by averaging the means of d12AB and d21BA. With some algebra, it can be shown that the estimator given by HA approach is unbiased for the treatment difference,τ 1– τ 2. In addition, one half of the difference between the means of d12AB and d21BA can be used as a test statistic to evaluate the period effect. Even though there is no specific parameter for the sequence effect in Equation 1, the inequality of carry-over effect in both sequences still can be tested by comparing Y1AB +Y2AB with Y1BA+Y2BA. When this is tested to be statistically significant, the Hills-Arbitrage approach suggests a two-stage procedure to evaluate on the treatment effect because the average between the means of d12AB and d21BA is subject to biases. This procedure was criticized by Freeman, Senn [6,9,10] mainly for its inflated type I error and thus potential misleading conclusions. For detailed descriptions on the Hills-Arbitrage approach, see Hills and Arbitrage, Diaz-Uriarte [1,4]. Also, interested readers are referred to Senn [9] for the diagram of the two-stage procedure of HillsArbitrage approach.
The Approach for 2×2 Longitudinal Cross-Over Design
To implement the Hills-Arbitrage approach more smoothly, we may rewrite the statistical model in Equation 1 as below,
Where I(x) is an indicator function and equals to one if x is true, 0 otherwise. Sik and eijk are the same as in Equation 1. In this equation, it can be easily shown that β 3 is the parameter representing treatment effect. β 1 corresponds to period effect, and β 2 corresponds to carry-over effect, providing a means to test the inequality of carry-over effects in both sequences. Using these indicators, all effects of interest are presented by a single coefficient. In a longitudinal crossover study (without loss of generality, suppose there are only 2 time points), Equation 2 may be then extended to include time points,
Where if both β 3 andβ 6 are zeros, there is no differences between A and B at either time point. The simpler model without these two parameters (the corresponding model under the alternative hypothesis) is nested within the above model (the model under the null hypothesis), thus a likelihood ratio test can be used to examine which model is a better fit. Similarly, if both β 1 and β 4 are zeros, there is no period effect. And if both β2 and β 5 are zeros, carry-over effects for both sequences are equal at either time point.
Miscellaneous
Baseline characteristics (such as age, BMI) were presented as median and Inter-quantile range (IQR). A Wilcoxon test was conducted to determine if a specific characteristic variable has the same distribution between two sequences of this crossover study. Data on those markers (e.g., GLP-1, LC) were log-transformed. A p-value < 0.05 is regarded as statistical significance. The statistical analysis was carried out in the R language version 3.1(www.r- project.org).
Experiment and Data
In this study, there were 28 PCOS accompanying with hyperinsulinemia women without use of any drugs known to alter glucose and insulin metabolism within 3 months before the study. The study was conducted in accordance with the Declaration of Helsinki and was approved by the ethics committee of Jilin University. These participants were randomized into either MET/ GLP or GLP/MET group (14 subjects in each group), and given MET (0.5g tid) and GLP-1 (5ug during the first month, then followed by 10ug for a duration of 2months) for a period of 3months. After 10 days of washout, they were crossed-over to the other treatment. Venous blood was drawn for the detection of blood lipids including triglyceride (TG), total cholesterol (TC), high-density lipoprotein (HDL), and low-density lipoprotein (LDL) using biochemical methods (Beckman, USA), the detection of 6 sex hormones including familial hyper cholesterolaemia (FH), follicle-stimulating hormone (FSH), estradiol (E2), testosterone (T), luteinizing hormone (LH), and prolactin (PRL) using radio immunoassays, the detection of fasting blood glucose levels using an oral glucose tolerance test (OGTT) with 75 g of glucose, the detection of 1-h postprandial blood glucose, and the detection of 2-h postprandial blood glucose (BIOSEN5030 blood glucose analyzer). In addition, insulin, C-peptide (electro chem. iluminescence immunoassay, Roche, Germany), active GLP-1, and total GIP levels (Enzyme-linked immuno sorbent assay, ELISA) were measured during fasting (0 min) and 15min, 30min, 60min, 120min, and 180min after glucose administration. All these measurements took place repeatedly at the baseline and at the end of each period.
Table 1: The baseline characteristics (median + IQR for continuous variables).
Results and Discussion
The primary objectives of this study are to compare the effects of MET vs. GLP-1 on women with PCOS accompanying with hyper insulinemia and to assess whether GLP-1 has beneficial effects on PCOS. More details of the study are provided in the Methods section. Our cross-sectional analysis on the 2×2 crossover data indicated there is no difference between GLP-1 and MET (Tables 1 & 2). However, there might exist a period effect (e.g., p=0.0039 and 0. 0029 for progesterone and PRL, respectively) and inequality of carryover between two sequences (p=0.0307 for testosterone). The washout period of 10 days was chosen based upon our preliminary studies (unpublished work) on the pharmacokinetics behaviors of GLP-1. Considering this is the first experiment testing the effect of GLP-1 on PCOS and the first test implementing crossover design, it remains unclear whether 10 days is sufficiently long to wash out the effects of GLP-1 or MET in either sequence. Our analysis suggested a longer washout period for GLP-1 might be required. (Table 3) no statistically significant difference between GLP-1 and MET on summarizes the treatment effect and period effect estimates at longitudinally measured markers, i.e., glucose, insulin (INS), and C- each time point for the longitudinal 2×2 crossover data. There is peptide.
Table 2: The comparison between GLP-1 and MET on simple endpoint.
Note: The values of these markers were logarithm transformed. * p<0.05.
Table 3: The comparison between GLP-1 and MET on multiple endpoints.
Note: The values of these markers were logarithm transformed. *p<0.05.
For the period effect testing, all p-values at all time points were bigger than 0.05 for the analysis on glucose. Based on those p-values, it may be concluded that no period effect for glucose since there exists no period effect at each time point. However, for INS and C-peptide, no definitive conclusion can be drawn because inconsistent p-values were obtained at different time points. Thus, we conducted a likelihood ratio test (see the Materials and Methods section for more details) to obtain a single p-value. P-values are 0.6921, 0.0009, and 0.0052 for INS on treatment (GLP versus MET) effect, period effect, and carry-over, respectively. P-values are 0.8181, <0.0001, and 0.0036 for treatment effect, period effect, and carry-over, respectively. It is evident that both the period effects and inequality of carryover in two sequences exist in the study. Interestingly, as shown in (Figure 1), there is an obvious pattern in the treatment difference of C-peptide and INS between GLP-1 and MET over time in spite of no statistical significance. For C-peptide, the differences reached their nadirs at the extreme time points and their peak at the middle time points (although for the GLP1- MET sequence, the peak was attained earlier than for the MET- a sharp decline followed by a gradual ascent. Further investigation GLP-1 sequence). Meanwhile, the change patterns for INS were is warranted on the biological implication beneath those patterns. approximately identical for both sequences, i.e., peak at 30 minutes, a sharp decline followed by a gradual ascent. Further investigation is warranted on the biological implication beneath those patterns.
Figure 1: Change pattern of the treatment difference between GLP-1 and MET over time. A. C- peptide: the differences reached their nadirs at the extreme time points and their peak at the middle time points. B. INS: the change patterns for INS were approximately identical for both sequences.
Conclusion
The crossover design is very popular for the study of new and developmental drugs. However the crossover design tends to be adopted for its sample size savings, but without regard to whether such a design is suitable for the research question Mills [11] . Furthermore, a naïve method of analysis (e.g. paired t-test) that ignores the complexity of the design is often chosen. Another misleading preference is to obtain separate treatment effect estimates for each sequence or for each period, which sometimes yields inconsistent messages and inconclusive results. Even with consistent estimates, there is nevertheless no overall estimate of the treatment effect. Badly, these results often contribute as preliminary evidence in the literatures. Given that GEE and mixed models, two major methods used to analyze the data from a longitudinal study, are complicated for a clinician, Hills-Arbitrage approach turned out as a handy tool to deal with a crossover study. This approach is essentially a pooled t-test, and thus can be easily implemented with the aid of any statistical software. When we applied the Hills-Arbitrage approach to a PCOS data, no statistically significant results came up. First, we emphasize that GLP-1 is compared with another active agent MET, right now we only can not find evidence to support that GLP-1 is superior to MET. That cannot exclude the possibility that both GLP-1 and MET might have equal beneficial effects on PCOS in the considered markers (i.e., glucose, INS, c-peptide) herein. Also, another experiments conducted by us showed (unpublished work) that GLP-1 did improve upon some biomarkers and clinical outcomes (e.g., pregnancy).
Second, the size of this study is small even though the sample size calculation at the planning stage of this study indicated 14 per group can provide a good enough power, which was based on a large predetermined difference between the GLP-1 and MET groups. Our results may have yielded different results if we had powered the study to detect a smaller, yet still clinically significant, treatment difference. In this study, we used the raw data and have them log- transformed. Let Y1, Y2, Y3, Y4 represent period 1 baseline, period 1 outcome, period 2 baselines, and period2 outcome, respectively. Some clinicians questioned that why not use the change from the baseline instead. As demonstrated by Senn [12] that unless there is a very long washout period, the estimator using the raw data (Y2, Y4) is more efficient than that using the change from the baseline (i.e., Y2– Y1 and Y4– Y3) . Let alone there is no baseline measures (i.e., Y3) at the second period (right after the washout) in this study. If as suggested by them, the changes from the first baseline measures were evaluated (i.e., Y2-Y1and Y4-Y1 the results for treatment and period effect tests will be the same as two Y1 are cancelled out each other. For the effect of including baseline measures on carryover test, the interested readers are referred to Freeman [11] for details. However, it is always good to incorporating the baseline measures as a covariate, as suggested by Fleiss [12-16]. The results of such analysis are not shown here because of approximate same results produced. Despite the absence of statistically significant results, this study, being the first study to explore the effects of direct administration of GLP-1 to PCOS patients, is nevertheless clinically meaningful. Not only does it show a washout period longer than 10 days is desired, but also it suggests GLP-1 may have positive effect on PCOS. Certainly, a larger study using a parallel design is warranted to evaluate the treatment effects of GLP-1 on PCOS thoroughly.
Flavanoids from Saraca asoca– Ideal Medication for Breast Cancer: A Molecular Simulation Approach
Abstract
Breast cancer is one of the major causes of mortality in women. The estrogen receptor becomes positive in such patients. Many of the currently available anti breast cancer drugs produces severe side effects. It demands natural products with low toxicity to fight against estrogen receptor. In this point, we tried to establish antiestrogen potential of some natural flavonoids from the bark of Saraca asoca. The vitality of these drugs is well described in terms of pharmacokinetic parameters and molecular orbital analysis. In the light of molecular simulation studies we reports a set of lead compounds having natural origin in the treatment of breast cancer.
Keywords: Breast cancer; Estrogen receptor; Flavanoids; Catechins; Saraca asoca
Introduction
Breast cancer is one of the most widely affected malignancies in women, with 2,52,710 new case reports and death of 40,610 in 2016 [1]. It is well known that breast cancer is associated with steroid hormone estrogen receptor (ER) and it becomes the best target for the development of therapeutics [2]. Tamoxifen is one of the commonly used antiestrogens in the treatment of breast cancer, which act as a selective estrogen receptor modulator (SERM) [3]. But it harmfully affects oncologic, musculoskeletal, metabolic, hepatic, cardiovascular and even nervous systems [4- 9]. Hence it is necessary to suggest natural medications which are of low toxicity than tamoxifen for the metastasis in breast cancer. Saraca asoca possess various medicinal values, its stem bark is the principal constituent of major ayurvedic preparations for leucorrhoea, haematuria, menorrhagia and other diseases of the female genitourinary system [10]. Saraca asoca was extensively interpreted for its anti platelet aggregation, cytotoxic, anti inflammatory anti acne and anti oxidant activities [11-15]. The dried bark extract of Ashoka mainly contains lignan glycosides and flavonoids [16]. The flavanoids includes catechin monomers such as catechin, epicatechin, epigallocatechin, leococyanidin, gallocatechin and leucopelargonidin [17]. The importance of three dominant polyphenolic catechins-epigallocatechin, epigallocatechin gallate and epicatechin gallate in breast cancer cell proliferation was reported in 2002 [18]. Ryoko et al. studied the simultaneous effect of tea catechins in anti estrogenic activity [19]. As part of our interst in the development natural anticancer therapeutics, we are concentrating to elaborate the ER inhibitory activities of monomeric catechins from Saraca asoca and defined it as an ideal medication for breast cancer based molecular simulation studies.
Methodology
The crystal structure of ER (PDB ID: 3OS8) was retrieved from RCSB Protein Data Bank [20]. The X-ray crystal structure has a resolution of 2.03Å and it contains 258 amino acids. It was cleaned and prepared for docking studies using Protein preparation wizard of Schrodinger suite 2017-2 [21]. The different conformers of the ligands-catechin(+) (1), catechin(-) (2), epicatechin(+) (3), epicatechin(-) (4), epigallocatechin(+) (5), epigallocatechin(-) (6), leucocyanidin(+) (7), gallocatechin(+) (8), gallocatechin(-) (9) and leucopelargonidin(+) (10) were prepared by ligprep and their absorption, distribution, metabolism, excretion and toxicity(ADME/T) were described by QikProp analysis. The prepared ligands were docked against the 3OS8 using Glide programme of Schrodinger suite and the compounds were screened based on D-score and G-score values.
Results and Discussion
The ten monomeric flavanoids selected were optimized at B3LYP/6-311++G**, the prepared ligands were docked against the grid generated around the highest scored site of 3OS8. From the binding scores, all of the ligands show excellent D-Score/G-score of less than -10.8kcal/mol, confirms the strong binding capacityof the ligands inside the active site of 3OS8 (Table 1). The scores are better than the values reported for flavanoids by Suganya [22]. The drug ability parameters such as #stars, CNS, FISA, HBA, HBD, QPlogPo/w, QPlogS and QPlogKhsa are well within the acceptable range with minimum deviation from Lipinski rule of five (Ro5). The low molecular weight of 290-306 range increases the cell permeability of the ligands with blood brain barrier permeability of -2. The predicted skin permeability and oral absorptions are also in the recommended range. Most of the clinically successful drugs in the market have had the tendency to inhibit hERG with QPlogHERG value less than -5, but our ligands are exception to this threat. The hydrophobic and π-components of solvent accessible surface areas are matched well with the site volume of 204.77Å3 of 3OS8. The globularity descriptor value of 0.86 shows the spherical character of the ligands which may facilitate the binding of them in the binding pocket (Table 1).
Table 1: D-score/G-score and pharmacokinetic parameters for 1-10.
M.W.(Molecular Weight):130.0-725.0; #stars (few stars-more drug-like): 0-5; CNS (Central Nervous System activity): -2 to +2; FISA (Hydrophilic component of total solvent accessable area): 7.0-333.0; HBA(Hydrogen bond acceptor): 2.0-20.0; HBD(hydrogen bond donor): 0.0-6.0; QPlogPo/w (octanol/water partition coefficient): -2.0-6.5; QPlogS (Aqueous solubility): -6.5-0.5; QPlogKhsa (binding to human serum albumin): -1.5-1.5; Ro5 (Number of violations of Lipinski’s rule of five): maximum is 4.
The close observation of interaction diagram Figure 1 shows that all of the ligands almost closely packed in the binding site which gives the appreciable values. All the ligands except 5 forms H-bond with negatively charged Glu353 while the eight ligands except 5 and 9 have H-bond with positively charged Arg394 and 5 forms only one bond with His524. The HOMO-LUMO diagrams Figure 2 depict the electronic transition from HOMO to LUMO by a distance of 5eV, which is favorable for interaction of terminal hydroxyl groups with the aminoacid residues. The electron density in the HOMOs are concentrated on the benzene ring on 1, 2, 5, 6, 7, 8 and 9 while it is on chromenyl moiety in the case of 4 and 10. The hydrogen of OH from the corresponding rings is in strong interaction with the negatively charged glutamic acid. At the same time the oxygen’s of OH have the tendency to interact with positively charged arginine. These interactions from hydroxyl groups cause the strong binding of the ligands inside the binding pocket (Figures 1 & 2).
Figure 1: Interaction diagrams of 7, 6 and 3.
Figure 2: HOMO-LUMO diagrams of 1-10.
Conclusion
We are able to suggest a set of lead molecules from the natural source, bark of Saraca asoca. The interaction diagram shows the strong interactions of hydroxyl groups with negatively charged glutamic acid and positively charged arginine, which favors the strong binding. The molecular orbital analysis clearly tells the delocalization of electron density in the benzenyl and chromenyl hydroxyl groups. The pharmacokinetic parameters strongly support the druggability of these ligands. This study is expected to pave the way of generating new chemotherapeutics in the treatment of metastasis in breast cancer with low toxic effects.
A Pedagogical Description of Channel Interference in Multiphoton Absorption Processes
Abstract
In this mini-review, the author discusses a different view of two-photon absorption and in general any multi-photon absorption process in a molecular system in a very didactic way. This novel point of view is termed as “channel interference”. It connects the overall absorption cross section with the orientation of different transition dipole moment vectors that come into existence when a molecule undergoes two- or multiphoton absorption process. Therefore, channel interference provides an in-depth view of the process which can be used to control and fine tune the multi-photon activity in a molecular system for designing an efficient material.
When light interacts with matter, the electric field ofthe incident light causes a distortion of the electron cloud in the molecule, which is measured in terms of polarization. A stronger electric field and loosely bound electron cloud give larger polarization than a weaker electric field and a tightly bound electron cloud. In most of the molecules, the said polarization can be expressed as a linear function of the electric field and hence the optical processes associated with this linear polarization are called linear optical processes. The normal UV-Vis or IR absorption falls into this category. Most of the molecules show this kind of absorption with UV-Vis or IR source of radiation. However, when LASER is used as incident light, polarization becomes a non-linear function of the corresponding electric field.
The optical processes associated with such non-linear polarization are called non-linear optical processes. Two-photon or multi-photon absorption and hyper-polarizabilities are the two examples of non-linear optical processes. In this mini-review, we’ll discuss the multi-photon absorption process with an emphasis on two-photon absorption (2PA) caused by a linearly polarized light.
Linear and non-linear absorptions
Pictorially, a linear absorption process can be shown as in Figure 1 where, S0 and Sf represent the initial and final states respectively. E0 and Ef are the corresponding energies of the states and hν is the energy of the incoming photon. If an incident light of low intensity is used, absorption will occur if and only if hν matches the energy gap (ω0f = |Ef– E0|) between the two states. If the system is centrosymmetric, then an additional requirement for an allowed transition is that the two involved states should have the different symmetry. For example, if the absorption is taking place from ground state (having gerade symmetry), in a centro-symmetric molecule, then the final excited state should have gerade symmetry [1] this is the case of linear absorption, also called one-photon absorption (1PA). This is measured in terms of oscillator strength (δ1p) which is directly proportional to the product of «0f and square of transition dipole moment (TDM) vector (μof) between initial and final states [2,3].
Figure 1: Pictorial representation of 1PA process.
In contrast to the linear absorption, non-linear absorptions are more complicated in mechanistic way and hence in their theoretical descriptions. A pictorial representation of first two non-linear optical absorption processes i.e. 2PA and three- photon absorption (3PA) are shown in Figure 2. MPA (M≥2) is defined as the simultaneous absorption of M-photons of same or different frequencies by a system resulting in a transition from one state to another via one or more intermediate states (Si, Sj). The intermediate states can be either a real or a virtual state [2]. The requirement of simultaneous absorption of more than one photon is the reason why one needs a high intensity light for achieving an MPA process. In order to have an idea about the complexity of the process, let us take the case of the simplest MPA process i.e. 2PA.
Figure 2: Pictorial representation of 2PA and 3PAprocesses.
The 2PA strength of a system is measured in terms of 2PA cross section, which depends upon the following quantities – two TDM vectors μoi and μif and energy gap between the states. Additionally, δ2p depends upon the dipole moment of the ground- and the excited-states. Thus, in 2PA the system first absorbs a photon hVj and reaches the intermediate virtual state Si (which has a negligibly small life time), but before relaxing back to the initial state S0, the system absorbs the second photon hv2 and reaches the final excited state Sf. For a successful 2PA to occur, both the TDMs i.e. μoi and μif should have large values and also the time-lag between the two photons should be smaller (that means high intensity) than the life-time of the intermediate state. The 3PA and other higher order multi-photon absorption processes require more photons to be absorbed simultaneously and hence are even more complicated and even more intense light is required for observing such processes. This is the reason why we do not encounter nonlinear optical absorptions in our daily life.
For 2PA, the requirement of high values of μoi and μif indicate that the 1PA for S0 → Si and Si → Sf should be allowed transitions i.e. in centrosymmetric molecules the states (S0 and Si) and (Si and Sf) should have different symmetries. This requirement is fulfilled if and only if S0 and Sf have same symmetry and Si have symmetry different from the other two states. Thus, a 2PA process, in a centrosymmetric molecule, is allowed between states of same symmetry. The TDM vectors are also called one-photon transition moments. Similar to this, we can also define two-photon, three- photon and other multi-photon transition moments. For 2PA, the corresponding transition moment is given as [4].
is the αth component of TDM between pth and qth states and The summation in Eq. 2 runs over all the electronic states of the system including ground state and αβ ϵ {X,Y, Z}. The 2PA cross section, δ2p for single beam of a linearly polarized light is related to transition moments, Ta by the following relation [5]
Origin of Channel Interference
So far, we have seen that both 1PA and 2PA depends upon the magnitudes of TDM vectors between the involved states. We have also seen that in case of 1PA, only one TDM is involved whereas, in case of 2PA (as in Eq. 2) and another multi-photon absorption processes several TDMs are involved. Since TDMs are vector quantities and hence these should contribute not only through their magnitudes but also through their orientations. Thus, δ2p should depend upon the relative orientations of different TDM involved in the process. This should also be the case for 3PA and other higher order multi-photon absorption processes. But the question is how can we separate the contributions coming from the magnitude and those coming from the relative orientations of the TDM vectors? The quantum chemistry codes like DALTON [7], GAMESS [8], TURBOMOLE [9], etc. uses quadratic response theory (details about this theory can be found somewhere else [10,11] for calculating Tαβ and δ2p .
Because of this approach, it is not possible to get the contribution from relative orientation of the TDM vectors as neither Eq. 2 nor Eq. 3 has any orientation related term. The orientation related terms or angles between TDM vectors appear when Eq. 2 is inserted into Eq. 3 and the terms are rearranged properly. This was first done by Cronstrand, Luo and Agren [12] in 2002 for 2PA process. However, their description was limited to two-dimensional cases that means when only two components of the TDM vectors contribute. In most of the molecules, all the three components of the TDM vectors have significant contributions, which require a general three-dimensional formula. This was done, again for 2PA only by Alam, Chattopadhyaya & Chakrabarti [13] in 2012. This is called generalized few-state model (GFSM), which reads as [13].
Where θrspq is the angle between two TDM vectors μpq and u”and other terms have their usual meanings. Eq. 5 has separated the contributions from the magnitude of the TDM vectors and those from their relative orientations. This formula, thus, can be used for studying the effect of orientation of different TDM vectors on δ2p .
Some General Characteristics of Equation 5
It is interesting to discuss the characteristics of the generalized formula i.e. Eq. 5, because it can give important information regarding the symmetry in the process and it can also help to answer, whether such generalization is possible for other higher order MPA processes. It is interesting to note that Eq. 5 represents the overall δ2p as a summation of interference between two channels S0 → Si → Sf and S0 → Sj → Sf One can easily divide Eq. 5 into four contributions – (A) the pre-factor , (B) magnitudes of TDM vectors (numerator in the summation), (C) energy term (denominator in the summation) and (D) the orientation term (term in curly braces). Here, a brief discussion about different contributions is given.
A more comprehensive and full discussion can be found in [14]. Contribution (A) is same for all the molecules. Contribution (B) depends upon the magnitudes of a maximum of four TDMs (when i, j, and f represent different states). For a large value of , the corresponding TDMs should have large values for each state involved (i, j) in the summation. Note that, for 2PA, contribution (B) contains a maximum of four ^ terms. The third contribution i.e. (C) should have small value for a large value of δ2p
This means, if the two incident photons have same frequency, then Ei and E. should be larger than Ef/2 i.e. the two states should lie above the mid-point between the initial and final states. Finally, contribution (D) has all cosine terms in it, each of which has a maximum value of+1. So, for a larger δ2p, contribution (D) should be larger and close to its maximum value of +3. Note that there are altogether six cosine terms, which indicates that it includes orientation of each TDM vector relative to each of the others. The above partitioning scheme was further explored by Alam, Beerepoot and Ruud and using this, very recently, they came up with another generalization that can now be applied to any multiphoton absorption process.
Factors Affecting Channel Interference
Alam and co-workers have extensively studied [15-18] channel interference in several different kinds of molecules including both through-bond and through-space charge transfer molecules. They have shown that in general, channel interference is affected by donor-acceptor strength in the molecule, type of substitutions and their position in the molecule, polarity of the solvent, orientation of one part of the molecule relative to the other part etc. They have also studied the relative effect of donor and acceptors and concluded that donors may contribute more than acceptors [19].
Future Prospects
Channel interference is an interesting phenomenon that can be used to fine tune the two-photon activity in a molecule. Although several factors affecting channel interference has been studied, but still these studies are limited to specific systems. The phenomenon of channel interference in different types of molecules in various different solvents can provide interesting results, which can help to provide an effective design strategy for controlling channel interference. One of the main questions still unanswered about the channel interference is that how to visualize the different transition dipole moments in a molecule. For example, the ground and excited state dipole moment can be plotted in the molecular framework but how can one plot the TDM vectors between excited states? Answer to this question may help to visualize the channel interference in a real molecular framework.
The broad ligament is a peritoneal fold that attaches the uterus, fallopian tubes, and ovaries to the pelvis. Disorders of the broad ligament are rare. Tumors of the broad ligaments are even rare. The most common solid tumor of the broad ligament is a leiomyoma. This case report is unique in world literature as first case has been documented till date.
Aim
This study was done to estimate the incidence of broad ligament tumors in our institute.
Case
A 19 year nullify porous presented in pod with abdominal mass for the last 4 months with irregular cycles .She had history of abortion 2 months back for which she underwent D&C .Per vaginal findings revealed normal anteverted uterus with large 10 by 8 cm mass in right annex non tender. Her menstrual cycles were regular with 5 days flow(LMP 8 days back). On abdominal examination 14 weeks size non tender mass with variegated texture was seen in right iliac fosse. Ultrasound findings revealed left ovarian dermoid cyst. Her biochemical parameters were normal. Tumor antigen study CA125 was<5.She was taken for explolatory laparotomy which revealed multiloculated cystic mass arising from left broad ligament10 by 7.5 by 6cm adherent to sigmoid colon, uterus and urinary bladder. Bilateral ovaries with tubes were normal. Excision of broad ligament mass was done in toot. Abdomen was closed in layers over suction drain. Postoperative period was uneventful [1- 3].
Conclusion
Tumors of the broad ligaments are rare. Gynecologists should be aware of the possibility of retroperitoneal broad ligament teratomatous tumors.
Medicinal properties of the plants are attributed due to presence of various flavonoids. Flavone is one class of flavonoids which attracted the attention of researchers worldwide. These ‘yellow’ colored compounds have 2-phenylchromen-4-one backbone structure. Flavones contribute to various medicinal properties like anti diabetic [1], anti-inflammatory [2], anti-oxidant [3] and anti-cancer [4]. In some basic methods of synthesis of flavones aldehydes react with hydroxyl aceto phenones under claisensmith condensation. In this review we have tried to summarize the various methods of synthesis of flavones.
Allan-Robinson Strategy of synthesis flavones from chalcone
Allan J and Robinson R [5] carried out the reaction of o-hydroxyaryl ketones with aromatic anhydrides which results in the formation of flavones and isoflavones shown in (Figure 1).
Figure 1: Synthesis of flavoves by Allan Robinson reaction. O-benzoyloxyacetophenone is heated with glycerol at 2600 C for two hrs which leads to the formation of flvone.
a) Synthesis of flavones using O-benzoyloxyacetophenone
i. Method 1: T S Wheeler [6] carried out synthesis of flavones via two step synthesis method. In first step O-benzoyloxy aceto phenone was synthesized from reaction of O-hydroxy aceto phenone with benzoyl chloride in the presence of pyridine. In the second step O-benzoyloxy aceto phenone is heated with glycerol at 2600 C for two hrs which leads to the formation of flvone. The reaction is shown as (Figure 2).
Figure 2: Synthesis of flavones using O-benzoyloxyacetophenone.
ii. Method 2: In the second method7 first step is same as shown in method 1. Then in the second step O-benzoyloxyacetophenone was converted into di ketone using KOH and pyridine. Then diketone is refluxed with glacial acetic acid and sulphuric acid for 1 hr to obtain the final product as shown in (Figure 3).
Figure 3: Synthesis of flavones using diketone.
b) Synthesis of flavones involving cyclization via displacement of aromatic chlorine
In this method [8] O-chloro phenyl benzoyl acetylene in the presence of morpholine was refluxed for 10 hrs which ends up with the flavone as final product via removal of morpholine hydrochloride. The reaction mechanism is shown as (Figures 4 & 5).
Figure 4: Synthesis of flavones involving cyclization via displacement of aromatic chlorine.
Figure 5: Synthesis of flavones using ium chloropalladite or palladium (II) acetate catalysed reaction.
i. Lithium chloropalladite or palladium (II) acetate catalysed reaction: Initially benzene was stirred with sodium methoxide and then refluxed with Lithium chloropalladite or palladium (II) acetate and at the end reaction results in the formation of flavones [9].
ii. Using LiHDMs and acid catalysed cyclization reaction of O –hydroxyacetophenone: Reaction of O-hydroxyacetophenone with benzoyl chloride under acidic condition using LiHDMs leads to the formation of flavones in addition to the side product [10]. Reaction is shown in (Figure 6).
Figure 6: Synthesis of flavones using LiHDMs acid catalysed cyclization reaction of O –hydroxyacetophenone.
iii. Wells-Dawson method of synthesis of flavones using Heteropoly acid (HPA): In this method [11] synthesis was carried out using substituted 1,3 diketones dissolved in toluene or solvent free environment. Recation mixture was refluxed for 5hrs. at room temperature without catalyst (WD40/SiO2) no product was identified on TLC plate whereas use of just 1% mmol of HPA push the reaction in forward direction as shown in (Figure 7).
Figure 7: Wells-Dawson method of synthesis of flavones.
iv. From idophenol with alkynes in the presence of pladinum catalyst: Reaction of substituted idophenols with alkynes in the presence of carbon monoxide and pladinum catalyst yielded the flavones [12] as shown in (Figure 8).
Figure 8: Synthesis of flavones from idophenols and alkynes.
c) Synthesis of flavones from idophenols and alkynes
i. Iodine-alminium trioxide (I2/Al2O3) microwave assisted synthesis of flavones: In this method substituted O-hydroxyacetophenones was irradiated in microwave with carboxaldehyde in the presence of I2-Al2O3/NaOH [13]. Reaction mechanism is shown in (Figure 8).
ii. From the replacement of alkene hydrogen of 4H-chromen- 4-one: Reduction of 4H-chromen-4-one in presence of 2,2,6,6-Tetramethylpiperidine (TMP),Zn/ MgCl and THF gives the flavones as final product [14].
A Review on the Reproduction and Development in Fish
Review
In order that survival of young be more than optimum, the timing of spawning by the mature adult fish is so adjusted that must be closely linked to the availability of maximum congenial environment added by increased food availability of food for the newly hatched young ones. The availability of food for the larvae and juveniles of most temperate and cold water fish species varies on a seasonal basis and following this fish are usually found to have a discrete and selective spawning season so perfectly timed that hatched out larvae will get readily available exogenous food from nature for their further development. Thus, in many temperate and cold water species, spawning is an annual event. Spawning culminates a series of preparatory events during which the gametes develop and the gonads increase in size. The annual cycle of fishesgenerally categorized into three major phases:
A. Post Spawning phase: Period when the gonads are thin and slender and appear to be in a resting phase.
B. Pre Spawning phase: Period in which the gonads begin production of gametes (gameto genesis) and incorporation of yolk into the oocytes (vitello genesis) which is accompanied by a process known as gonadal recrudescence i.e. gradual increase in gonad size.
C. Spawning phase: Period involving final maturation and ripening of the gametes; this phase culminates in spawning act, with the release of egg and milt which ensures fertilization.
Thus, gonadal development is considered to encompasses a series of interrelated phases, each requiring precise coordination and control if viable gametes are to be produced at the optimum time of the year for the subsequent survival of the young fish. The production of gametes involves the manufacture and incorporation of yolk into the developing oocytes (vitello genesis). During the early part of gonadal development, the oogonia, through the process of oogenesis produce mature eggs. Primarily, under the influence of GTHI, primary oogonium forms several primary follicles which ultimately develop into mature graffian follicle. It is within this graffwian follicle eggs mature and get associated with vitallogenin protein from liver known as yolk granule, acts as a readymade food for the growing embryo during development of larvae. Supported by this endogenous food gamete grow in size during post vitallogenic phase of development alin particular. In the salmonids, for example, the oocytes increase in diameter from about 50μm to 500-1000μm prior to the start of vitellogenesis. The incorporation of yolk that occurs during the vitellogenic phase leads to the diameter of the oocyte increasing to around 5000μm (5mm). Thus, there is an enormous increase in oocyte volume during post vitellogenic phase.
This observation supports the view that in majority of fishesthe gametic development is dependent on endogenous hormone and the nutrient protein from liver and its subsequent incorporation into egg cytoplasm. The yolk is derived from vitellogenin, a lipophosphorotein- calcium complex with a molecular weight of approximately 440, 000. Vitellogenin is synthesized in the liver and is then released into the blood system. The vitellogenin is then transported to the ovary through hepatic portal blood vessel from which it is sequestered by the oocyte. Following uptake into the oocyte the vitellogenin splits into two major components each having a molecular weight of 35 000, which form the yolk stores. The processes of gametic development and gonadal growth usually occur gradually and the prespawning phase of the cycle often continues for a considerable period of time, perhaps several months, before the actual spawning occurs. These indicate that the fish can ‘predict’ the arrival of spawning time several months in advance.
Environmental Influences on the Reproductive Cycle
In general, growth and development of gamete depends on different environmental cues in nature. The primary environmental cues are often linked to the annual cycles of day length and temperature variationsm Chattopadhyay et al. [1]. For example, in case of Cyprinus carpio and many other cyprinids, gonadal maturation begins in late winter after the vernal equinox (21st March) when day length is in increasing manner and as a result water temperature is also in increasing trend. But in summer when temperature is high, cessation of spawning activity may occur due to inhibitory effects of high water temperature. Thus, it is thought that both photoperiod and temperature are major environmental cues responsible for the mediation of the reproductive cycle inseveral species of fish that inhabit temperate latitudes Devlin RH, Nagahama Y [2]. In temperate area salmon generally breed at temperature range of 8-10 oC i.e. during late autumn and early winter, but during autumn and winter when temperature of river water fal1.sto 1-2 oC, inhibition of oocyte growth and development may occur. In contrast to this fish are maintained under experimental condition of constant photoperiod (e.g. 12L: 12D -12h light and 12h dark each day) and temperature) the fish may still spawn at approximately yearly intervals. This means there is a strong autonomous component to the reproductive cycle, and under conditions this endogenous rhythm will have a periodicity of about 1 year.
In constant environment condition, fishes may spawn at intervals that are approximately but are significantly different from 1 year. Thus the periodicity of the rhythm is only approximately 1 year, i.e. it is circannual. As a result, many fish species rely on the seasonally changing cycle of day length to match their annual cycles of reproduction and these cyclic events will be mediated through a number of endocrine changes. Consequently, it is ultimately the neuro-endocrine system which directly controls the different phases of general development and the maturation of gametes. The general environmental cues that triggers maturation, gametice growth and development appears to be primarily environmental in nature followed subsequent endogenous rhythm. These environmental cues are often linked to the annual cycles of day length and temperature variations. For example, for in summer-spawning fish such as carp, Cyprinus carpio, and many other cyprinids, gonadal maturation begins in late winter or early spring. The start of the maturation process is thought to be triggered by a combination of increasing day length and the rise in water temperature with the commencement of spring. The extended spawning season, with a startup season in March–April continues up to the end of August through scientific management practice. Some authors are of the idea opinion that in certain fishes’ cessation of spawning activity may, in part, be due to inhibitory effects of high summer water temperatures on gonadal differentiation and maturation. For tropical fishes’ gonadal development and spawning stops with the fall of temperature that happen with the approach of winter. This provides a direct evidence that temperature along with photoperiod is the main controlling factor towards maturation and spawning in fish. S.
Again, some species such as the Tobinumeri dragonet and Repomucenusbeniteguri, resume spawning activities as water temperature falls during the course of autumn. These fish exhibit two distinct spawning seasons (May-July and September- November) during the course of the year. Spawning commences in spring when the water temperature reaches 18° C, but the spring spawning season comes to an end once temperature exceeds 28° C. Spawning that resumes in September when water temperature falls below 27 °C, and the autumn spawning season continues as long as temperature stays above 15 °C. Thus, gonadal development and maturation appear to be inhibited by temperatures lower than about 15 °C and higher than 27-28 °C. This suggests that water temperature is probably the major environmental cue for both inhibition and termination of the spawning seasons in the Tobinumeri dragonet. In the tropics changes in photoperiod and water temperature occurs after the vernal equinox that falls on 21st March every year. Gonadal recrudescence starts after this period for most of the fishes. Though these two environmental factors are unlikely to act as major cues for influencing the reproductive cycle in some fishes like tilapia and Cyprinus carpio. In some tropical species there does not appear to be any distinct spawning season and some members of the population can be found to be engaged in reproductive activities at almost any time of the year. In other species, spawning activities do seem to vary on a seasonal basis, with factors such as variations in rainfall and humidity possibly acting as the environmental cues triggering changes in gonadal development and maturation.
Endocrine Regulation of Fish Gonad Development
The development and maturation of fish gonads are controlled by genetic and environmental factors, and regulated by a molecular network of signals. As in other vertebrates, the HPG axis of the neuroendocrine system plays a central regulatory role on the reproductive development of fishes. Gonadotropin-releasing hormone (GnRH), lying upstream of the HPG axis, is a key regulatory factor. Once hypo- thalamus-secreted GnRH arrives at the pituitary gland, the cAMP signal pathway in gonadotrophs will be activated, transcription, synthesis and secreting of FSH and LH are all upregulated. Via blood circulation, FSH and LH enter the gonads to regulate gonad development and to promote sexual maturation by stimulating production of sex steroids. On the other hand, sex steroids can inhibit synthesis of GnRH in the hypothalamus through a negative feedback pathway. In recent years, the discoveries of kisspeptin, which can positively regulate GnRH, and GnIH, which can negatively regulate GnRH, have been praised as two remarkable breakthroughs in vertebrate neuro endocrinology Zohar Y [3]. They have become attractive topics in fish reproduction and physiological research.
Kisspeptin is a neuropeptide encoded by the kiss gene and act in conjugation with GPR54 as the receptor. The first research about kiss function was carried out in hypogonadism De Roux N [4]. The patients had delayed pubertal maturation and reproductive function due to a mutation in the gene encoding GPR54. Subsequent studies in mice, rats and monkeys further confirmed the functions of kiss peptin and GPR54 in reproductive development. Currently kiss peptin is thought to play a significant role on sexual differentiation of the brain, the initiation of puberty, secretion and release of GnRH, transmission of feedback signals of sex steroids and control of reproductive function by a photoperiodic factor Tena-Sempere M [5]. Currently, functional research of Kiss peptin and GPR54 in fish reproduction is developing rapidly. Parhar [6] found mRNA of GPR54 in GnRH neurons of tilapia, which suggested a direct effect of kisspeptin on GnRH neurons. Kitahashi [7] cloned and expressed the Kiss2 gene of zebrafish and medaka. Via intraperitoneal administration and real-time PCR, they observed a more important role of kiss2 than kiss1 in regulating zebra fish sex steroid synthesis. Li S [8] observed elevated levels of LH in goldfish serum after intraperitoneal administration of mature kisspeptinpeptides. However, Pasquier [9] confirmed an inhibitory effect of kisspeptin on LH levels of the eel, Anguilla anguilla. It is worth noting that two or three types of GnRH usually coexist in one fish species, and that two types of kisspeptin and GPR54, respectively, are also found. Thus, the relationship between the kisspeptin/ GPR54 signal system and GnRH, as well as regulatory mechanisms on reproduction, might differ between fishes and mammals.
GnIH (gonadotropin-inhibitory hormone) was first found in birds by Japanese scientists in 2000. Subsequent studies showed that GnIH might regulate reproduction of birds and mammals on every level of the HPG axis. It can inhibit synthesis and release of LH and FSH, induce apoptosis of testis cells, and might have a regulatory effect on the production of sex steroids as well as on the differentiation and maturation of germ cells by the way of autocrine or paracrine mechanisms Tsutsui K [10]. The functional study of GnIH in fishes has just started, and there are still many inconsistent findings. For instance, Zhang [11] detected lower levels of LH in the serum of mature female goldfish after intraperitoneal administration of zebra fish GnIH peptides, which demonstrated that GnIH could negatively regulate release of LH in goldfish. On the contrary, the results from intraperitoneal administration of GnIH to goldfish at developmental stages from early to late gonad recrudescence showed that GnIH increased pituitary LH-β and FSH-β mRNA levels as well as reduced serum LH and pituitary GnIH-R mRNA levels Moussavi M et al. [12] It has been suggested that GnIH has a seasonal effect on LH and FSH. This could change our understanding of the regulation of fish re- productive axis. It would also help us to study the function of GnIH in fish reproduction and explore new factors negatively regulating GnIH.
There are also types of molecules that can indirectly regulate fish reproductive development by affecting the HPGaxis. For example, in many teleosts the release of GtH can be inhibited by dopamine (DA) Trudeau VL [12], or be accelerated by γ-aminobutyric acid (GABA) Popesku JT [13], and secretion of GtH can be stimulated by neuropeptide Y (NPY) Zhang Y [11]. In our group, suppression subtractive hybridization (SSH) and cDNA microarray were applied to sterile females of the common carp with abnormal gonads and to wild type common carp Xu J [14-16]. We found more than 200 genes expressed differently at the hypothalamus, pituitary or gonad level, which included 87 unknown genes, whereas the other genes were associated with growth, organogenesis, energy metabolization, immune response, signal transduction and cell apoptosis. The results showed a very complex molecular network regulating fish reproductive development.
Fertilization and Post-Embryonic Development
Following fertilization, zygote undergoes meroblastic cleavage to form a ball of cells called morula, which subsequently transformed into blastula (Figures 1 & 2). The blastula, consists of a central dorsal blastodisc above the yolk sac, through continuous division forms three layer above the yolk – indicate the initiation gastrulation or cell movement. The dorsal layers, which contribute to the formation of embryo proper, by way of differentiation form a dorsal epiblast and ventral hypoblast. Below the hypoblast, a layer composed of loosely packed cell mass remains covering the yolk, called periblast. Gastrulation in bony fishes is accomplished by two processes; invagination and epiboly.At the beginning of gastrulation, the presumptive endodermal and mesodermal cells at the posterior and posterolateral end of the blastoderm turn inwards and migrate forwards under the blastoderm, so as to form the hypoblast. However, there is no in pushing of the epithelial layer and no true archenteron is formed. The presumptive endodermal cells lying along the posterior margin of the blastoderm, migrate inward along the surface of the yolk.
Figure 1: Water hardened eggs with developing eggs within.
Figure 2: Water hardened eggs with developing eggs within.
As these cells move inwards, they tend to be concentrated towards the middle of the blastoderm. The presumptive mesoderm cells also invaginate in a similar way and roll over the edge of the blastoderm. Although no true archenteron is formed, the edge of the blastoderm may be compared with the dorsal lip of the blastopore of amphibians. The mesodermal cells, after invagination, also converge towards the middle line, where the axial organs of the embryo are formed. Next, the precordial plates as well as the notochord cells also move inwards by rolling over along the posterior edge of the blastoderm, which corresponds with the dorsal lip of the blastopore. Notochord, prechordal plate and mesoderm are continuous with each other end, form the chord mesoderm. Initially, this involuted cell mass is called the hypoblast. The presumptive neural plate is now started stretching towards the posterior edge of the blastoderm and comes to occupy the areas vacated by the cells that have migrated to the inside. The presumptive neural cells also tend to be concentrated towards the midline and form a strip of tissue lying above the notochord and extend forward to from the posterior edge of the blastoderm. A peculiar feature in the development of fishes is that the formation of the primary organ rudiments begins in the anterior part of the embryo, long before the invagination is completed in the posteriorpart. The anterior part of the neural plate, corresponding to the forebrain appears first, and is followed by the mid brain region. The notochord gradually separated from the mesoderm, which becomes thickened due to concentration towards the midline, and is segmented into somite’s lying on either side of the notochord. The rest of the mesoderm remains un segmented and is called the lateral plate mesoderm. The endoderm also becomes separated from the mesoderm and endodermal plate in the middle line. This later forms the alimentary canals.
The process of neurolation in fishes is not like that of the amphibians. The neural plate does not roll into a tube but narrows gradually and sinks deeper into the underlying tissue. It then separates from epidermis, which grows over it and becomes continuous to form the dorsal surface of the embryo. The neural cavity is not formed by rolling over of the neural plate, but it appears later in the brain and the spinal cord by separation of cells in their middle region. During the process of involution, the cells of the blastoderm continue to grow over the yolk through the process of epiboly. During this, the presumptive ectoderm cells grow over and cover the yolk mass from outside, forming a layer of cells called epiblast. At the same time the periblast also grows and forms an inner covering of the yolk. The periblast and epiblast enclose the yolk in a yolk sac. Gastrulation is completed with the formation of yolk sac. At this stagethe the embryo proper can easily be distinguished from yolk sac.
Hatching and Post-Embryonic Development
After the completion of gastrulation, various organs of the body are formed resulting in a small embryo with more or less cylindrical and bilaterally symmetrical body. The body is raised up from the surface of the yolk, so that the embryo proper becomes distinct from the yolk sac. In this condition, the head of the embryo projects anteriorly from the yolk sac, the trunks lie over the yolk and the tail projects behind. The broad connection between the body and the yolk sac becomes constricted so as to form a stalk. Blood vessels develop in the wall of the yolk sac. Yolk is digested by the periblast and supplied to the body through blood vessels. The yolk sac gradually reduced in size and the embryo grows indicating the supply of nutrients to the growing embryo. Finally, on hatching a free swimming larva comes out. During this period of development, various organs of the body are formed from the ectoderm, mesoderm and endoderm. The ectoderm gives rise to the epidermis and its derivatives like the enamel of the teeth, olfactory epithelium, lens of the eye and the inner ear.
The neural plate which is also ectodermal in origin and gives rise to the brain, spinal cord, retina etc.The mesoderm divides into three parts- dorsal epimere, middle mesomere and ventral hypomere. The dorsal epimere becomes divided into smites at a very early stage. Each somite is subdivided into three parts- sclerotone, myotome and dermatome. The sclerotome collects round the notochord to form the vertebral column. The myotome gives rise to the muscles of the trunk, appendicular skeleton, appendages and their muscles. The dermatome gives rise to the connective tissue and muscles of the dermis and its derivatives i.e., scales. The middle part of the mesoderm (mesomere) gives rise to the kidneys, gonads and their ducts. The hypomere splits into somatic and splanchnic layers of the mesoderm and enclose the coelomic cavity. The splanchnic layers form the mesenchyme which forms the involuntary muscles and connective tissue of the gut. Heart and blood vessels also develop from the splanchnic mesoderm. Skeleton and musculature of the head, outer layers of the eye and the dentine of the teeth develop from the mesenchyme of the head region.
Larval Development
Young stages of fish, from hatchling stage to till they attain maturity are known as larvae or fry. The larval development period varies considerably in different fishes. A fish fry with a yolk sac (Figure 3) is known as the ‘sac fry’ but when the sac disappeared is known as ‘advanced fry. In some species the advanced fry closely resembles adult and develop into adult without any larval stage. This is called direct development and is seen in salmon, trout and many catfishes. On the other hand, an indirect development through larval stages takes place in several families of fishes like the Clupeidae, Cyprinidae, Lophiidae, Anguillidae, Scorpaenidae etc. In these fishes the larvae (fry) undergoes metamorphosis during which the larval characters are lost and the adult features appear. Through this development the larvae attain a miniature adult like appearance called ‘fingerling’. This enters into an active feeding stage which results in maturation of gonads to give rise to the adult. The females are usually larger in size than the males but the latter attain early sexual maturity.
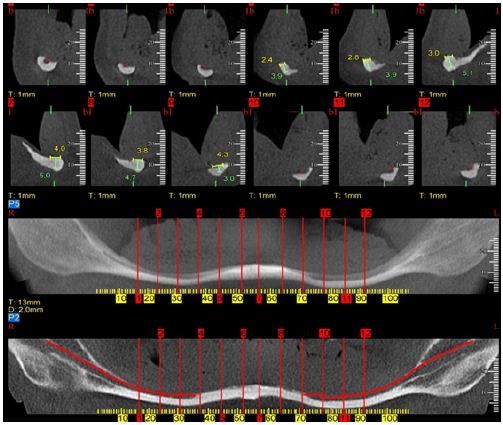


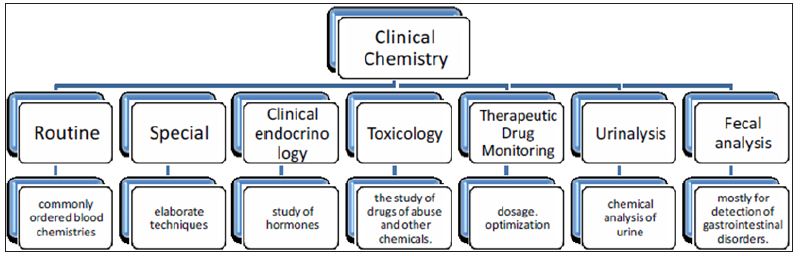
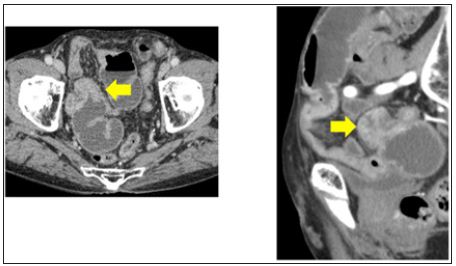
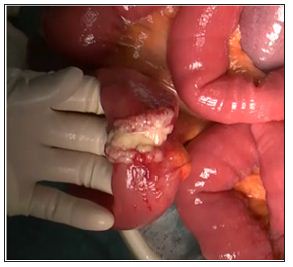
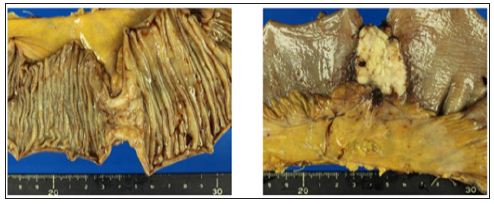
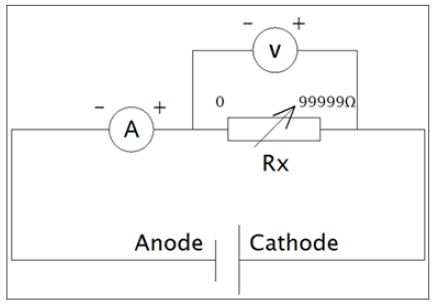
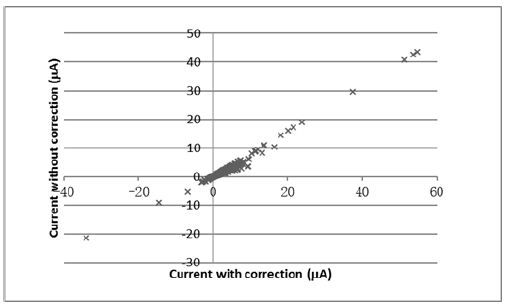


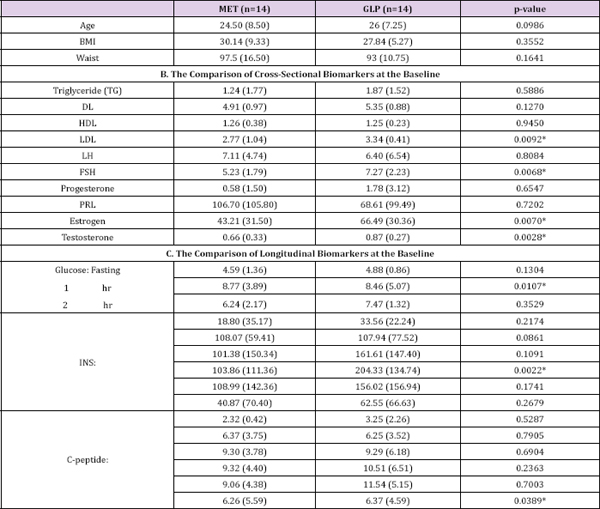

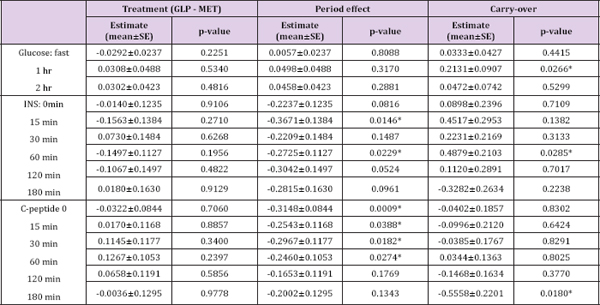

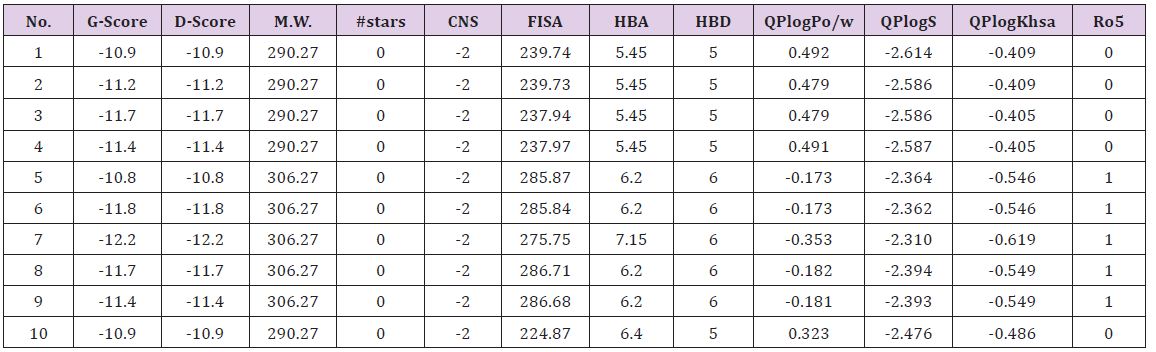
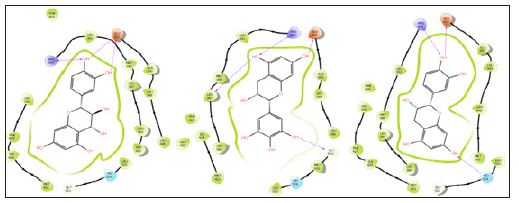
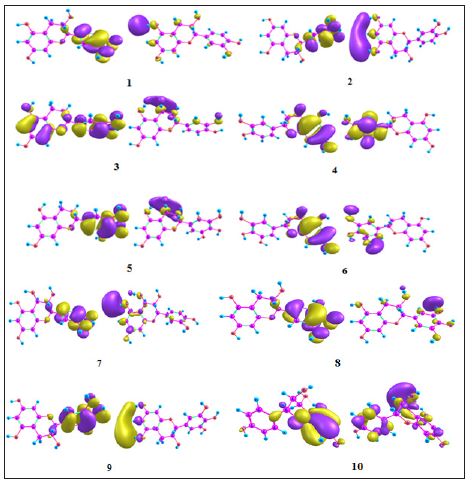


 The summation in Eq. 2 runs over all the electronic states of the system including ground state and αβ ϵ {X,Y, Z}. The 2PA cross section, δ2p for single beam of a linearly polarized light is related to transition moments, Ta by the following relation [5]